Embed Size (px)
Citation preview

7/25/2019 Load Pull Pres
http://slidepdf.com/reader/full/load-pull-pres 1/41
Load Pull Simulation Using ADSAndy Howard
Applications Engineer
28 May, 2002

7/25/2019 Load Pull Pres
http://slidepdf.com/reader/full/load-pull-pres 2/41
Page
Outline
2
• Overview
• Specifyingand generatingdesired load reflection coefficients
• Assigningarbitrary reflection coefficients atthe harmonic freqs.
• iasing the deviceand runninga simulation
• !alculating desiredresponses "deliveredpower#PA$# etc.%
• &enerating contourlines
Load Pull
Simulation
Using ADS20 May, 2002

7/25/2019 Load Pull Pres
http://slidepdf.com/reader/full/load-pull-pres 3/41
Page
Load pull simulation varies the load reflectioncoefficient presented to a device...
3
Vary load
reflectioncoefficient
Load Pull
Simulation
Using ADS20 May, 2002

7/25/2019 Load Pull Pres
http://slidepdf.com/reader/full/load-pull-pres 4/41
Page
'to find the optimal value to ma(imi)e power orPA$# etc.
4
Load Pull
Simulation
Using ADS20 May, 2002

7/25/2019 Load Pull Pres
http://slidepdf.com/reader/full/load-pull-pres 5/41
Page
Specify the load reflection coefficients
5
Simulation set up iscomplicated, but
region is sampled
more uniformly
Simulation set up
is trivial
Load Pull
Simulation
Using ADS20 May, 2002

7/25/2019 Load Pull Pres
http://slidepdf.com/reader/full/load-pull-pres 6/41
Page
Sweeping rho over a circular region
6
Specify circular region, via s11_rho and s11_centervariables
This is just a
static figure. It
does not get updatednor correspond
to the values in the
equations.
adius of circle
!enter of circle
Load Pull
Simulation
Using ADS20 May, 2002

7/25/2019 Load Pull Pres
http://slidepdf.com/reader/full/load-pull-pres 7/41
Page
Use *eflection!oefUtility data display to helpset s++,center and s++,rho
7
The circle center and
radius are updated "hen
you move either or bothof the mar#ers
Load Pull
Simulation
Using ADS20 May, 2002
7/25/2019 Load Pull Pres
http://slidepdf.com/reader/full/load-pull-pres 8/41
Page
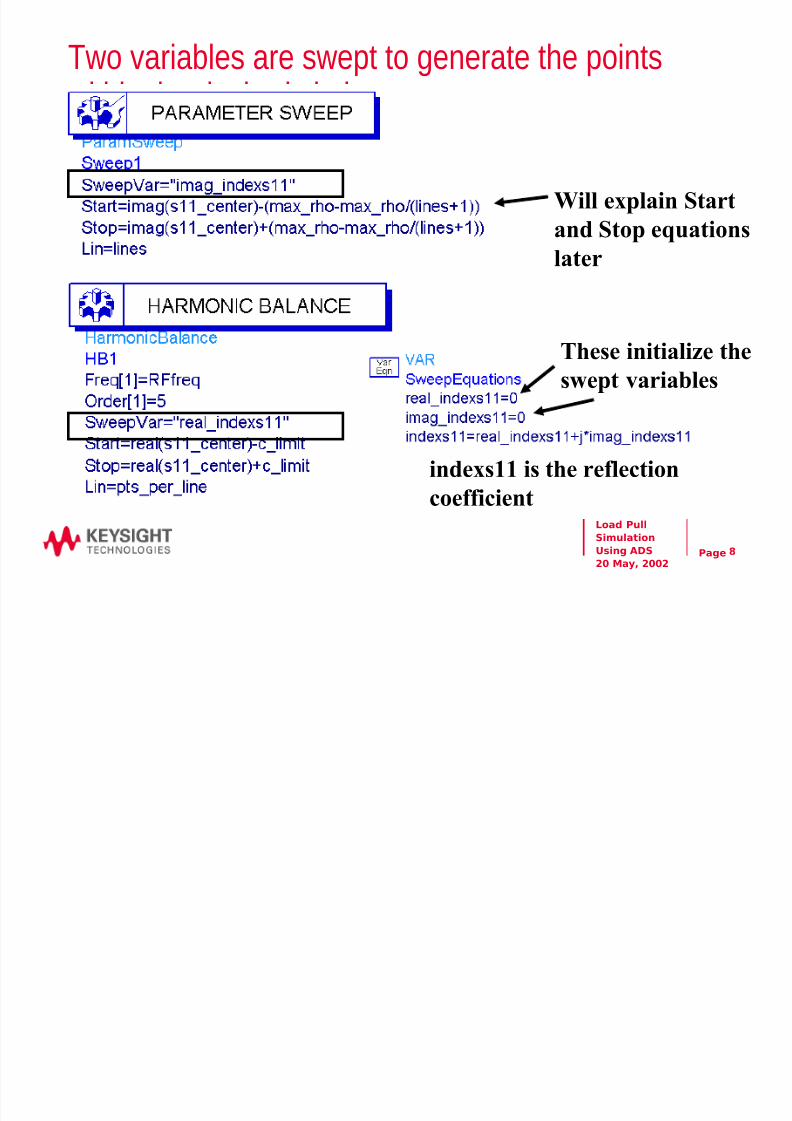
-wo variables are swept to generate the points within the desired circle
8
These initiali$e the
s"ept variables
inde%s11 is the reflection
coefficient
&ill e%plain Start
and Stop equations
later
Load Pull
Simulation
Using ADS20 May, 2002

7/25/2019 Load Pull Pres
http://slidepdf.com/reader/full/load-pull-pres 9/41
Page
ore on the swept variables
9
Variable 'imag_inde%s11( is
the y)a%is value of simulated
reflection coefficient.
Variable 'real_inde%s11( is
the %)a%is value. The
imag_inde%s11 variable is
stepped uniformly, "hereas
real_inde%s11 is stepped
non)uniformly.
*ach point is a data pair+
real_inde%s11, imag_inde%s11-
m is at appro%imately+ )/.0/, /.2-
Load Pull
Simulation
Using ADS20 May, 2002
7/25/2019 Load Pull Pres
http://slidepdf.com/reader/full/load-pull-pres 10/41
Page
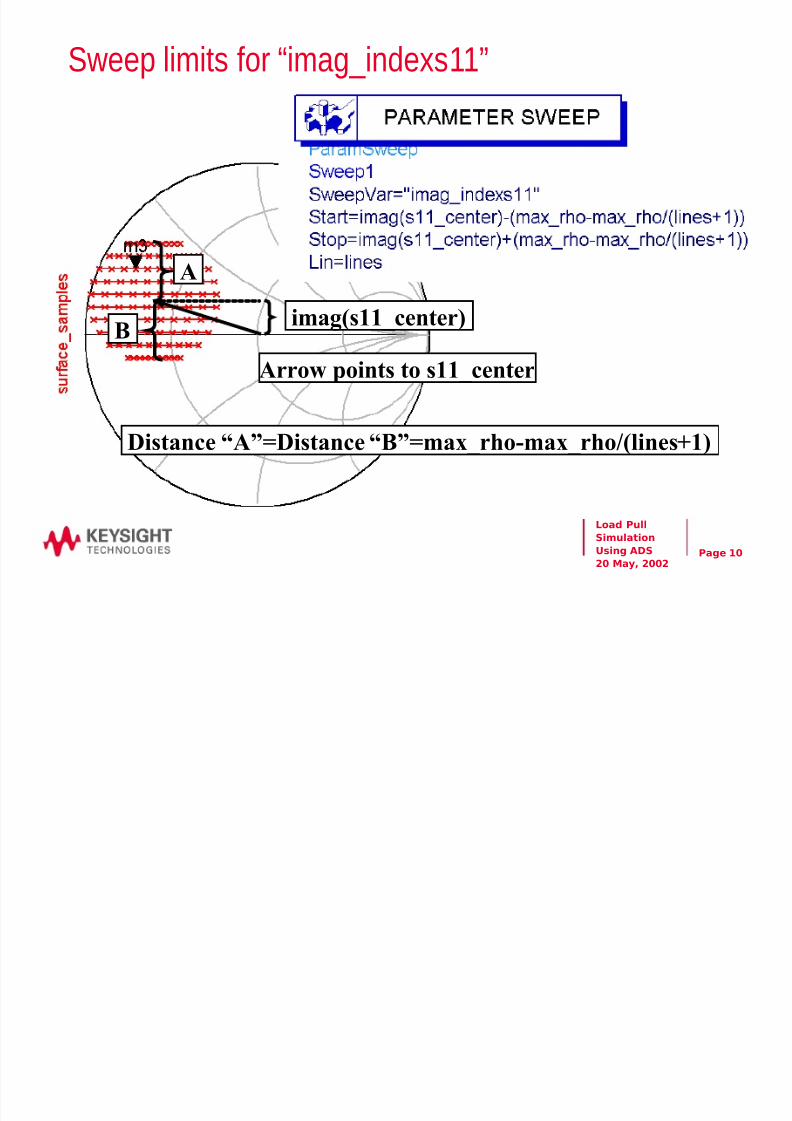
Sweep limits for /imag,inde(s++0
0
3rro" points to s11_center
imags11_center-
3
4
5istance '3(65istance '4(6ma%_rho)ma%_rho7lines81-
Load Pull
Simulation
Using ADS20 May, 2002
7/25/2019 Load Pull Pres
http://slidepdf.com/reader/full/load-pull-pres 11/41
Page
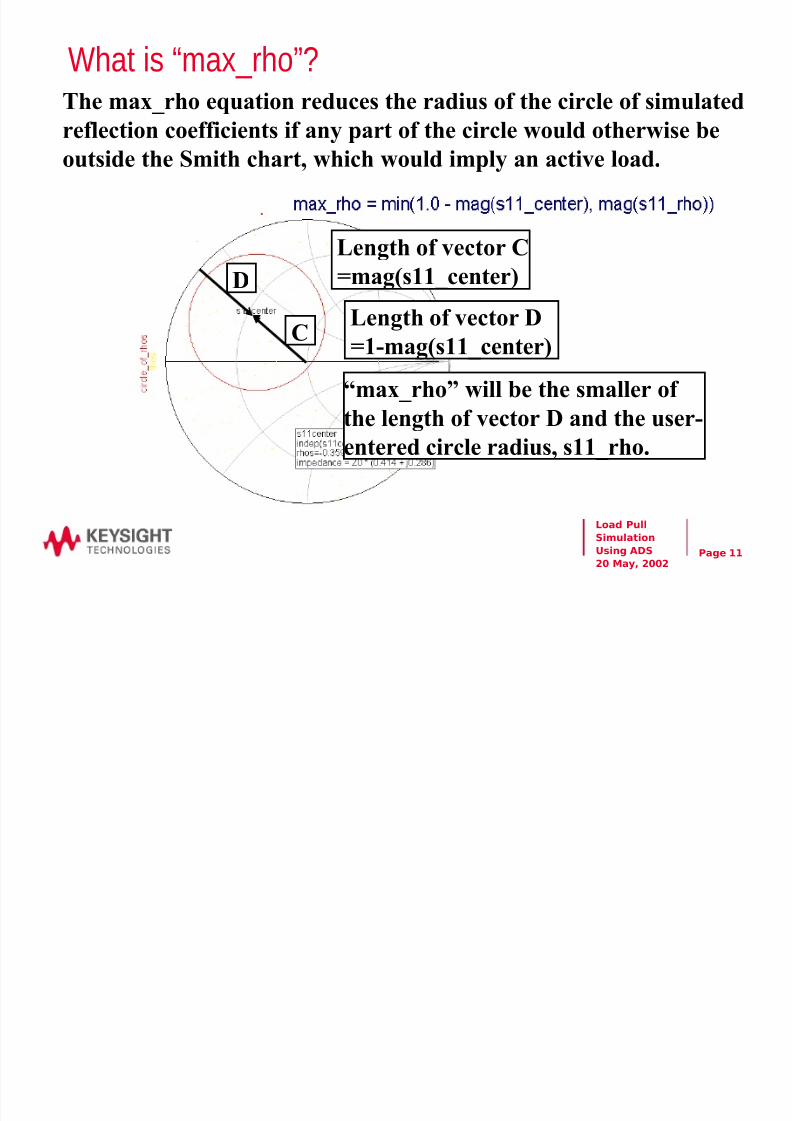
1hat is /ma(,rho02
9ength of vector !
6mags11_center-
!
5
9ength of vector 5
61)mags11_center-
The ma%_rho equation reduces the radius of the circle of simulated
reflection coefficients if any part of the circle "ould other"ise beoutside the Smith chart, "hich "ould imply an active load.
'ma%_rho( "ill be the smaller of
the length of vector 5 and the user)entered circle radius, s11_rho.
Load Pull
Simulation
Using ADS20 May, 2002

7/25/2019 Load Pull Pres
http://slidepdf.com/reader/full/load-pull-pres 12/41
Page
1hat about the /ma(,rho3"lines4+%0 term2
2
Including this term prevents the first
and last line from being tangent tothe circle at a single point. This allo"s
real_inde%s11 to be s"ept along the first
and last lines defined by imag_inde%s11.Load Pull
Simulation
Using ADS20 May, 2002

7/25/2019 Load Pull Pres
http://slidepdf.com/reader/full/load-pull-pres 13/41
Page
Sweep limits for /real,inde(s++0
3
ma%imum value of
c_limit
3rro" points to s11_center
reals11_center- c_limit is the distance fromthe
vertical center line of the circleto the edges, along each of the
hori$ontal lines. It is different
for each hori$ontal line.
min. value
of c_limit
Load Pull
Simulation
Using ADS20 May, 2002

7/25/2019 Load Pull Pres
http://slidepdf.com/reader/full/load-pull-pres 14/41
Page
5ow is c,limit calculated2
4
3rro" points to s11_center
imags11_center-
c_limit is calculated from+
r::;6c_limit::;8<::;,
"here
<6imag_inde%s11)imags11_center-,
and r6ma%_rho
!ircle radius is ma%_rho
imag_inde%s11
c_limit
Load Pull
Simulation
Using ADS20 May, 2002

7/25/2019 Load Pull Pres
http://slidepdf.com/reader/full/load-pull-pres 15/41
Page
5ow are the number of lines and the points perline calculated2
5
=ser sets this value
The 'lines( equation ta#es the
square root of 'pts(, then computes
the integer part. The ma%- function
ensures that at least one line is used.
The number of points per line is
computed by #eeping the integer
part of pts7lines.
Load Pull
Simulation
Using ADS20 May, 2002

7/25/2019 Load Pull Pres
http://slidepdf.com/reader/full/load-pull-pres 16/41
Page
Alternate reflection coefficient sweep
6
S"eep the phase of the reflectioncoefficient '>hi_rho( in degrees,
and s"eep the magnitude '?ag_rho(.
'rho( belo" becomes the s"ept
reflection coefficient, instead of
inde%s11.
Load Pull
Simulation
Using ADS20 May, 2002

7/25/2019 Load Pull Pres
http://slidepdf.com/reader/full/load-pull-pres 17/41
Page
Outline
7
• Overview
• Specifyingand generatingdesired load reflection coefficients
• Assigningarbitrary reflection coefficients atthe harmonic freqs.
• iasing the deviceand runninga simulation
• !alculating desiredresponses "deliveredpower#PA$# etc.%
• &enerating contourlines
Load Pull
Simulation
Using ADS20 May, 2002

7/25/2019 Load Pull Pres
http://slidepdf.com/reader/full/load-pull-pres 18/41
Page
6ou could ma7e the load independent offrequency8
8
4ut this "ould model an unrealistically
simple situation and "ould give
sub)optimal results.
Load Pull
Simulation
Using ADS20 May, 2002

7/25/2019 Load Pull Pres
http://slidepdf.com/reader/full/load-pull-pres 19/41
Page
Set source and load impedances at harmonicfrequencies arbitrarily
9
These default values are some"hat
sub)optimal, as using opens or shortsto terminate the harmonics should
give better performance.
@_l_; is the load impedance at
;nd harmonicA other load andsource impedances defined similarly
Load Pull
Simulation
Using ADS20 May, 2002

7/25/2019 Load Pull Pres
http://slidepdf.com/reader/full/load-pull-pres 20/41
Page
Defining a single# frequency9dependentreflection coefficient "+%
20
The 'brute force( "ay, using a giant if)then)else equation+
This is from e%amples7B_4oard7C35!_>3_prj7C35!_>3_Test
These are frequency brea# points, mid"ay bet"een
the fundamental and ;nd harmonic, bet"een the
;nd and rd harmonics, etc. Bfreq is thefundamental frequency.
These equations convert harmonic
impedances to reflection coefficients.
...
Load Pull
Simulation
Using ADS20 May, 2002

7/25/2019 Load Pull Pres
http://slidepdf.com/reader/full/load-pull-pres 21/41
Page
Defining a single# frequency9dependentreflection coefficient ":%
2
=sing an array, defined via the 'list -( function+
The list function defines an array of reflection coefficients, the first
value being /, the second value inde%s11, the third value fg@_l_;-,
etc.
The function fg%- converts an impedance
% into a reflection coefficient.Load Pull
Simulation
Using ADS20 May, 2002
7/25/2019 Load Pull Pres
http://slidepdf.com/reader/full/load-pull-pres 22/41
Page
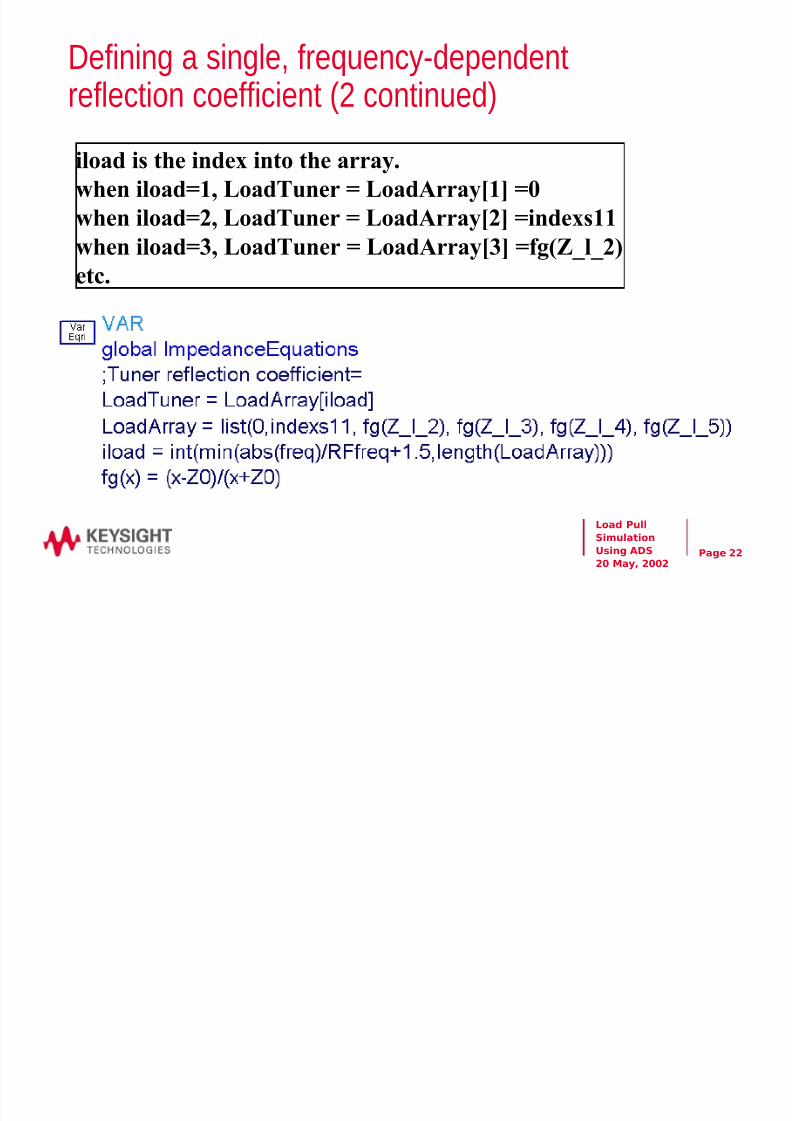
Defining a single# frequency9dependentreflection coefficient ": continued%
22
iload is the inde% into the array.
"hen iload61, 9oadTuner 6 9oad3rrayD1E 6/
"hen iload6;, 9oadTuner 6 9oad3rrayD;E 6inde%s11
"hen iload6, 9oadTuner 6 9oad3rrayDE 6fg@_l_;-
etc.
Load Pull
Simulation
Using ADS20 May, 2002
7/25/2019 Load Pull Pres
http://slidepdf.com/reader/full/load-pull-pres 23/41
Page
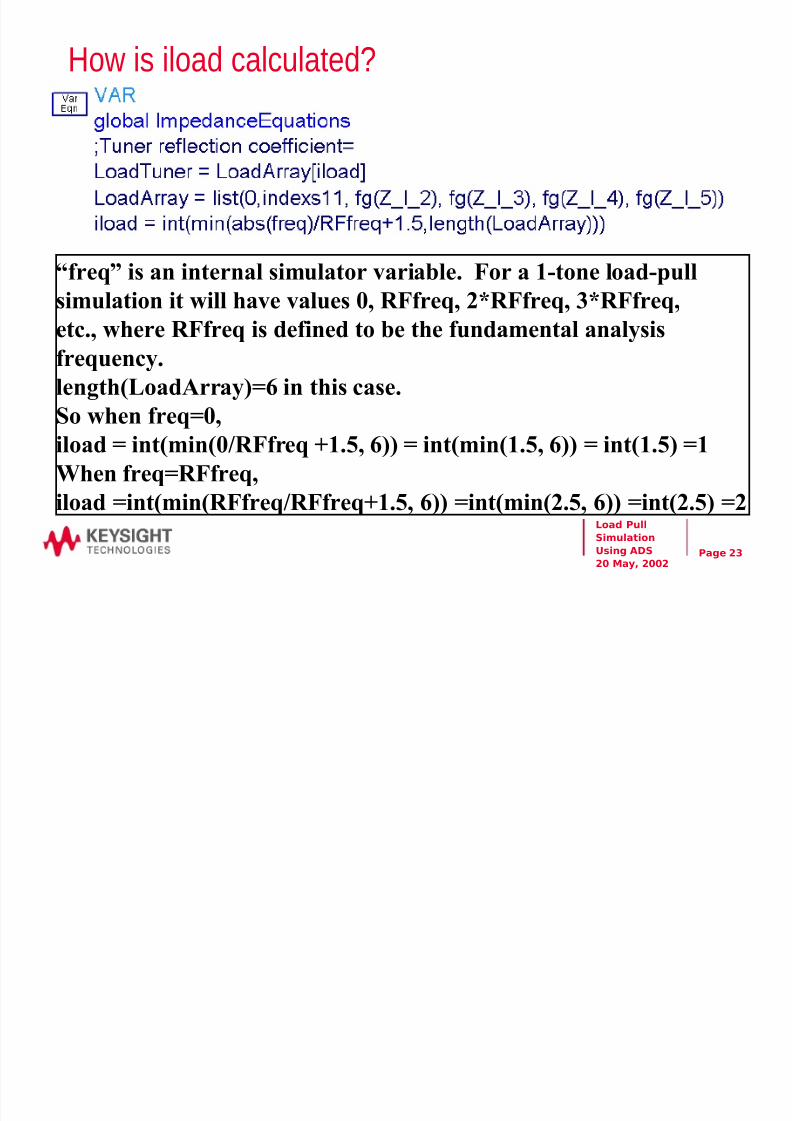
5ow is iload calculated2
23
'freq( is an internal simulator variable. Bor a 1)tone load)pullsimulation it "ill have values /, Bfreq, ;:Bfreq, :Bfreq,
etc., "here Bfreq is defined to be the fundamental analysis
frequency.
length9oad3rray-6 in this case.
So "hen freq6/,iload 6 intmin/7Bfreq 81.F, -- 6 intmin1.F, -- 6 int1.F- 61
&hen freq6Bfreq,
iload 6intminBfreq7Bfreq81.F, -- 6intmin;.F, -- 6int;.F- 6;Load Pull
Simulation
Using ADS20 May, 2002

7/25/2019 Load Pull Pres
http://slidepdf.com/reader/full/load-pull-pres 24/41
Page
ore details
24
&hen freq6/, analysis at 5! is being carried out, and iload61,
so 9oadTuner 69oad3rrayD1E6/. So the reflection coefficient at5! is /.
&hen freq6Bfreq, analysis at the fundamental frequency is
being carried out, and iload6;,
so 9oadTuner69oad3rrayD;E6inde%s11, "hich is the load
reflection coefficient at the fundamental frequency.
&hen freq6;:Bfreq, analysis at the ;nd harmonic frequency
is being carried out, and iload6,
so 9oadTuner69oad3rrayDE6fg@_l_;-, "hich is the load
reflection coefficient at the ;nd harmonic frequency. *tc.Load Pull
Simulation
Using ADS20 May, 2002

7/25/2019 Load Pull Pres
http://slidepdf.com/reader/full/load-pull-pres 25/41
Page
Load pull at a harmonic frequency
25
5efine a ne" variable, @_l_fund, to fi% the load impedance atthe fundamental frequency. Then change the 9oad3rray equation
to+
9oad3rray 6 list/, fg@_l_fund-, inde%s11, fg@_l_-,G-
The reflection coefficient at "hich harmonic frequency is beings"eptH
&hat if you "anted to s"eep the reflection coefficient at the third
harmonicHLoad Pull
Simulation
Using ADS20 May, 2002

7/25/2019 Load Pull Pres
http://slidepdf.com/reader/full/load-pull-pres 26/41
Page
Outline
26
• Overview
• Specifyingand generatingdesired load reflection coefficients
• Assigningarbitrary reflection coefficients atthe harmonic freqs.
• iasing the deviceand runninga simulation
• !alculating desiredresponses "deliveredpower#PA$# etc.%
• &enerating contourlines
Load Pull
Simulation
Using ADS
20 May, 2002
7/25/2019 Load Pull Pres
http://slidepdf.com/reader/full/load-pull-pres 27/41
Page
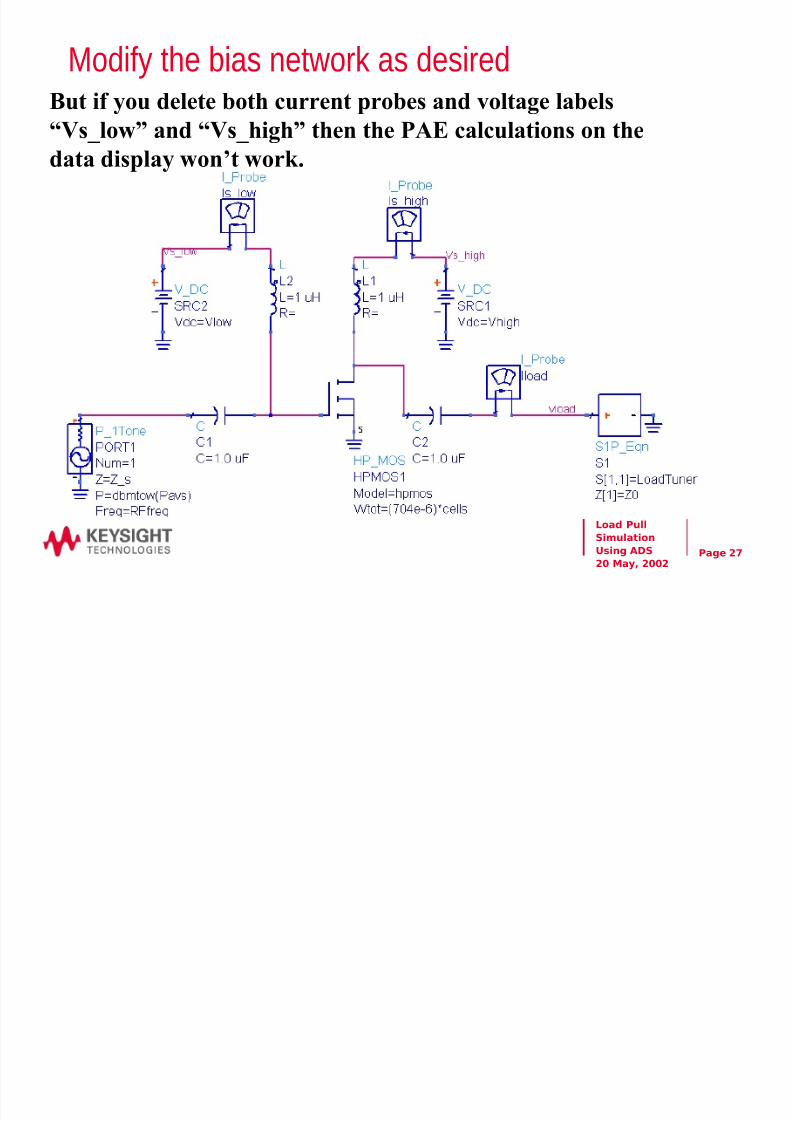
odify the bias networ7 as desired
27
4ut if you delete both current probes and voltage labels
'Vs_lo"( and 'Vs_high( then the >3* calculations on thedata display "ont "or#.
Load Pull
Simulation
Using ADS
20 May, 2002

7/25/2019 Load Pull Pres
http://slidepdf.com/reader/full/load-pull-pres 28/41
Page
Outline
28
• Overview
• Specifyingand generatingdesired load reflection coefficients
• Assigningarbitrary reflection coefficients atthe harmonic freqs.
• iasing the deviceand runninga simulation
• !alculating desiredresponses "deliveredpower#PA$# etc.%
• &enerating contourlines
Load Pull
Simulation
Using ADS
20 May, 2002
7/25/2019 Load Pull Pres
http://slidepdf.com/reader/full/load-pull-pres 29/41
Page
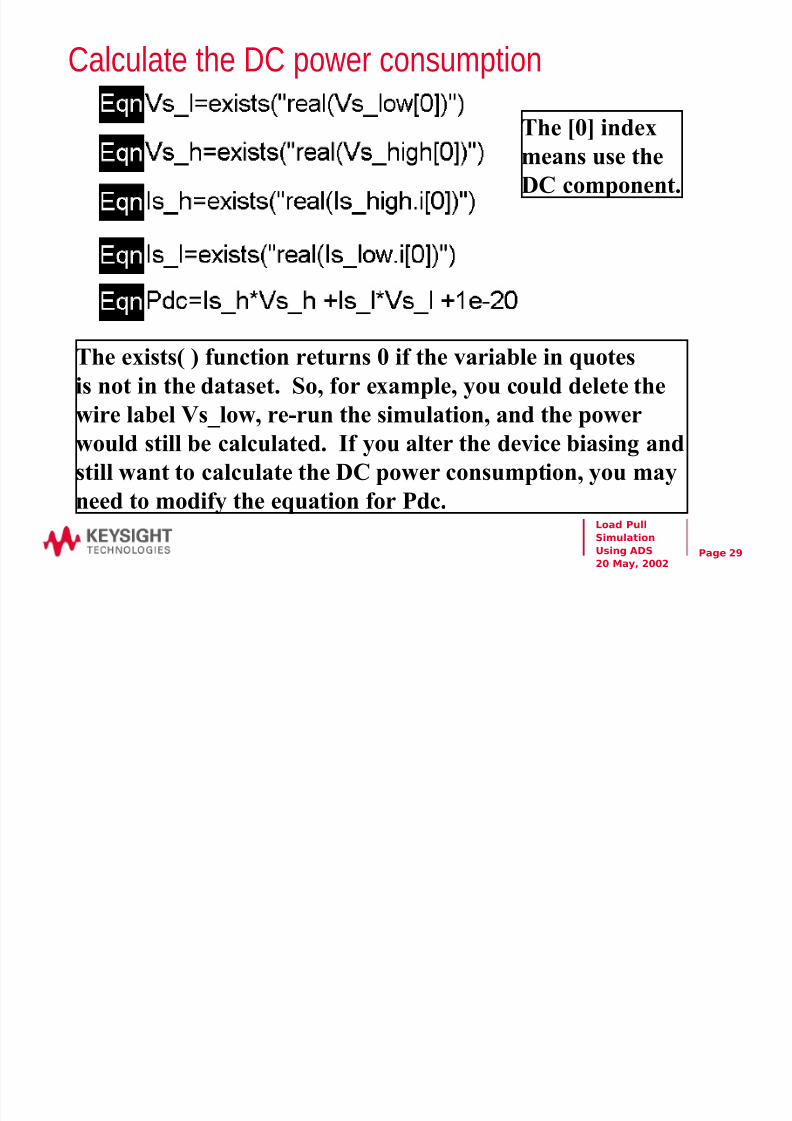
!alculate the D! power consumption
29
The e%ists - function returns / if the variable in quotes
is not in the dataset. So, for e%ample, you could delete the
"ire label Vs_lo", re)run the simulation, and the po"er"ould still be calculated. If you alter the device biasing and
still "ant to calculate the 5! po"er consumption, you may
need to modify the equation for >dc.
The D/E inde%
means use the
5! component.
Load Pull
Simulation
Using ADS
20 May, 2002

7/25/2019 Load Pull Pres
http://slidepdf.com/reader/full/load-pull-pres 30/41
Page
!alculate the power delivered and PA$
30
>avs is the po"er available from the source, in d4m.
The user sets this value on the schematic, and it is passed
into the dataset.
>o"er)added efficiency is calculated as the po"er delivered
to the load minus the po"er available from the source divided
by the 5! po"er consumption.
/.F:realV:conjI-- isa standard equation
for calculating po"er
delivered to a comple%
load. efer to 5esoer and
Juh, 4asic !ircuit Theory.
Load Pull
Simulation
Using ADS
20 May, 2002

7/25/2019 Load Pull Pres
http://slidepdf.com/reader/full/load-pull-pres 31/41
Page
Pdel,1atts and PA$ are functions of the twoswept variables
3
The ma%imum values are computed by finding the
ma%ima across one dimension real_inde%s11- first,then finding the ma%imum of the remaining array.
Load Pull
Simulation
Using ADS
20 May, 2002

7/25/2019 Load Pull Pres
http://slidepdf.com/reader/full/load-pull-pres 32/41
Page
Outline
32
• Overview
• Specifyingand generatingdesired load reflectioncoefficients
• Assigning arbitrary reflectioncoefficients at theharmonic freqs.
• iasingthedeviceandrunninga simulation
• !alculatingdesired responses "delivered power# PA$#etc.%
• &eneratingcontour lines
Load Pull
Simulation
Using ADS
20 May, 2002

7/25/2019 Load Pull Pres
http://slidepdf.com/reader/full/load-pull-pres 33/41
Page
ost simple contour lines
33
Simplest case is to just use
contour_polar - function "ith
defaults. Kenerates si% equally)
spaced levels bet"een the
minimum and ma%imum of
the data.
4ut you cant easily find the
ma%imum by moving the
mar#er or quic#ly change
the number of lines or their
spacing.
Load Pull
Simulation
Using ADS
20 May, 2002

7/25/2019 Load Pull Pres
http://slidepdf.com/reader/full/load-pull-pres 34/41
Page
ay specify specific contour values
34
=se curly braces L M to specify
specific contour values.
4ut you cant easily find the
ma%imum by moving the
mar#er, and you may have
to modify the values by
hand if you change the
simulation.
Load Pull
Simulation
Using ADS
20 May, 2002

7/25/2019 Load Pull Pres
http://slidepdf.com/reader/full/load-pull-pres 35/41
Page
ore comple( but more fle(ible contourequations
35
Specify step in N >3* bet"een lines
Specify number of contour lines
Birst contour line "ill be for >3*ma%)/.1. This )/.1 term
is included so the first line "ill be a small circle that you cansee, rather than being a single pi%el that you cant.
If Cum>3*_lines6F, then D/++Cum>3*_lines)1-E generates
an array from / to O, in steps of 1.
So the second >3* line "ill be for >3*ma%)/.1 )1:>3*_step.
The third >3* line "ill be for >3*ma%)/.1 );:>3*_step.*tc.
&ith this approach, you can quic#ly change the number of
lines and the spacing bet"een them.Load Pull
Simulation
Using ADS
20 May, 2002
7/25/2019 Load Pull Pres
http://slidepdf.com/reader/full/load-pull-pres 36/41
Page
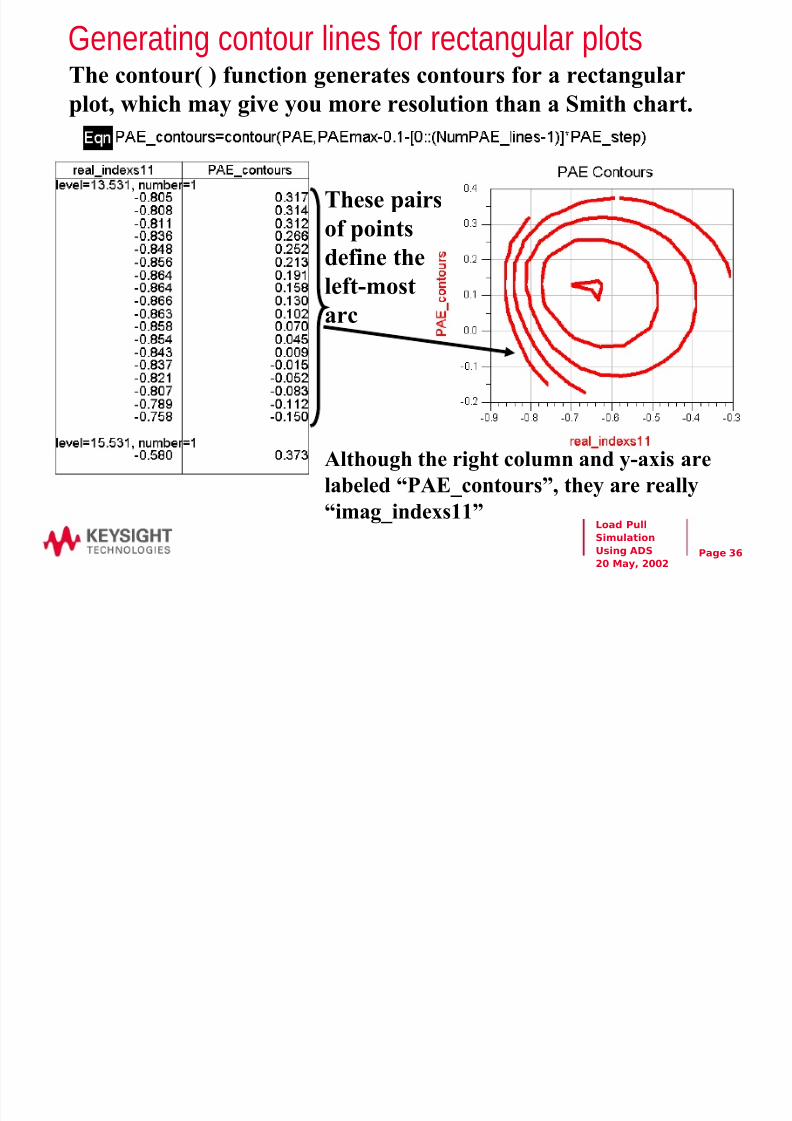
&enerating contour lines for rectangular plots
36
The contour - function generates contours for a rectangular
plot, "hich may give you more resolution than a Smith chart.
These pairs
of points
define the
left)mostarc
3lthough the right column and y)a%is are
labeled '>3*_contours(, they are really
'imag_inde%s11(Load Pull
Simulation
Using ADS
20 May, 2002

7/25/2019 Load Pull Pres
http://slidepdf.com/reader/full/load-pull-pres 37/41
Page
&enerating contour lines for Smith chart
37
The contour - function generates y)a%is coordinates >3*_contours
) really imag_inde%s11- paired "ith %)a%is coordinates
real_inde%s11-. 4ut you have to convert these to comple% numbersfor plotting on the Smith chart.
The >3*_contours_p equation ta#es the P and < coordinate pairs of the
contour lines and converts them to comple% numbers, P 8j:<, "hichcan be plotted on a Smith chart.
This equation generates contour lines for the Smith chart directly+
Load Pull
Simulation
Using ADS
20 May, 2002
7/25/2019 Load Pull Pres
http://slidepdf.com/reader/full/load-pull-pres 38/41
Page
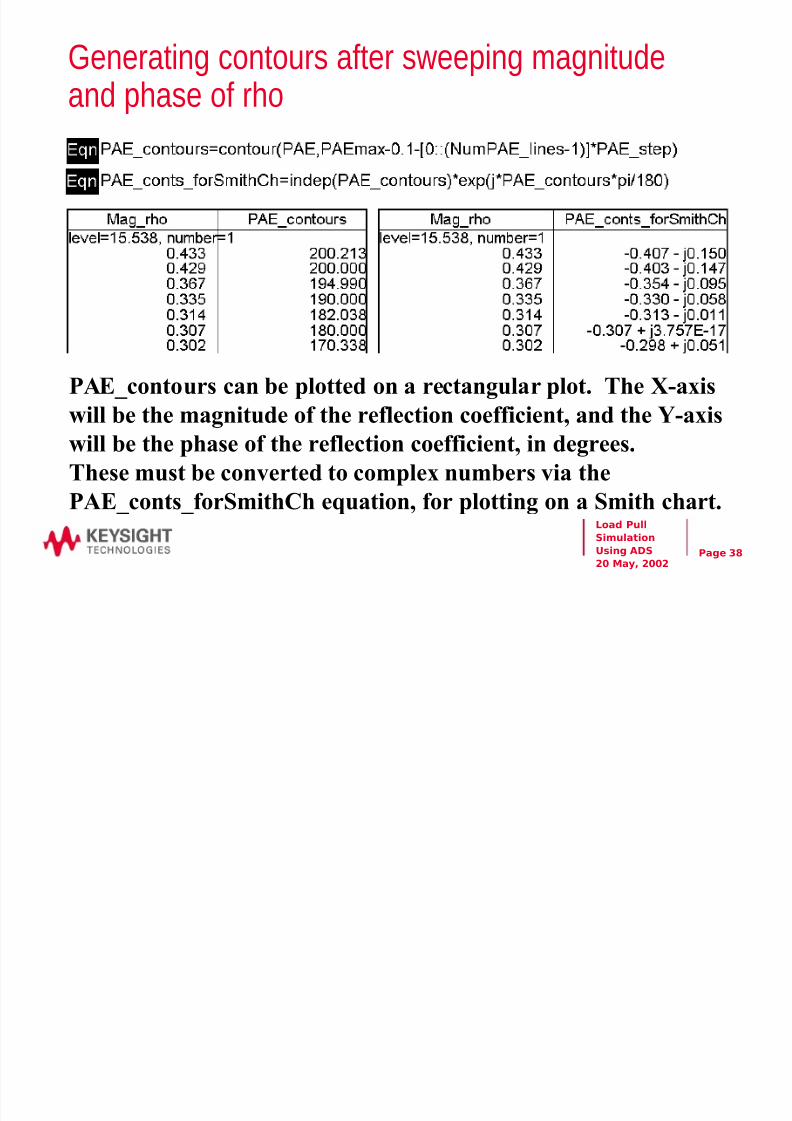
&enerating contours after sweeping magnitudeand phase of rho
38
>3*_contours can be plotted on a rectangular plot. The P)a%is
"ill be the magnitude of the reflection coefficient, and the <)a%is"ill be the phase of the reflection coefficient, in degrees.
These must be converted to comple% numbers via the
>3*_conts_forSmith!h equation, for plotting on a Smith chart.Load Pull
Simulation
Using ADS
20 May, 2002

7/25/2019 Load Pull Pres
http://slidepdf.com/reader/full/load-pull-pres 39/41
Page
Plotting the actually9simulated reflectioncoefficients
39
This data sho"s the simulation
results "hen the reflection
coefficient is the value selectedby the mar#ers location.
These 'surface_samples( are computed from the s"ept variables,
real_inde%s11 and imag_inde%s11+
The 'e%pand -( function just adds an e%tra independent variable
to the imag_inde%s11 variable so it can be added to real_inde%s11.Load Pull
Simulation
Using ADS
20 May, 2002
7/25/2019 Load Pull Pres
http://slidepdf.com/reader/full/load-pull-pres 40/41
Page
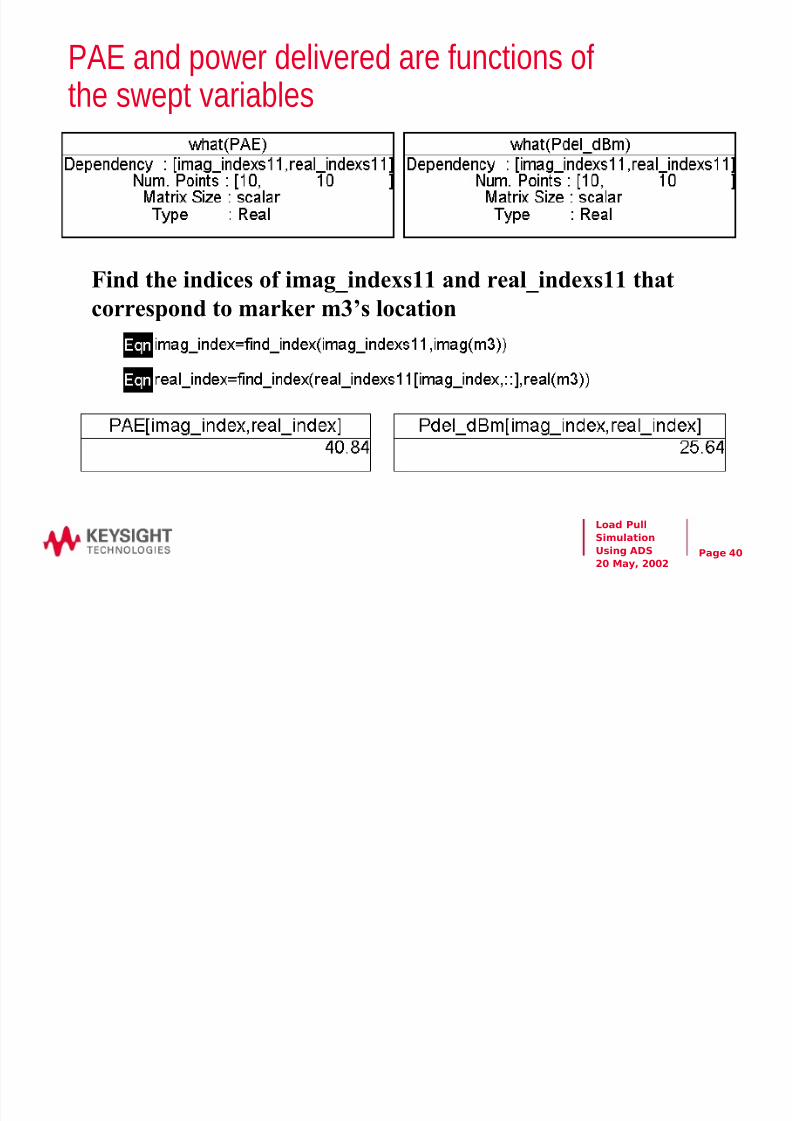
PA$ and power delivered are functions ofthe swept variables
40
Bind the indices of imag_inde%s11 and real_inde%s11 thatcorrespond to mar#er ms location
Load Pull
Simulation
Using ADS
20 May, 2002

7/25/2019 Load Pull Pres
http://slidepdf.com/reader/full/load-pull-pres 41/41
Page
Summary
4
•
35S offers much fle%ibility for simulating load pull•Set)up and post)processing equations are comple%, but you
dont have to #no" them to run simulations. The set)up
and post)processing can be simplified.
•Qther, more advanced capabilities are available, including
source)pull, t"o)tone intermodulation distortion "hiledoing a load pull, and optimi$ation "ithin a load pull s"eep.
Load Pull
Simulation
Using ADS