Embed Size (px)
Citation preview

The Benefit of Low Cost Accelerometers for GNSS Anti-Spoofing
Sherman Lo, Yu Hsuan Chen, Tyler Reid, Adrien Perkins, Todd Walter, Per Enge, Stanford University BIOGRAPHY Sherman Lo is a senior research engineer at the Stanford GPS Laboratory. He received the Ph.D. in Aeronautics and Astronautics from Stanford University in 2002. Yu-Hsuan Chen is a research engineer at the Stanford GPS Laboratory. He received his Ph.D. in Electrical Engineering from National Cheng Kung University, Taiwan in 2011. Tyler Reid is a Ph.D. candidate in the Stanford GPS Laboratory. Adrien Perkins is a Ph.D. candidate in the Stanford GPS Laboratory working under the guidance of Professor Per Enge in the Department of Aeronautics and Astronautics. He received his B.S. in Mechanical Aerospace Engineering from Rutgers University in 2013 and his Master of Science in Aeronautics and Astronautics from Stanford University in 2015. Todd Walter is a senior research engineer at the Stanford GPS Laboratory. He received his Ph.D. in Applied Physics from Stanford University. Per Enge is a professor of Aeronautics and Astronautics at Stanford University, where he is the Vance D. and Arlene C. Coffman Professor in the School of Engineering. He directs the Stanford GPS Laboratory, which develops satellite navigation systems. He has been involved in the development of the Federal Aviation Administration’s GPS Wide Area Augmentation System (WAAS) and Local Area Augmentation System (LAAS).
ABSTRACT Global navigation satellite systems (GNSS) are integral to aviation navigation and precise landings. It will be fundamental to many other safety of life applications such as railway and autonomous vehicles. To truly protect these systems and maintain safety, we need to not just address nominal hazards but also deliberate threats such as spoofing. Many methods have been proposed to address spoofing. A natural suggestion is to compare GNSS with other independent sensors, particularly inertial sensors. This paper develops a GNSS spoof monitoring methodology that uses comparisons with an inertial sensor. The methodology differs from prior methods developed and uses comparisons of accelerometers and GNSS acceleration (rather than position or velocity). This structure keeps the two instruments independent which makes it a steady state test and allows for tests over time. This paper develops and examines the use of acceleration from low cost sensors to detect GNSS spoofing in safety of life applications. We examine if there are suitably random accelerations and whether low inertial sensors can provide useful comparison to GNSS. Then we examine how we can use these measurements to provide robust spoof detection. First, we examine whether there are adequate signals from the vehicle and whether they are sufficiently measurable by both GNSS and low cost accelerometers. The conjecture is that it is difficult for malicious spoofer to predict and hence replicate the accelerations experienced by these vehicles. For example, an aircraft experiences random accelerations due to wind gusts as well as semi-random accelerations due to configurations changes (flap, landing gear position). Similarly, a railcar may experience potentially random accelerations along-track and in the vertical direction. Measurements from flight tests show that there are often significant and unique accelerations that can be measured by both GNSS and consumer grade accelerometer. In cryptographic terms, the acceleration information can provide a “one time pad” that is difficult for most spoofers to determine. To reasonably compare accelerations, the measurements from GNSS and the accelerometer need to be aligned. Accelerometers measure in the body frame while GNSS provides results in inertial or local frames. GNSS is used to estimate the body frame and align the two measurements. While the alignment is not exact, the results indicate that it may be generally sufficient for approach.

Next, having an unpredictable and high frequency acceleration signature allows for the development of robust spoof detection monitoring. Guiding principles in the initial design are simplicity and low false alert rates. High false alert rate will cause high unavailability and, even worse, general distrust of the system. Hence, the paper develops a simple statistically based test for detection. It demonstrates the performance of the test method on the flight test data collected.
INTRODUCTION Spoofing of Global Navigation Satellite Systems (GNSS) signals can have deleterious effects on society given the widespread use and dependence of critical infrastructure on GNSS. However, few commercial receivers have significant anti-spoofing (A/S) mechanisms. Even simple interference events such as jamming and meaconing have resulted in erroneous position outputs from shipboard and airborne receivers [1][2] [3][4]. Spoofing tests have shown that deliberate GNSS spoofing could have significant impact on the GNSS receiver and hence GNSS dependent systems [5][6]. While the extent of the impact is still debated, it is clear that a spoofing event would significantly harm some users. So, the debate over the utility of A/S comes down to the likelihood of spoofing events. We can no longer categorically state that GNSS spoofing, outside a laboratory or military setting, has not occurred. Indeed, GNSS spoofing was observed outside the Kremlin in 2016 [7]. Furthermore, the popularity of location-based games such as Pokémon Go has also induced hackers to build and utilize GNSS spoofers [8]. While the spoofer in [8] uses an expensive GNSS signal generators, other professional security groups have put together GNSS spoofer using low cost software defined radios (SDRs), open source software and some basic GNSS know-how [9]. GNSS spoofing capabilities are no longer solely the realm of navigation experts. And as time goes on, spoofing capabilities will get better and its costs will only decrease. There are many motivations to spoof. Ordinary citizens may spoof to aid their gaming, to protect their privacy or to subvert location based charges (e.g. road tolling) or restrictions. A quick search on the Google Play store shows multiple pages of “Fake GPS” apps. The first app, “Fake GPS Location Spoofer Free”, alone has over 60,000 reviews as of May 2017. This indicates that many people took the time to not only download and use the app but also to comment on its benefits! Given the interests in these apps, it is not a stretch to say that there is public interest in spoofing GNSS. Coupling these two factors - the availability of GNSS spoofing equipment or know-how and individuals who have interest in spoofing – means we should expect that there will be more spoofing incidents in the future. And while critical infrastructure may not be the target for most spoofers, it may fall victim as collateral damage. In this paper, we develop and examine GNSS spoofing detection via direct comparison of motion (acceleration) using commercial inertial sensors. The concept developed allows for comparison of the two sensors without coupling GNSS with inertial measurement unit (IMU). The design allows for a robust, steady state spoof detection capability that can be developed as an applique to existing receivers. This paper develops this concept, particularly for use in aviation and is organized as follows. The first part covers prior art and describes the developed technique. The second part describes the test equipment used and experiments conducted to collect data for analysis. The third part examines whether inertial measurements from a low-cost IMU can provide enough information for aviation spoof detection. The fourth part develops and tests a methodology for spoof detection based on the data collected. The final part addresses the use of the technique for other modes of transportation such as railway and automobiles.
BACKGROUND: PRIOR ART & DEVLEOPED TECHNIQUE
Prior art & goals
Despite not being a current commercial concern, there is a significant literature on GNSS spoof detection [10][11]. Various researchers have proposed and developed numerous anti-spoofing techniques. Antenna-based techniques use signal properties such as direction of arrival and polarization to detect the presence of spoofing [12][13][14][15]. Internal receiver metrics can be examined for signatures found in spoofing attacks. This includes changes in automatic gain control (AGC) and signal power [16][17]. Network method cross-checks the received signal within known trusted signals [18][19]. Redundancy techniques cross-check GNSS measurements with redundant internal or external measures.
While there are many A/S techniques, there is no panacea for spoofing. There is currently no one technique that ideally satisfies all needs. There will likely need to be different solutions for different users, applications and requirements.

Additionally, a given technique is likely only good against a subset of threats. So, each solution may actual employ several, complimentary techniques to cover all desired threats. For example, one can use AGC and signal power can detect overpowering spoofers and redundancy checks based on correlators, signal deformation or signal cross checking to detect spoofers being received with roughly equal power as GNSS. Regardless, the techniques employed should have certain characteristics. First, they need to be robust meaning that they catch the threats that they were designed for while having very low false alert rates. Second, they need to be reasonable to implement. This means that they do not significantly change existing receiver designs or add to its cost. A/S needs to be effective but also transparent to the user. It cannot inconvenience them through false alerts or additional, costly complexity. This motivates our investigation of the use of simple inertial-based technique as another technique to bring to bear on spoofing. This work seeks to develop a simple, robust and steady state inertial comparison for spoof detection for aviation and other transportation applications.
Use of inertial sensors to complement and cross-check GNSS is not new. Traditional aviation GNSS/inertial cross-checking algorithms for fault detection have been adapted to spoof detection. Both autonomous integrity monitoring by extrapolation (AIME) [20] and Honeywell Inertial GPS Hybrid (HIGH) [22] have been used as the basis for GNSS spoof detectors [23]. AIME, one of the earliest GNSS integrity concept, checked innovations in GNSS and inertial measurements to detect anomalies while HIGH is a position domain integrity check. Tanil et al. investigated the use of INS with Kalman filtering to perform spoof detection in the position domain [25][26][27]. These techniques, which require comparisons in the pseudo range or position domain, essentially require GNSS to calibrate and initialize the IMU results. The intertwining of GNSS information to transform IMU results to the position domain limit the trustworthiness of the comparison over time. Hence, these spoof detection methods are considered transient detectors as they only have a limited detection window in which the IMU-derived positions can be considered uncontaminated by GNSS spoof induced errors.
Developed technique
Overcoming the limited spoof detection window means having no tightly intertwining GNSS from the IMU-derived results. The decoupling means that attitude errors from gyroscopes cannot be calibrated and we cannot transform the IMU measurements into position without large uncertainties. This necessitates comparison in a more natural domain for the IMU – namely acceleration or rotation rate rather than comparison in position or pseudo range domain. Furthermore, it also desirable to compare in the body axes in which the IMU is aligned. The GNSS results can be roughly rotated to this frame using GNSS derived information. The rotation is aided by having a reasonably stable or predictable attitude. This also keeps any GNSS-derived errors within the GNSS measurements. So, in this paper, we examine comparison of acceleration in the body axes. Given this comparison metric – acceleration as measured by the GNSS and IMU, test statistics are developed that serve as monitors, which can be used to decide if spoofing is present. These monitors will have to account not just for errors due to the sensors but also those due to misalignment of the GNSS and IMU coordinate frames. The benefit of the technique developed is that in uncoupling GNSS outputs from the IMU, we essentially provide an unlimited detection window. It also allows the technique to be implemented as an applique so that it can be an add-on to an existing receiver.
The technique is designed to detect spoofing from an attacker with no or limited knowledge of the vehicle movement. The detector is not meant to protect against all spoofing threats and a threat where the spoofer is onboard measuring the actual accelerations can and should be mitigated by other means. If the attacker is onboard or is reasonably collocated with the GNSS antenna or IMU, it should not have near perfect and instantaneous access to vehicle acceleration. Any spoofing attack without a good estimate of the vehicle acceleration should be detectable. Even if the spoofer is sophisticated and either measures the acceleration remotely or relays a measurement of acceleration from an onboard device, the process will incur errors and delays that can detected provided there is high frequency dynamics. There are some threats that technique cannot catch. A spoofer with accurate knowledge of acceleration can slowly drift the measured position from truth as long as they keep the acceleration error within the allowable detection tolerance. Hence, this technique is meant to be used with complimentary techniques to cover these threats. For example, the position domain detection described in [25] may be used as a separate, independent and parallel detector.
The costs of this method are that it requires high frequency component of acceleration and predictable attitude. The former represents in cryptographic terms, a one-time pad that a spoofer cannot guess a priori. In flight, there can be many sources of unpredictable acceleration – wind, pilot input to thrust, lowering of the landing gear, etc. Others have considered these items for their ability to provide motion that is difficult for a spoofer to predict [28][29]. It also means that if the spoofer can somehow precisely and rapidly know the acceleration, the spoofer may be able to avoid detection while inducing a position error. The latter requirement of stable or predictable attitude is necessary because the gyroscopes are not being aided by GNSS. Without aiding, the gyroscopes alone cannot provide precise absolute attitude. Without a reasonable sense of the true attitude, the reference frames between the IMU and GNSS may not be well-aligned. Without alignment, a fair comparison

between IMU and GNSS accelerations cannot be made. While the requirement may seem demanding, it is important to understand that commercial flight desires a stable attitude, especially on approach. This makes sense as the aircraft should be reasonably steady for landing. It should not have much roll and the pitch angle should be small as the aircraft tries to maintain a small, constant glide slope (~ 3 degrees). Another time where aircraft attitude is reasonably stable is during cruise which represents the major portion of any flight. So commercial aviation often has a stable attitude, especially at final approach. Enabling spoof detection during final approach is valuable as it is the most critical phase of flight.
Critical to the utility of the methodology are two key questions. First, are there adequate motions available for spoof detection using a low cost INS? The motion must be semi-random and significant relative to the capability of the sensors and their errors. This will be examined using flight test data. It must be significant enough to rise above the errors and biases induced by our methodology. The second question is whether we can develop a robust, steady-state test metric for spoof detection given that information.
DATA COLLECTION & TESTING Analysis of GNSS acceleration and microelectromechanical systems (MEMS) inertial performance indicate that these instruments can measure to better than 0.02 meters per second squared (m/s2). In fact, automotive grade MEMS and GNSS receivers with good carrier to noise ratio (C/No) can achieve an order of magnitude lower. While theoretically these instruments should be suitable for aviation and other transportation, real world errors and biases may result in different performance. Hence, a flight test was conducted to gather data to validate our theoretical conclusions and examine flight disturbances.
Data collection equipment
Several instruments were used to collect the data for the evaluating the utility of low cost accelerometer for spoof detection. A Samsung Galaxy Note 3 was used to provide accelerometer data. It contains an Invensense MP65M sensor (accelerometer, gyroscope) along with a magnetometer/compass. This is a consumer grade IMU and represents a worst case level of IMU performance. We expect that implementations for transportation applications would use automotive grade MEMS or better. The sensor data is collected at roughly 8 Hz. Additionally, Galaxy Note 3 can also collect GNSS data at 1 Hz with the output in National Marine Electronics Association (NMEA) format. This device is ultra-portable and has been used it for aircraft, automobile and rail data collection [30]. For the flight test, a Trimble BX935-INS GNSS receiver was used. The receiver and the flight test vehicle, a Federal Aviation Administration (FAA) Technical Center Global 5000 business jet, is shown in Figure 1. This receiver is connected to an external aircraft antenna located on the top center of the body. The INS portion of the receiver was not utilized. For the aviation analysis in this paper, this receiver provided the primary source of GNSS data with only the Global Position System (GPS) constellation is processed. For the most accurate acceleration, the GNSS data was processed using Precise Point Positioning (PPP) with output at 10 Hz. PPP utilizes multi-frequency (L1, L2) output.
Figure 1. Trimble BX935-INS GNSS receiver and antenna used on FAA Global 5000 business jet

Flight test
A flight test was conducted on August 24, 2016 to collect data for analyzing the feasibility of the concept. The Galaxy Note was placed on the armrest roughly aligned with the aircraft body axis - it was not collocated with GNSS antenna though it is located at roughly the same place along the aircraft body. The flight test incorporated several segments representative of the key phases of flight. There are straight and level, banked turns (in a figure 8 pattern), and missed approach segments. The flight and its segments, flown over the period of about 3.5 hours, are shown in Figure 2.
Figure 2. Path of August 24 2016 flight test using FAA Global 5000
COMPARISON OF FLIGHT ACCELERATION DATA
Two adjustments are made to compare the GNSS and accelerometer measurements. First, the GNSS measurements need to be aligned with the same axes as the accelerometer. Second, as accelerometers actually measure specific force, the gravity force vector needs to either be removed from the accelerometer or added to the GNSS measurements. To accomplish the first, an initial or representative GNSS position is used to convert these measures to local east north up (ENU) frame. Then those positions are differenced and double differenced to get velocity and acceleration in that frame. The velocity vector in the horizontal direction is used to align the horizontal or east-north (EN) axes to the aircraft heading. The heading is roughly, but not precisely, the direction of the aircraft nose. The rotation roughly aligns GNSS acceleration with the body axis provided the aircraft is relatively level (small roll, pitch angles). These frames are shown in Figure 3. A second adjustment is to subtract acceleration due to gravity, g, set nominally at 9.81 m/s2, from the accelerometer z-axis. Note, this does not couple the IMU results with the GNSS. It is book keeping and g could have been added to the GNSS accelerations instead. Either yields the same equation for acceleration difference. These adjustments result in some residual errors – particularly from residual differences between accelerometer frame and the adjusted GNSS frame. Additionally, the gravity adjustment can also have error from variations of gravitational force at different locations and altitudes. Simple pitch and roll correction can be made to align the frames better and these corrections are beneficial in some circumstances. However, as seen later, the two basic adjustments described above are sufficient for the comparison for approach. Furthermore, only the latter is needed for comparing vertical acceleration. With the adjustments, we can calculate the acceleration differences between the sensors. This is shown in Equation (1) where , is the acceleration from the sensor (accelerometer or GNSS) along the i axis. R is the estimated rotation matrix to rotate GNSS ENU to the accelerometer body axis.
∆ =,
,
,→ ∗
,
,
,
+00 (1)
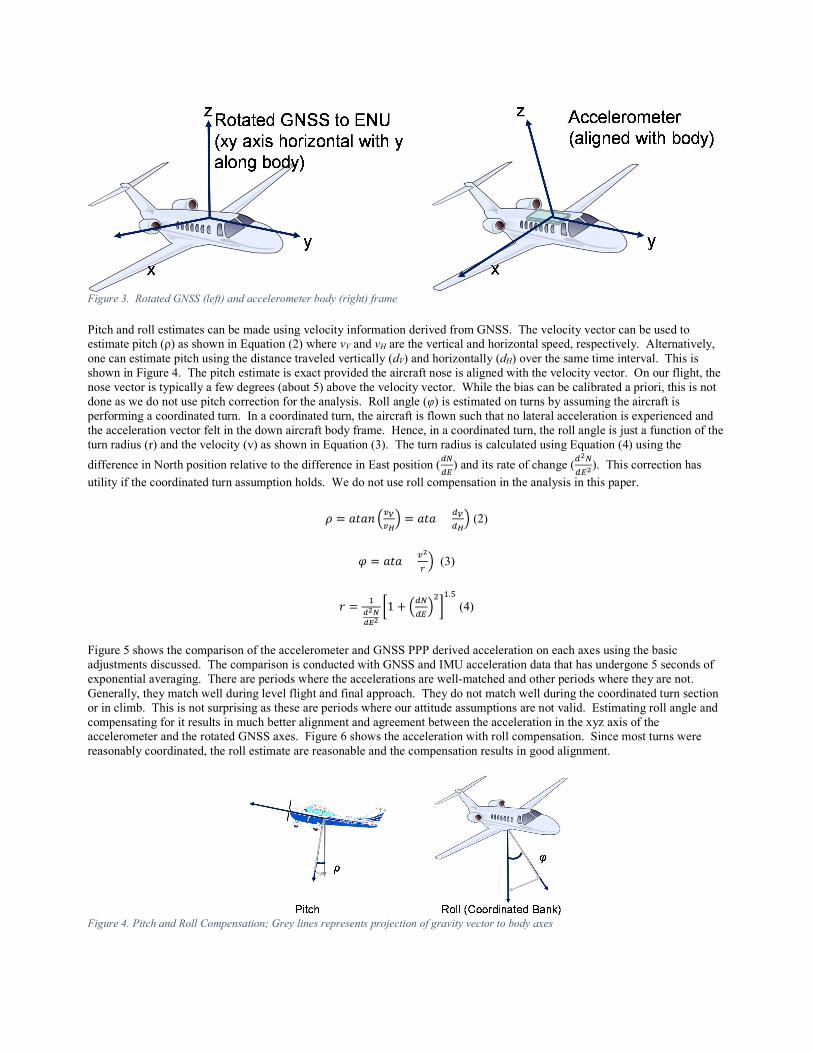
Figure 3. Rotated GNSS (left) and accelerometer body (right) frame
Pitch and roll estimates can be made using velocity information derived from GNSS. The velocity vector can be used to estimate pitch (ρ) as shown in Equation (2) where vV and vH are the vertical and horizontal speed, respectively. Alternatively, one can estimate pitch using the distance traveled vertically (dV) and horizontally (dH) over the same time interval. This is shown in Figure 4. The pitch estimate is exact provided the aircraft nose is aligned with the velocity vector. On our flight, the nose vector is typically a few degrees (about 5) above the velocity vector. While the bias can be calibrated a priori, this is not done as we do not use pitch correction for the analysis. Roll angle (φ) is estimated on turns by assuming the aircraft is performing a coordinated turn. In a coordinated turn, the aircraft is flown such that no lateral acceleration is experienced and the acceleration vector felt in the down aircraft body frame. Hence, in a coordinated turn, the roll angle is just a function of the turn radius (r) and the velocity (v) as shown in Equation (3). The turn radius is calculated using Equation (4) using the
difference in North position relative to the difference in East position ( ) and its rate of change ( ). This correction has
utility if the coordinated turn assumption holds. We do not use roll compensation in the analysis in this paper.
= = (2)
= (3)
= 1 +.
(4)
Figure 5 shows the comparison of the accelerometer and GNSS PPP derived acceleration on each axes using the basic adjustments discussed. The comparison is conducted with GNSS and IMU acceleration data that has undergone 5 seconds of exponential averaging. There are periods where the accelerations are well-matched and other periods where they are not. Generally, they match well during level flight and final approach. They do not match well during the coordinated turn section or in climb. This is not surprising as these are periods where our attitude assumptions are not valid. Estimating roll angle and compensating for it results in much better alignment and agreement between the acceleration in the xyz axis of the accelerometer and the rotated GNSS axes. Figure 6 shows the acceleration with roll compensation. Since most turns were reasonably coordinated, the roll estimate are reasonable and the compensation results in good alignment.
Figure 4. Pitch and Roll Compensation; Grey lines represents projection of gravity vector to body axes

Figure 5. Comparison of acceleration (5 second exponential averaged) from 3 axes: accelerometer (blue) and PPP GNSS, rotated to estimated body axes (red) vs time from start (hours)
Figure 6. Comparison of acceleration (5 second exponential averaged) from 3 axes: accelerometer (blue) and PPP GNSS, rotated to estimated body axes (red) with roll estimation and compensation vs time from start (hours)

Comparison of acceleration data
The initial analysis uses comparisons of the up (GNSS) or z-axis (accelerometer) during approach. Approach has reasonable signal and the frames well-aligned without needing pitch or roll compensation. As seen from our results, other axes can also be used. In Figure 7, the estimated vertical acceleration as measured by GNSS and the accelerometer of the first approach is shown. The acceleration is exponentially averaged over 5 seconds. The only major difference seen occurs when the aircraft turns (banks) slightly. The two accelerations have a correlation coefficient of about 0.93. Figure 8 shows the vertical acceleration profile of the second approach. Again the GNSS and accelerometer accelerations are well matched with a correlation coefficient of about 0.96. Also note that the acceleration profile is dissimilar from the first approach. This is demonstrated later when the cross-correlation of the accelerometer accelerations between approaches is calculated.
Figure 7. Acceleration (5 second exponential averaged) from accelerometer z-axis (body up) (blue) and PPP GNSS, up axis (red) for approach 1 vs time from start (hours)
Figure 8. Acceleration (5 second exponential averaged) from accelerometer z-axis (body up) (blue) and PPP GNSS, up axis (red) for approach 2 vs time from start (hours)
Figure 9 shows the normalized autocorrelation of the IMU acceleration for the first two approaches, with 5 second exponential averaging. The figure shows the (1/e) decorrelation times which range from 2.5 to 3.2 seconds for the approaches. Figure 10
Turn
0.5 m/s2 or 0.05 g
0.5 m/s2 or 0.05 g
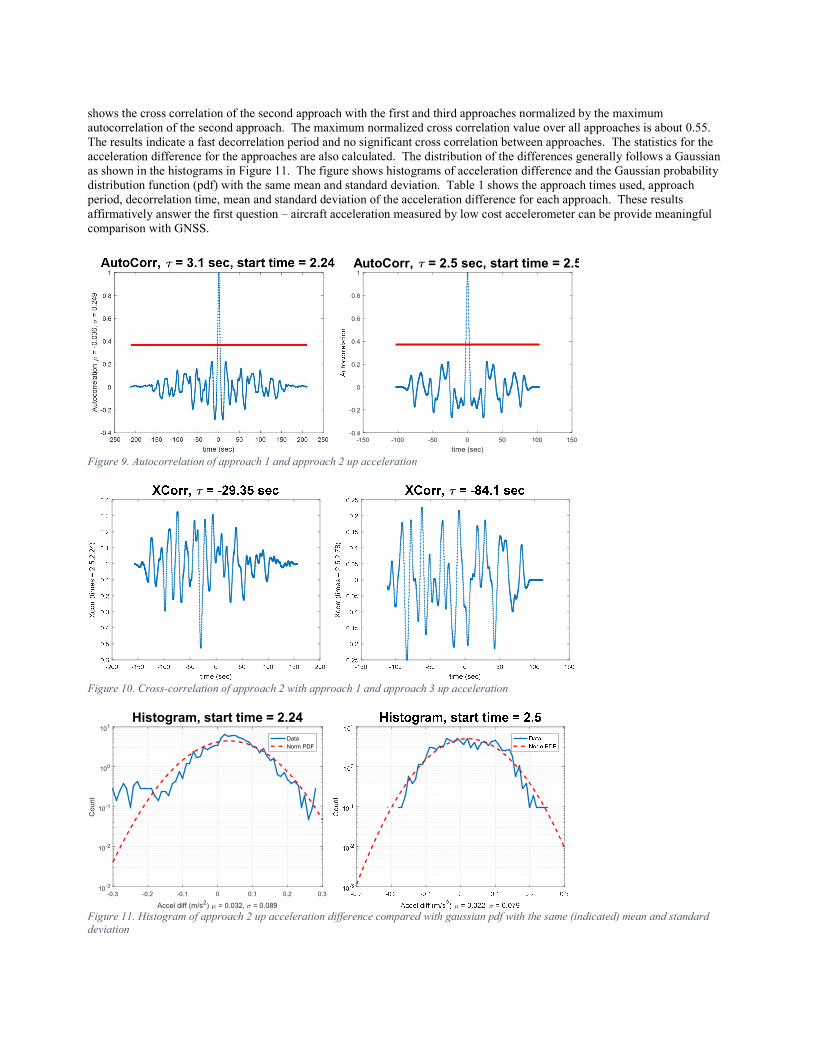
shows the cross correlation of the second approach with the first and third approaches normalized by the maximum autocorrelation of the second approach. The maximum normalized cross correlation value over all approaches is about 0.55. The results indicate a fast decorrelation period and no significant cross correlation between approaches. The statistics for the acceleration difference for the approaches are also calculated. The distribution of the differences generally follows a Gaussian as shown in the histograms in Figure 11. The figure shows histograms of acceleration difference and the Gaussian probability distribution function (pdf) with the same mean and standard deviation. Table 1 shows the approach times used, approach period, decorrelation time, mean and standard deviation of the acceleration difference for each approach. These results affirmatively answer the first question – aircraft acceleration measured by low cost accelerometer can be provide meaningful comparison with GNSS.
Figure 9. Autocorrelation of approach 1 and approach 2 up acceleration
Figure 10. Cross-correlation of approach 2 with approach 1 and approach 3 up acceleration
Figure 11. Histogram of approach 2 up acceleration difference compared with gaussian pdf with the same (indicated) mean and standard deviation
-150 -100 -50 0 50 100 150
time (sec)
-0.4
-0.2
0
0.2
0.4
0.6
0.8
1AutoCorr, = 2.5 sec, start time = 2.5
-0.3 -0.2 -0.1 0 0.1 0.2 0.3
Accel diff (m/s2) = 0.032, = 0.089
10-3
10-2
10-1
100
101
Co
unt
Histogram, start time = 2.24
DataNorm PDF

Table 1. Comparsion of the acceleration autocorrelation and the statistics of the acceleration difference for each approach
Approach 1 2 3 4 Times (hr from start) 2.24 – 2.30 2.5 – 2.53 2.78 – 2.815 2.98 – 3.015 Duration (min) 3.6 1.8 2.1 2.1 Decorrelation time (s) 3.1 2.5 2.5 3.1 Mean diff 0.032 0.022 0.025 0.097 St dev diff 0.089 0.079 0.065 0.07
We also examined the noise on the acceleration measurements from the accelerometer and GNSS. Figure 12 shows static, unaveraged measurements of the acceleration from both sources over a 14 second period. The accelerometer showed a mean (µ) and standard deviation (σ) of -0.03 and 0.027 m/s2. The PPP GNSS was zero mean with a standard deviation of 1.198 m/s2. These statistics are used as the basis of our model bounding variance for the statistical spoof detection tests. With 5 second exponential averaging, the z-axis accelerometer has mean of -0.03 m/s2 and standard deviation of 0.003 m/s2. Similarly, PPP up acceleration was zero mean with 0.028 m/s2 standard deviation.
Figure 12. Static z-axis or up acceleration (no averaging) measured by accelerometer (blue) and PPP GNSS (red) vs time from start (hours)
ANALYSIS OF DETECTION AND FALSE ALERTS
The previous section demonstrated two important qualities. First, low cost accelerometers, not coupled to GNSS, are accurate enough to provide corroborative information to the GNSS-derived movement for aircraft approach. Second, aircraft approaches present useful acceleration signatures that can be used like a cryptographic one-time pad to foil spoofing. The next step is to develop a test for spoofing that can provide robust detection with low probability of false alert. A basic test was developed using just one axes (vertical) and standard statistical testing to demonstrate feasibility. The acceleration comparison suggests that using vertical acceleration (z-axis on the accelerometer/IMU and up on GNSS) provides the best information. In future development, other axes and/or sensors (gyroscopes) may be used either independently or in combination.
Two test statistics are examined and standard hypothesis tests are used to develop monitors based on each test statistic. The first statistic uses the difference in acceleration as measured by GNSS and accelerometer. A spoofed GNSS should experience different accelerations than those measured by the accelerometer. The second statistic uses the standard deviation of the acceleration difference. This should be larger than the expected/nominal value when the accelerations between the two sensors are not well matched. The second test is less sensitive to a large, relatively constant bias, such as due to axes misalignment due to roll. It may be more sensitive to other errors depending on the parameters used.
0.035 0.0355 0.036 0.0365 0.037 0.0375 0.038 0.0385 0.039
Time since start (hr); Start 24-Aug-2016 06:51:47
-5
-4
-3
-2
-1
0
1
2
3
4
5
Acc
el [m
/s2]
Z Acceleration (no smoothing) from Accel & PPP GPS on 08/24/16
Accel ( = -0.03 = 0.027)PPP ( = 0 = 1.198)

The first test statistic, z, is shown in Equation (5). It examines the mean difference of acceleration (ȳ) normalized by the model standard deviation, σ. It also accounts for the effect of the maximum nominal bias b. The max function used to incorporate the bias since its sign is not known. The statistic should be bounded by a standard normal distribution provided the model standard deviation and nominal bias are representative. Hence, our threshold test is to flag if z > zthres. For a 10-9 probability of false alert (Pfa), zthres is 6.1. The second test statistic, χ2, is shown in Equation (6) with n being the number of samples examined, s2 and σ2 being the sample and model variances. For the initial analysis, n = 8 samples are used to generate the sample variance. The statistic is (central) χ2 distributed with (n-1) degrees of freedom (dof). Similarly, our threshold test is to flag when χ2 > with being 55.87 for 10-9 and dof equaled to 7 (since n = 8). Both statistics depend the model standard deviation, σ, of the acceleration difference. As such, incorrect modeling affects the monitor performance. If σ is too large, then there will be a larger missed detection rate than modeled. Given the steady state nature of the developed spoof detector, this may be acceptable as there are many chances to catch the spoofer. If σ is too small, than the false alert rate will be higher than expected. This is the worse outcome as it may lead the user not to trust the system. So it is better to err on the side of slightly too large. For our testing, the exponential average values are used for the test statistics. The model standard deviation, σ, used is 0.06 m/s2 which is about twice the root sum squared (rss) of the standard deviation of the accelerometer and GNSS acceleration, as found in the static test. As the exponential average is used, the static exponential average standard deviations are used. This is shown in Equation (7). A test bias, b, of 0.03 m/s2 and n = 8 samples are used.
=,
(5)
= (6)
= 2 , + , (7)
The statistical test monitors provide the basic building blocks of the spoof detection architecture. There are several considerations that the architecture must address. One important consideration is minimizing false alerts. Each test may get triggered in non-spoofing situations if our assumptions are not well met. For example, un-modeled attitude can cause large differences in the z-axis accelerometer and up GNSS acceleration. Another consideration is that the tests will not trigger during every instant where there is spoofing. For example, the first test will not trigger if the spoofed acceleration happens to match the actual acceleration within the error tolerances. This can happen purely by chance or if the acceleration does not vary much and hence is easy for the spoofer to predict. The architecture should be designed to be robust to these issues. A moving observation window is used primarily to reduce false alerts though it also aids overall detection. Initially a 5 second window, 50 observations at 10 Hz, is chosen since this is larger than the decorrelation time and equal to the exponential averaging time. Within the window, we mandate that a test must flag multiple times for the monitor to trigger its alert. The alert is triggered if the number of flagged instances in the observation window exceeds a threshold. The thresholds may differ for different tests and conditions. While the monitor may trigger, the spoof detection architecture may require corroboration from other monitors to issue an alert to the user. This is to limit false alerts as some monitors may trigger due to some normal conditions. For example, the mean difference test may flag on slow varying biases which may be normal due to attitude changes whereas the χ2 test should not. As multiple monitors may need trigger to result in a spoofing alert, the observation window is useful for detection as both tests may not trigger at the exact same time. Figure 13 shows a general architecture for the spoof detection.
The two monitors provide information for the executive monitor to decide if spoofing is detected. A simple executive monitoring (EM) is to indicate spoofing if both detectors indicate spoofing by having their moving sums, Σ1 and Σ2, respectively, each exceed a threshold value, Σthres. A more nuanced way is to let the EM leverage the strengths of each test. The EM may alert for each of several different conditions. We developed a multi-condition EM that alerts if the simple EM conditions are met or if χ2 test triggered at a higher threshold, Σthres,2 only. This allows us to leverage the power of the χ2 monitor to detect spoofing even when the mean difference test is oblivious to it. Mean difference test will not flag for acceleration differences that vary by a small shift in time whereas the χ2 test could flag variation changes. These example executive monitors are shown in Figure 14.

Figure 13. Spoof detection architecture using 2 test statistics
Figure 14. Two example of possible executive monitor processing: Simple and Multi-condition
To test the spoof detection architecture, both no spoofing (nominal) and simulated spoofing cases are examined. The nominal case tests the probability of false alert. Testing the nominal case is straightforward and is done with the collected data without modification. To test the spoofing case, we need on model the effect of the spoofer on our detectors. So rather than model the spoofing signal, we only need model the acceleration resulting from the spoofing signal. The acceleration that a spoofer can predict determines the ability of the spoofer to defeat the detector. An unsophisticated spoofer may have no knowledge of acceleration and hence its best guess is to assume zero acceleration in the vertical. A sophisticated, worst case spoofer would accurately know the true GNSS acceleration with a small delay and could generate a spoofed GNSS exhibiting any acceleration profile. With knowledge of the true acceleration, they can try to produce accelerations to fool the spoof detection architecture. They can do this in a couple of ways: 1) repeat back (delay attack), 2) extrapolate, or 3) extrapolate and smooth the acceleration. Hence to test the design, a delayed version of the true PPP acceleration is used to represent a spoofed acceleration profile. This is an extreme spoofing scenario as the spoofer only cares to spoof the acceleration profile without regard to the actual spoofed position. An actual attack would be constrained by the need to generate its spoofed positions.
Figure 15 shows an example of accelerations used to test the first scenario. The figure shows the acceleration as indicated by the accelerometer, nominal PPP GNSS, and spoofed GNSS. The spoofed case shown assumes that the nominal PPP acceleration is known with a 2 second delay and a spoofed signal is generated with that acceleration (repeat back). Figure 16 and Figure 17 show the acceleration difference (IMU minus GNSS or spoofed GNSS, top) and performance of each monitor
GNSS vertical acceleration
Accel. vertical gravity corrected acceleration
Mean difference monitor
Acceleration difference (y)
Standarddeviation monitor
Moving sum (Σ2)
Moving sum (Σ1)
Spoof Detected
Yes
No
No Spoof Indicated
Executive monitor
Spoof Detected
Yes
No
No Spoof Indicated
Std diff (Σ2) > Σthres
Mean diff (Σ1) > Σthres
AND
Simple EM
(Σ2) > Σthres
(Σ1) > Σthres
ANDΣ2 >
Σthres,2 only
OR
Multi-Condition EM
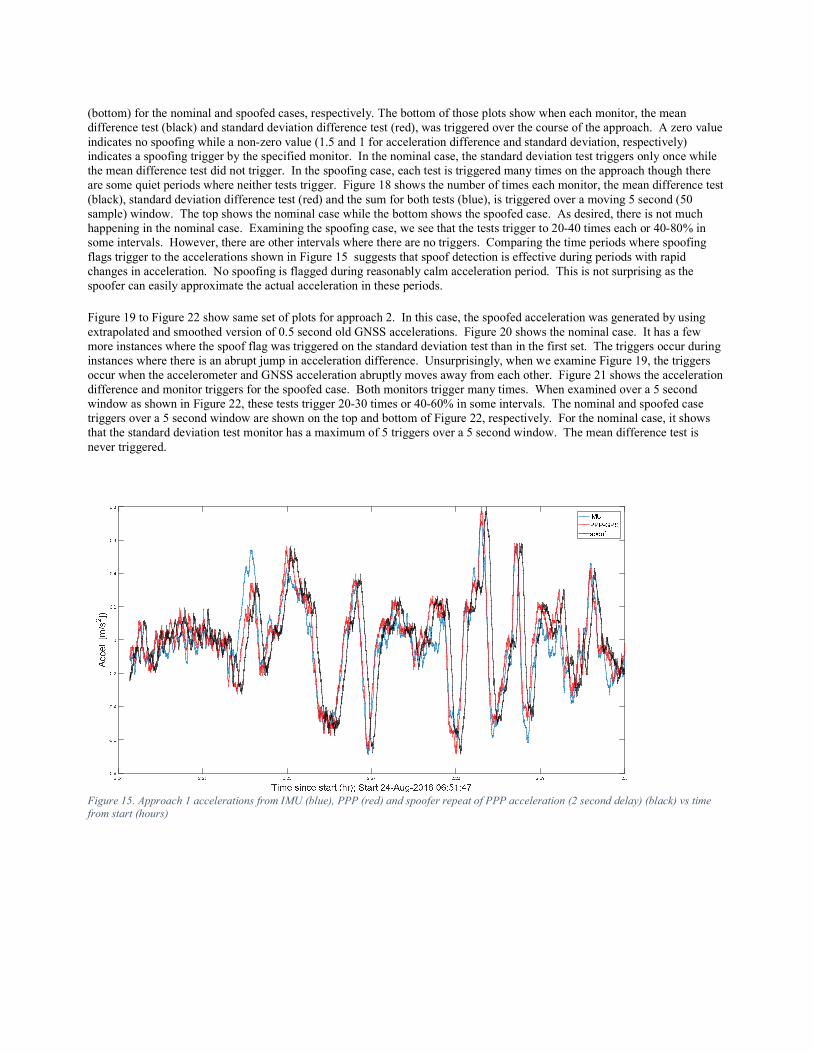
(bottom) for the nominal and spoofed cases, respectively. The bottom of those plots show when each monitor, the mean difference test (black) and standard deviation difference test (red), was triggered over the course of the approach. A zero value indicates no spoofing while a non-zero value (1.5 and 1 for acceleration difference and standard deviation, respectively) indicates a spoofing trigger by the specified monitor. In the nominal case, the standard deviation test triggers only once while the mean difference test did not trigger. In the spoofing case, each test is triggered many times on the approach though there are some quiet periods where neither tests trigger. Figure 18 shows the number of times each monitor, the mean difference test (black), standard deviation difference test (red) and the sum for both tests (blue), is triggered over a moving 5 second (50 sample) window. The top shows the nominal case while the bottom shows the spoofed case. As desired, there is not much happening in the nominal case. Examining the spoofing case, we see that the tests trigger to 20-40 times each or 40-80% in some intervals. However, there are other intervals where there are no triggers. Comparing the time periods where spoofing flags trigger to the accelerations shown in Figure 15 suggests that spoof detection is effective during periods with rapid changes in acceleration. No spoofing is flagged during reasonably calm acceleration period. This is not surprising as the spoofer can easily approximate the actual acceleration in these periods.
Figure 19 to Figure 22 show same set of plots for approach 2. In this case, the spoofed acceleration was generated by using extrapolated and smoothed version of 0.5 second old GNSS accelerations. Figure 20 shows the nominal case. It has a few more instances where the spoof flag was triggered on the standard deviation test than in the first set. The triggers occur during instances where there is an abrupt jump in acceleration difference. Unsurprisingly, when we examine Figure 19, the triggers occur when the accelerometer and GNSS acceleration abruptly moves away from each other. Figure 21 shows the acceleration difference and monitor triggers for the spoofed case. Both monitors trigger many times. When examined over a 5 second window as shown in Figure 22, these tests trigger 20-30 times or 40-60% in some intervals. The nominal and spoofed case triggers over a 5 second window are shown on the top and bottom of Figure 22, respectively. For the nominal case, it shows that the standard deviation test monitor has a maximum of 5 triggers over a 5 second window. The mean difference test is never triggered.
Figure 15. Approach 1 accelerations from IMU (blue), PPP (red) and spoofer repeat of PPP acceleration (2 second delay) (black) vs time from start (hours)

Figure 16. Approach 1 nominal case, acceleration difference (IMU – PPP GPS) [top plot] and spoof indication from each test statistics (black = mean difference, red = standard deviation of difference) [bottom plot] vs time from start (hours)
Figure 17. Approach 1 spoofed case with spoofer repeating PPP acceleration with 2 second delay. Acceleration difference (IMU – PPP GPS) [top plot] and spoof indication from each test statistics (black = mean difference, red = standard deviation of difference) [bottom plot] vs time from start (hours)
Accel Diff
Spoof Monitors Flag
No Alert Flag
Alert Flag
Accel Diff
Spoof Monitors Flag
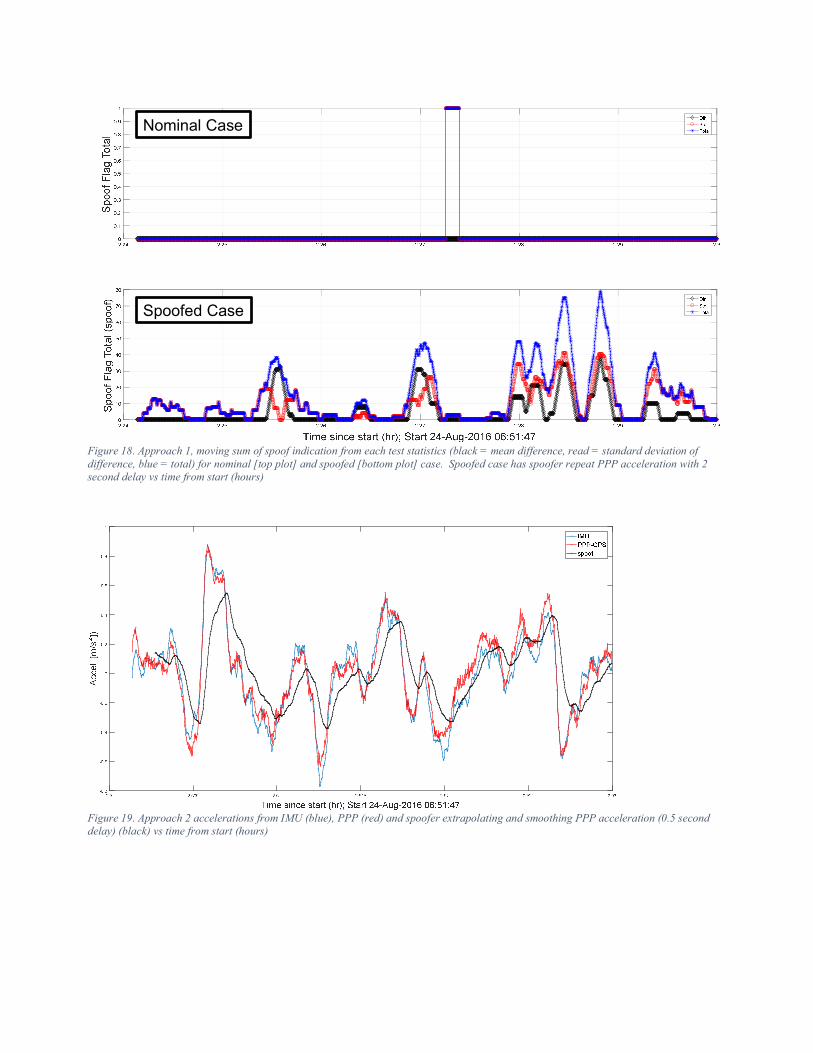
Figure 18. Approach 1, moving sum of spoof indication from each test statistics (black = mean difference, read = standard deviation of difference, blue = total) for nominal [top plot] and spoofed [bottom plot] case. Spoofed case has spoofer repeat PPP acceleration with 2 second delay vs time from start (hours)
Figure 19. Approach 2 accelerations from IMU (blue), PPP (red) and spoofer extrapolating and smoothing PPP acceleration (0.5 second delay) (black) vs time from start (hours)
Nominal Case
Spoofed Case

Figure 20. Approach 2 nominal case, acceleration difference (IMU – PPP GPS) [top plot] and spoof indication from each test statistics (black = mean difference, red = standard deviation of difference) [bottom plot] vs time from start (hours)
Figure 21. Approach 2 spoofed case with spoofer extrapolating and smoothing PPP acceleration with 0.5 second delay. Acceleration difference (IMU – PPP GPS) [top plot] and spoof indication from each test statistics (black = mean difference, red = standard deviation of difference) [bottom plot] vs time from start (hours)
Accel Diff
Spoof Monitor Flag
Accel Diff
Spoof Monitor Flag

Figure 22. Approach 2, moving sum of spoof indication from each test statistics (black = mean difference, read = standard deviation of difference, blue = total) for nominal [top plot] and spoofed [bottom plot] case. Spoofed case has spoofer extrapolating and smoothing PPP acceleration with 0.5 second delay vs time from start (hours)
Table 2 shows a summary of the results for the simple and for the multi-condition EMs from Figure 14 with a threshold, Σthres, of 6% or 3 total monitor flags in a 50 sample monitor window. For the multi-condition EM, the Σthres,2 used is 12% or 6 flagged instances. The table shows the percent of time spoofing is alerted by each EM and time from start to first detection presented for all four approaches and for 8 different cases: nominal, a spoofer with no knowledge (and assumes zero acceleration) and the three spoofing cases previously mentioned. The three spoofing cases are conducted with 0.5 and 2 second GNSS information delay. In the table, any non-zero detection percentage indicates that the EM has generated a spoofing alert during the approach. Hence, the multi-condition EM catches all simulated spoofing cases shown. Additionally, the monitor flags within about 13 seconds of the start of the approach and spoofing with the exception of approach 1. This time to first detection (TFD) is a function not just of the monitor but also of the dynamics of the aircraft. Without some variation in motion, it is easy for an attacker to predict the acceleration profile and hence remain concealed to the monitor. As seen in Figure 15, approach 1 does not have much vertical acceleration variation initially. Hence it has high TFD. The simple EM can catch the longer delay (2 second) spoofing attack but with a larger TFD. With a shorter delay, the simple EM may not detect throughout the entire approach as the acceleration difference monitor never alerts. This is because the acceleration is continuous and does not change rapidly over a short period of time. Thus, with very small delays, difference between the actual and spoofed acceleration can be small and always remains within the tolerances specified by the low probability of false alert.
Another key result is that there are no false alerts in any case with the exception of approach 4 with the multiple condition EM. Examining the cause of the false alert, it was found to be due to drop outs in the GNSS measurements which caused outlier GNSS accelerations for a few seconds. The result of the drop out, which was exponentially averaged with other measures, can be seen in Figure 23 which shows the accelerations from the accelerometer, GNSS and spoofer. This triggered the standard deviation monitor. Hence, the false alert was due to a data issue rather than the monitor itself. The detection architecture should be designed to manage data handling errors.
The results also show that “extrapolate (without smoothing)” is generally a bad strategy for the spoofer, especially if they have a large delay on the GNSS acceleration information. It turns out that repeat back is not too bad and can be better than extrapolate and smooth. Finally, the rate or percentage of time spoofing is detected varies from approach to approach. The same is true for time to first alert or detection. Again, this is due to the different acceleration profiles. Approaches having
Nominal
Spoofed

more high frequency and high amplitude accelerations result in better detection. In all, the results show that, at least for the test conditions, spoof detection can be accomplished without triggering false alerts. The methodology operates in steady state allowing for detection throughout the approach.
Table 2. Spoof detection performance (percentage of time detected, time to first detect from beginning of data set) of simple detection architecture for the 4 approaches. 6 cases of spoofing (3 with information delays of 0.5 and 2 seconds, respectively) and nominal (no spoofing) case shown.
Scenario Percent Detection (Simple EM)
Percent Detection (Multi-condition EM)
Time to 1st Detect (sec) (Simple EM)
Time to 1st Detect (sec) (Multi-condition EM)
1 2 3 4 1 2 3 4 1 2 3 4 1 2 3 4
Nominal 0 0 0 0 0 0 0 3.7 N/A N/A N/A N/A N/A N/A N/A 44.9
Zero Accel 22.5 35.5 19.7 22.4 28.7 49.4 44.7 35.6 53.3 11.3 0.5 1.0 53.3 10.6 0.5 0.7
Repeat (.5 sec)
0 0 0 0 14.2 50.3 18.0 24.4 N/A N/A N/A N/A 32.3 8.4 12.5 2.7
Extrapolate 0.9 0 0 0 99.7 99.4 99.5 99.3 48.8 N/A N/A N/A 0.7 0.7 0.7 0.9
Extrapolate & Smooth
14.8 17.9 4.3 13.3 23.8 49.1 37.3 27.8 53.2 14.6 92.4 55.3 42 10.7 9.9 12.9
Repeat (2 sec) 28.2 41.2 41.4 33.4 49.5 84.3 84.4 68.4 46.8 11.2 0.6 3.6 3.4 1 0.6 2.6
Extrapolate 97.6 99.7 99.8 98.5 99.7 99.7 99.8 99.5 1.9 0.4 0.4 1.9 0.7 0.4 0.4 0.7
Extrapolate & Smooth
28.7 40.9 25.6 30.8 40.4 70.6 67.61 64.2 47 11.2 7.3 6.3 28.9 9.5 6.6 6.3
Figure 23. Acceleration comparison for approach 4. Spoof detector triggered by drop outs in PPP around 45 seconds from start of plot vs time from start (hours)
Acc
el
[m/s
2])

FUTURE WORK & OTHER APPLICATIONS The results provide good indication that low cost IMU can be useful for spoof detection during critical phases of flight. The analysis conducted provide only a preliminary feasibility demonstration and there is still much to be done. Better modeling of the error is needed to obtain an accurate model of the standard deviation of acceleration difference. This also means modeling actual avionics GNSS outputs (velocity) rather than the PPP used. Another work area is fault-tolerant design. For example, the detection architecture needs to determine when it is suitable for use. This means to being able to determine when the attitude assumptions are valid or not. The determination may use other measurement either other acceleration axes or rotation rates. Another major work area is an optimal architecture for spoof detection both in terms of test statistics but also in terms of what measurements to use. In the study, only vertical acceleration is used which means a lot of potentially useful measurements such as along track and cross track acceleration are being thrown away. A natural question is how applicable is the technique to other modes of transportation. The analysis conducted leverages some special characteristics of flight. It is fortunate that, for aviation, there are high frequency, high amplitude (relative to the noise error level) acceleration signatures that can be used. For railways and automobiles, one does not expect large accelerations in the vertical. Indeed, our measurement of railway acceleration show that the vertical acceleration to be small and vehicle dependent. For spoof detection, the latter is useful while the former presents a challenge. Others have shown some track dependency [33]. This data suggests that using vertical rail acceleration for spoof detection requires more research to determine feasibility. However, automobile and rail have other characteristics that can be leveraged. They have generally stable or predictable attitude. They make frequent stops which allows for calibration of the IMU without aid of GNSS using techniques like zero velocity updates. Additionally, user input, from a human or autonomous driver, may not be predictable by a spoofer and may also present a difficult to predict source of acceleration. This concept has been explored in the aircraft setting whose autopilot is presumably much simpler than one that would be employed in automobiles [29].
Figure 24. Along track acceleration (accelerometer) as a function of distance along the track for the Caltrain. Trains on multiple days are used with the trains running on the same schedule vs time from start (hours)
Hence, other accelerations may be useful. Figure 24 shows the along track acceleration of Caltrain, a commuter railway that runs between San Francisco and San Jose, as measured by the aforementioned Galaxy Note 3 plotted as a function of distance along the track. The acceleration is reasonably consistent but there are variations between each trip, sometimes in the neighborhood of 0.1 m/s2. These accelerations are due to essentially piloting variations. The level is measurable by GNSS and

accelerometers to measure. Several other railway characteristics can be helpful. First, attitude and alignment is not a major issue as the attitude for each point on the rail can be known a priori. Second, spoof detection likely does not need to be continuous as rail often has other sensors such as wheel counter. So the spoof detection system only need to be able to detect in a few places. Of course, this is just preliminary and many variations in system set up (such automatic controls) can make the detection easier or more challenging. Additionally, automobiles and rail also encounter high multipath environments which can pose a challenge for robust spoof detection and minimizing false alerts. It needs to discriminate between spoofing and high multipath situations.
CONCLUSIONS This paper introduced, developed and demonstrated the feasibility of a GNSS spoof detection technique based on low cost accelerometers that can robustly detect spoofing on a variety of worldwide transportation systems (aviation, railways and automobile). The technique differs from previous use of IMU in its architecture by employing a direct comparison of acceleration. The comparison does not commingle GNSS and IMU measurements so that it is always possible to compare a measurement derived purely from each sensor (GNSS or IMU). This allows for continual detection and an unlimited detection window. This IMU based monitor can be implemented with and can complement other IMU based spoof detection such as those using position domain comparisons. The paper presented and demonstrated unique random vertical accelerations experienced on aircraft approach. These accelerations were then used as the basis for a simple and multi-condition executive monitor for spoofing. These EMs demonstrated their spoof detection capabilities and their ability to limit false alerts using collected flight test data. Preliminary results show that monitoring can be designed to detect spoofing on all four approaches tested. Time to first detect depends on both the monitor design and aircraft dynamics. Fast detection (< 10 seconds) can be achieved but high amplitude and frequency accelerations are desirable. Many more flights will be needed to validate the performance results. Finally, the paper discussed the use of different acceleration signatures for rail and automobile. It showed the accelerations experienced in a railcar over numerous trials and demonstrates unique properties that can be used despite traversing the same route and schedule.
ACKNOWLEDGMENTS The authors would like to thank FAA Navigation Programs and the Stanford Center for Position Navigation and Time (SCPNT) for supporting this work. We would also like to acknowledge the FAA Technical Center and Stuart Riley of Trimble Navigation.
DISCLAIMER The views expressed herein are those of the authors and are not to be construed as official or reflecting the views of the Federal Aviation Administration or Department of Transportation.
REFERENCES [1] W. Dunkel, O. Weber, F. Butsch, "GNSS Interference Detection with GIMOS," 11th Int'l. GBAS Working Group Meeting
(I-GWG-11), Osaka, Japan, Feb. 24, 2011. http://preview.tinyurl.com/DFS-main
[2] S. Pullen, G. Gao, “The Impact of Uninformed RF Interference on GBAS and Potential Mitigations,” Proceedings of the ION International Technical Meeting (ITM), Newport Beach, California, January 2012
[3] A. Grant, P. Williams, N. Ward, S. Basker “GPS Jamming and the Impact on Maritime Navigation,” Journal of Navigation
62(02) · April 2009 DOI: 10.1017/S0373463308005213
[4] A.J. Van Dierendonck, “GPS Re-Radiator Issues”, Presentation to the US GPS Industry Council, October 2005
[5] J. S. Warner, R. G. Johnston, "Think GPS Offers High Security? Think Again!", Talk for the Business Contingency Planning Conference, May 23-27, 2004 (Las Vegas, NV)
[6] D. P. Shepard, J. A. Bhatti, T. E. Humphreys, A. A. Fansler, "Evaluation of Smart Grid and Civilian UAV Vulnerability
to GPS Spoofing Attacks," Proceedings of the 25th International Technical Meeting of The Satellite Division of the Institute of Navigation (ION GNSS 2012), Nashville, TN, September 2012, pp. 3591-3605.
[7] C. Sebastian, “Getting lost near the Kremlin? Russia could be 'GPS spoofing',” CNN Tech, Dec 2 2016
http://money.cnn.com/2016/12/02/technology/kremlin-gps-signals/index.html
[8] I. Birnbaum, “'Pokémon Go' Players Are Spoofing GPS Locations to Catch' Em All,” Motherboard, Jul 8, 2016, https://motherboard.vice.com/en_us/article/pokmon-go-cheating-gps
[9] L. Huang, Q. Yang, “GPS Spoofing, Low cost GPS Simulator,” DEFCON 23, August 2015
[10] E. L. Key, “Techniques to Counter GPS Spoofing. Internal memorandum,” USA: MITRE Corporation, Feb. 1995.
[11] Mark L. Psiaki and Todd E. Humphreys, "GNSS Spoofing and Detection," Proceedings of the IEEE, 2016. [12] Yu-Hsuan Chen, Sherman Lo, Dennis Akos, David De Lorenzo, Per Enge, "Getting Control: Off-the-Shelf Antennas for
Controlled-Reception-Pattern Antenna Arrays," Innovation Column, GPS World, February 2013 [13] Yu-Hsuan Chen, Jyh-Ching Juang, Jiwon Seo, David S. De Lorenzo, Sherman Lo, Per Enge, Dennis Akos “Design and
Implementation of Real-time Software Radio for GPS/WAAS Controlled Reception Pattern Antenna Array Adaptive Processing”, Sensors (2012), Sensors 2012, 12(10), 13417-13440; doi:10.3390/s121013417, http://www.mdpi.com/1424-8220/12/10/13417
[14] Emily McMilin, “Single Antenna Null-Steering for GPS & GNSS Aerial Applications,” Ph.D. Dissertation, Stanford
University, March 2016 [15] Yu Hsuan Chen, Fabian Rothmaier, Dennis Akos, Sherman Lo, Per Enge, “Towards a Practical Single Element Null
Steering Antenna,” Proceedings of the Institute of Navigation International Technical Meeting, Monterrey, CA, January 2017
[16] H. Borowski, O. Isoz, F. M. Eklöf, S. Lo, D. Akos, “Detection of False GNSS Signals using AGC,” GPS World, April 2012
[17] Jason Gross, Todd E. Humphreys, “GNSS Spoofing, Jamming, and Multipath Interference Classification using a
Maximum-Likelihood Multi-Tap Multipath Estimator,” ION ITM, Monterey Jan 2017.
[18] Sherman Lo, David DeLorenzo, Per Enge, Dennis Akos, Paul Bradley, “Security for Civil GNSS,” InsideGNSS, September/October 2009
[19] P. Levin, D. S. De Lorenzo, P. K. Enge, S. C. Lo, “Authenticating a signal based on an unknown component thereof,”
June 28 2011, US Patent # 7,969,354.
[20] J. Diesel, J. King, “Integration of navigation systems for fault detection, exclusion, and integrity determination—without WAAS,” Proceedings of the ION National Technical Meeting, 1995
[21] J. Diesel, G. Dunn, “GPS/IRS AIME: Certification for Sole Means and Solution to RF Interference,” Proceedings of the
9th International Technical Meeting of The Satellite Division of the Institute of Navigation (ION GPS 1996), Kansas City, Missouri, September 1996.
[22] J. Waid, B. Fly, “Tactical HIGH™ - Solution Separation Methods Applied to the Warfighter Environment,” Proceedings
of the ION 60th Annual Meeting, 2004, Dayton, Ohio.
[23] Yang Liu, Qiangwen Fu, Zhenbo Liu, Sihai Li, “GNSS Spoofing Detection Ability of a Loosely Coupled INS/GNSS Integrated Navigation System for Two Integrity Monitoring Methods,” Proceedings of the ION International Technical Meeting (ITM), Monterey, CA, January 2017.
[24] P. F. Swaszek, S. A. Pratz, B. N. Arocho, K. C. Seals, R. J. Hartnett, "GNSS Spoof Detection Using Shipboard IMU
Measurements," Proceedings of the 27th International Technical Meeting of The Satellite Division of the Institute of Navigation (ION GNSS+ 2014), Tampa, Florida, September 2014, pp. 745-758.
[25] S. Khanafseh, N. Roshan, S. Langel, F-C. Chan, M. Joerger, B. Pervan, "GPS Spoofing Detection Using RAIM with INS
Coupling," Proceedings of Proceedings of the Institute of Navigation/IEEE Position Location and Navigation Symposium (PLANS), Monterey, CA, May 2014, pp. 1232-1239.
[26] C. Tanil, S. Khanafseh, M. Joerger, B. Pervan, "Kalman Filter-based INS Monitor to Detect GNSS Spoofers Capable of
Attacking Aircraft Position," Proceedings of the Institute of Navigation/IEEE Position Location and Navigation Symposium (PLANS), Savannah, GA, April 2016, pp. 1027-1034.
[27] C. Tanil, S. Khanafseh, B. Pervan, "An INS Monitor Against GNSS Spoofing Attacks During GBAS and SBAS-assisted
Aircraft Landing Approaches," Proceedings of the 29th International Technical Meeting of The Satellite Division of the Institute of Navigation (ION GNSS+ 2016), Portland, Oregon, September 2016, pp. 2981-2990.
[28] C. Tanil, S. Khanafseh, B. Pervan, "Impact of Wind Gusts on Detectability of GPS Spoofing Attacks Using RAIM with
INS Coupling," Proceedings of the ION 2015 Pacific PNT Meeting, Honolulu, Hawaii, April 2015, pp. 674-686. [29] C. Tanil, S. Khanafseh, B. Pervan, "GNSS Spoofing Attack Detection using Aircraft Autopilot Response to Deceptive
Trajectory," Proceedings of the 28th International Technical Meeting of The Satellite Division of the Institute of Navigation (ION GNSS+ 2015), Tampa, Florida, September 2015, pp. 3345-3357.
[30] Sherman Lo, Yu Hsuan Chen, Andrew Barrows, Tyler Reid, Adrien Perkins, Shau Shiun Jan, Per Enge, "Using Traffic
Information Services Broadcast (TIS-B) Signals for Aviation Navigation," Proceedings of the Institute of Navigation/IEEE Position Location and Navigation Symposium (PLANS), Savannah, GA, April 2016
[31] S. Manickam, K. O'Keefe, "Using Tactical and MEMS Grade INS to Protect Against GNSS Spoofing in Automotive Applications," Proceedings of the 29th International Technical Meeting of The Satellite Division of the Institute of Navigation (ION GNSS+ 2016), Portland, Oregon, September 2016, pp. 2991-3001.
[32] Ryan J.R. Thompson, Ediz Cetin, Andrew G. Dempster, "Evaluation of Relative GPS Timing Under Jamming
Conditions," Proceedings of the 25th International Technical Meeting of The Satellite Division of the Institute of Navigation (ION GNSS 2012), Nashville, TN, September 2012, pp. 717-730.
[33] O. Heirich, P. Robertson, A. C. Garcia, T. Strang, “Bayesian Train Localization Method Extended By 3D Geometric Railway Track Observations From Inertial Sensors,” 15th International Conference on Information Fusion, July 2012
[34] M. Brenner, “Integrated GPS/Inertial Fault Detection Availability,” Navigation - Journal of the Institute of Navigation,
1996, 43(2):111-130. [35] D. Last, A. Grant, N. Ward, “Demonstrating the Effects of GPS Jamming on Marine Navigation,” 3rd GNSS
Vulnerabilities and Solutions Conference, 5-8 September, 2010, Baška, Krk Island, Croatia


![Khenar, Mohammad; Hosseini, SeyedKazem; Taheri, Shamsodin ... · 362 sdu vzdup rswlpl]dwlrq uhi hiihfwly judlq udglxv ψ ghflvlrq yhfwru ri 362 s lqhu zhljkw ?1 , ?2 dffhohudwlrq](https://img.dokumen.tips/doc/110x75/60a3fdd19633fd13623686c5/khenar-mohammad-hosseini-seyedkazem-taheri-shamsodin-362-sdu-vzdup-rswlpldwlrq.jpg)


![RF Stability Test of RFQ Cavity with Prototype Low-level ... · WHVW ZLOO EH FRQGXFWHG IRU EHDP DFFHOHUDWLRQ :H ZLOO LPSURYH WKH UHOLDELOLW\ RI //5) DQG RSWLPL]H WKH 3,' FRHIILFLHQWV](https://img.dokumen.tips/doc/110x75/6042a59a870ea863a24b328a/rf-stability-test-of-rfq-cavity-with-prototype-low-level-whvw-zloo-eh-frqgxfwhg.jpg)


![February2020 HIESteeringCommitteeMtg Updated2.23.pptx ... · } u u ] z } o 7kh 6whhulqj&rpplwwhh·v*xlglqj 3ulqflsohv • :h frpplwwr fuhdwlqj dq+,(3odq wkdw lvdffxudwh uholdeohdqgdfwlrqdeoh](https://img.dokumen.tips/doc/110x75/5f8122fceba30363446f4656/february2020-hiesteeringcommitteemtg-updated223pptx-u-u-z-o-7kh-6whhulqjrpplwwhhvxlglqj.jpg)


