Embed Size (px)
Citation preview
17/08/2017
1
Kaushik Roy
SHEQ Manager, DPA & CSOChina Energy Ship Management Co. Ltd.
LNG – The future of Hong Kong
Latest for Hong Kong• Natural gas consumption to grow 3% over 2017-2026
• Gas-fired power's share in the overall mix is likely to surge to 66.4%
• Rising consumption will drive a comparable upsurge in imports
• Strong state backing and availability of funding brighten the outlook
• Deploy an LNG FSRU by 2020 and to import LNG independently
• Hong Kong Climate Action Plan 2030+ outlines the government's intention to substantially reduce coal-fired generation in favour of gas over the coming year
• Above plan responds to Paris Agreement came into force in Nov 2016 and makes HK a better place to live and work
Latest for Hong Kong• Electricity accounts for about 55% of Hong Kong’s total annual energy-end-use
• Coal fired electricity generation will reduce from 48.0% in 2015 to 25.0% in 2020 and further by 2030
• Gas-fired generation to more than double over the next decade
• Gas fired generation share of the total power mix increase from 40.8% to 66.4% in next decade
• Coal fired generation shrinks from 58.2% to 31.8% next decade
• The anticipated surge in gas demand will drive comparable growth in imports
• Hong Kong remains entirely dependent on pipeline gas supplies from China, and will remain so over the short-to-medium term
Supply vs. demand outlook
• Local electricity generation is by far the biggest contributor to carbon emissions making up about 70%
• In 2015, there were 10 gas-fired plants producing 27% of electricity
• By 2020, natural gas will generate 50% of total electricity in HK
• HK emission levels have remained at around 40-45 million tonnes of CO2-e in recent years
• Hong Kong’s emissions will peak by 2020
• HK’s current decarbonisation target to reduce 50% by 2020 using 2005 as the base
• Our 2030 target would take us to 65% to 70% carbon intensity reduction from the 2005 level
• All coal-fired plants will be phased down by next decade
HK Climate Action Plan 2030+
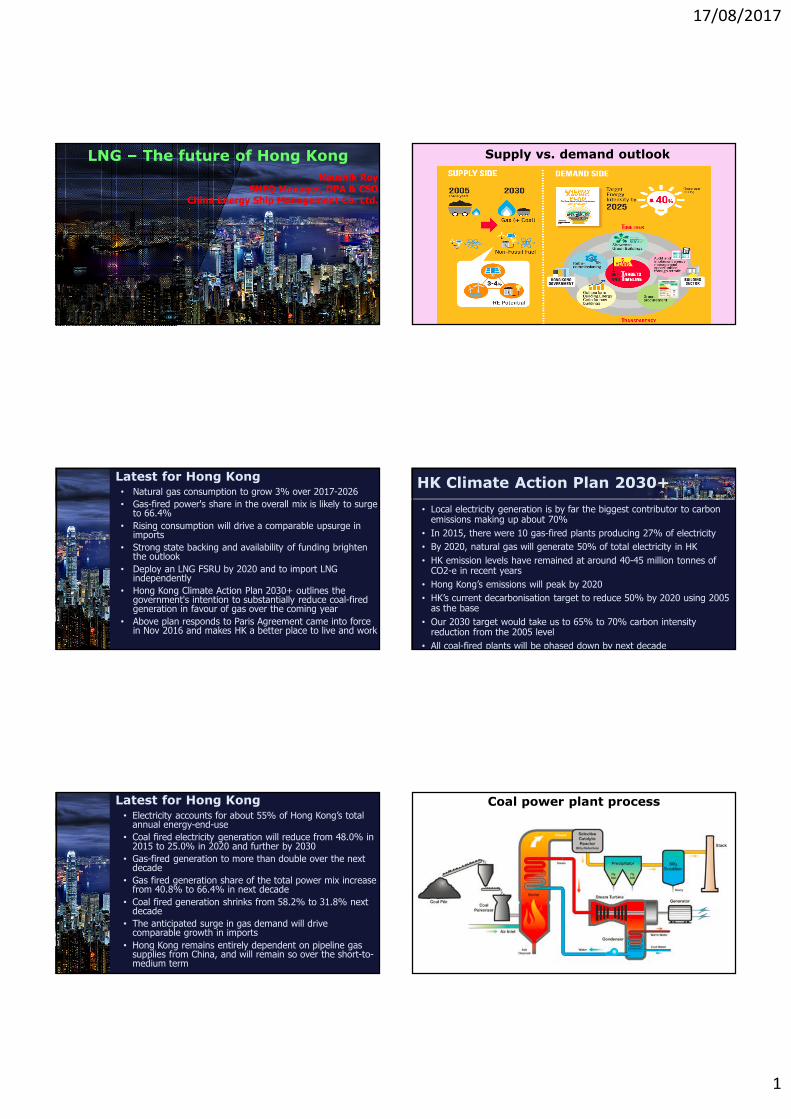
Coal power plant process

17/08/2017
2
Environmental protection by elec companies
• Increase use of fuels, low in ash and sulphur.
• Increase use of natural gas as fuel for the generation of electricity.
• Install flue gas de-sulphurization plant to remove sulphur dioxide.
• Install electrostatic precipitators to remove particulates in the flue gas.
• Sell coal ash for use by the construction and cement industries or store the coal ash in ash lagoons instead of dumping it in landfills.
• Install air monitoring stations at the power plants.
• Recycle oil and solid wastes from the systems in the power plants.
Environmental protection by gas companies
• Increase use of naphtha of low sulphur content for the production of town gas.
• Recycle part of the carbon dioxide produced in the production process of town gas.
• Explore the feasibility of importing natural gas as fuel so that the pollution caused by gas production will be reduced.
Lets start with electricity generation –largest source of local carbon emissions
Limitations of current energy supply to HK
• A nuclear plant has a life of about 40 to 50 years, DayaBay units may continue another two decades and agreement until 2034
• Yacheng gas facilities were originally built to last about 30 years from 1996 and may not supply to HK until 2035
• Current energy supplies cost more, poor air quality, not environmentally sustainable and considerable carbon emissions
• The government has also showed no interest to explore solar, wind energy which can tie-up to the grid.
• Not energy efficient enough
• Unfair competition for technology and cost
• Energy resources are not conserved
HK - Fuel mix in electricity production
Option 1 – Fossil fuels
• Coal : Not suitable for carbon emission reduction and public health
• Oil : Limited storage and price fluctuation and considerable environmental impact
• Natural Gas (LNG) : Best option as environmental friendly, clean, sustainable and cost stabilized. In Hong Kong, natural gas is not available for domestic use, but is used in power stations to produce electricity. Natural gas is imported to Hong Kong in a gaseous state from the YachengGas Field near Hainan Island through a gas pipe under the sea bed.
• Petroleum Gas (LPG) : When natural gas is drawn from a gas well, 90% is methane, the remaining gas is LPG. LPG consists mainly of the hydrocarbons propane and butane. It is also produced as one of the by-products when petroleum is refined. LPG is a gas at room temperature and pressure. When it is stored in a pressurized tank, it is liquefied.

17/08/2017
3
Yacheng – Hong Kong gas pipelines
Option 2 - Non-fossil fuels• Renewable Energy (RE) : Hong Kong does not have favorable conditions for large-scale commercialized generation
• Estimated that Hong Kong has about 3 – 4% RE potential from wind, solar and waste to energy (WTE) by 2030
• RE is more expensive than conventional power
• Electricity from wind turbines and photovoltaic (PV) cells are intermittent and its output is hard to predict
• PV cells can only produce a limited amount of electricity during cloudy days, or where panels are occasionally shaded
• Cost is very high to produce electricity from non-fossil fuels
• Need more space to produce electricity from non-fossil fuels
So above are highly non-reliable, unpredictable with limited options – not suited for a city like Hong Kong
HK energy data
HK energy consumption distribution 2015
HK energy products – oil and coal• The steam coal and other coal, which are mainly used for electricity generation.
• The input of coal and oil products for electricity generation accounted for about 64.9% of Primary Energy requirements or PER in 2016 (66.5% in 2006).
• Between 2011 and 2016, the input of coal products for electricity generation decreased by 9.6%; of oil products increased by 22.2%.
• Indonesia accounted for 86.3% of total imports of steam coal and other coal in 2016.
• Compared with 2015, the quantity of net imports in 2016 increased for aviation gasoline and kerosene (6.7%); gas oil, diesel oil and naphtha (12.1%); and natural gas (2.7%), but decreased for unleaded motor gasoline (-1.9%); fuel oil (-5.3%); and LPG (-4.2%).
• Regarding re-exports of oil products, Macao and the mainland of China remained the major destinations in 2016.
HK energy products – electricity & gas
• Electricity consumption increased by 0.3% in 2016 than in 2015
• Electricity export to China decreased from 7.6% in 2011 to 3.2% in 2016
• Electricity import from China increased 8.3% in 2016, compared to 2011
• Gas consumption increased by 1.4% in 2016 compared to 2015

17/08/2017
4
HK - oil and coal products consumption
HK – Town gas and LPG consumption
Town gas �Dual feedstock – natural gas (50%) and Naphtha (50%)
�Increased reliability
�Naphtha is imported
�LNG is from Chengtoujiao in Shenzhen to Tai Po
Courtesy: CLP Holdings Annual Report 2014
Courtesy: CLP Holdings Annual Report 2014

17/08/2017
5
Courtesy: CLP Holdings Annual Report 2014
Courtesy: CLP Holdings Annual Report 2014
Why LNG is future???• Cleanest fossil fuel
• Contain less CO2 than oil products
• Virtually no nitrogen
• Generates less fine dust during burning
• Completely Sulphur-free
• Affordable
• Available world-wide unlike oils
• Cleaner alternative to oil products
• Available from oil fields, within rocks, coal field, biomass which comes from organic residual flow
• LNG is a sustainable energy supply
Why LNG is future???• The use of LNG instead of oil-based fuels reduces CO2 emissions by up to 20%, SO2 by 100%, NOx by almost 90% and fine dust by 400 to 600 tonnes a year.
• Gas-fired engines using LNG are quieter than diesel engines.
• The increasing use of LNG enhances the good economic position of the Hong Kong as ‘gas hub’ of East Asia.
• Hong Kong is ECA and China is going to be with some other countries. So ships will go for LNG fueled engines for ease of operations.
• 80% of operational costs of a ship is fuel cost. Use of LNG can bring it down being cheaper and cleaner fuel. Same for buses, trucks and electricity and cooking/ heating gas at home or factories or offices
LNG vs. LPG
• LNG is methane or CH4
• Calorific value: 38.7MJ/m3
• Combustion ratio with air 10:1
• Lighter than air, RD=0.5537
• Boiling temp: -161.5 deg. C
• Flame temp: 1950 deg. C
• Gas volume: 1.499 m3/kg
• Density @15deg C: 0.668 kg/m3
• LPG is Propane or C3H8
• Calorific value: 93.2MJ/m3
• Combustion ratio with air 25:1
• Denser than air, RD=1.5219
• Boiling temp: -42 deg. C
• Flame temp: 1967 deg. C
• Gas volume: 0.540 m3/kg
• Density @15deg C: 1.899 kg/m3
Why LNG, not LPG?
LNG
• Energy content: 1 cubic foot of natural gas contains 1,030 BTU
• 100,000 BTU/hr furnace will use about 97 cubic feet of natural gas (100,000 ÷ 1,030 = 97.1) in one hour
• Cost: $10.00/ ft3.
• Green House Gas (GHG)
• Source for electricity generation
LPG
• Energy content: 1 cubic foot of propane contains 2,516 BTU
• 100,000 BTU/hr furnace will use about 40 cubic feet of propane (100,000 ÷ 2516 = 39.7) in one hour
• Cost: $28.00/ ft3.
• Non-toxic, non-GHG
• Can’t be used for electricity generation

17/08/2017
6
Why LNG, not LPG for vehicles?
LNG
• Energy density: 60% compared to diesel
• Suited for large diesel vehicle i.e. trucks, buses due to pressurized large double tank system
• Lower fuel cost
• Lower maintenance cost
• Quieter operation than diesel
• Reduced emission
LPG
• Energy density: 65% compared to diesel
• Suited for small vehicles i.e. cars
• Higher cost than LNG
• Maintenance cost is higher than LNG powered vehicles
EV & NGV - similarities
Electric Vehicles
• Have infrastructure requirements
• Save over petroleum and diesel
• Need government policy
Natural Gas vehicles
• Have infrastructure requirements
• Save over petroleum and diesel
• Need government policy
EV & NGV - comparison
Electric Vehicles
• 1000 cft. gas to electric – 400+ miles
• Electric buses get 20 miles per gallon
• 240 v charger cost $2K
• Time: 3 – 8 hrs.
• Cost: Electric Ford Focus starts at $40K in US
• Fuel: Electricity
• Range: 100 miles on charge
• Payback: Easy
• Ideal for small cars
Natural Gas Vehicles
• 1000 cft. NGV – 224 miles
• CNG buses get 4 miles per gallon
• CNG filling station - $750K
• Time: 15 mins
• Cost: Retrofit gas Ford Focus starts at $27K in US
• Fuel: $2 per gallon
• Range: 250 miles with 15 gallons
• Payback: Retrofit within a year
• Ideal for heavy duty vehicles
Diesel or Natural Gas?Diesel
• Synthesized from refining crude oil
• Prices fluctuate round the year
• More expensive
• Station costs $150K to build in US
• Trucks cost $95K
• Better mileage, 40% more
• Energy density 129 BTU
• Quicker to refill
• Cost to run 18 wheeled truck $60K
Natural gas
• Conventional/ unconventional sources
• Long term contract, price cap
• Less expensive
• Station costs $350K to 1M to build
• Trucks cost $195K
• Less mileage
• Energy density 37 BTU
• Takes time to refill
• Cost to run 18 wheeled truck $80K/yr
Five year payback
So the best option is………………….natural gas
• Natural gas is not new to Hong Kong
• Since 1997
• Government is supporting through policy
• Climate Action Plan 2030+ encourages to use gas
HK natural gas consumption

17/08/2017
7
Why independent gas supply?
• Energy supply security With a Hong Kong terminal, CLP/ CAPCO can directly access and contract with LNG suppliers around the world. This will ensure that Hong Kong’s gas needs are accorded priority and that electricity supply reliability can be maintained.
• Environmental benefits With LNG, we can raise the proportion of natural gas in our fuel mix. This will help CAPCO to meet GoHK's 2010 air quality targets in a sustainable manner and will continue to reduce our CO2
emission.
• Time certainty Developing a local terminal under one jurisdiction will give the project time certainty. With timely approval by the Government, the terminal can be in operation in time to meet our gas needs.
Liquid Natural Gas (LNG)• Mixture of Methane and Ethane
• Liquid state takes 1/600th space than gaseous state
• Odorless
• Colorless
• Non-toxic
• Non-corrosive
• Liquefied at -162 deg. C or -260 deg. F
• Max transportable pressure 25 kPa or 4 psi
• Hazards: Flammable after vaporization, freezing, asphyxia
Gas / LNG is NOT new to Hong Kong
Liquid Natural Gas (LNG)
• Natural gas is the cleanest burning fossil fuel
• Being used throughout the world to reduce harmful emissions
• Evaporates rapidly
• Leaving no residue (slick) on water or soil
• Energy density 2.4 times greater than CNG or 60% of diesel fuel, 20.3 -22.5 MJ/litre
• Heating value: 45 – 50 Mega Jules/kg or 19350 – 21500 British Thermal Unit/lb
• Density: 0.41 – 0.50 kg/litre depending on temperature, pressure and composition
Single source (LNG) – multi use
• Conventional gas: trapped in permeable/ porous material beneath impermeable rock i.e. oil field
• Unconventional gas: found in other geological settings i.e. shale gas (though fracking/ horizontal drilling), tight gas – usually blocked by rocks (fracking, acidizing), coalbed methane (found in seams of coal), geo-pressurised zone (layers of clays over sand and slits - 3K-7.5K meters beneath the Earth), methane hydrates (ice found in ocean sediments and permafrost areas of Arctic)
• Biogas: produced when organic matter decomposes without oxygen being present i.e. landfills, animal waste, sewage, industrial by-products
• Deep natural gas: located in deposits at least 4,500 meters (15,000 feet) below the surface of the Earth
History of natural gas
• Around 500 BCE: Chinese engineers made use of natural gas seeping out of the Earth by building bamboo pipelines to heat water.
• 1626: Naturally occurring natural gas was discovered and identified in America, around Lake Erie.
• Around 1785: Britain first commercialized the use of natural gas. Natural gas produced from coal was used to light houses, streetlights.
• 1821: The first well, specifically intended to obtain natural gas was dug in Fredonia, New York by William Hart.
• 1885: Robert Bunsen invented the Bunsen burner, which mixed natural gas with air in the right proportions, creating a flame for cooking and heating
• 1891: One of the first major pipelines of 120 miles long was constructed; which carried natural gas from wells in central Indiana to the city of Chicago.
Why use LNG?
• Cleanest burning fuel
• Produces less emission and pollutants
• Takes up less space
• More economical to transport
• Price competitive source of energy
• Meets future economic needs
• Natural gas is available in abundance
• More efficient to produce electricity
• Can produce both heat and electricity simultaneously via co-generation system

17/08/2017
8
LNG – environmental impact
• US Environmental Protection Agency or EPA estimates that using LNG in heavy trucks would reduce emissions:
Nitrous oxide (NOx) emissions by as much as 50%, Greenhouse gases by as much as 23%.
• The Classification Societies, DNV-GL estimates that LNG as a bunker fuel in ships:
Reduces carbon dioxide (CO2) emissions by 23%, Nitrogen Oxides (NOx) by 92%, and Sulphur Oxides (SOx) by 90-95%.
LNG – safety impact
• Typically not stored under high pressure
• Not explosive
• Stay in a liquid state at atmospheric pressure at -162 deg. C
• Goes to gaseous state when vaporized
• Burns when natural gas to air ratio is between 5% and 15%
LNG – as fuel and storage
• Can be used in high HP engines in shipping, O&G, rail, mining and heavy vehicles
• Must be stored and distributed with specialized equipment
• Stored inside insulated tanks
• Stored at liquid stage
• Transported through pipelines and ships
World total production• 1990 : 50 Mmtpa (Million [metric] tons per annum)
• 2002: 130 Mmtpa
• 2007: 160 Mmtpa
• 2014: 246 Mmtpa
1 Video - China switches to natural gas……….
LNG export & market share by country, MTPA

17/08/2017
9
LNG imports & market share, MTPA
2015 incremental LNG exports by country relative to 2014 in MTPA
2015 incremental LNG imports by country relative to 2014 in MTPA
Active global LNG fleet by capacity and age, end-2015
Average LNG spot charter rates vs. vessel deliveries, 2011-2015
Major LNG shipping routes, 2015

17/08/2017
10
LNG fleet by respective company interests
Receiving terminal capacity, 2000 - 2021
Start-ups of LNG receiving terminals, 1980 -2021
Receiving terminal import capacity and utilization rate by country in 2015 and 2021
Rise of FSRUs, 2000 - 2021
Advantages – maritime sector
• LNG bunkering
• TFDE LNG ships
• Latest generation ships are LNG fueled
• Clean fuel
• No restriction for ECA
• Cheaper

17/08/2017
11
Use of LNG• Residential use:As heating fuel to fuel stoves, water heaters, clothes dryers and other household appliances• Commercial use: Hospitals, schools, office buildings, restaurants, stores and other commercial establishments rely on natural gas for space-heating, water-heating, cooking, air conditioning, dehumidification and on-site power generation.
• Industrial use: Dominant fuel for the production of paper, metal, chemicals, petroleum, stone, clay, glass, clothing and food processing industries. Essential raw material for many common products such as paints, fertilizer, plastics, antifreeze, dyes, photographic film and medicines.
Use of LNG
• Electricity generation
New generation power plants use LNG as clean-burning fuel
• Transportation sectors
Buses, trucks
• Household
Heating, cooking
• Commercial
Space heating, cooking
Cost
• LNG plant: at least $1.5 billion per 1 mmtpa capacity
• Receiving terminal: $1 billion per 1 bcf/day
• LNG vessel: $200 million – $300 million
• LNG FSRU: $300 million – $600 million
2 Video - Natural gas power plants
LNG supply/ demand overview
LNG trading 2016

17/08/2017
12
Environmental driver
China (incl. Hong Kong) gas consumption by sectors 2000-2014
China (incl. Hong Kong) power generation by fuel tech 2000-2012
China (incl. Hong Kong) natural gas supply and demand 2000-2014
China (incl. Hong Kong) – LNG
import cases• 1 billion cubic meters (BCM) NG = 35.3 billion cubic feet NG
• 1 billion cubic meters NG = .73 million metric tons LNG
• 1 million metric tons LNG = 48.7 billion cubic feet NG
Is natural gas the answer?
Emission reductions of natural gas versus coal in electricity production:
• Carbon di-oxide: 50 – 60%
• Carbon monoxide: 90%
• Sulphur di-oxide: 99%
• Nitrogen oxide: 80-90%
• Particulate matter: 99%
• Mercury: 100%
Source: Texas A & M University

17/08/2017
13
Gas-fired power plants diagram
Business challenges
Power market
• Power demand
• Use of electricity
• Seasonality
• Medium to short term
• Reliability
• Conditions based
• Price issues
• PPA (Power Purchase Agree)
• Spot power market without firm commitment
LNG market
• Global market
• Steady production
• Take-or-pay
• Medium to long term
• Guaranties
• Conditions based
• Price issues
• LNG SPA (Sale & Purchase)
• Reduced LNG spot market
Business factors - LNG
• Financing
• Access to LNG supply
• Commercial aspects
• Gas regulation
• Environment
• Electricity regulation
• LNG technology
• Power generation technology
3 Video - LNG fueling
HKOLT – familiar name but different look
HKOLT – risks and opportunities
• Offshore installation
• Within environmental sensitive area
• Cyber threat
• Export energy to mainland
• Introduction of LNG to other sectors
• Steady power source
• Bagainning capability for LNG price
• Assist international trade and transport
• Support environment action plan
• Avoid nuclear energy
• Support Paris Environmental plan

17/08/2017
14
4 Video - FSRU
LNG FSRU
• Occupies no land space
• Construction is also simpler, cheaper
• Takes less time
• Less environmental impact
• Remote location
LNG import terminal configurations: Technical description
LNG import terminal configurations: Pros & Cons
Cost comparison: On shore vs. FSRU terminal
Principal components of a LNG FSRU

17/08/2017
15
Evolution of FSRUs
LNG
FSRU
fleet
LNG
FSRU
fleet
Existing, sanctioned & proposed FSRUs
LNG stakeholders in HK
• CLISICO
• CESM
• MOL LNG Transport (Asia) Ltd.
• China LNG Group Limited
• SINOPEC Kanton Holdings Limited
• CLP
• HK Electric
• Kunlun Energy Company Ltd.
• China Resources Gas Group Ltd.
• China LNG Corporation Ltd.
• Towngas
• HK LNG Ltd.
• Southern LNG
• COSCO Shipping
• CNOOC
• China Merchant
• SGS
• Shell
5 Video - LNG bunkering

17/08/2017
16
LNG - Fueling the future
• Use of LNG as fuel is not new and safe
• Use of LNG is ever increasing
• World’s developed and developing nations are using LNG
• Europe is lagging behind Asia
• Globally, 15 million cars already run on natural gas
• Thousands of trucks use LNG in China and the US
• Unconventional sources of LNG are various
• Oil has limited reserve
• LNG price is going down
• LNG is sustainable energy
LNG as transport fuel
• Auto-ignition temperature of Methane - 580C/1076F, gasoline and diesel - 250C and 210C respectively.
• LNG offers a unique advantage over CNG for high-horsepower applications by eliminating the need for a turbocharger.
• Because LNG boils at approximately -160C, by using a simple heat exchanger a small amount of LNG can be converted to its gaseous form at extremely high pressure with the use of little or no mechanical energy.
6 Video – Fuel of the future
Why Hong Kong?
• China has been a leader in the use of LNG vehicles with over 100,000 LNG powered vehicles on the road as of Sept 2014
• LNG is being used by Hong Kong since 1997 at Black Point power station
• Hong Kong is concerned about air pollution and quality of life
• Hong Kong is maritime Emission Control Area (ECA)
• Hong Kong is a good spot of LNG bunkering being a big hub for passenger and container ships
• Hong Kong government policy insists on clean fuel and fuel mixture for electricity production and requires LNG as 50% of total fuel mix by 2020
Hong Kong’s potential
• Maritime hub
• Stable and future looking Govt.
• Care for environment
• Concerned people
• Pro-active community
• Balanced economy
• World’s 5th largest port
• High demand for electricity
• Easy to reach contentious
• Belt and Road initiative
Current gas status in Hong Kong• Town gas & LPG - domestic, commercial and industrial
purposes
• Almost all taxis and over 65% public light buses use LPG
• LNG for part electricity generation and production of town gas
• 2.27 million gas customers - Town gas & LPG account 87.6% of it
• Town gas is produced at Tai Po (10 mil cub m) and Ma Tau Kok (2.6 mil cub m)
• LPG is imported by sea to 5 terminals at Tsing Yi and distributed to 430K customers and 67 filling stations
• Natural gas is imported from China to Black Point, Castle Peak and Lama Power Stations for electricity generation and Tai Po plant for generation of Town gas

17/08/2017
17
Success factor for LNG - Policy
Policy
�Clear – 50% LNG mix
�Environment - ECA
�Firm timescale – by 2020
�Penalties for non-compliance
�Enforcement - laws
Regulatory support
�Establish infrastructure – in place incl. gas-fired power generators, pipelines
�Competitive market
Success factor for LNG - price
Price & economics
�Cheaper than conventional fuels i.e. coal
�Cost of systems must be manageable – power generators, fuel stations
�Economic to supply LNG or efficient supply chain - proven
Critical mass
�Sufficient users – no other alternative
�Cost of infrastructure spread over customers –infrastructure in place
�Mentality – environmental friendly and cost conscious people
Success factor for LNG - people
Stakeholders buy in
�Interest and confidence i.e. CLP and HK Electric agreed
�Vested interests i.e. to make HK cleaner and provide affordable electricity and gain more bargaining power at international market
Acceptance
�Pollution i.e. LNG is clean fuel, less pollutant
�Accidents i.e. accidents are less
�Benefits i.e. sustainable energy, independent of mainland suppliers
�No use of land i.e. floating storage
�Disruption i.e. highly unlikely due to steady supply and back up lines to mainland
Success factor – physical & environmental
Technology
�Have the technology i.e. power generation, fuel cells
�Global standards i.e. international partners, advisors are involved
Infrastructure
�Receipt of LNG i.e. already receiving since 1996, FSRU is an added independent source
�Storage i.e. FSRU
�Access i.e. anytime
�Separation from residential area i.e. isolated Soko island
�Separation from environmentally sensitive area i.e. not quitely but manageable
Are we ready?
�Policy
�Regulatory support
�Price and economics
�Critical mass
�Stakeholder buy in
�Acceptance by public
�Technology
�Infrastructure
Almost!
Environmental impact assessment submission – 4Q 2017
Waiting for time and tide…….
References
• IHS
• IGU
• BMT
• CLP
• HK Electric
• The Oxford Institute for Energy Studies
• Data Fusion Associates
• Govt. of HK (various)
• Environmental Resource Management
• Chalmers
• Forbes
• Bloomberg
• National Geographic
• CCTV
• Excelerate
• Others
• US EPA
• DNV-GL
• BMI
• SCMP
• HK Business
• You Tube
• Others