Embed Size (px)
Citation preview

Musikpsychologie Bd. 27, 26-47, © Hogrefe Verlag, Göttingen 2017
l nf luence of d istort ion on gu itar chordstructures - acoustic effects and perceptualcorrelates
Jan-Peter Herbst1
Abstract
Since the exploration of distortion as a means of expression in the 1950s, the electric guitar has become a primary instrument in popular music, especially in rock and metal music. Despite this development, there is little musicological research on the use and perception of distorted guitar chords. This work aimed at exploring the influence of distortion on guitar chord structures, at identifying acoustic features potentially causing dissonance and at finding explanations for the common use of simple chords in rock and metal music genres. The research followed a two-step experimental design. Based on Terhardt's (1984) and Aures' (1985) two-component framework of musical consonance, the main study statistically evaluated acoustic characteristics of 270 electric guitar chords produced with different sound settings, instruments and amplifiers. In a second step, data of a listening test with 171 participants were triangulated with the acoustic results for considering the perceptual perspective as well. The findings largely confirmed distortion to decrease sensory pleasantness especially for complex guitar chords. The parameters of sensory consonance of the underlying framework, measured with the MIR-Toolbox, and the Loudness-Toolbox, strongly correlated with the listeners' perceptions. Surprisingly, roughness as the key criterion for dissonance in Helrnholtz' (1863/1913) tradition was found the least reliable variable for explaining decreased sonority of distorted guitar sounds.
Zusammenfassung
Die E-Gitarre avancierte mit dem Beginn der künstlerischen Nutzung von Verzerrung ab den 1950er-Jahren zu einem wesentlichen Instrument der populären Musik, insbesondere im Rock und Metal. Trotz dieser Entwicklung existiert kaum Forschung zum Gebrauch und zur Wahrnehmung von verzerrten Gitarrenakkor-
1 Acknowledgements: I would like to thank Christoph Reuter and Isabella CzedikEysenberg (Vienna University) for supporting me with the feature analysis, and Andreas Seifert (Paderborn University) for his very helpful methodical advice.

Influence of distortion on guitar chord structures 27
den. Ziel der vorliegenden Untersuchung war es, den Einfluss von Verzerrung auf Gitarrenakkorde zu bestimmen, den Zusammenhang zwischen akustischen Charakteristika und Dissonanzempfinden zu untersuchen sowie Erklärungen für die verbreitete Nutzung von einfachen Akkordstrukturen in Rock und Metal Genres zu finden. Die Studie bestand aus einem zweistufigen experimentellen Design. Auf Grundlage des theoretischen Rahmens von musikalischer Konsonanz von Terhardt (1984) und Aures (1985) evaluierte die Hauptstudie akustische Eigenschaften von 270 E-Gitarrenakkorden, die mit verschiedenen Klangeigenschaften, Instrumenten und Verstärkern produziert wurden. In einem zweiten Schritt wurden die Ergebnisse eines Hörexperiments mit 171 Teilnehmern mit den akustischen Werten trianguliert, um auch die Wahrnehmungsperspektive zu berücksichtigen. Die Resultate bestätigten größtenteils die negative Wirkung von Verzerrung auf den sensorischen Wohlklang, insbesondere bei komplexen Gitarrenakkorden. Die mit der MIR-Toolbox und der Loudness-Toolbox gemessenen Parameter des theoretischen Rahmens korrelierten stark mit den Höreindrücken. überraschenderweise eignete sich Rauheit als das Hauptkriterium von Dissonanz in Helmholtz (1863/1913) Tradition am wenigsten, um den verringerten Wohlklang verzerrter Gitarrenakkorde zu erklären.
1 lntroduction
The most important aural sign of heavy meta! is the sound of an extremely distorted electric guitar. Anytime this sound is musically dominant, the song is arguably either meta! or hard rock; any performance that lacks it cannot be included in the genre. (Walser, 1993, p. 41)
In his pioneering work, Walser claimed the sound of the electric guitar to be particularly relevant for rock and metal music. In the development of the rock and metal music studies as an interdisciplinary academic field, the profound analysis of distorted guitar sounds and the conventions of rhythm guitar playing have been on the fringes. Instead, research on the rock guitar paid special attention to cultural identity, ethnicity, and political subversion (Waksman, 1999), genre definition (Gracyk, 1996), gender (Bourdage, 2010; Frith & McRobbie, 1978/1990; Walser, 1993) or communication (Herbst, 2014). Within musicology, some research has focused on the distorted guitar sound. Discussing the genre characteristics of heavy metal, Walser (1993, pp. 41ff.) devoted three pages to distortion, highlighting its expressive potential. By spectral analysis of original records and experimental guitar recordings, Einbrodt (1997) identified acoustic elements having contributed to the emergence of the rock guitar sound. Psychological and music theoretical issues were of secondary importance to his work. In contrast to Einbrodt, Elftein (2010) considered the guitar riff as the central element of his systematic analysis of rock and metal music. Although Elftein identified form, rhythm and sound as the main parameters for stylistic differences, he analysed the guitar sound only by description of his listening experience due to methodical difficulties (Elftein, 2010, pp. 7lff.). In the same vein, Cope

28 Jan-Peter Herbst
(2010) explored the separation of hard rock and heavy metal by analysing different guitar riffs of prototypical bands.
An issue neglected even more is the perception of the distorted guitar sound. Lilja (2005, 2015) has been one among a few researchers dealing with the influence of guitar distortion on the perception of harmonic structures, and the conventional use of certain chord types in heavy metal. Methodically, he combined theoretical (2005) with spectral-analytical (2015) approaches to explain the common absence of complex chord structures. Juchniewicz and Silverman (2011) studied the issue of chord perception with a quantitative evaluation of the influence of chord progression and distortion on the perception of terminal power chords. By tracking the perceived heaviness of the distorted rhythm guitar in heavy metal from 1970 to 2000, Berger and Fales (2005) aimed at presenting a new method of analysing timbre by combining verbal description with acoustic characteristics.
All of this work provided valuable information on the electric guitar in cultural studies and musicology. However, due to methodical challenges (Einbrodt, 1997; Elftein, 2010) most work payed little attention to the underlying acoustic and psychoacoustic processes of guitar playing. As Einbrodt (1997), Lilja (2005, 2015) and Elftein (2010) pointed out, the spectral characteristics of the distorted guitar sound tempt guitarists to play simple harmonic structures, mostly single notes or power chords (fifths intervals) rather than triads and more complex chords. The harmonic structures of rock and metal music, mainly produced by guitar and bass, are subject to the sonic characteristics of these instruments. Hence, exploring the influence of guitar distortion on chord structures may be addressing the so nie centre of rock and metal music genres (Herbst, 2016; Walser, 1993). lt also offers a promising academic basis for analysing genre development, performance conventions, and rock music's psychological effects.
This study aimed at exploring the influence of distortion on guitar chord structures, at identifying acoustic features potentially causing dissonance and at finding explanations for the common use of simple chords in rock and metal music genres (Lilja, 2015; Walser, 1993). lt followed a two-step experimental design. Based on Terhardt's (1984) and Aures' (1985) two-component framework of musical consonance, the main study statistically evaluated acoustic characteristics of 270 electric guitar chords with different sound settings, instruments and amplifiers. In a second step, data of a listening test with 171 participants were triangulated with the acoustic results for considering the perceptual perspective as well.
2 The electric guitar sound and its effects on chord perception
Musical instruments such as the guitar produce periodic waves; the lowest vibration generally is the fundamental (f
0) and the higher ones are harmonic par
tials (Roederer, 2008, pp. 49ff.). Harmonie partials are integer multiples of the fundamental frequency that add specific intervals to the perceived pitch; first

Influence of distortion on guitar chord structures 29
octave, fifth and double octave, then major third and minor seventh (Müller, 2015, pp. 23f.). The number of partials, their relative intensities and the temporal development contribute to the spectrum and perceived timbre (Müller, 2015, pp. 26ff.). Several parameters determine the complex sound of the electric guitar: The scale length of the string, the string material and tension, the bridge and tail-piece, the wood and potential resonance chambers, the instrument formants, the position and kind of pickup (single coil or humbucker), the material (finger or plectrum), strength and position (towards the bridge or the neck) of impulse, the angle and hardness of the plectrum and the pitch (Einbrodt, 1997; Zollner, 2014). Due to the missing resonance chamber, the solid body guitar only works with amplification (Gracyk, 1996, p. 120). The guitar amplifier does not simply intensify the signal but produces distortion. In acoustics and electronics, distortion is defined as "any change in a signal that alters the basic waveform or the relationship between various frequency components; it is usually a degradation of the signal" (Encyclopaedia Britannica, 2006). Distortion results from the nonlinear transfer of the instrument pickups, the preamplifier and power amplifier, and the loudspeakers that only reproduce a frequency range approximately between 75 and 5,000 Hz (Einbrodt, 1997, p. 198). The most important characteristic of guitar distortion is the modified waveform resulting from an amplification beyond fidelity reproduction. Quiet sound components are intensified, and the amplitude increasingly is clipped, leading to a square wave (Elftein, 2010, p. 352). This modification produces a compressed signal with an increased noise ratio, added overtones, more sustain, and a flatter dynamic envelope (Berger & Fales, 2005, p. 184). Inharmonic overtones additionally arise from the bending stiffness of the string. The stiffness, gauge and winding of the string lead to inharmonic spectra with frequencies of a few hertz next to the frequencies of the fundamental notes and their harmonic partials (Zollner, 2014, pp. 10, 222-224; Zwicker & Fastl, 2007, p. 364). This inharmonicity combined withdistortion produces a brighter sound and the beats of close frequencies result inroughness and amplitude fluctuations that are perceived as periodic "pseudonoise" (Zollner, 2014, p. 10-224). With these alterations, the distorted timbre isnoisier, rougher and more present than a clean sound.
The power chord, a fifth interval with an optional octave, is the chord most commonly played on the distorted guitar. lt produces a powerful and consonant sound since many of the fundamentals' partials coincide (Lilja, 2005, pp. l üf.). The difference tone below the chord's root, an important component of the powerful sensation, is only physically present with a distorted sound (Lilja, 2015; Walser, 1993, p. 43). Most subgenres of metal music restrict the harmonic complexity of the distorted guitar to single notes and power chords (Elftein, 2010) as these are expected to be less dissonant than triads or more complex chords. Hard rock bands in the tradition of Led Zeppelin, Van Halen and AC/DC, however, often integrate triadic harmony into their riffs (Cope, 2010; Lilja, 2015). Many of those rock riffs solely consist of major chords (Lilja, 2015). Research using spectral analyses indicated that power and major chords have identical overtone spectra due to combination tones (Herbst, 2016; Lilja, 2015), which would explain why distorted major chords commonly were not considered dis-

30 Jan-Peter Herbst
sonant. Minor chords are used on the distorted guitar less often. This custom could be explained by greater dissonance resulting from beats of the more complex interval relations (Einbrodt, 1 997, pp. 160ff. ; Lilja, 20 15, p. 397). A special chord is the altered dominant-seventh with an augmented ninth, known as the "Hendrix chord" (Lilja, 2015, p. 398). Containing both major and minor third, this chord has been claimed to be aurally inseparable from a minor chord (Lilja, 2015, p. 398). The altered chord is likely to be affected by beats between the major third and augmented ninth (equals halftone interval) and between the major third and minor seventh (tritone interval).
3 Duality of harmony and sensory pleasantness
Terhardt (1984) presented a two-component concept of musical consonance consisting of harmony and sensory consonance. The affinity of tones, the fundamental-note relation and the compatibility of chords and melodic segments describe the harmonic element (Terhardt, 1984, pp. 278f.). In extension of Helmholtz' theory (1863/1913), sensory consonance is defined "as the more or less complete lack of annoying features of a sound; it is pertinent to such sensory parameters as roughness and sharpness (i.e., on the physical side, amplitude fluctuations and presence of spectral energy at high frequencies)" (Terhardt, 1984, p. 282). Aures (1985) differentiated Terhardt's (1984) model by empirically extrapolating its four main components: Roughness (Rauhigkeit), sharpness (Schärfe), tonalness (Klanghaftigkeit) and loudness (Lautheit). Sensory consonance, or pleasantness as termed by Aures (1985), is decreased by high values of roughness, sharpness and loudness, a high tonalness increases it (Aures, 1985, p. 289). In contrast to interval relation, the perception of sensory pleasantnesshas been argued to be more consistent among cultures and between musiciansand non-musicians too (Cook & Fujisawa, 2006; Roberts, 1986).
Roughness, as defined by Helrnholtz (1863/1913) and extended by Plomp and Levelt (1965), is considered the most important attribute for dissonance since it reduces the sound's smoothness by beatings of adjacent partials that excite the same critical band. Therefore, musical sounds with a rich harmonic spectrum are prone to producing roughness (MacCallum & Einbond, 2008, p. 203), which goes along with amplitude fluctuations. For modulation frequencies below 20 Hz, fluctuation induces perceivable beats, above this value, the modulation falls into the critical bandwidth causing a rough sensation (Zwicker & Fastl, 2007, p. 247). Consequently, (psycho)acoustic analysis should not only aim at frequency spectra but also include spectral fluctuations as a measure of the temporaldevelopment of a spectrum (Lartillot & Toiviainen, 2007, p. 2). Contrary toPlomp and Levelt (1965), Zwicker and Fastl (2007, p. 245) advocate sharpnessas the most important factor related to sensory pleasantness. Sharpness can bemeasured by the spectral content of a sound and computed by the spectral centroid as the mean frequency of the spectrum (McAdams, Depalle & Clarke, 2004,p. 191). A higher centroid caused by loud upper partials correlates with a brighter texture that is likely to be perceived as unpleasant (Grey & Gordon, 1978).

lnfluence of distortion on guitar chord structures 31
The frequency between two and five kHz is very important because the human ear is most sensitive in this range (Zwicker & Fastl, 2007, pp. 17, 20). Loudness is a subjective parameter related to the sensation of roughness and sharpness reducing sensory pleasantness (Aures, 1985) - even if only to a minor degree as argued by Zwicker and Fastl (2007, p. 364). Tonalness, defined by the "closeness of the partials to a harmonic series" (Sethares, 2005, pp. 79f.), is the only parameter increasing pleasantness.
From a music theory perspective, intervals and chord structures have been essential for discussing consonance (Cook & Fujisawa, 2006; Sethares, 2005; Tenney, 1988). For intervals, the complexity of frequency relation correlates with perceived dissonance (Roederer, 2008, pp. 170ff.) whilst for chords, the affinity of tones and the fundamental-note relation matter (Terhardt, 1984, pp. 278f.). Empirical studies have confirmed the decreasing sonority and stability as well as the increasing tension of major, minor, diminished and augmented triads in Western music (Cook & Fujisawa, 2006; Roberts, 1986). The (psycho)acoustic perspective highlights several aspects underrepresented in music theory. Sethares (2005, p. 80) described three implications. First, every natural tone with harmonics added to its fundamental is adherent to dissonance due to roughness. Second, the sound spectrum must be considered besides the interval relations when determining the chords' sonorities. Third, consonance and dissonance do not fall into strictly defined categories and the sounds are perceived on a continuum with individual differences that are subject to developmental change (Cazden, 1945).
4 Method of the main study
4. 1 Aims and hypotheses
The acoustic analysis aimed at systematically exploring the influence of distortion on guitar chord structures and at identifying acoustic properties potentially causing dissonance within the theoretical framework of Terhardt (1984) and Aures (1985). This study served as pre-study for a listening test (Herbst, 2018). For triangulating the acoustic characteristics with the perceptual perspective, the data of the listening study (Herbst, 2018) were correlated with the chords' features in a second step. Seven hypotheses guided the acoustic analysis of the 270 guitar chords regarding sensory pleasantness: a) Relevance of equipmentHl : The different acoustic characteristics of guitar models affect the perception
of sensory pleasantness. H2: The different acoustic characteristics of amplifier models affect the percep
tion of sensory pleasantness. b) Interrelation of structural complexity, sound setting, and sensory pleasantnessH3: Roughness, spectral flux, spectral centroid and loudness correlate positively
amongst themselves and they all correlate negatively with tonalness (for all sound settings and structures).
32 Jan-Peter Herbst
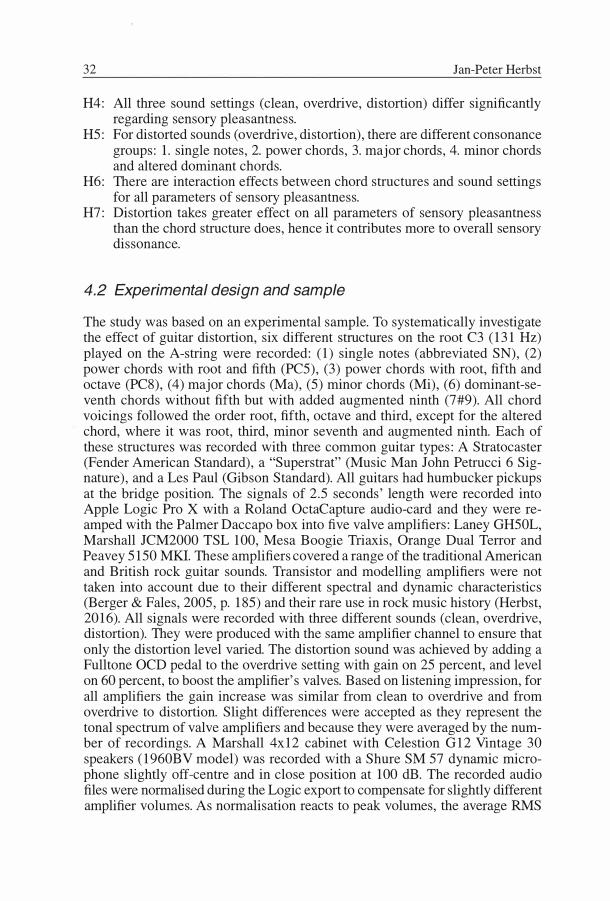
H4: All three sound settings (clean, overdrive, distortion) differ significantly regarding sensory pleasantness.
H5: For distorted sounds ( overdrive, distortion), there are different consonance groups: 1. single notes, 2. power chords, 3. major chords, 4. minor chords and altered dominant chords.
H6: There are interaction effects between chord structures and sound settings for all parameters of sensory pleasantness.
H7: Distortion takes greater effect on all parameters of sensory pleasantness than the chord structure does, hence it contributes more to overall sensory dissonance.
4.2 Experimental design and sample
The study was based on an experimental sample. To systematically investigate the effect of guitar distortion, six different structures on the root C3 (131 Hz) played on the A-string were recorded: (1) single notes (abbreviated SN), (2) power chords with root and fifth (PC5), (3) power chords with root, fifth and octave (PC8), (4) major chords (Ma), (5) minor chords (Mi), (6) dominant-seventh chords without fifth but with added augmented ninth (7#9). All chord voicings followed the order root, fifth, octave and third, except for the altered chord, where it was root, third, minor seventh and augmented ninth. Each of these structures was recorded with three common guitar types: A Stratocaster (Fender American Standard), a "Superstrat" (Music Man John Petrucci 6 Signature), and a Les Paul (Gibson Standard). All guitars bad humbucker pickups at the bridge position. The signals of 2.5 seconds' length were recorded into Apple Logic Pro X with a Roland OctaCapture audio-card and they were reamped with the Palmer Daccapo box into five valve amplifiers: Laney GH50L, Marshall JCM2000 TSL 100, Mesa Boogie Triaxis, Orange Dual Terror and Peavey 5150 MKI. These amplifiers covered a range of the traditional American and British rock guitar sounds. Transistor and modelling amplifiers were not taken into account due to their different spectral and dynamic characteristics (Berger & Fales, 2005, p. 185) and their rare use in rock music history (Herbst, 2016). All signals were recorded with three different sounds (clean, overdrive, distortion). They were produced with the same amplifier channel to ensure that only the distortion level varied. The distortion sound was achieved by adding a Fulltone OCD pedal to the overdrive setting with gain on 25 percent, and level on 60 percent, to boost the amplifier's valves. Based on listening impression, for all amplifiers the gain increase was similar from clean to overdrive and from overdrive to distortion. Slight differences were accepted as they represent the tonal spectrum of valve amplifiers and because they were averaged by the number of recordings. A Marshall 4x12 cabinet with Celestion G12 Vintage 30 speakers (1960BV model) was recorded with a Shure SM 57 dynarnic rnicrophone slightly off-centre and in close position at 100 dB. The recorded audio files were normalised during the Logic export to compensate for slightly different amplifier volumes. As normalisation reacts to peak volumes, the average RMS
Influence of distortion on guitar chord structures 33
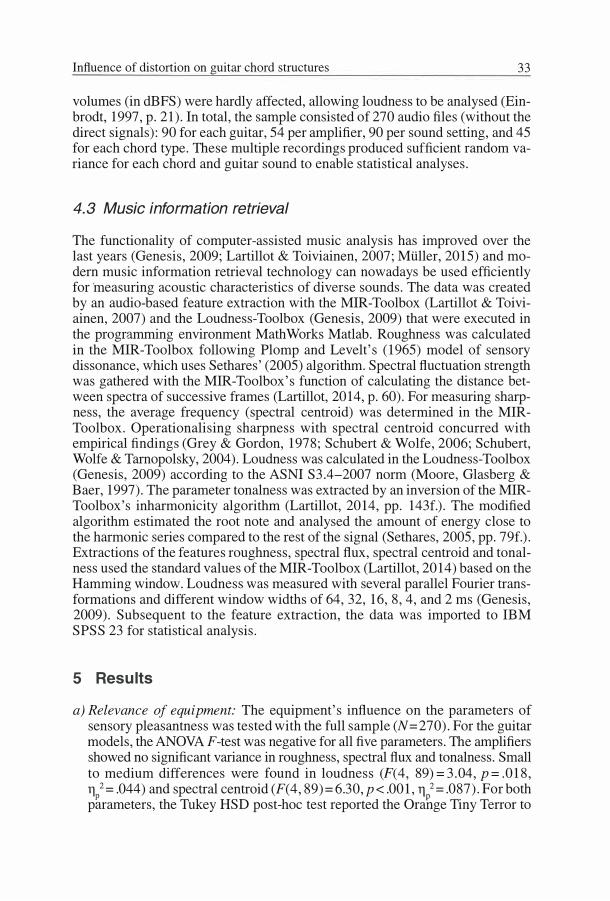
volumes (in dBFS) were hardly affected, allowing loudness to be analysed (Einbrodt, 1997, p. 21). In total, the sample consisted of 270 audio files (without the direct signals): 90 for each guitar, 54 per amplifier, 90 per sound setting, and 45 for each chord type. These multiple recordings produced sufficient random variance for each chord and guitar sound to enable statistical analyses.
4.3 Music information retrieval
The functionality of computer-assisted music analysis has improved over the last years (Genesis, 2009; Lartillot & Toiviainen, 2007; Müller, 2015) and modern music information retrieval technology can nowadays be used efficiently for ·measuring acoustic characteristics of diverse sounds. The data was created by an audio-based feature extraction with the MIR-Toolbox (Lartillot & Toiviainen, 2007) and the Loudness-Toolbox (Genesis, 2009) that were executed in the programrning environment Math Works Matlab. Roughness was calculated in the MIR-Toolbox following Plomp and Levelt's (1965) model of sensory dissonance, which uses Sethares' (2005) algorithm. Spectral fluctuation strength was gathered with the MIR-Toolbox's function of calculating the distance between spectra of successive frames (Lartillot, 2014, p. 60). For measuring sharpness, the average frequency (spectral centroid) was determined in the MIRToolbox. Operationalising sharpness with spectral centroid concurred with empirical findings (Grey & Gordon, 1978; Schubert & Wolfe, 2006; Schubert, Wolfe & Tarnopolsky, 2004). Loudness was calculated in the Loudness-Toolbox (Genesis, 2009) according to the ASNI S3.4-2007 norrn (Moore, Glasberg & Baer, 1997). The parameter tonalness was extracted by an inversion of the MIRToolbox' s inharmonicity algorithm (Lartillot, 2014, pp. 143f.). The modified algorithm estimated the root note and analysed the amount of energy close to the harmonic series compared to the rest of the signal (Sethares, 2005, pp. 79f.). Extractions of the features roughness, spectral flux, spectral centroid and tonalness used the standard values of the MIR-Toolbox (Lartillot, 2014) based on the Hamming window. Loudness was measured with several parallel Fourier transformations and different window widths of 64, 32, 16, 8, 4, and 2 ms (Genesis, 2009). Subsequent to the feature extraction, the data was imported to IBM SPSS 23 for statistical analysis.
5 Results
a) Relevance of equipment: The equipment's influence on the parameters ofsensory pleasantness was tested with the füll sample (N = 270). For the guitarmodels, the ANOVA F-test was negative for all five parameters. The amplifiersshowed no significant variance in roughness, spectral flux and tonalness. Smallto medium differences were found in loudness (F( 4, 89) = 3 .04, p = .018,ri 2 = .044) and spectral centroid (F(4, 89) = 6.30, p < .001, ri 2 = .087). For bothp�rameters, the Tukey HSD post-hoc test reported the Orahge Tiny Terror to

34 Jan-Peter Herbst
differ significantly. lt was less quiet and bright than any other amplifier. Hence, Hl was rejected, H2 accepted.
b) Interrelation of structural complexity, sound setting and sensory pleasantness:Since nonlinear distortion adds harmonic and inharmonic content to the signal,it was expected to alter the perception of sensory pleasantness. Table 1 showsthe correlation matrix of the parameters. All parameters of sensory pleasantness but tonalness correlated positively among each other. The strongest connection was between loudness and spectral centroid. Tonalness was affectedmost by roughness; loudness took least impact on tonalness. The hypothesisH3 was accepted.
Tab. l: Correlation matrix of the parameters of sensory pleasantness
Roughness Spectral flux Spectral centroid Loudness Spectral flux .612 Spectral centroid .640 .684 Loudness .766 .774 .802 Tonalness -.657 -.488 -.539 -.352
Note: All correlations on probability level p < .00 1 , N= 270.
Hypothesis 4 assumed that all sound settings differed significantly regarding the parameters of sensory pleasantness. The ANOVAs (see Table 2) verified this except for loudness, where no significant variance between the overdriven and distorted sounds was found. Apart from that, H4 was confirmed.
Analysing the issue of whether the chords' consonance differed between undistorted and distorted guitar sounds was central to determining the effect of distortion. The ANOVAs with Tukey HSD post-hoc test (Table 3) did not verify the anticipated hierarchy of consonance for clean sounds. Especially the key components of the theoretical framework, roughness, spectral flux and tonalness, did not meet the expectations. Yet, both distorted sound settings not only showed some differences to the clean sound but also between each other, indicating the distortion level to be relevant (Table 4). The post-hoc test (Table 3) revealed conflicting results between the parameters concerning the interval beatings: roughness and spectral flux. The spectral flux values complied with the hierarchy of consonance in the overdriven and distorted sample, however the roughness values did not. While the less complex power chords exhibited more roughness than minor and altered dominant chords, the major chord was the roughest in the heavily distorted sample. The fluctuation strength was thus the only parameter with distinguishable consonance groups: (1) single notes and power chords, (2) major triads, (3) minor triads, (4) altered dominant-seventh chords. Regarding the interval structure, for all sound settings the spectral centroid was raisingfrom single notes to major chords and then falling again from minor to altereddominant chords. This order complied with the interval structures of the chords.

Influence of distortion on guitar chord structures 35
Regarding loudness , all groups showed little differences whilst the variance among them was huge in tonalness . Single notes differed significantly from all chords. Hypothesis 5 was not fully supported. Concerning sensory pleasantness, only the fluctuation strength met the theoretical hierarchy of consonance.
Tab. 2: Descriptive statistics and AN OVA of the parameters of sensory pleasantness for all
sound settings
Clean Overdrive Distortion TJ 2 p
Roughness 576 (330) 2.234 (1.157) 2.695 (1.338) .437*** (ovd, dist) (cln, dist) (cln, ovd)
Spectral flux 19 .51 (6.51) 53.45 (26.08) 83.42 (29 .55) .564*** (ovd, dist) (cln, dist) (cln, ovd)
Spectral centroid 1,168 (253) 1,512 (351) 2,322 (265) .734*** (ovd, dist) (cln, dist) (cln, ovd)
Loudness 309 (38) 447 (33) 516 (51) . 812*** (ovd, dist) (cln, dist) (cln, ovd)
Tonalness . 667 ( .098) .612 ( .122) .577 ( .116) .102*** (ovd, dist) (cln) (cln)
Note: Values represent M (SD ). Abbreviations in brackets are the sounds that differ significantly from the value according to Tukey HSD post-hoc test. ein: clean, ovd: overdrive, dist: distortion. * p < .05, ** p < .0 1 , *** p < .00 1 , N= 270.
Two-way ANOVAs were calculated for every parameter to determine the interrelation of structural complexity, sound setting and sensory pleasantness (Table 5) . For roughness, spectral flux and tonalness, which are closely related to interval relations, the results demonstrated strong interaction effects between structure and sound. Less dependent on chord structure, loudness and spectral centroid showed little or no significant interaction between structure and sound. With the corrected models' effect sizes between .772 and .9 17 (p < .00 1 ) , the variables structure and sound explained most variance within the sample. Hypothesis 6 was partly accepted. Structure in conjunction with sound interacted with all parameters but loudness .
The relative impact of structural complexity and distortion level was estimated by categorical regression models for each of the five parameters (Table 6) . For tonalness, the structural complexity was more relevant than the sound. In contrast, sharpness and especially loudness depended significantly more on distortion level . For the parameters roughness and spectral flux that both measure roughness, the ratio between structure and sound was more balanced, even if the distortion level affected fluctuation strength more. Sumrning up, all parameters of sensory pleasantness were affected by distortion level more than by chord structure. Hence, H7 was accepted.

cln "' "' � = f,, ovd = 0 �
dist
;.< cln =='i ovd.. .... i:.i � Q.
rJJ dist
'0 cln ·s .. ....=�i:.i ovd 'i ...... i:.i � Q. dist rJJ
Tab. 3 : Descriptive statistics and ANOVAs of the parameters of sensory pleasantness for all structures
SN PCS PCS Ma Mi 7#9
181 (65) 663 (276) 511 (308) 745 (399) 774 (261) 579 (195) (all) (SN) (SN) (SN) (SN) (SN)
296 (77) 2,699 (795) 2,582 (1,055) 2,825 (583) 2,901 (740) 2,099 (782) (all) (SN) (SN) (SN) (SN, 7#9) (SN, Mi)
654 (295) 3,311 (635) 3,209 (645) 3,887 (1,357) 2,653 (963) 2,452 (983) (all) (SN) (SN) (SN, Mi, 7#9) (SN, Ma) (SN, Ma)
17 . 82 ( 4.00) 16 .52 (2.52) 14.79 (3.53) 18 .11 (4.03) 19 .45 (3.19) 30.36 (6 .57) (7#9) (7#9) (Mi, 7#9) (7#9) (PCS, 7#9) (all)
33.36 (4.41) 36.00 (5.43) 36.54 (6.61) 46.42 (7.70) 71.98 (15.67) 96.38 (21.60) (Ma, Mi, 7#9) (Mi, 7#9) (Mi, 7#9) (SN, Mi, 7#9) (all) (all)
54.11 (5 .95) 64.62 (9.24) 63.18 (10.93) 81.92 ( 10.49) 108 .09 (18 .66) 128 .62 (16 .43) (Ma, Mi, 7#9) (Ma, Mi, 7#9) (Ma, Mi, 7#9) (all) (all) (all)
951 (179) 1.003 (216) 1.202 (211) 1.292 (244) 1.264 (227) 1.297 (217) (PCS, Ma, Mi, 7#9) (Ma, Mi, 7#9) (SN) (SN, PCS) (SN, PCS) (SN, PCS)
1.058 (222) 1.271 (239) 1.716 (249) 1.765 (290) 1.676 (238) 1.588 (206) (PCS, Ma, Mi, 7#9) (PCS, Ma, Mi, 7#9) (SN, PCS) (SN, PCS) (SN, PCS) (SN, PCS)
2.076 (240) 2.237 (232) 2.406 (232) 2.519 (222) 2.386 (229) 2.306 (228) (PCS, PCS, Ma, Mi) (Ma) (SN) (SN) (SN)
11 2 p
.364***
.618***
.592***
.612***
. 800***
. 825***
.307***
.551***
.284***
f..>J 0\
......§
1 '"tl
� .... :::r: ä. "' .....

SN
cln 313 (44) "' "' Q,j =
439 (24) '0 ovd ::,
0 �
dist 486 (48)
cln . 849 ( .029) "' (all) "' Q,j = . 864 ( .034) ca ovd = (all) 0
E-< dist . 819 (.025)
(all)
PCS
287 (22) (Ma)
428 (35) (Ma)
513 (45)
.633 (.077) (SN)
.596 (.059) (SN, 7#9)
.531 (.016) (SN)
Tab. 3: continued
PCS
289 (37) (Ma)
440 (32)
515 (35)
.664 ( .044) (SN, 7#9)
.561 (.064) (SN)
.542 (.033) (SN, 7#9)
Ma Mi 7#9 11 2 p
331 (40) 323 (30) 313 (34) .190** (PCS, PCS)
464 (32) 456 (31) 454 (34) .139* (PCS)
539 (54) 516 (53) 525 (62) .097ns
.628 ( .063) .642 ( .039) .583 (.016) .761 *** (SN) (SN, 7#9) (SN, PCS, Mi)
.553 (.030) .559 ( .023) .541 ( .027) . 885*** (SN) (SN) (SN, PCS)
.524 (.009) .528 ( .013) .516 (.007) .970*** (SN) (SN) (SN, PCS)
Note: Values represent M (SD). Abbreviations in brackets are the structures that differ significantly from the value according to Tukey HSD post-hoc test. cln:clean, ovd: overdrive, dist: distortion, SN: single note, PCS : power chord, PCS: power chord with octave, Ma: major chord, Mi : minor chord, 7#9: altered dominant chord. * p < .05, ** p < .0 1 , *** p < .00 1 , ns = not significant, N= 270.
>-< ::1 ::t> i= (1) ::1 0 (1) 0 ....,&. � g o ·::1 0 ::1
(JQ 6 . � 0 ::r
a"' g 0
� "'
t,.) --..J
38 Jan-Peter Herbst
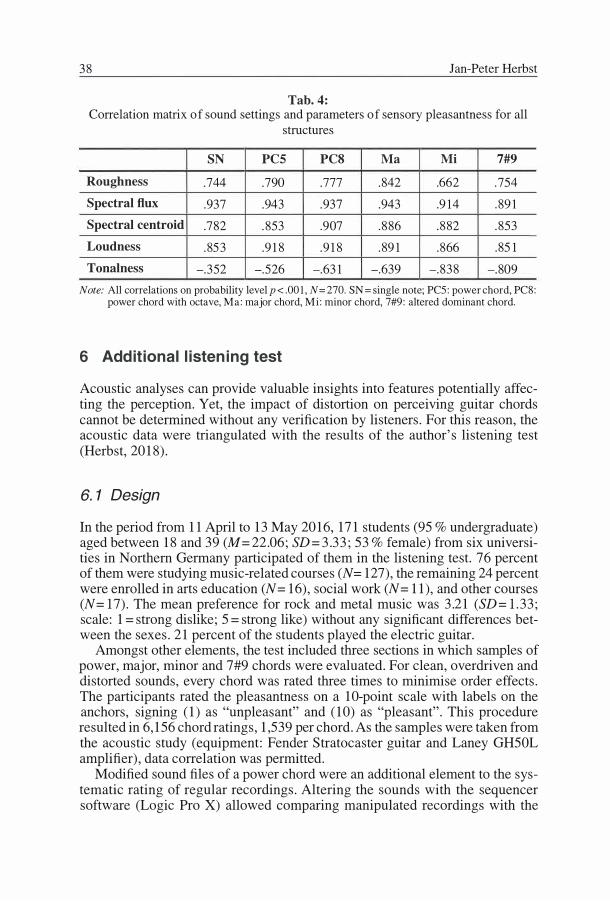
Tab. 4: Correlation matrix of sound settings and parameters of sensory pleasantness for all
structures
SN PCS PCS Ma Mi 7#9
Roughness .744 .790 .777 .842 .662 .754 Spectral flux .937 .943 .937 .943 .914 . 891 Spectral centroid .782 . 853 .907 . 886 . 8 82 .853 Loudness .853 .918 .918 .891 .866 .851 Tonalness -.352 -.526 -.631 -.639 -.838 -.809
Note: All correlations on probability level p < .00 1 , N= 270. SN = singie note; PCS : power chord, PCS : power chord with octave, Ma : major chord, Mi : minor chord, 7#9 : altered dominant chord.
6 Additional listening test
Acoustic analyses can provide valuable insights into features potentially affecting the perception. Yet, the impact of distortion on perceiving guitar chords cannot be determined without any verification by listeners. For this reason, the acoustic data were triangulated with the results of the author's listening test (Herbst, 2018).
6. 1 Design
In the period from 11 April to 13 May 2016, 171 students (95 % undergraduate) aged between 18 and 39 (M= 22.06; SD = 3.33; 53 % female) from six universities in Northem Germany participated of them in the listening test. 76 percent of them were studying music-related courses (N= 127), the remaining 24 percent were enrolled in arts education (N = 16), social work (N = 11 ), and other courses (N= l7). The mean preference for rock and metal music was 3.21 (SD = l.33; scale: 1 = strong dislike; 5 = strong like) without any significant differences between the sexes. 21 percent of the students played the electric guitar.
Amongst other elements, the test included three sections in which samples of power, major, minor and 7#9 chords were evaluated. For clean, overdriven and distorted sounds, every chord was rated three times to minimise order effects. The participants rated the pleasantness on a 10-point scale with labels on the anchors, signing (1) as "unpleasant" and (10) as "pleasant". This procedure resulted in 6,156 chord ratings, 1,539 per chord. As the samples were taken from the acoustic study (equipment: Fender Stratocaster guitar and Laney GH50L amplifier), data correlation was permitted.
Modified sound files of a power chord were an additional element to the systematic rating of regular recordings. Altering the sounds with the sequencer software (Logic Pro X) allowed comparing manipulated recordings with the
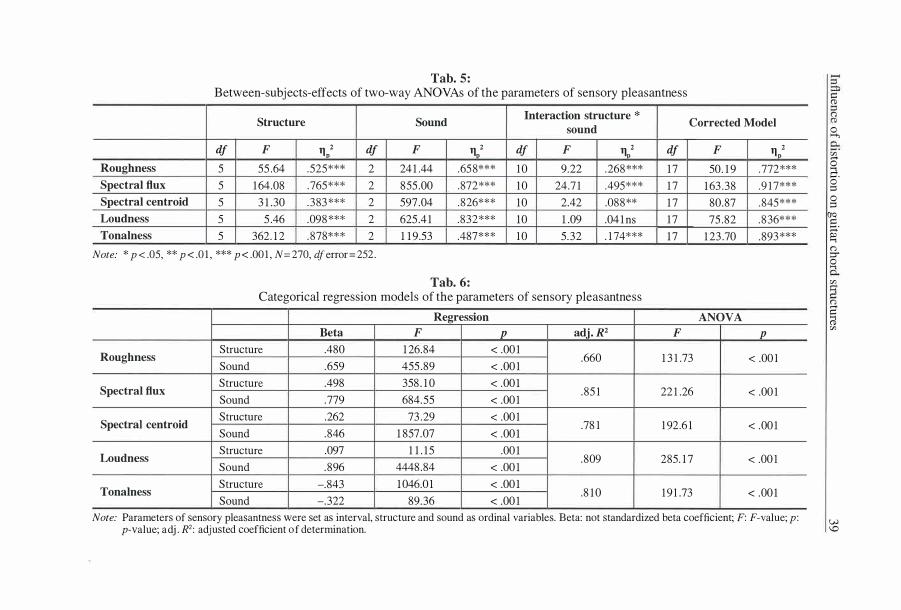
Tab. 5: Between-subjects-effects of two-way ANOVAs of the parameters of sensory pleasantness
Structure Sound Interaction structure * Corrected Model sound
df F 11/ df F 11/ df F 11/ df F 11/ Roughness 5 55.64 .525*** 2 241.44 .658*** 10 9.22 .268*** 17 50.19 .772*** Spectral flux 5 164.08 .765*** 2 855.00 .872*** 10 24.71 .495*** 17 163.38 .917*** Spectral centroid 5 31.30 .383*** 2 597.04 .826*** 10 2.42 .088** 17 80.87 .845*** Loudness 5 5.46 .098*** 2 625.41 .832*** 10 1.09 .041ns 17 75.82 .836*** Tonalness 5 362.12 .878*** 2 119.53 .487*** 10 5.32 .174*** 17 123.70 .893***
Note: * p < .05, ** p < .0 1 , *** p < .00 1 , N= 270, dferror= 252.
Tab. 6: Categorical regression models of the parameters of sensory pleasantness
Regression ANOVA Beta F p adj. R2 F p
Roughness Structure .480 126.84 < .001 .660 131.73 < .001
Sound .659 455.89 < .001
Spectral flux Structure .498 358.10 < .001 .851 221.26 < .001
Sound .779 684.55 < .001
Spectral centroid Structure .262 73.29 < .001 .846
.781 192.61 < .001 Sound 1857.07 < .001
Loudness Structure .097 11.15 .001 Sound .896 4448.84 < .001
.809 285.17 < .001
Tonalness Structure -.843 1046.01 < .001 .810 191.73 < .001
Sound -.322 89.36 < .001 Note: Parameters of sensory pleasantness were set as interval, structure and sound as ordinal variables. Beta: not standardized beta coefficient; F: F-value; p:
p-value; adj. R2: adjusted coefficient of determination.
= (1)
0 >-+,
00
0 a-. 0 ::::l 0 ::::l
(Jq = �-(") ::r 0
00
8 @ 00
w l,C)

40 Jan-Peter Herbst
originals. Regarding the parameters of sensory pleasantness, loudness and roughness could not be varied in a controlled manner, in contrast to sharpness. The frequency content between 1 .5 and 20 kHz was intensified by 1 5 dB with an equaliser, giving it a harsh sound (spectral centroid: original 2,017 Hz, high boost 3,157 Hz). For a booming sound, the high frequencies were attenuated by 15 dB (spectral centroid: 988 Hz). Tonalness was varied by mixing an artificial upper fifth and lower forth interval with 20 percent intensity to the signal with a pitch shifter, which obscured the root (tonalness: original .466, modified .437). The participants evaluated the manipulated signal on a 7-point scale to be "less pleasant" (1), "equally pleasant/unpleasant" (4), or "more pleasant" (7). With an open question at the end of the questionnaire, the participants were asked to describe how distortion affected their perception.
6.2 Results
The chord ratings followed the expected order of consonance (Cook & Fujisawa, 2006; Sethares, 2005; Tenney, 1988): The Major as the most pleasant and the altered 7#9 as the least pleasant chord. This hierarchy was confirmed for all three sounds except for the power chord, which was rated significantly more pleasant than the major chord for the overdriven and distorted sounds, even if only with small effects. Adding overdrive to clean sounds affected the ratings of the chords differently. For minor and altered chords, the pleasantness was reduced with a medium to strong effect, whereas for the power and major chords the effect was small. Increasing the gain from overdrive to distortion had a small to medium effect on all chords but least on the power chord. In general, the step from clean to overdrive had a greater effect than from overdrive to distortion.
Person-related factors proved to affect the ratings significantly. Regression analyses demonstrated the preference for rock and metal music to be the best indicator for liking overdriven and distorted sounds. Gender only played a significant role for the highly distorted chords. Being an electric guitar player did not influence the rating of clean chords. The overdriven and distorted chords, however, were rated significantly more pleasant by them. The playing experience was another factor increasing the tolerance for both distorted sounds with a small to medium effect. With regard to the manipulated recordings, raising the spectral centroid reduced pleasantness with a very strong effect. Attenuating the high frequencies resulted in an insignificant increase of pleasantness. Reducing tonalness decreased pleasantness significantly but with a small effect.
1 54 of the 17 1 participants answered the open question. 250 codes were divided into specific categories. Within 'sound characteristics', most of the statements addressed issues related to frequency. Sharpness was explicitly emphasised by mentioning the unpleasant treble resulting from distortion. Other parameters of the theoretical framework such as clarity, roughness and loudness were also found in the answers. Statements within the category 'listening habits' indicated that rock and metal music listeners are prone to be accustomed to distorted sounds, highly tolerating dissonant or harsh sounds. The category

Influence of distortion on guitar chord structures 41
'effects' comprised mainly negative attributes as for instance exhaustion, painfulness, aggressiveness, menace, inner disturbance, hardness, coldness and emotions like fear. Again, music preference played a central role for such feelings.
6. 3 Triangulation
Using identical sound files allowed correlating data of the acoustic study and the listening test. Spearman correlation indicated a close connection between the listeners' ratings and the acoustic values of most parameters. In compliance with the theoretical model, all parameters but tonalness (r = .668; p < .001) reduced the pleasantness of the chords. Roughness (r = -.409; p = .013) correlated least with the listeners' ratings. In contrast, spectral flux (r = -.899; p < .001) as an alternative parameter for roughness had an almost perfect negative correlation. Strong correlations of spectral centroid (r= -.744; p < .001) and loudness (r = -.668; p < .001) were also confirmed for having a negative effect on perception. Regarding the overarching variables, a close connection between perceived pleasantness and structural complexity (r = -.627; p < .001) as well as between pleasantness and sound setting (r = -.717; p < .001) has been found. More complex chords and higher distortion levels reduced the liking for many listeners.
7 Discussion
This research is the first one that has explored the influence of guitar distortion on the sensory pleasantness of various chord types based on an acoustical analysis in combination with a listening test. The statistical analysis of acoustic data gathered by feature extraction investigated the parameters of sensory pleasantness within the framework of Terhardt (1984) and Aures (1985). Both sides of the two-component concept were addressed; distortion level and choice of instrument equipment matched the acoustic aspects, different chord types met the music theoretical aspects. The results indicated a negligible effect of equipment (guitar model and amplifier) on the acoustic characteristics contributing to consonance perception. The amplifiers only differed significantly in loudness and sharpness, yet these parameters can be compensated with the equaliser and volume controls.
In compliance with the framework of Terhardt ( 1984) and Aures ( 1985), all parameters of sensory pleasantness correlated positively among each other except for tonalness, which correlated negatively. The strongest positive correlation was measured between loudness and spectral centroid, suggesting that sharper sounds increase the perceived loudness of a signal, particularly enhancing its unpleasantness (Aures, 1985). Tonalness was affected mainly by roughness as claimed by Helrnholtz (1863/1913), Terhardt (1984) and Aures (1985). lt also correlated with sharpness in compliance with Zwicker and Fastl's (2007) argument. Regarding the theoretical framework, it remains unclear why some parameters, in particular roughness and spectral flux correlated strongly while at

42 Jan-Peter Herbst
the same time differing significantly in the ANOVAs (Table 3), and then again correlating in varying degrees with the listeners' ratings.
In line with the expectation, both acoustic analysis and listening test confirmed the increasing of distortion level and structural complexity to result in dirninished sensory pleasantness. By comparing the influence of sound setting with the structural complexity on sensory pleasantness, the regression models and the ANOVAs indicated that distortion had a greater effect. Correlating the data confirmed this in both studies, even though in the listening test the effect of distortion was only slightly stronger than the effect of structure was. Nonetheless, there was sufficient evidence for concluding that distortion, in complex chords above all, is likely to decrease perceived pleasantness. These findings contribute to empirical evidence for common claims found in rock and metal music studies (Lilja, 2015; Walser, 1993) and musicology (Einbrodt, 1997). However, the influence of person-related factors including music preferences and guitar playing experience must be considered too.
The acoustic study did not discover conclusive evidence for distinct consonance groups complying with the hierarchy advocated by Roberts (1986) as well as by Cook and Fujisawa (2006). Neither did the results match the research on distorted guitar chords (Einbrodt, 1997; Lilja, 2005, 2015). Except for spectral flux, the statistical tests did not prove the expected order of sensory pleasantness. The distorted major chords as the roughest chord types and power chords being rougher than minor and altered dominant chords contradicted existing research and likewise theory on interval beatings. In the listening test, however, the theoretical assumptions were confirmed. The power and major chords differed only slightly and were rated significantly more pleasant than rninor and altered chords. Besides, the pleasantness of power and major chords also decreased only slightly with growing increase of distortion level contrary to the more complex chords.
Reflecting the findings of both studies, roughness may not be an optimal indicator for dissonance. Roughness neither fitted any theoretical model nor correlated with the listeners' ratings as strongly as the other parameters did. Speculating on the problematic role of roughness when discussing the different perception of major and rninor chords, Parncutt (2006, pp. 205f.) claimed the decisive factor of consonance to be the clear identifiability of the root: "Perhaps root ambiguity makes a bigger contribution than roughness to the difference in overall dissonance and prevalence between these two chords." Evidence for this argument was found in some of the listening test's open answers where it was stressed that distortion reduced transparency and clarity. Tonalness and roughness showed the strongest negative correlation in the acoustic analysis too (Table 1). The potentially overestimated role of roughness has also been addressed by Plack (2010):
„A possible explanation for why consonance is not linked to beating preference is that beating is unreliable as a cue. The salience of beats will vary greatly depending on the amplitudes, and relative amplitudes, of the interacting harmonics in the chord. The pattem of harmonic amplitudes is different for different instruments, helping to determine their distinct timbres. Hence, the salience of beating for a given musical interval will vary depending on which instrument or instruments are combined in the chord. Harmonicity does not depend on this, and so provides a more general basis for consonance preference." (p. 2)

Influence of distortion on guitar chord structures 43
Parncutt's (2006) argument of root identifiability, Plack's (2010) claim on harmonicity and Lilja's (2015) theory on guitar chords coincide, yet, they contradict some findings of the acoustic study. Regarding both parameters in question, roughness and tonalness, the major, minor and altered dominant chords deviate from those theories. The chords did not differ significantly in tonalness, and roughness was highest for major and lowest for dominant chords. However, Plack (2010) pointed to differences of consonance perception between diverse instruments, which are in line with Voigt (1985). The electric guitar with its distorted sound thus is likely to be special. Spectral flux in combination with loudness is suspected to be the primary indicator for dissonance in relation with the specific characteristics of the overdriven and distorted guitar. The natural fluctuations resulting from interval relations with clean sounds are increased by distortion's compression eff ect that accentuates the uneven envelope by acceleration and increased density, which ultimately diminishes the chord's pleasantness. Indicators for spectral flux as the prime factor are its highly significant differences: (1) between all three sound settings (Table 2), (2) between most chords for overdriven and distorted sounds but not for clean sounds (Table 3), (3) strong correlations of r > .900 for all chords between increasingly distorted sounds and spectral flux (Table 4). A close connection of spectral flux and loudness is likely because of their high correlation (Table 1). Both interrelate closely with distortion level too (Tables 1, 2, 4, 6). Hence, investigating the potentially dissonant effect of overdriven and distorted guitars requires considering temporal and loudness-related aspects rather than the spectral ones. This conclusion of the acoustic study largely complies with the results of the listening test. Spectral fluctuations showed an almost linear negative correlation with the listeners' ratings, thus emphasising its central role. Loudness was confirmed a decisive factor as well. Although it correlated with the listeners' ratings less than all other parameters but roughness did, many participants stressed its effect in their open statements. Sharpness clearly affected the perception too as the strong correlation between acoustic data and subjective ratings showed. The results of the modified recordings and the emphasis on harsh frequencies in the open answers, contributed to further proof for this connection. Tonalness affected the perceived pleasantness as well.
Summing up, the triangulated results indicate that loudness, spectral centroid, spectral flux, and tonalness, calculated with the MIR and Loudness toolboxes, are suitable parameters for predicting the generally perceived pleasantness of electric guitar chords played with different sounds. Some parameters like spectral centroid and loudness seem to be predicators more reliable for the impact of sounds whilst others such as spectral flux and tonalness rather are suitable for predicting the effect of chords structures. Spectral flux seems to be most promising for predicting the generally perceived pleasantness of chords based on acoustic features. Evidently, acoustic analyses must still include person-related aspects as demonstrated by the listening test.
The results of this study are subject to certain limitations. Based on acoustic data of isolated chords created in an experimental environment, the findings may differ from guitar playing in authentic musical contexts. In either way, be it a live situation or a studio production, the guitar sound is affected by playing

44 Jan-Peter Herbst
techniques, other instruments and sound engineering, which all influence volume, frequency and tonal composition. Moreover, person-related aspects affect the perception of distorted guitar sounds as the listening test revealed. Music preference and experience with an instrument certainly are main factors causing variance. This result highlights the need to consider learning, development and acculturation in research on consonance perception (Parncutt, 2006). Furthermore, the listening situation influences the perception of distorted guitars. In a concert, much distorted guitars might support the exciting atmosphere desired for bodily perception and their sharpness may be suitable for complementing the low hass drum and electric hass. In a relaxed or a stressful situation, distortion may be perceived very differently (Berlyne, 1971).
Methodically, experimental designs are prone to errors. For example, the recordings of the chords have been subject to the author's playing style and so the possibility cannot be ruled out that other factors, notably unintended variance in the string attack and tone fretting, have occurred. Another lirnitation rnight be the signals' length of 2.5 seconds that possibly prevented phenomena in the decay time to be captured. Regarding the acoustic feature extraction with music information retrieval technology, the unexpected values of roughness contrary to the theoretical expectations give rise to challenge Sethares' algorithm. Thus, errors due to a low-quality algorithm when calculating roughness cannot be excluded.
8 Conclusion
This study set out to assess the influence of distortion on the perception of guitar chord structures, to identify acoustic properties potentially causing dissonance and to find explanations for the common use of simple chords in rock and metal music genres. Although various genres of popular music have used the electric guitar as an accompanying harmonic instrument since the 1950s, there has been little research on this issue up to now. The study found evidence for the reduced pleasantness of heavily distorted guitar chords and indicated spectral fluctuation in connection with distortion's compression effect, intensified loudness and increased sharpness due to the extended overtone spectrum are central to this effect. However, the common use of single notes and power chords in rock and metal music riffs could not be explained completely by the acoustic characteristics of the distorted sound. On the one hand, as the guitar sound in rock and metal music genres became increasingly more distorted, the chord complexity could have been reduced to compensate for the dirninished sensory pleasantness of the instrument. On the other hand, the listening test demonstrated rock and metal music enthusiasts having great tolerance if not even a liking of heavily distorted chords regardless of complexi_ty. Thus, it appears that additional research should be carried out to explore why the harmonic complexity in many rock and metal music genres has not increased, especially since metal musicians and listeners have thrived for increased heaviness in genre history (Berger & Fales, 2005; Herbst, 2017).

Influence of distortion on guitar chord structures 45
Previous studies on guitar distortion have mostly been descriptive based on listening analysis and genre observation, or analytical by means of visual representations of spectra. Such approaches do not allow a statistical investigation on the effects of guitar distortion, and they lack a theoretical framework supported by empirical findings within psychology of music and acoustics. The present study contributes to existing knowledge in various respects: offers findings on the characteristics of distortion in relation to underlying harmonic structures, provides an acoustic framework, contributes results on whether or not and to which extent the respective parameters affect sensory pleasantness, and uncovers the influence of instrument equipment on acoustic properties. Future research in psychology of music could proceed with paying special attention to the issue of temporal modulation investigating the interrelation of spectral flux and roughness for distorted sounds. Moreover, since it remained unclear why some parameters correlated strongly but differed in the ANOVAs and in the listening test, further research is needed to determine whether the strong correlations result from the sound characteristics or rather arise from the algorithms of the features themselves.
The findings also contribute to the interdisciplinary field of popular music studies by laying an empirical foundation for structure-oriented music analysis, aesthetics and reception research. Building upon these results, genre development, performance conventions and the psychological effects of rock music can be explored. The study may inspire future research on the perception of the sounds of modern electronic or digital instruments, including issues as for instance different consonance perceptions resulting from various forms of technological production.
References
Aures, W. ( 1 985) . Der sensorische Wohlklang als Funktion psychoakustischer Empfindungsgrößen [Sensory consonance as a function of psychoacoustic parameters] . Acustica, 58, 282-290.
Berger, H. M. & Fales, C. (2005) . "Heaviness" in the perception of heavy metal guitar timbres. The match of perceptual and acoustic features over time. In P. D. Greene & T. Porcello (Eds .) , Wiredfor sound. Engineering and technologies in sonic cultures(pp. 1 8 1-197) . Middletown: Wesleyan University Press.
Berlyne, D. ( 1 97 1 ) . Aesthetics and psychobiology. New York: Appleton-Century-Crofts.Bourdage, M. (20 10) . "A young girl 's dream" . Examining the barriers facing female
electric guitarists . Journal of the International Association for the Study of Popular Music, 1 ( 1 ) , 1-16 .
Cazden, N. ( 1 945) . Musical consonance and dissonance: a cultural criterion. Journal of Aesthetics and Art Criticism, 4 ( 1 ) , 3-1 1 . http ://doi .org/1 0.2307 /426253
Cook, N. D. & Fujisawa, T. X. (2006). The psychophysics of harmony perception: Harmony is a three-tone phenomenon. Empirical Musicological Review, 1 (2), 106-126.
Cope, A. L. (20 10) . Black Sabbath and the rise of heavy metal music. Farnham: Ashgate.
Einbrodt, U. D. ( 1 997). Experimentelle Untersuchungen zum Gitarrensound in der Rockmusik [Experimental studies of the guitar sound in rock music] . Frankfurt/Main: PeterLang.

46 Jan-Peter Herbst
Elflein, D. (2010). Schwermetallanalysen: Die musikalische Sprache des Heavy Meta! [Heavy metal analyses] . Bielefeld: transcript. http: //doi.org/10.1436 l /transcript. 9783839415764
Encyclopaedia Britannica. (2006). Distortion. Retrieved from http://www.britannica. com/technology/distortion-communications
Frith, S. & McRobbie, A. (1978). Rock and sexuality. In S. Frith & A. Goodwin (Eds.) (1990), On record. Rock, pop, and the written word (pp. 371-389). London: Routledge.
Genesis. (2009). Loudness Toolbox [Computer software]. Retrieved from http://genesis-acoustics.com/en/loudness_online-32.html
Gracyk, T. (1996). Rhythm and noise: An aesthetics of rock. Durham: Duke University Press.
Grey, J. M. & Gordon, J. W. (1978). Perceptual effects of spectral modifications on musical timbres. Journal of the Acoustical Society of America, 63 (5), 1493-1500. http:// doi.org/10.1121/1.381843
Helmholtz, H. von (1913). Die Lehre von den Tonempfindungen als physiologische Grundlage für die Theorie der Musik. [On the sensations of tone as a physiological basis for the theory of music] (6th ed.). Braunschweig : Vieweg. (Original erschienen 1863). http: //doi.org/10.1007 /978-3-663-18653-3
Herbst, J.-P. (2014). Netzwerk Sound. Eine didaktische Herausforderung der populären Musik [Network sound]. Augsburg: Wißner.
Herbst, J.-P. (2016). Die Gitarrenverzerrung in der Rockmusik. Studien zu Spielweise und Ästhetik [The guitar distortion in the rock music]. Münster: LIT.
Herbst, J.-P. (2017). Historical development, sound aesthetics and production techniques of metal's distorted electric guitar. Meta! Music studies, 3 (1), 24--46.
Herbst, J.-P. (2018). Effects of guitar distortion on the listeners' perceptions of harmonic structures. Psychology of Music. Manuscript in peer-review.
Juchniewicz, J. & Silverman, M. J. (2011). The influence of progression type and distortion on the perception of terminal power chords. Psychology of Music, 41 (1), 119-130. http: //doi.org/10.1177 /0305735611422506
Lartillot, 0. (2014). M/Rtoolbox 1. 6. 1. User's manual. Aalborg: Aalborg University. Retrieved from https://www.jyu.fi/hum/laitokset/musiikki/en/research/coe/materials/ mirtoolbox/MIRtoolboxl .6. l guide
Lartillot, 0. & Toiviainen, P. (2007). A matlab toolboxfor musicalfeature extractionfrom audio. Proceedings of the 10th International Conference on Digital Audio Effects DAFx-07). Bordeaux, FRA. Retrieved from http://dafx.labri.fr/main/papers/p237.pdf
Lilja, E. (2005). Characteristics of heavy meta! chord structures. Their acoustic and modal construction, and relation to modal and tonal context. Licentiate Thesis, University of Helsinki. Retrieved from https : //helda.helsinki.fi/bitstream/handle/10138/19617 /characte.pdf?sequence=2
Lilja, E. (2015). Dealing with the 3rd: Anatomy of distorted chords and subsequent compositional features of classic heavy metal. In T.-M. Karjalainen & K. Kärki (Eds.), Modem heavy meta! - markets, practices and cultures. International Academic Research Conference, June 8-12 2015, Helsinki, Finland: conference proceedings (p. 393-403). Helsinki: Aalto-yliopisto.
MacCallum, J. & Einbond, A. (2008). Real-time analysis of sensory dissonance. In R. Kronland-Martinet, S. Ystad & K. Jensen (Eds.), CMMR 2007 (pp. 203-211). Berlin: Springer.
McAdams, S., Depalle, P. & Clarke, E. (2004). Analyzing musical sound. In E. Clarke & N. Cook (Eds.), Empirical musicology. Aims. Methods. Prospects (pp. 157-196). Oxford: Oxford University Press.

Influence of distortion on guitar chord structures 47
Moore, B. C., Glasberg, B. R. & Baer, T. (1997). A model for the prediction of thresholds, loudness, and partial loudness. Journal of the Audio Engineering Society, 45 (4), 224--240.
Müller, M. (2015). Fundamentals of music processing. Audio, analysis, algorithms, applications. Heidelberg: Springer.
Parncutt, R. (2006). Commentary on Cook & Fujisawa's "The psychophysics of harmony perception: Harmony is a three-tone phenomenon". Empirical Musicological Review, 1 (4), 204-209.
Plack, C. J. (2010). Musical consonance: The importance of harmonicity. Current Biology, 20 (11), 476-478. http://doi.org/10.1016/j.cub.2010.03.044
Plomp, R. & Levelt, W. J. M. (1965). Tonal consonance and critical bandwidth. Journal of the Acoustical Society of America, 38, 548-560. http://doi.org/10. l l 21/l . l 909741
Roberts, L. A. (1986). Consonant judgments of musical chords by musicians and untrained listeners. Acustica, 62, 163-171.
Roederer, J. H. (2008). The physics and psychophysics of music. An introduction (4th
ed.). New York: Springer. Schubert, E. & Wolfe, J. (2006). Does timbral brightness scale with frequency and spec
tral centroid? Acta acustica united with acustica, 92 (5), 820-825. Schubert, E., Wolfe, J. & Tarnopolsky, A. (2004). Spectral centroid and timbre in com
plex, multiple instrumental textures. In S. D. Lipscomb, R. Ashley, R. 0. Gjerdingen, P. Webster (Eds.), Proceedings of the 8th International Conference on Music Perception & Cognition, Evanston, IL (pp. 112-116). Adelaide, AUS: Causal productions.
Sethares, W. A. (2005). Tuning, timbre, spectrum, scale (2nd ed.). London: Springer. Tenney, J. (1988). A history of 'Consonance ' and 'Dissonance '. New York: Excelsior
Music Publishing Company. Terhardt, E. (1984 ). The concept of musical consonance: A link between music and psy
choacoustics. Music Perception, 1 (3), 276-295. http://doi.org/10.2307/40285261 Voigt, W. (1985). Dissonanz und Klangfarbe. Instrumentationsgeschichtliche und ex
perimentelle Untersuchungen [Dissonance and timbre]. Bonn: Verlag für systematische Musikwissenschaft.
Waksman, S. (1999). Instruments of desire. The electric guitar and the shaping of musical experience. Cambridge, MA: Harvard University Press.
Walser, R. (1993). Running with the devil. Power, gender, and madness in heavy metal music. Hanover: Wesleyan University Press.
Zollner, M. (2014). Physik der Elektrogitarre [Physics of the electric guitar; Teilveröffentlichung]. Retrieved from http: //gitec-forum.de/GitecWP/wp-content/uploads/ 2015/04/Physik-der-Elektrogitarre_GITEC.pdf
Zwicker, E. & Fastl, H. (2007). Psychoacoustics. Facts and models. Berlin: Springer.