Embed Size (px)
Citation preview

8/9/2019 Lloyds TSB AUG 06 Economics Weekly
http://slidepdf.com/reader/full/lloyds-tsb-aug-06-economics-weekly 1/17
FX Strategy Weekly
Friday, 6th August 2010
Kenneth BrouxSenior Market Economist
0207 158 1750
Market Strategy
Lloyds TSB Corporate Markets Economic Research, 10 Gresham Street, London, EC2V 7AE, Switchboard: 0207 626 1500.
1
• Market Outlook
Tactical view:
= Risk of snap back in GBP/USD and USD/JPY
= Long AUD positions outpace CAD
Dollar weakness continues to characterise G10 fx markets as doubts over the US economymultiply and all-time lows for US yields boost the attractiveness of carry. With the Fedrunning out of policy options and evidence of macro economic decoupling in the G10prevailing, we look for the AUD to remain a desirable G10 destination. A test of 85.0 inUSD/JPY now looks probable. Though next week will be dominated by the FOMC, all eyesin the UK will be on the latest BoE Inflation Report (QIR) on Wednesday. The QIR has proveda hurdle for GBP in the past and could again prove the proverbial ‘bridge too far’ thatforces GBP/USD bulls to rein in their exuberance. Special notes on GBP/USD and AUD/
ZAR are included in this week’s publication.
• Recap
• GBP/USD closed up 1.7% at 1.5962 and just fell short of 1.60. GBP lost 0.04% vs the EUR asEUR/USD (+1.7%) kept track of GBP/USD. GBP/CAD burst through the 1.64 level (1.65target) after a shock 139,000 drop in Canadian employment in July. The MPC left BankRate on hold at 0.50% and the APF at £200bln, but suspense is set to stay elevated overthe next two weeks and leaves GBP vulnerable to possible profit taking after a stellar run.Elsewhere, we note the gains for the JPY and the fall in USD/JPY blow 0.8550. A test of theNov-09 low now looms, prompting possible intervention to weaken the yen.
• US payrolls dropped 131,000 in July, double the consensus estimate. Data for June wasrevised down to -221,000 from -125,000. The unemployment rate held unchanged at
9.5%. UK data highlights were the 4.3pt drop in the construction PMI in July, and smallerfalls in the manufacturing (-0.2pts) and services (-1.3pts) PMIs. The three PMIs have nowdeclined simultaneously for two consecutive months, pointing to a slower rate of expansionin Q3. The NIESR reported a rise in GDP of 0.9% in the three months to July vs 1.1% in June.The ECB left its interest rate on hold at 1.0% but reined in optimism over the economy anddeclared no recovery victory. Strong Q2 GDP data are expected from Germany next week.
• Backed by bullish seasonals and weaker macro data, gilts logged an impressive weekwith yields dropping markedly across the curve, but with the long end outperforming. 10yyields descended below 3.25% to a 3.23% close. Support for a further decline towards 3%could be on the cards. 5y swaps dropped 7bp to 2.35% and the 10y closed 11bp downat 3.27%, causing the 2y/10y spread to flatten below 190bp. The 2y/10y gilts spreadtightened below 250bp and closed the week at 245bp. The 3mth Libor/Ois spread heldsteady at 25bp. The 10y swap spread was also unchanged at 5bp. The 5y gilt auction
drew solid demand and was covered 1.99 times (0.7bp tail).
Contents Page
Market Outlook ................................................................................................................ 2
Quantitative Market Analysis................. ............................................................................. 4
FX & commodity futures positioning ............................................................... 5
FX options: Risk reversal skews ...................................................................... 6
FX options: Implied volatility ............................................................................ 7
Economic data surprises ................................................................................. 8
Interest rate spreads vs. FX............................................................................. 9
S&P500 vs. FX ................................................................................................ 10
Commodities vs. FX ........................................................................................ 11
Market Review ............................................................................................................. ..... 12
Disclaimer ........................................................................................................ ................. 15
Close
Weekly
Change
FX %
GBP/EUR 1.2023 -0.04%
GBP/USD 1.5962 1.74%
GBP/JPY 136.00 0.26%
GBP/CHF 1.6542 1.25%
GBP/AUD 1.7423 0.42%
GBP/NZD 2.1870 1.21%
GBP/CAD 1.6405 1.55%
GBP/NOK 9.5047 -0.34%
GBP/SEK 11.31 -0.01%
EUR/USD 1.3276 1.72%
USD/JPY 85.21 -1.46%
AUD/USD 0.9162 1.33%
NZD/USD 0.7299 0.54%
USD/CAD 1.0278 -0.18%
USD/SEK 7.0869 -1.71%
USD/NOK 5.9543 -2.00%
USD/CHF 1.0363 -0.47%
Swaps % bp
2yr 1.381 -0.1
5yr 2.345 -7.0
10yr 3.270 -11.7
Equities %
FTSE100 5332.39 1.41%

8/9/2019 Lloyds TSB AUG 06 Economics Weekly
http://slidepdf.com/reader/full/lloyds-tsb-aug-06-economics-weekly 2/17
G10 FX - GBP/USD: negate QIR?
Market Strategy6 August 2010Kenneth Broux - Senior Market Economist
contact: +44 207 158 1750
We have argued the case for a rally in GBP/USD since early July,
but following a stellar run from below 1.48 on 1 July to above 1.59in early August, we wonder if upside has now been exhaustedand a correction back to 1.55 looms.
Though next week will be primarily dominated by the FOMCdecision on Tuesday and whether or not new tools are consideredto prod the US recovery, all eyes in the UK will be on the latest BoEInflation Report (QIR) on Wednesday August 11. The QIR has proveda hurdle for GBP in the past and could again prove the proverbial‘bridge too far’ that forces GBP/USD bulls to rein in theirexuberance. However, the latest jump in correlation of GBP/USDwith risk assets suggests that a test of 1.60 remains achievableuntil aversion for equities and commodities returns. The initially
tame reaction by risk to the weak US August employment dataindicates that demand for carry is still intact from which GBP/USDshould indirectly benefit.
One could argue that the immediate concern from a GBPperspective should theoretically be the BoE Inflation Report (Aug11) and the MPC Minutes (Aug 18). However, a 0.8/0.9 correlationof GBP/USD with equities and commodities (see chart 2) arguesto the contrary. Inflation Reports have since the start of the recessionoccasionally resulted in sharp swing for GBP/USD (see chart 1),but this time the deterioration in US fundamentals and remarkable,though questionable muted response in commodities and stockscould mitigate the bearish influences from the QIR.
The QIR will be important to understand i/ what the MPC makesof the growth and inflation projections for the next two yearsbased on public spending cuts and VAT hike presented in theBudget and ii/ if lone hawk Sentance still voted for an immediaterate hike. Bank governor King last week emphasised thatdownside risks to growth still do prevail and that therefore ‘puttingthe foot on the brakes’ would be a policy mistake. If consideringthe right amount of stimulus is currently at the heart of the policydiscussions, then this implies that additional QE could still bediscussed (UK 10y yields heading for 3%?). One could thereforeargue that the QIR could be a GBP negative event as the rearview mirror image of a stronger economy is negated by the
uncertainty ahead as public spending cuts start to bite and thepace of credit easing slows. Back in May, the BoE forecast GDPgrowth of 1.2% this year and 2.3% in 2011. CPI inflation is forecastto average 1.7% this year and stay below target in 2011 based onimplied market interest rates.
The retreat of the USD vs G10 currencies is a factor and cannot beoverlooked as worries grow that the Fed is effectively running outof ammunition to spur the economic recovery. Though doingnothing is not politically palatable ahead of the midterm elections,the impact on the economy from rolling over the proceeds of $200bln worth of MBS securities, an idea discussed in the WSJthis week, is highly debateable. Having cut interest rates to 0.25%
and purchased securities in excess of $1.0trln, one wonders whatan extra $200bln or reduced interest rate on commercial bankreserves will achieve in a world where 30y and 15y mortgagesrates have already reached a record low. Fed fund futures havenow pushed forward the timing of a first rate hike past Nov-11.This is the ‘new normal’.
Chart 1: GBP/USD range swings on QIR day
Chart 2: GBP/USD: watch stocks, commodities
0
100
200
300
400
500
600
700
F e b
- 0 6
M a y
- 0 6
A u g
- 0 6
N o v
- 0 6
F e b
- 0 7
M a y
- 0 7
A u g
- 0 7
N o v
- 0 7
F e b
- 0 8
M a y
- 0 8
A u g
- 0 8
N o v
- 0 8
F e b
- 0 9
M a y
- 0 9
A u g
- 0 9
N o v
- 0 9
F e b
- 1 0
M a y
- 1 0
average 220pips
-1
-0.75
-0.5
-0.25
0
0.25
0.5
0.75
1
1 - A p r
8 - A p r
1 5 - A p r
2 2
- A p r
2 9
- A p r
6 - M a y
1 3 - M a y
2 0
- M a y
2 7 - M
a y
3 - J u n
1 0 - J u n
1 7 - J u n
2 4
- J u n
1 - J u l
8 - J u
l
1 5 - J u
l
2 2
- J u l
2 9
- J u l
5 - A u g
CRB S&P 500
FF futures strip (post Aug NFP): low for longer
0
0.1
0.2
0.3
0.4
0.5
0.6
M a r - 1 1
A p r - 1 1
M a y - 1 1
J u n - 1 1
J u l - 1 1
A u g - 1 1
S e p - 1 1
O c t - 1 1
N o v - 1 1
%

8/9/2019 Lloyds TSB AUG 06 Economics Weekly
http://slidepdf.com/reader/full/lloyds-tsb-aug-06-economics-weekly 3/17
This document, its contents and any related communication (altogether, the “Communication”) does not constitute or form part of any offer to sell or an invitation to subscribe for, holdor purchase any securities or any other investment. This Communication shall not form the basis of or be relied on in connection with any contract or commitment whatsoever. ThisCommunication is not intended to form, and should not form, the basis of any investment decision. This Communication is not and should not be treated as investment research, aresearch recommendation, an opinion or advice. Recipients should conduct their own independent enquiries and obtain their own professional legal, regulatory, tax or accountingadvice as appropriate. Any transaction which a recipient of this Communication may subsequently enter into may only be on the basis of such enquiries and advice, and thatrecipient’s own knowledge and experience. This Communication has been prepared by, and is subject to the copyright of, Lloyds. This Communication may not, in whole or in part, bereproduced, transmitted, stored in a retrieval system or translated in any other language in any form, by any means without the prior written consent of Lloyds. This Communicationis provided for information purposes only, and is confidential and may not be referred to, disclosed, reproduced or redistributed, in whole or in part, to any other person. ThisCommunication is based on current public information.Whilst Lloyds has exercised reasonable care in preparing this Communication, no representation or warranty, express or implied, is made as to the accuracy, reliability orcompleteness of the facts and date contained herein by Lloyds, its group companies and its or their directors, officers, employees, associates and agents (altogether, “LloydsPersons”). The information contained in this Communication has not been independently verified by Lloyds. The information and any opinions in this Communication are subject tochange at any time and Lloyds is under no obligation to inform any person of any such change. This Communication may refer to future events which may or may not be within thecontrol of Lloyds Persons, and no representation or warranty, express or implied, is made as to whether or not such an event will occur. To the fullest extent permitted by applicablelaw, regulation and rule of regulatory body, Lloyds Persons accept no responsibility for and shall have no liability for any loss in relation to this Communication, however arising(including in relation to any projections, analyses, assumptions and/or opinions contained herein nor for any loss of profit or damages or any liability to a third party). Lloyds TSBCorporate Markets is a trading name of Lloyds. Lloyds TSB Bank plc’s registered office is at 25 Gresham Street, London EC2V 7HN and it is registered in England and Wales under no.
2065. Lloyds is Authorised and regulated by the Financial Services Authority and is a member of the London Stock Exchange.
GBP/USD: stretching gains into low 1.60’s? Resistance at 1.6070
Daily QGBP= 17/11/09 - 16/08/10 (GMT)
1.5814
Price
USD
.1234
1.41
1.42
1.43
1.44
1.45
1.46
1.47
1.48
1.49
1.5
1.51
1.52
1.53
1.54
1.55
1.56
1.57
1.58
1.59
1.6
1.61
1.62
1.63
1.64
1.65
23 30 07 14 21 28 04 11 18 25 01 08 15 22 01 08 15 22 29 05 12 19 26 03 10 17 24 31 07 14 21 28 05 12 19 26 02 09 16
Nov 09 December 2009 January 2010 February 2010 March 2010 April 2010 May 2010 June 2010 July 2010 Aug 10

8/9/2019 Lloyds TSB AUG 06 Economics Weekly
http://slidepdf.com/reader/full/lloyds-tsb-aug-06-economics-weekly 4/17
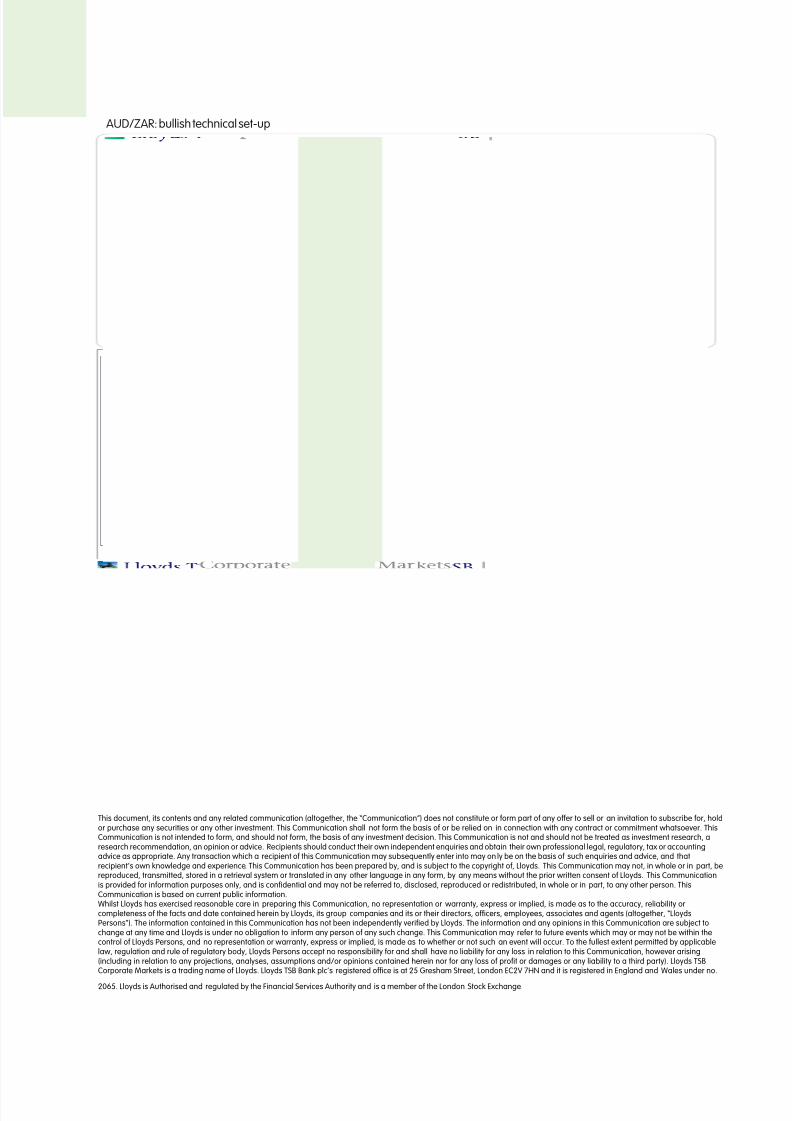
G10 FX - AUD/ZAR: bullish set-up3-mth target: 6.90
Market Strategy6 August 2010Kenneth Broux - Senior Market Economist
contact: +44 207 158 1750
The resilience of AUD/USD following the RBA pause, and thepotential negative influences on the ZAR stemming from weakermacro data and plans to tax capital inflows argue for a rally inAUD/ZAR in the weeks ahead. We target a move up to 6.90 overthe next three months, with a move up to 7.0 not ruled out.
AUD/ZAR has been oscillating in a fairly narrow 6.5380-6.7155trading range since July 8, but has been drifting back towards theupper end of that range since July 28. Key resistance is situated inthe 6.70-6.7155 area, levels that have been tested in mid-July, butwith the absence of follow through bidding resulting in the crossslipping back. Technically, an ascending triangle formation meansthe currency pair is setup for an upward move, putting a test of
6.7150 resistance on our radar (see chart on p2).
Though equities may struggle to extend the rally from the early Julybase when bullish corporate news subsides, the base case scenariois for positive investor sentiment towards risk assets to stay intactand volatility to stabilise. We believe that positive AU/US ratedifferentials should keep AUD/USD underpinned in the 0.90 area.With regard to the US, it is still unclear whether the slowdown in Q2GDP growth is a blip or start of a more serious slowdown. Adecline in US 3-mth libor below 0.50% and a rally in short-dated FFfutures indicate that the market is taking a more pessimistic viewof the outlook ahead. This implies that deploying additional Fedstimulus is now considered a probable policy outcome. This
threatens to depress the USD lower vs non-QE currencies like theAUD, or currencies where exceptional measures are graduallyphased out (EUR), at least until signs of US deterioration spill overto the rest of the G10. This is not yet the case.
The decision by the RBA earlier this week to leave the overnightcash rate on hold at 4.50% does not imply that we have reachedthe end of the tightening cycle. With underlying inflation set to stayat the upper end of the target range through to mid 2011, a furthertightening cannot be ruled out this autumn if positive momentum inoutput growth is sustained and unemployment continues to fall.
The ZAR has equally been a beneficiary from a rise in USD aversion
since late June, with USD/ZAR dropping back below 7.50 to 7.23,the lower end of the trend channel. The proposal by the ANC to taxcapital inflows to keep the rand competitive is debateable in thecontext of the country’s current account deficit and thirst for foreigncapital to fund the trade deficit. An alternative for weakening therand could include the intervention by the S. Africa Reserve Bank.
Finally, quantitative metrics show that the correlation of AUD/USDand USD/ZAR with stocks and commodities are statisticallyrelevant, and are pretty evenly distributed, meaning that bothpairs are subject to fairly synchronised pullbacks if equities retreat.The correlation of AUD/ZAR with the S&P currently stands at 0.93vs 0.86 for USD/ZAR. Similar values apply when comparing
correlations with the CRB index. Last but not least, demand for
AUD among global reserve managers has been on an upward
path this year and with positive growth and rate dynamics intact,
we think the AUD should stay well supported.
Chart 1: AUD/ZAR vs 3-mth Libor spread
Chart 3: current account deficit of SA now larger than
Australia
Chart 2: Correlation with S&P 500: AUD and ZAR level vs
USD
% OF GDP
91 92 93 94 95 96 97 98 99 00 01 02 03 04 05 06 07 08 09 10-8
-7
-6
-5
-4
-3
-2
-1
0
1
2
3
SOUTH AFRICAAUSTRALIA
-1.0
-0.8
-0.5
-0.3
0.0
0.3
0.5
0.8
1.0
5 - A p r
1 3 - A p r
2 1 - A p r
2 9 - A p r
7 - M a y
1 5 - M a y
2 3 -
3 1 - M a y
8 - J u n
1 6 - J u n
2 4 - J u n
2 - J u
l
1 0 - J u
l
1 8 - J u
l
2 6 - J u
l
3 - A u g
AUD/USD ZAR/USD
6.25
6.35
6.45
6.55
6.65
6.75
6.85
6.95
7
- A p r
1 6
- A p r
2 7
- A p r
6 -
M a y
1 7 -
M a y
2 6 -
M a y
4
- J u n
1 5
- J u n
2 4
- J u n
5 - J u
l
1 4 - J u
l
2 3 - J u
l
3 - A u g
150
160
170
180
190
200
210
220
230
AUD/ZAR, LHS SA/AU 3MTH LIBOR SPREAD, RHS bps
8/9/2019 Lloyds TSB AUG 06 Economics Weekly
http://slidepdf.com/reader/full/lloyds-tsb-aug-06-economics-weekly 5/17
This document, its contents and any related communication (altogether, the “Communication”) does not constitute or form part of any offer to sell or an invitation to subscribe for, holdor purchase any securities or any other investment. This Communication shall not form the basis of or be relied on in connection with any contract or commitment whatsoever. ThisCommunication is not intended to form, and should not form, the basis of any investment decision. This Communication is not and should not be treated as investment research, aresearch recommendation, an opinion or advice. Recipients should conduct their own independent enquiries and obtain their own professional legal, regulatory, tax or accountingadvice as appropriate. Any transaction which a recipient of this Communication may subsequently enter into may on ly be on the basis of such enquiries and advice, and thatrecipient’s own knowledge and experience. This Communication has been prepared by, and is subject to the copyright of, Lloyds. This Communication may not, in whole or in part, bereproduced, transmitted, stored in a retrieval system or translated in any other language in any form, by any means without the prior written consent of Lloyds. This Communicationis provided for information purposes only, and is confidential and may not be referred to, disclosed, reproduced or redistributed, in whole or in part, to any other person. ThisCommunication is based on current public information.Whilst Lloyds has exercised reasonable care in preparing this Communication, no representation or warranty, express or implied, is made as to the accuracy, reliability orcompleteness of the facts and date contained herein by Lloyds, its group companies and its or their directors, officers, employees, associates and agents (altogether, “LloydsPersons”). The information contained in this Communication has not been independently verified by Lloyds. The information and any opinions in this Communication are subject tochange at any time and Lloyds is under no obligation to inform any person of any such change. This Communication may refer to future events which may or may not be within thecontrol of Lloyds Persons, and no representation or warranty, express or implied, is made as to whether or not such an event will occur. To the fullest extent permitted by applicablelaw, regulation and rule of regulatory body, Lloyds Persons accept no responsibility for and shall have no liability for any loss in relation to this Communication, however arising(including in relation to any projections, analyses, assumptions and/or opinions contained herein nor for any loss of profit or damages or any liability to a third party). Lloyds TSBCorporate Markets is a trading name of Lloyds. Lloyds TSB Bank plc’s registered office is at 25 Gresham Street, London EC2V 7HN and it is registered in England and Wales under no.
2065. Lloyds is Authorised and regulated by the Financial Services Authority and is a member of the London Stock Exchange.
AUD/ZAR: bullish technical set-up
Daily QAUDZAR=R 18/09/09 - 10/08/10 (GMT)
Price
ZAR
.1234
6.25
6.3
6.35
6.4
6.45
6.5
6.55
6.6
6.65
6.7
6.75
6.8
6.85
6.9
6.95
7
7.05
7.10
7.15
7.2
7.25
7.3
7.35
7.4
21 28 05 12 19 26 02 09 16 23 30 07 14 21 28 04 11 18 25 01 08 15 22 01 08 15 22 29 05 12 19 26 03 10 17 24 31 07 14 21 28 05 12 19 26 02 09
Sep 09 Oct 09 Nov 09 Dec 09 Jan 10 Feb 10 Mar 10 Apr 10 May 10 Jun 10 Jul 10

8/9/2019 Lloyds TSB AUG 06 Economics Weekly
http://slidepdf.com/reader/full/lloyds-tsb-aug-06-economics-weekly 6/17
Quantitative Market Analysis
• Risk of snap back in GBP/USD and USD/JPY
• Long AUD positions outpace CAD
4
Table 1: 1-month rolling correlations
Contrarian Indicators
Risk Reversal Skews (based on options prices, see page 7)
and IMM data (highlighting speculative positioning, see page
6) are used to analyse foreign exchange to understand how
stretched currencies may have become.
Speculative short GBP positions fell for a 7th successive week in
the week to July 27th. A decline of 5,500 short contracts
reduced total short positions to -28,000, the lowest since
January 19th. A further drop is likely to have taken place over
the week just passed as GBP/USD ran up close to 1.60. GBP/
USD negotiated the MPC decision impeccably and even
shrugged off a late sell-off in risk on Friday as equities pulled
back on weak US employment data. Event risk is set to
remain elevated over the next two weeks for GBP and is
certain to influence positioning. The BoE QIR is due on August
11th and the MPC minutes are due on August 18th. Short EUR
contracts were reduced by over 3,000 contracts to below -
30,000 (-29,200). This means that short EUR/GBP positioning
flipped back to negative for the first time since June 29th, i.e.
short GBP positions are now smaller than short EUR positions.
This has to date not been reflected in spot, as EUR/GBP
continues to oscillate around 0.83 pivot.
The reversal in AUD positioning gained accelerated for a 3rd
successive week as long contracts reached 49,900, the
highest since May 11. This was backed in AUD/USD as the
cross vaulted 0.92 for the first time since May 4th. Long CAD
contracts were marked up by 4,700 to 43,800, reversing the
declines over the last two weeks. The resulting positive gap
between long AUD/CAD along with a shock drop in Canadian
employment in July boosted spot above 0.94 and means a
return to 0.9440 is now on the cards. Long CHF posit ioning
was scaled back below 15,000 contracts to 13,400, marking
a 4th straight drop. Long JPY exposure also fell but is likely to
prove an aberration as USD/JPY slipped closer to 85.0 ledby a post US payrolls squeeze. This should boost long JPY vs
USD contracts back towards the 50,000 mark.
The dollar index made further progress towards our 80.0
target support level after a 0.7% drop on Friday. The index
has now lost eight big figures since June. Short USD positioning
remains a distinct risk into next week, though the decision by
the Fed to stand pat at Tuesday’s FOMC could cause USD
pessimism to stabilise. A breach of 80.0 brings a move to
79.715 in play, the next Fibo support 38.2%). The fall in US 3-
month libor to 0.42% continues to bolster the attractiveness of
a USD funded carry trade, with high yielders attracting
demand, despite the late profit taking in stocks. Risk reversal
skews continue to paint a bearish picture for the USD, though
a stabilisation from last week indicates that the level of
bearishness has plateaud. The rise for GBP/USD percentile
rank (80%) infers a heightened danger of a counter trend
move. USD/JPY has also edged close to ‘snap back territory‘
as the percentile rank approaches 20%. Vol curves in EUR/
USD and EUR/GBP continued their steepening bias as 1mthvol dropped respective to 1y vol.
FX correlations
Market correlations are shown on pages 10-12. 1-month rolling
correlations are plotted for G-10 FX against interest rate
spreads, S&P 500 and commodities (represented through the
CRB index).
Correlation of G10 currencies with 2y spreads eased back for
our target crosses as most yields shadowed 2y treasuries
lower. This marked a shift from last week, with the only
exception of USD/JPY where a correlation of 0.88 remainsstatistically relevant. Longer-dated maturities have also
retreated and offer no clear guidance.
Correlation with equities stayed elevated, with 0.92 for AUD/
JPY and 0.82 for GBP/USD standing out. The correlation of
commodities is equally relevant land includes GBP/USD (0.94)
and AUD/USD (0.94). Unless equities and commodities
collapse, GBP/USD should continue to do well technically and
overcome possible pressures from next week’s BoE QIR.
Disappointing and occasional positive US data continue
to hurt the USD. Let’s see what the Fed has up its sleeve
next week, but to be honest we are not holding our
breath in terms of actual relief from new measures for
the economy. No change may spur a USD bounce.
AUDUSD USDCAD EURUSD GBPUSD USDJPY AUDJPY EURJPY
2 Y R SPD 0.57 -0.15 0.74 0.67 0.88 0.39 0.57
10 YR SPD 0.57 -0.30 0.60 0.22 0.39 0.59 0.65
S&P500 0.95 -0.86 0.79 0.82 -0.46 0.92 0.85
Gold -0.37 0.00 -0.49 -0.42 0.30 -0.29 -0.52
Oil 0.95 -0.84 0.87 0.86 -0.70 0.78 0.74
elative Y ield Cur ve -0. 05 0.05 -0. 03 0. 66 0. 35 -0. 35 -0.34
CRB 0.94 -0.84 0.90 0.94 -0.76 0.73 0.73
8/9/2019 Lloyds TSB AUG 06 Economics Weekly
http://slidepdf.com/reader/full/lloyds-tsb-aug-06-economics-weekly 7/17
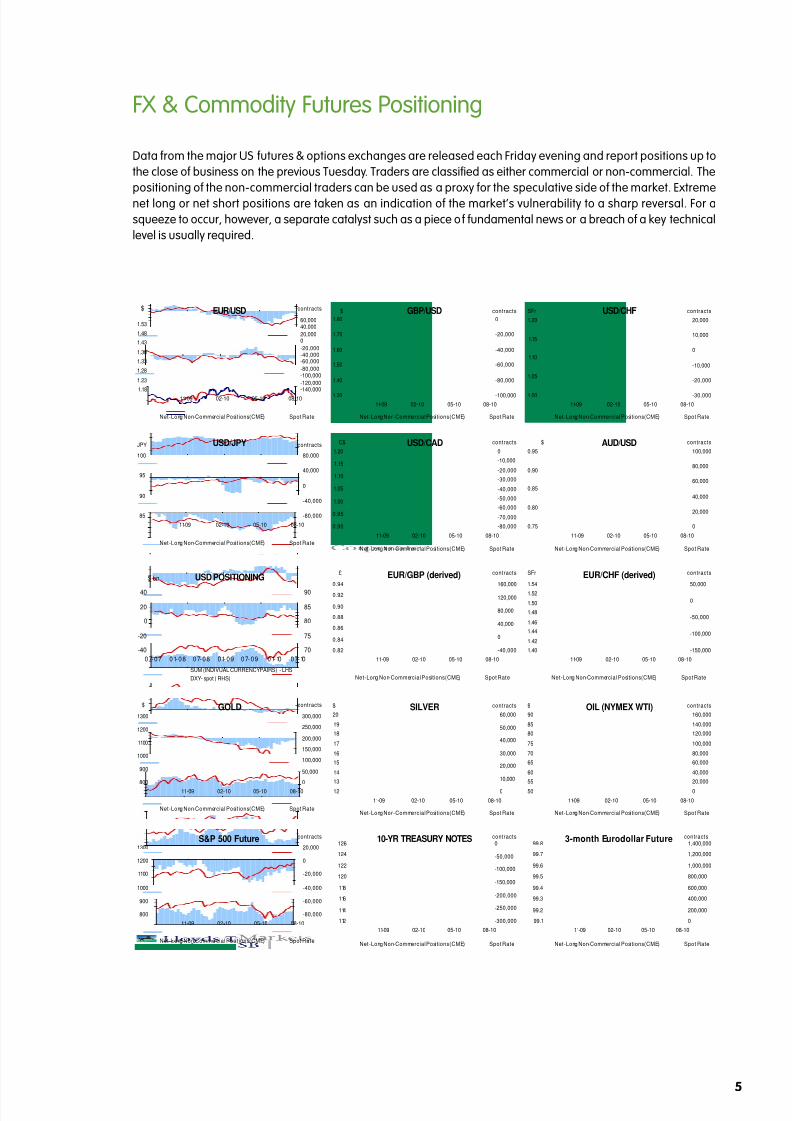
FX & Commodity Futures Positioning
Data from the major US futures & options exchanges are released each Friday evening and report positions up to
the close of business on the previous Tuesday. Traders are classified as either commercial or non-commercial. The
positioning of the non-commercial traders can be used as a proxy for the speculative side of the market. Extreme
net long or net short positions are taken as an indication of the market’s vulnerability to a sharp reversal. For a
squeeze to occur, however, a separate catalyst such as a piece of fundamental news or a breach of a key technical
level is usually required.
5
EUR/USD
-140,000-120,000
-100,000-80,000
-60,000-40,000-20,000
020,000
40,00060,000
08-1005-1002-1011-09
contracts
1.18
1.23
1.28
1.33
1.38
1.43
1.48
1.53
$
Net-Long Non-Commercial Positions (CME) Spot Rate
GBP/USD
-100,000
-80,000
-60,000
-40,000
-20,000
0
08-1005-1002-1011-09
contracts
1.30
1.40
1.50
1.60
1.70
1.80
$
Net-Long Non-Commercial Positions (CME) Spot Rate
USD/CHF
-30,000
-20,000
-10,000
0
10,000
20,000
08-1005-1002-1011-09
contracts
1.00
1.05
1.10
1.15
1.20
SFr
Net-Long Non-Commercial Positions (CME) Spot Rate
USD/JPY
-80,000
-40,000
0
40,000
80,000
08-1005-1002-1011-09
contracts
85
90
95
100
JPY
Net-Long Non-Commercial Positions (CME) Spot Rate
USD/CAD
-80,000
-70,000
-60,000
-50,000
-40,000
-30,000
-20,000
-10,000
0
08-1005-1002-1011-09
contracts
0.90
0.95
1.00
1.05
1.10
1.15
1.20
C$
Net-Long Non-Commercial Positions (CME) Spot Rate
AUD/USD
0
20,000
40,000
60,000
80,000
100,000
08-1005-1002-1011-09
contracts
0.75
0.80
0.85
0.90
0.95
$
Net-Long Non-Commercial Positions (CME) Spot Rate
GOLD
0
50,000
100,000
150,000
200,000
250,000
300,000
08-1005-1002-1011-09
contracts
800
900
1000
1100
1200
1300
$
Net-Long Non-Commercial Positions (CME) Spot Rate
SILVER
0
10,000
20,000
30,000
40,000
50,000
60,000
08-1005-1002-1011-09
contracts
12
13
14
15
16
17
18
19
20
$
Net-Long Non-Commercial Positions (CME) Spot Rate
OIL (NYMEX WTI)
0
20,000
40,000
60,000
80,000
100,000
120,000
140,000
160,000
08-1005-1002-1011-09
contracts
50
55
60
65
70
75
80
85
90
$
Net-Long Non-Commercial Positions (CME) Spot Rate
10-YR TREASURY NOTES
-300,000
-250,000
-200,000
-150,000
-100,000
-50,000
0
08-1005-1002-1011-09
contracts
112
114
116
118
120
122
124
126
Net-Long Non-Commercial Positions (CME) Spot Rate
3-month Eurodollar Future
0
200,000
400,000
600,000
800,000
1,000,000
1,200,000
1,400,000
08-1005-1002-1011-09
contracts
99.1
99.2
99.3
99.4
99.5
99.6
99.7
99.8
Net-Long Non-Commercial Positions (CME) Spot Rate
EUR/GBP (derived)
-40,000
0
40,000
80,000
120,000
160,000
08-1005-1002-1011-09
contracts
0.82
0.84
0.86
0.88
0.90
0.92
0.94
£
Net-Long Non-Commercial Positions (CME) Spot Rate
EUR/CHF (derived)
-150,000
-100,000
-50,000
0
50,000
08-1005-1002-1011-09
contracts
1.40
1.42
1.44
1.46
1.48
1.50
1.52
1.54
SFr
Net-Long Non-Commercial Positions (CME) Spot Rate
USD POSITIONING
-40
-20
0
20
40
07-07 01-08 07-08 01-09 07-09 01-10 07-10
$ bn
70
75
80
85
90
SUM (INDIVUAL CURRENCY PAIRS) - LHS
DXY - spot ( RHS)
S&P 500 Future
-80,000
-60,000
-40,000
-20,000
0
20,000
08-1005-1002-1011-09
contracts
800
900
1000
1100
1200
1300
Net-Long Non-Commercial Positions (CME) Spot Rate

8/9/2019 Lloyds TSB AUG 06 Economics Weekly
http://slidepdf.com/reader/full/lloyds-tsb-aug-06-economics-weekly 8/17
FX Options: Risk Reversal Skews
The risk reversal skew is the difference in volatility between similar out-of-the-money call and out-of-the-money put
options. A positive risk reversal means that the implied volatility (used for pricing) of the call is greater than that of
the put. In this section, the skew is based on 1-month 25 delta call and put options. The skew has been analysed over
a one-year period, with the positioning ranked and charted (in red) underneath the skew. If the skew and positioning
are towards an extreme (we use above 75% or below 25% for the percentile rank), the risk of a contra-trend move
in the underlying spot rate is high.
6
0%
20%
40%
60%
80%
100%
p e r c e n t i l e r a n k
EURUSD
-4.0
-3.0
-2.0
-1.0
0.0
1.0
0 6 O c t 0 9
0 6 D e c 0 9
0 6 F e b 1 0
0 6 A pr 1 0
0 6 J un1 0
0 6 A u g1 0
2 5
d e l t a s k e w
GBPUSD
-4.0
-3.0
-2.0
-1.0
0.0
0 6 O c t 0 9
0 6 D e c 0 9
0 6 F e b 1 0
0 6 A pr 1 0
0 6 J un1 0
0 6 A u g1 0
2 5
d e l t a s k e w
AUDUSD
-8.0
-6.0
-4.0
-2.0
0.0
0 6 O c t 0 9
0 6 D e c 0 9
0 6 F e b 1 0
0 6 A pr 1 0
0 6 J un1 0
0 6 A u g1 0
2 5
d e l t a s k e w
0%
20%
40%
60%
80%
100%
p e r c e n t i l e r a n k
0%
20%
40%
60%
80%
100%
p e r c e n t i l e r a n k
USDSEK
-3.00
-2.00
-1.00
0.00
1.00
2.00
3.00
4.00
0 6 O c t 0 9
0 6 D e c 0 9
0 6 F e b 1 0
0 6 A pr 1 0
0 6 J un1 0
0 6 A u g1 0
2 5 d e l t a
s k e w
USDNOK
-3.00
-2.00
-1.00
0.00
1.00
2.00
3.00
4.00
0 6 O c t 0 9
0 6 D e c 0 9
0 6 F e b 1 0
0 6 A pr 1 0
0 6 J un1 0
0 6 A u g1 0
2 5 d e l t a
s k e w
USDJPY
-4
-4
-3
-3
-2
-2
-1
-1
0
0 6 O c t 0 9
0 6 D e c 0 9
0 6 F e b 1 0
0 6 A pr 1 0
0 6 J un1 0
0 6 A u g1 0
2 5 d e l t a
s k e w
0%
20%
40%
60%
80%
100%
p e r c e n t i l e r a n k
0%
20%
40%
60%
80%
100%
p e r c e n t i l e r a n k
0%
20%
40%
60%
80%
100%
p e r c e n t i l e r a n k
NZDUSD
-8.00
-6.00
-4.00
-2.00
0.00
0 6 O c t 0 9
0 6 D e c 0 9
0 6 F e b 1 0
0 6 A pr 1 0
0 6 J un1 0
0 6 A u g1 0
2 5 d e
l t a s k e w
USDCAD
-1.00
0.00
1.00
2.00
3.00
4.00
0 6 O c t 0 9
0 6 D e c 0 9
0 6 F e b 1 0
0 6 A pr 1 0
0 6 J un1 0
0 6 A u g1 0
2 5 d e
l t a s k e w
USDCHF
-1.00
-0.50
0.00
0.50
1.00
1.50
2.00
0 6 O c t 0 9
0 6 D e c 0 9
0 6 F e b 1 0
0 6 A pr 1 0
0 6 J un1 0
0 6 A u g1 0
2 5 d e
l t a s k e w
0%
20%
40%
60%
80%
100%
p e r c e n t i l e r a n k
0%
20%
40%
60%
80%
100%
p e r c e n t i l e r a n k
0%
20%
40%
60%
80%
100%
p e r c e n t i l e r a n k

8/9/2019 Lloyds TSB AUG 06 Economics Weekly
http://slidepdf.com/reader/full/lloyds-tsb-aug-06-economics-weekly 9/17
FX Options: Implied volatility
Implied volati lity is an input that is required when an option has to be priced. A higher implied volatili ty would result
in a higher option price, if other factors were unchanged. Implied volatility is traded in the markets and is therefore
also dependent upon supply and demand for options. In periods of uncertainty or illiquidity, implied volatility will climb
higher. One-month and one-year implied volatility is shown in the charts below.
7
EURUSD
9
11
13
15
17
19
21
0 6
A u g
0 9
0 6
N
o v
0 9
0 6
F e b
1 0
0 6
M
a y
1 0
0 6
A u g
1 0
%
1-month 1-yr
GBPUSD
9
11
13
15
17
19
21
0 6
A u g
0 9
0 6
N
o v
0 9
0 6
F e b
1 0
0 6
M
a y
1 0
0 6
A u g
1 0
%
1-month 1-yr
AUDUSD
8
10
12
14
1618
20
22
24
26
28
0 6
A u g
0 9
0 6
N o v
0 9
0 6
F e b
1 0
0 6
M
a y
1 0
0 6
A u g
1 0
%
1-month 1-yr
NZDUSD
11
13
15
17
19
21
2325
27
29
0 6
A u g
0 9
0 6
N o v
0 9
0 6
F e b
1 0
0 6
M
a y
1 0
0 6
A u g
1 0
%
1-month 1-yr
USDCAD
9
11
13
15
17
19
21
0 6
A u g
0 9
0 6
N o v
0 9
0 6
F e b
1 0
0 6
M
a y
1 0
0 6
A u g
1 0
%
1-month 1-yr
USDCHF
9
10
11
12
13
14
15
16
0 6
A u g
0 9
0 6
N o v
0 9
0 6
F e b
1 0
0 6
M
a y
1 0
0 6
A u g
1 0
%
1-month 1-yr
USDSEK
10
12
14
16
18
20
22
24
26
0 6
A u g
0 9
0 6
N
o v
0 9
0 6
F e b
1 0
0 6
M
a y
1 0
0 6
A u g
1 0
%
1-month 1-yr
USDNOK
11
12
13
14
15
16
17
18
19
20
0 6
A u g
0 9
0 6
N
o v
0 9
0 6
F e b
1 0
0 6
M
a y
1 0
0 6
A u g
1 0
%
1-month 1-yr
USDJPY
9
10
11
12
13
14
15
16
17
18
19
0 6
A u g
0 9
0 6
N
o v
0 9
0 6
F e b
1 0
0 6
M
a y
1 0
0 6
A u g
1 0
%
1-month 1-yr
8/9/2019 Lloyds TSB AUG 06 Economics Weekly
http://slidepdf.com/reader/full/lloyds-tsb-aug-06-economics-weekly 10/17
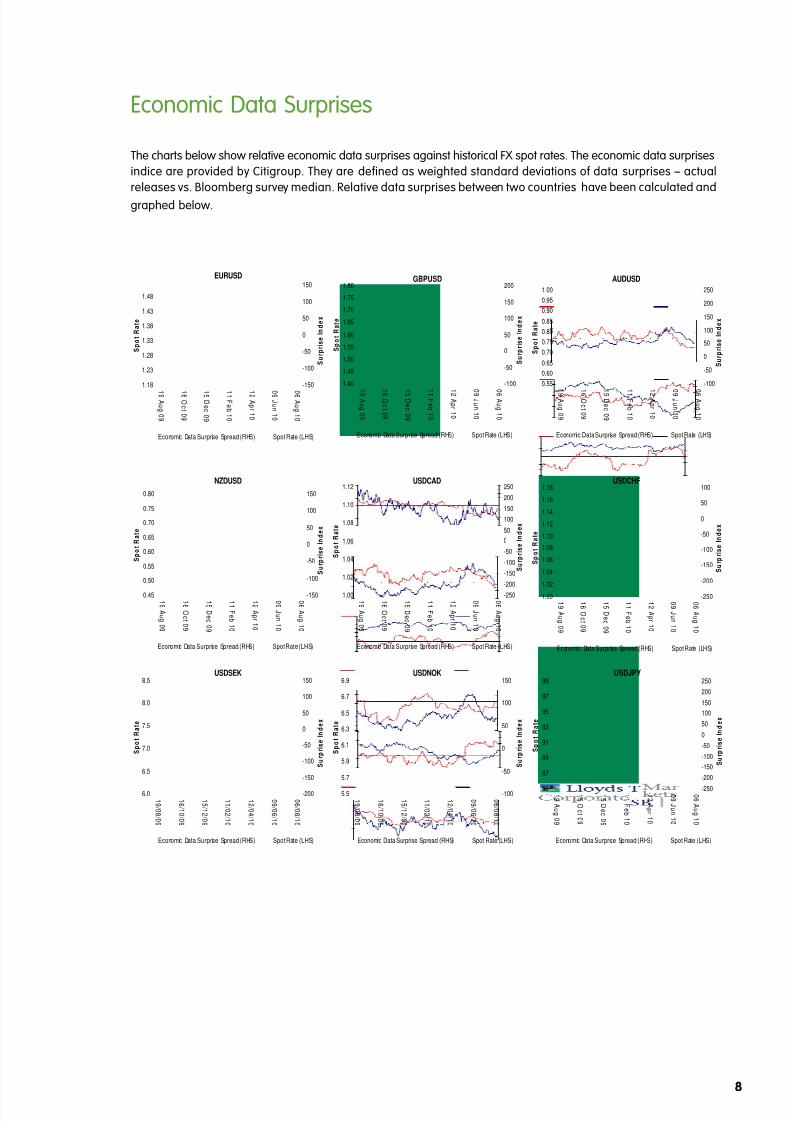
Economic Data Surprises
The charts below show relative economic data surprises against historical FX spot rates. The economic data surprises
indice are provided by Citigroup. They are defined as weighted standard deviations of data surprises – actual
releases vs. Bloomberg survey median. Relative data surprises between two countries have been calculated and
graphed below.
8
EURUSD
-150
-100
-50
0
50
100
150
0 6
A u g 1 0
0 9 J u n
1 0
1 2
A p r 1 0
1 1 F e b 1 0
1 5 D e c
0 9
1 6 O
c t 0 9
1 9
A u g 0 9
S u r p r i s e
I n d e x
1.18
1.23
1.28
1.33
1.38
1.43
1.48
S p o t R a t e
Economic Data Surprise Spread (RHS) Spot Rate (LHS)
USDJPY
-250
-200
-150
-100
-50
0
50
100
150
200
250
0 6 A u g 1 0
0 9 J u n
1 0
1 2 A p r 1 0
1 1 F e b 1 0
1 5 D e c
0 9
1 6 O
c t 0 9
1 9 A u g 0 9
S u r p r i s e
I n d e x
85
87
89
91
93
95
97
99
S p o t R a t e
Economic Data Surprise Spread (RHS) Spot Rate (LHS)
GBPUSD
-100
-50
0
50
100
150
200
0 6
A u g
1 0
0 9
J u n
1 0
1 2
A p r 1 0
1 1
F e b
1 0
1 5
D e c
0 9
1 6
O
c t 0 9
1 9
A u g
0 9
S u r p r i s e
I n d e x
1.40
1.45
1.50
1.55
1.60
1.65
1.70
1.75
1.80
S p o t R a t e
Economic Data Surprise Spread (RHS) Spot Rate (LHS)
USDCAD
-250
-200
-150
-100
-50
0
50
100
150
200
250
0 6
A u g
1 0
0 9
J u n
1 0
1 2
A p r 1 0
1 1
F e b
1 0
1 5
D e c
0 9
1 6
O c t 0 9
1 9
A u g
0 9
S u r p r i s e
I n d e x
1.00
1.02
1.04
1.06
1.08
1.10
1.12
S p o t R a t e
Economic Data Surprise Spread (RHS) Spot Rate (LHS)
USDSEK
-200
-150
-100
-50
0
50
100
150
0 6 / 0 8 / 1 0
0 9 / 0 6 / 1 0
1 2 / 0 4 / 1 0
1 1 / 0 2 / 1 0
1 5 / 1 2 / 0 9
1 6 / 1 0 / 0 9
1 9 / 0 8 / 0 9
S u r p r i s e
I n d e x
6.0
6.5
7.0
7.5
8.0
8.5
S p o t R a t e
Economic Data Surprise Spread (RHS) Spot Rate (LHS)
USDCHF
-250
-200
-150
-100
-50
0
50
100
0 6
A u g
1 0
0 9
J u n
1 0
1 2
A p r 1 0
1 1
F e b
1 0
1 5
D e c
0 9
1 6
O
c t 0 9
1 9
A u g
0 9
S u r p r i s e
I n d e x
1.00
1.02
1.04
1.06
1.08
1.10
1.12
1.14
1.16
1.18
S p o t R a t e
Economic Data Surprise Spread (RHS) Spot Rate (LHS)
AUDUSD
-100
-50
0
50
100
150
200
250
0 6
A u g
1 0
0 9
J u n
1 0
1 2
A p r 1 0
1 1
F e b
1 0
1 5
D e c
0 9
1 6
O
c t 0 9
1 9
A u g
0 9
S u r p r i s e
I n d e x
0.55
0.60
0.65
0.70
0.75
0.80
0.85
0.90
0.95
1.00
S p o t R a t e
Economic Data Surprise Spread (RHS) Spot Rate (LHS)
NZDUSD
-150
-100
-50
0
50
100
150
0 6
A u g
1 0
0 9
J u n
1 0
1 2
A p r 1 0
1 1
F e b
1 0
1 5
D e c
0 9
1 6
O c t 0 9
1 9
A u g
0 9
S u r p r i s e
I n d e x
0.45
0.50
0.55
0.60
0.65
0.70
0.75
0.80
S p o t R a t e
Economic Data Surprise Spread (RHS) Spot Rate (LHS)
USDNOK
-100
-50
0
50
100
150
0 6 / 0 8 / 1 0
0 9 / 0 6 / 1 0
1 2 / 0 4 / 1 0
1 1 / 0 2 / 1 0
1 5 / 1 2 / 0 9
1 6 / 1 0 / 0 9
1 9 / 0 8 / 0 9
S u r p r i s e
I n d e x
5.5
5.7
5.9
6.1
6.3
6.5
6.7
6.9
S p o t R a t e
Economic Data Surprise Spread (RHS) Spot Rate (LHS)
8/9/2019 Lloyds TSB AUG 06 Economics Weekly
http://slidepdf.com/reader/full/lloyds-tsb-aug-06-economics-weekly 11/17
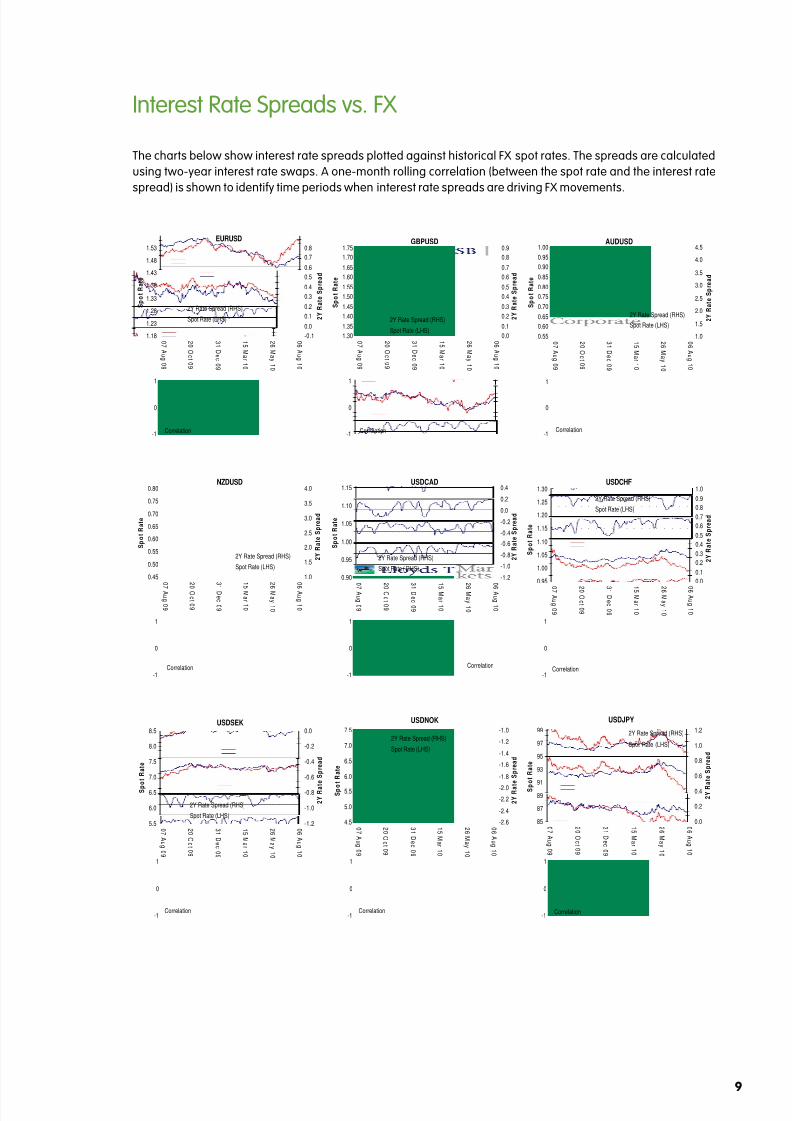
Interest Rate Spreads vs. FX
The charts below show interest rate spreads plotted against historical FX spot rates. The spreads are calculated
using two-year interest rate swaps. A one-month rolling correlation (between the spot rate and the interest rate
spread) is shown to identify time periods when interest rate spreads are driving FX movements.
9
EURUSD
-0.1
0.0
0.1
0.2
0.3
0.4
0.5
0.6
0.7
0.8
0 6
A u g
1 0
2 6
M
a y
1 0
1 5
M
a r 1 0
3 1
D e c
0 9
2 0
O
c t 0 9
0 7
A u g
0 9
2 Y R
a t e
S p r e a d
1.18
1.23
1.28
1.33
1.38
1.43
1.48
1.53
S p o t R a t e
2Y Rate Spread (RHS)
Spot Rate (LHS)
USDJPY
0.0
0.2
0.4
0.6
0.8
1.0
1.2
0 6
A u g
1 0
2 6
M
a y
1 0
1 5
M
a r 1 0
3 1
D e c
0 9
2 0
O
c t 0 9
0 7
A u g
0 9
2 Y R
a t e
S p r e a d
85
87
8991
93
95
97
99
S p
o t R a t e
2Y Rate Spread (RHS)
Spot Rate (LHS)
GBPUSD
0.0
0.1
0.2
0.3
0.4
0.5
0.6
0.7
0.8
0.9
0 6
A u g
1 0
2 6
M
a y
1 0
1 5
M
a r 1 0
3 1
D e c
0 9
2 0
O
c t 0 9
0 7
A u g
0 9
2 Y R
a t e
S p r e a d
1.30
1.35
1.40
1.45
1.50
1.55
1.60
1.65
1.70
1.75
S p o t R a t e
2Y Rate Spread (RHS)
Spot Rate (LHS)
USDCAD
-1.2
-1.0
-0.8
-0.6
-0.4
-0.2
0.0
0.2
0.4
0
6 A u g
1 0
2
6 M
a y
1 0
1
5 M
a r 1 0
3
1 D e c
0 9
2
0 O
c t 0 9
0
7 A u g
0 9
2 Y R
a t e
S p r e a d
0.90
0.95
1.00
1.05
1.10
1.15
S p o t R a t e
2Y Rate Spread (RHS)
Spot Rate ( RHS)
USDSEK
-1.2
-1.0
-0.8
-0.6
-0.4
-0.2
0.0
0 6
A u g
1 0
2 6
M
a y
1 0
1 5
M
a r 1 0
3 1
D e c
0 9
2 0
O
c t 0 9
0 7
A u g
0 9
2 Y R
a t e
S p r e a d
5.5
6.0
6.5
7.0
7.5
8.0
8.5
S p o t R a t e
2Y Rate Spread (RHS)
Spot Rate (LHS)
USDCHF
0.0
0.1
0.2
0.3
0.4
0.5
0.6
0.7
0.8
0.9
1.0
0 6
A u g
1 0
2 6
M
a y
1 0
1 5
M
a r 1 0
3 1
D e c
0 9
2 0
O
c t 0 9
0 7
A u g
0 9
2 Y R
a t e
S p r e a d
0.95
1.00
1.05
1.10
1.15
1.20
1.25
1.30
S p o t R a t e
2Y Rate Spread (RHS)
Spot Rate (LHS)
AUDUSD
1.0
1.5
2.0
2.5
3.0
3.5
4.0
4.5
0 6
A u g
1 0
2 6
M
a y
1 0
1 5
M
a r 1 0
3 1
D e c
0 9
2 0
O
c t 0 9
0 7
A u g
0 9
2 Y R
a t e
S p r e a d
0.55
0.60
0.65
0.70
0.75
0.80
0.85
0.90
0.95
1.00
S p o t R a t e
2Y Rate Spread (RHS)
Spot Rate (LHS)
NZDUSD
1.0
1.5
2.0
2.5
3.0
3.5
4.0
0
6 A u g
1 0
2
6 M
a y
1 0
1
5 M
a r 1 0
3
1 D e c
0 9
2
0 O
c t 0 9
0
7 A u g
0 9
2 Y R
a t e
S p r e a d
0.45
0.50
0.55
0.60
0.65
0.70
0.75
0.80
S p o t R a t e
2Y Rate Spread (RHS)
Spot Rate (LHS)
Correlation-1
0
1
Correlation-1
0
1
Correlation
-1
0
1
Correlation-1
0
1
Correlation-1
0
1
Correlation-1
0
1
Correlation-1
0
1
Correlation-1
0
1
USDNOK
-2.6
-2.4
-2.2
-2.0
-1.8
-1.6
-1.4
-1.2
-1.0
0 6
A u g
1 0
2 6
M
a y
1 0
1 5
M
a r 1 0
3 1
D e c
0 9
2 0
O
c t 0 9
0 7
A u g
0 9
2 Y R
a t e
S p r e a d
4.5
5.0
5.5
6.0
6.5
7.0
7.5
S p o
t R a t e
2Y Rate Spread (RHS)
Spot Rate (LHS)
Correlation-1
0
1

8/9/2019 Lloyds TSB AUG 06 Economics Weekly
http://slidepdf.com/reader/full/lloyds-tsb-aug-06-economics-weekly 12/17
S&P500 vs. FX
The charts below show the S&P500 plotted against historical FX spot rates. A one-month rolling correlation (between
the spot rate and equity index) is shown to identify time periods when the two series are moving in tandem.
10
EURUSD
600
700
800
900
1000
1100
1200
1300
0 5
A u g
1 0
2 5
M
a y
1 0
1 2
M
a r 1 0
3 0
D e c
0 9
1 9
O
c t 0 9
0 6
A u g
0 9
S & P 5 0 0
1.18
1.23
1.28
1.33
1.38
1.43
1.48
1.53
S p o t R a t e
S&P500
Spot Rate (LHS)
USDJPY
600
700
800
900
1000
11001200
1300
0 5
A u g
1 0
2 5
M
a y
1 0
1 2
M
a r 1 0
3 0
D e c
0 9
1 9
O
c t 0 9
0 6
A u g
0 9
S
& P 5 0 0
i n v e r t e d
85
8789
91
93
95
97
99
S p o t R a t e
S&P500
Spot Rate (LHS)
GBPUSD
600
700
800
900
1000
1100
1200
1300
0 5
A u g
1 0
2 5
M
a y
1 0
1 2
M
a r 1 0
3 0
D e c 0 9
1 9
O
c t 0 9
0 6
A u g
0 9
S & P 5 0 0
1.30
1.35
1.40
1.45
1.50
1.55
1.60
1.65
1.70
1.75
S p o t R a t e
S&P500
Spot Rate (LHS)
USDCAD
600
700
800
900
1000
1100
1200
1300
0 5 A u g 1 0
2 5 M
a y
1 0
1 2
M a r 1 0
3 0
D e c
0 9
1 9 O
c t 0 9
0 6 A u g 0 9
S & P 5 0 0
i n v e r t e d
1.00
1.02
1.04
1.06
1.08
1.10
1.12
S p o t R a t e
S&P500
Spot Rate (RHS)
USDSEK
600
700
800
900
1000
11001200
1300
0 5
A u g
1 0
2 5
M a y
1 0
1 2
M
a r 1 0
3 0
D e c
0 9
1 9 O
c t 0 9
0 6
A u g
0 9
S &
P 5 0 0 i n v e r t e d
5.5
6.0
6.5
7.0
7.5
8.0
8.5
S p o t R a t e
S&P500
Spot Rate (LHS)
USDCHF
600
700
800
900
1000
1100
1200
1300
0 5 A u g 1 0
2 5 M
a y
1 0
1 2
M a r 1 0
3 0
D e c
0 9
1 9 O
c t 0 9
0 6 A u g 0 9
S & P 5 0 0
i n v e r t e d
0.95
1.00
1.05
1.10
1.15
1.20
1.25
1.30
S p o t R a t e
S&P500
Spot Rate (LHS)
AUDUSD
600
700
800
900
1000
1100
1200
1300
0 5
A u g 1 0
2 5
M
a y
1 0
1 2
M
a r 1 0
3 0
D e c
0 9
1 9
O
c t 0 9
0 6
A u g 0 9
S & P 5 0 0
0.55
0.60
0.65
0.70
0.75
0.80
0.85
0.90
0.95
1.00
S p o t R a t e
S&P500
Spot Rate (LHS)
NZDUSD
600
700
800
900
1000
1100
1200
1300
0 5 A u g 1 0
2 5 M
a y
1 0
1 2 M
a r 1 0
3 0 D e c
0 9
1 9 O
c t 0 9
0 6 A u g 0 9
S & P 5 0 0
0.45
0.50
0.55
0.60
0.65
0.70
0.75
0.80
S p o t R a t e
S&P500
Spot Rate (LHS)
Correlation-1
0
1
Correlation-1
0
1
Correlation
-1
0
1
Correlation-1
0
1
Correlation
-1
0
1
Correlation
-1
0
1
Correlation-1
0
1
Correlation-1
0
1
USDNOK
600
700
800
900
1000
11001200
1300
0 5
A u g
1 0
2 5
M
a y
1 0
1 2
M
a r 1 0
3 0
D e c
0 9
1 9
O
c t 0 9
0 6
A u g
0 9
S &
P 5 0 0 i n v e r t e d
5.0
5.5
6.0
6.5
7.0
7.5
S p o t R a t e
S&P500
Spot Rate (LHS)
Correlation
-1
0
1
8/9/2019 Lloyds TSB AUG 06 Economics Weekly
http://slidepdf.com/reader/full/lloyds-tsb-aug-06-economics-weekly 13/17
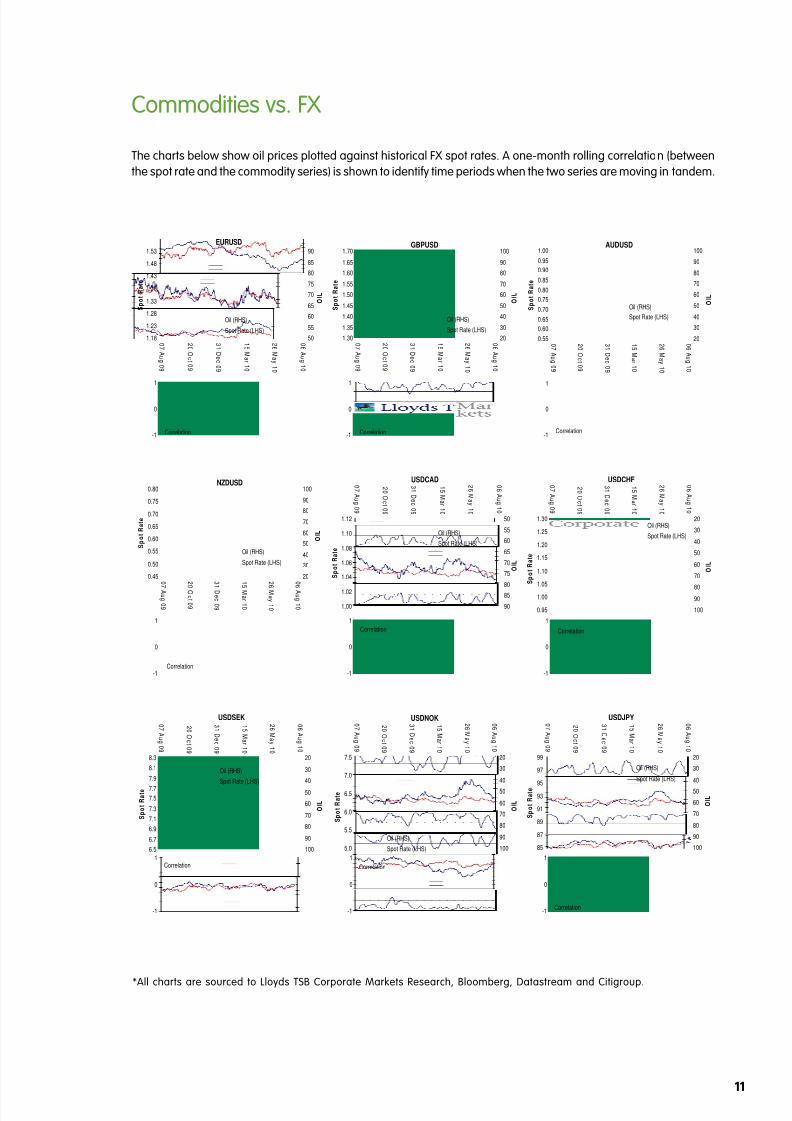
Commodities vs. FX
The charts below show oil prices plotted against historical FX spot rates. A one-month rolling correlation (between
the spot rate and the commodity series) is shown to identify time periods when the two series are moving in tandem.
*All charts are sourced to Lloyds TSB Corporate Markets Research, Bloomberg, Datastream and Citigroup.
11
EURUSD
50
55
60
65
70
75
80
85
90
0 6
A u g
1 0
2 6
M
a y
1 0
1 5
M
a r 1 0
3 1
D e c
0 9
2 0
O
c t 0 9
0 7
A u g
0 9
O
I L
1.18
1.23
1.28
1.33
1.38
1.43
1.48
1.53
S p o t R a t e
Oil (RHS)
Spot Rate (LHS)
USDJPY
20
30
40
50
60
70
80
90
100
0 6
A u g
1 0
2 6
M
a y
1 0
1 5
M
a r 1 0
3 1
D e c
0 9
2 0
O
c t 0 9
0 7
A u g
0 9
O
I L
85
87
89
91
9395
97
99
S p o t R a t e
Oil (RHS)
Spot Rate (LHS)
GBPUSD
20
30
40
50
60
70
80
90
100
0 6
A u g
1 0
2 6
M
a y
1 0
1 5
M
a r 1 0
3 1
D e c
0 9
2 0
O
c t 0 9
0 7
A u g
0 9
O
I L
1.30
1.35
1.40
1.45
1.50
1.55
1.60
1.65
1.70
S p o t R a t e
Oil (RHS)
Spot Rate (LHS)
USDCAD
50
55
60
65
70
75
80
85
90
0 6
A u g
1 0
2 6
M
a y
1 0
1 5
M
a r 1 0
3 1
D e c
0 9
2 0
O
c t 0 9
0 7
A u g
0 9
O
I L
1.00
1.02
1.04
1.06
1.08
1.10
1.12
S p o t R a t e
Oil (RHS)
Spot Rate (LHS)
USDSEK
20
30
40
50
60
70
80
90
100
0 6
A u g
1 0
2 6
M
a y
1 0
1 5
M
a r 1 0
3 1
D e c
0 9
2 0
O
c t 0 9
0 7
A u g
0 9
O
I L
6.5
6.7
6.9
7.1
7.3
7.5
7.7
7.9
8.1
8.3
S p o t R a t e
Oil (RHS)
Spot Rate (LHS)
USDCHF
20
30
40
50
60
70
8090
100
0 6
A u g
1 0
2 6
M
a y
1 0
1 5
M
a r 1 0
3 1
D e c
0 9
2 0
O
c t 0 9
0 7
A u g
0 9
O
I L
0.95
1.00
1.05
1.10
1.15
1.20
1.25
1.30
S p o t R a t e
Oil (RHS)
Spot Rate (LHS)
AUDUSD
20
30
40
50
60
70
80
90
100
0 6
A u g
1 0
2 6
M
a y
1 0
1 5
M
a r 1 0
3 1
D e c
0 9
2 0
O
c t 0 9
0 7
A u g
0 9
O
I L
0.55
0.60
0.65
0.70
0.75
0.80
0.85
0.90
0.95
1.00
S p o t R a t e
Oil (RHS)
Spot Rate (LHS)
NZDUSD
20
30
40
50
60
70
80
90
100
0 6
A u g
1 0
2 6
M
a y
1 0
1 5
M
a r 1 0
3 1
D e c
0 9
2 0
O
c t 0 9
0 7
A u g
0 9
O
I L
0.45
0.50
0.55
0.60
0.65
0.70
0.75
0.80
S p o t R a t e
Oil (RHS)
Spot Rate (LHS)
Correlation-1
0
1
Correlation-1
0
1
Correlation
-1
0
1
Correlation-1
0
1
Correlation
-1
0
1
Correlation
-1
0
1
Correlation-1
0
1
Correlation-1
0
1
USDNOK
20
30
40
50
60
70
80
90
100
0 6
A u g
1 0
2 6
M
a y
1 0
1 5
M
a r 1 0
3 1
D e c
0 9
2 0
O
c t 0 9
0 7
A u g
0 9
O
I L
5.0
5.5
6.0
6.5
7.0
7.5
S p o t R a t e
Oil (RHS)
Spot Rate (LHS)
Correlation
-1
0
1
8/9/2019 Lloyds TSB AUG 06 Economics Weekly
http://slidepdf.com/reader/full/lloyds-tsb-aug-06-economics-weekly 14/17
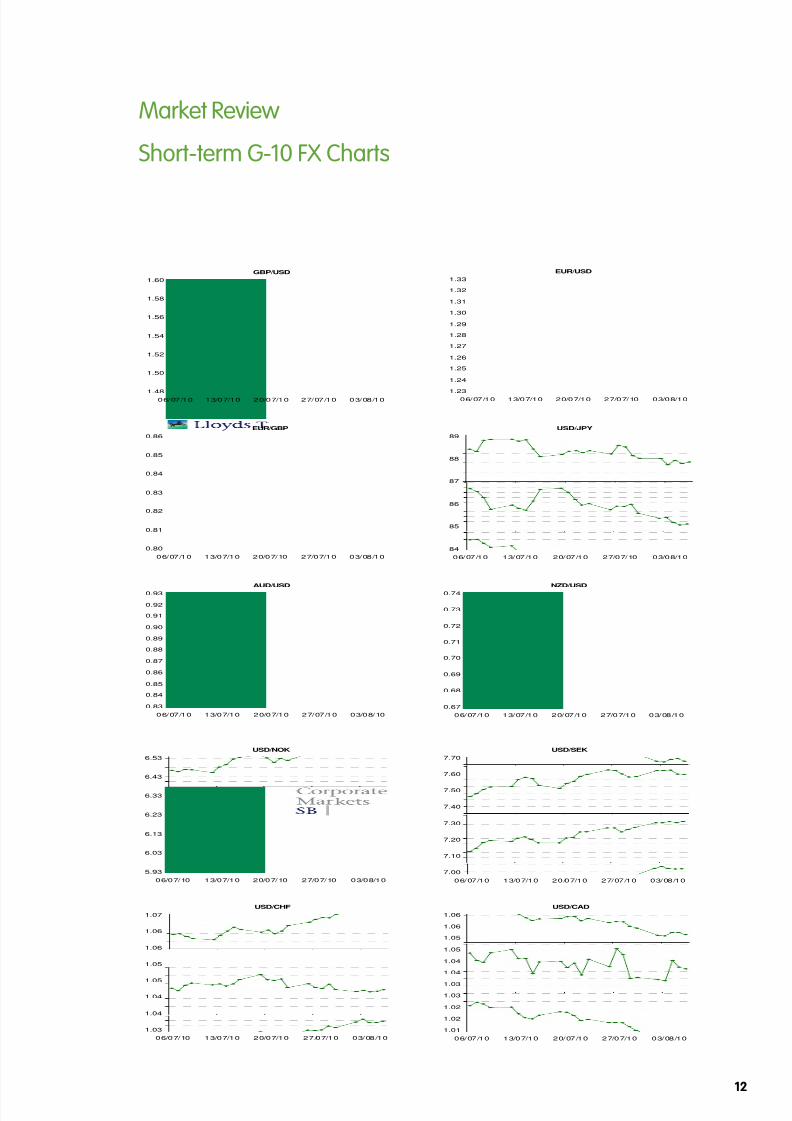
Market Review
Short-term G-10 FX Charts
12
GBP/USD
1.48
1.50
1.52
1.54
1.56
1.58
1.60
0 6/ 07 /1 0 1 3/0 7/1 0 2 0/0 7/1 0 2 7/ 07 /1 0 0 3/ 08 /1 0
EUR/USD
1.23
1.24
1.25
1.26
1.27
1.28
1.29
1.30
1.31
1.32
1.33
0 6/ 07 /1 0 1 3/0 7/1 0 2 0/0 7/1 0 2 7/0 7/ 10 0 3/0 8/1 0
EUR/GBP
0.80
0.81
0.82
0.83
0.84
0.85
0.86
0 6/ 07 /1 0 1 3/0 7/1 0 2 0/0 7/ 10 2 7/0 7/1 0 0 3/ 08 /1 0
USD/JPY
84
85
86
87
88
89
0 6/ 07 /1 0 1 3/ 07 /1 0 2 0/ 07 /1 0 2 7/0 7/ 10 0 3/0 8/1 0
AUD/USD
0.83
0.84
0.85
0.86
0.87
0.88
0.89
0.90
0.91
0.92
0.93
0 6/ 07 /1 0 1 3/0 7/1 0 2 0/0 7/1 0 2 7/ 07 /1 0 0 3/0 8/ 10
NZD/USD
0.67
0.68
0.69
0.70
0.71
0.72
0.73
0.74
0 6/ 07 /1 0 1 3/ 07 /1 0 2 0/ 07 /1 0 2 7/0 7/1 0 0 3/ 08 /1 0
USD/NOK
5.93
6.03
6.13
6.23
6.33
6.43
6.53
0 6/0 7/ 10 1 3/0 7/1 0 2 0/0 7/ 10 2 7/0 7/ 10 0 3/0 8/1 0
USD/SEK
7.00
7.10
7.20
7.30
7.40
7.50
7.60
7.70
0 6/ 07 /1 0 1 3/0 7/1 0 2 0 /0 7/1 0 2 7/ 07 /1 0 0 3/ 08 /1 0
USD/CHF
1.03
1.04
1.04
1.05
1.05
1.06
1.06
1.07
0 6/0 7/ 10 1 3/0 7/1 0 2 0/0 7/1 0 2 7 /0 7/1 0 0 3/ 08 /1 0
USD/CAD
1.01
1.02
1.02
1.03
1.03
1.04
1.04
1.05
1.05
1.06
1.06
0 6/ 07 /1 0 1 3/0 7/1 0 2 0/ 07 /1 0 2 7/0 7/1 0 0 3/ 08 /1 0
8/9/2019 Lloyds TSB AUG 06 Economics Weekly
http://slidepdf.com/reader/full/lloyds-tsb-aug-06-economics-weekly 15/17
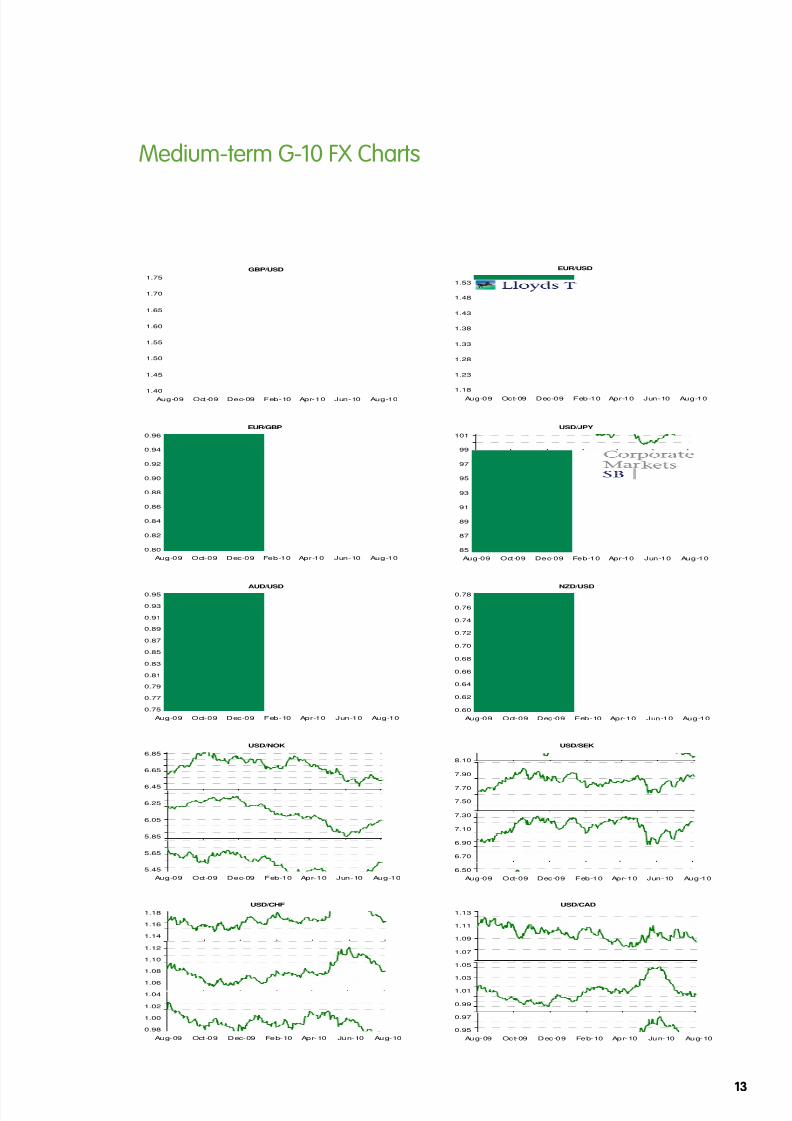
Medium-term G-10 FX Charts
13
GBP/USD
1.40
1.45
1.50
1.55
1.60
1.65
1.70
1.75
Aug-09 Oct -09 D ec-09 F eb-10 Apr-10 J un-10 Aug-10
EUR/USD
1.18
1.23
1.28
1.33
1.38
1.43
1.48
1.53
Aug-09 Oc t-09 D ec -09 F eb-10 Apr-10 J un-10 Aug-10
EUR/GBP
0.80
0.82
0.84
0.86
0.88
0.90
0.92
0.94
0.96
Aug-09 Oct-09 D ec -09 Feb-10 Apr-10 J un-10 Aug-10
USD/JPY
85
87
89
91
93
95
97
99
101
Aug-09 Oct -09 D ec-09 Feb-10 Apr-10 J un-10 Aug-10
AUD/USD
0.75
0.77
0.79
0.81
0.83
0.85
0.87
0.89
0.91
0.93
0.95
Aug-09 Oct-09 D ec -09 F eb-10 Apr-10 J un-10 Aug-10
NZD/USD
0.60
0.62
0.64
0.66
0.68
0.70
0.72
0.74
0.76
0.78
Aug-09 Oct-09 D ec -09 F eb-10 Apr-10 J un-10 Aug-10
USD/NOK
5.45
5.65
5.85
6.05
6.25
6.45
6.65
6.85
Aug-09 Oct -09 D ec-09 F eb-10 Apr-10 J un-10 Aug-10
USD/SEK
6.50
6.70
6.90
7.10
7.30
7.50
7.70
7.90
8.10
Aug-09 Oct-09 D ec -09 F eb-10 Apr-10 J un-10 Aug-10
USD/CHF
0.98
1.00
1.02
1.04
1.06
1.08
1.10
1.12
1.14
1.16
1.18
Au g- 09 Oct -0 9 D ec- 09 Fe b- 10 Ap r- 10 Ju n- 10 Au g- 10
USD/CAD
0.95
0.97
0.99
1.01
1.03
1.05
1.07
1.09
1.11
1.13
Au g- 09 Oc t- 09 D ec -0 9 Fe b- 10 Ap r- 10 Ju n- 10 Au g- 10
8/9/2019 Lloyds TSB AUG 06 Economics Weekly
http://slidepdf.com/reader/full/lloyds-tsb-aug-06-economics-weekly 16/17
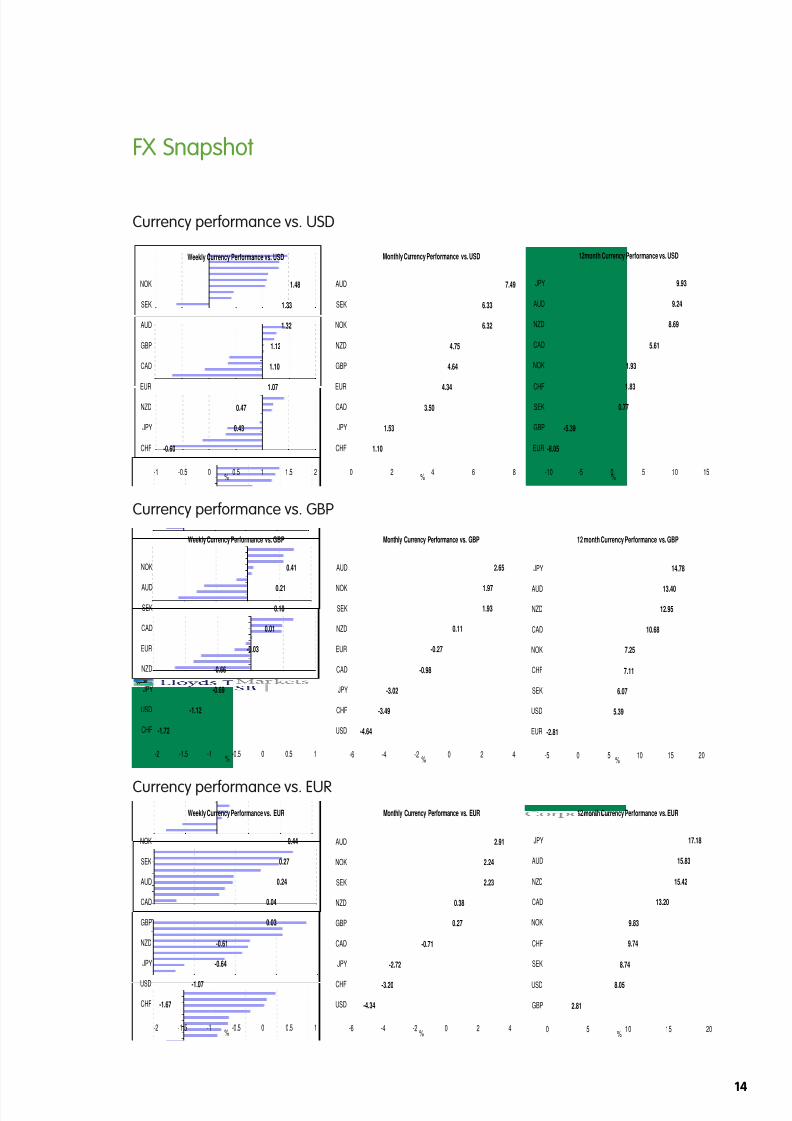
FX Snapshot
Currency performance vs. USD
Currency performance vs. GBP
Currency performance vs. EUR
14
Weekly Currency Performance vs. USD
-0.60
0.43
0.47
1.07
1.10
1.12
1.32
1.33
1.48
-1 -0.5 0 0.5 1 1.5 2
CHF
JPY
NZD
EUR
CAD
GBP
AUD
SEK
NOK
%
Monthly Currency Performance vs. USD
1.53
3.50
4.34
4.64
4.75
6.32
6.33
7.49
1.10
0 2 4 6 8
CHF
JPY
CAD
EUR
GBP
NZD
NOK
SEK
AUD
%
12month Currency Performance vs. USD
-8.05
-5.39
0.77
1.83
1.93
5.61
8.69
9.24
9.93
-10 -5 0 5 10 15
EUR
GBP
SEK
CHF
NOK
CAD
NZD
AUD
JPY
%
Weekly Currency Performance vs. GBP
-1.72
-1.12
-0.69
-0.66
-0.03
0.01
0.18
0.21
0.41
-2 -1.5 -1 -0.5 0 0.5 1
CHF
USD
JPY
NZD
EUR
CAD
SEK
AUD
NOK
%
Monthly Currency Performance vs. GBP
-4.64
-3.49
-3.02
-0.98
-0.27
0.11
1.93
1.97
2.65
-6 -4 -2 0 2 4
USD
CHF
JPY
CAD
EUR
NZD
SEK
NOK
AUD
%
12 month Currency Performance vs. GBP
-2.81
5.39
6.07
7.11
7.25
10.68
12.95
13.40
14.78
-5 0 5 10 15 20
EUR
USD
SEK
CHF
NOK
CAD
NZD
AUD
JPY
%
Weekly Currency Performance vs. EUR
-1.67
-1.07
-0.64
-0.61
0.03
0.04
0.24
0.27
0.44
-2 -1.5 -1 -0.5 0 0.5 1
CHF
USD
JPY
NZD
GBP
CAD
AUD
SEK
NOK
%
Monthly Currency Performance vs. EUR
-4.34
-3.20
-2.72
-0.71
0.27
0.38
2.23
2.24
2.91
-6 -4 -2 0 2 4
USD
CHF
JPY
CAD
GBP
NZD
SEK
NOK
AUD
%
12 month Currency Performance vs. EUR
2.81
8.05
8.74
9.74
9.83
13.20
15.42
15.83
17.18
0 5 10 15 20
GBP
USD
SEK
CHF
NOK
CAD
NZD
AUD
JPY
%
8/9/2019 Lloyds TSB AUG 06 Economics Weekly
http://slidepdf.com/reader/full/lloyds-tsb-aug-06-economics-weekly 17/17
IMPORTANT NOTICE
This document, its contents and any related communication (altogether, the “Communication”) does not constitute or formpart of any offer to sell or an invitation to subscribe for, hold or purchase any securities or any other investment. ThisCommunication shall not form the basis of or be relied on in connection with any contract or commitment whatsoever.
This Communication is not intended to form, and should not form, the basis of any investment decision. This Communicationis not and should not be treated as investment research, a research recommendation, an opinion or advice. Recipientsshould conduct their own independent enquiries and obtain their own professional legal, regulatory, tax or accountingadvice as appropriate. Any transaction which a recipient of this Communication may subsequently enter into may only be
on the basis of such enquiries and advice, and that recipient’s own knowledge and experience.
This Communication has been prepared by, and is subject to the copyright of, Lloyds TSB Bank plc (“Lloyds TSB”). ThisCommunication may not, in whole or in part, be reproduced, transmitted, stored in a retrieval system or translated in anyother language in any form, by any means without the prior written consent of Lloyds. This Communication is provided forinformation purposes only, and is confidential and may not be referred to, disclosed, reproduced or redistributed, inwhole or in part, to any other person. This Communication is based on current public information.
Whilst Lloyds TSB has exercised reasonable care in preparing this Communication, no representation or warranty,express or implied, is made as to the accuracy, reliability or completeness of the facts and date contained herein by LloydsTSB, its group companies and its or their directors, officers, employees, associates and agents (altogether, “Lloyds TSBPersons”). The information contained in this Communication has not been independently verified by Lloyds TSB. Theinformation and any opinions in this Communication are subject to change at any time and Lloyds is under no obligationto inform any person of any such change. This Communication may refer to future events which may or may not be within
the control of Lloyds TSB Persons, and no representation or warranty, express or implied, is made as to whether or notsuch an event will occur. To the fullest extent permitted by applicable law, regulation and rule of regulatory body, LloydsTSB Persons accept no responsibility for and shall have no liability for any loss in relation to this Communication, howeverarising (including in relation to any projections, analyses, assumptions and/or opinions contained herein nor for any lossof profit or damages or any liability to a third party).
Lloyds TSB Corporate Markets is a trading name of Lloyds TSB Bank plc and Lloyds TSB Scotland plc. Lloyds TSB Bank plc’sregistered office is at 25 Gresham Street, London EC2V 7HN and it is registered in England and Wales under no. 2065.Lloyds TSB Scotland plc’s registered office is at Henry Duncan House, 120 George Street, Edinburgh EH2 4LH. Lloyds TSBBank plc and Lloyds TSB Scotland plc are authorised and regulated by the Financial Services Authority.
DISCLAIMER