Embed Size (px)
Citation preview

LOCAL LABOUR MARKET PLANNING REPORT2014—2015
Niagara Workforce Planning BoardOur Vision Is Working

ContentsAbout this report : 2
Licence : 2
About Niagara Workforce Planning Board : 3
Summaries : 5
Executive summary : 7
Background and context : 9
Analysis : 11
Local labour market conditions : 13
Employment Ontario client data : 23
Local employment changes : 29
Migration trends : 31
Update of previous actions : 35
Action plan : 37

Niagara Workforce Planning Board (NWPB) serves the Niagara region as a leader in local labour market planning, delivering authoritative research, identifying employment trends, targeting workforce opportunities, and bringing people together to create solutions. We conduct annual research on the trends, opportunities, and priorities that impact upon Niagara’s labour market.
This report is our annual summary of the developments, challenges, and strengths of the local labour market. Much more depth and detail on these subjects is available on our blog at www.niagaraworkforce.ca, and any corrections or updates to this report will be delivered there. The most up-to-date version of this report is available on our website at www.niagaraworkforceboard.ca.
About this report
The report is provided under the Creative Commons Attribution 4.0 International licence. Details of the license can be accessed at http://creativecommons.org/licenses/by/4.0/legalcode. A brief and non-legal summary is that this report may be shared, copied, and redistributed in any medium or format, and may be remixed, transformed, built upon, or adapted for any purpose, even commercially.
Appropriate credit and a link to the licence must be provided, and any changes made must be indicated in a way that does not imply NWPB endorsement of those changes. No warranty of any sort is provided for this report, and no legal terms or technological measures may be applied to this report or any derivative of it that restricts others from exercising their rights under this licence.
We encourage feedback from our readers. Please consider completing our feedback survey at http://fluidsurveys.com/s/NWPB2014Report.
Licence
1

36 Page Street, Suite 404St. Catharines, Ontario
905-641-0801
web: www.niagaraworkforceboard.cablog: www.niagaraworkforce.ca
https://twitter.com/nwpb
https://www.linkedin.com/company/niagara-work-force-planning-board
https://www.facebook.com/Niagaraworkforce
About the Niagara Workforce Planning BoardOur Vision Is Working
Our directorsBusiness representatives
John Storm (Chair) Lisa BengerGeorge DarteTom MooneyKatherine Nelson-RileyIan Nielsen-JonesFrank RupcicBryan Webb
Labour representatives
Mark Carter Daniel PeatMahendra Thaleshvar
Community representatives
Fiona AllanLorraine BeaudoinJeff BoggsDon CyrLuigi MorenoStan PrideFrank Pupillo
Government representatives
Kim Humble-WheelerLori Watson
2

Our missionNWPB is one of 26 planning regions in Ontario that make up the Local Boards Network. Local boards are funded through Employment Ontario (EO). Each year, we provide labour market planning that is tailored to local economic realities, delivering activities and projects to help communities achieve better results.Niagara Workforce Planning Board’s role is one of facilitation and communication. Bringing community stakeholders of the Niagara region together to identify labour force issues and develop possible solutions for labour force development is our key focus. NWPB strives to ensure that information on community initiatives and actions are disseminated in an accurate and concise manner throughout the Niagara Region.
Our staffDavid Alexander
Executive Director
Corinna Carson
Project Administrator, Niagara Immigrant Employment Council
Meghan Tamane
Mentorship Coordinator, Niagara Immigrant Employment Council
Hugo Chesshire
Research Associate
Adam Durrant
Research Associate
Deborah Corbett
Project Assistant
LeadershipWe commit to leadership that is innovative, visionary, and relevant toward accomplishing shared goals.
IntegrityWe commit to a strong ethical code of conduct, striving to continuously build trust with our partners, stakeholders, sponsors, and the community.
Equality and inclusivenessWe recognize the diversity within our region and its residents.
AccountabilityWe strive to act in a responsible and open manner.
CommitmentWe strive to fulfill our role of partner to achieve maximum value and establish long-term relationships, and to support Niagara’s labour force participants to achieve sustainable employment.
ProfessionalismWe conduct our business in a professional and respectful manner.
Our Values
3

Summaries
4

5

Executive summary
This report provides an overview of current labour market conditions in the St. Catharines–Niagara Census Metropolitan Area,1 Grimsby, and West Lincoln. Our analysis includes data from the Canadian Business Patterns database, Statistics Canada’s 2013 Labour Force Survey, custom tabulations from the 2011 National Household Survey, Taxfiler records, and aggregate data on Employment Ontario clients.
A comprehensive review of these sources allows us to identify key strengths and challenges for Niagara’s labour market for the next three years. We hope that key stakeholders will recognize the urgency of the issues identified in this report and respond to them in a timely, effective, and evidence-driven fashion.
Our findings indicate that Niagara, much like the province, is becoming micro-business economy. In June 2014, 52% of businesses in Niagara were owner-operated firms.2 Many of Niagara’s largest employers are found within the public sector (e.g., primary and secondary education,
universities and colleges, municipal and regional government, and health care). As small enterprises are highly susceptible to economic fluctuations, but also highly flexible and capable of responding to changes in demand, NWPB recommends supporting these firms in all stages of their development.
Net immigration patterns allow some insight into the age composition of our workforce. Historically, the largest cohorts of people migrating into Niagara were over the age of 45. This means that Niagara has excelled at attracting a demographic that is potentially several decades into a chosen career path.
Between 2007 and 2011, migration patterns for individuals between the ages of 18 and 24 demonstrated an exodus from Niagara.3 When these data are combined with stagnant overall population growth in the region, it is not hard to understand why Niagara is perceived as a retirement destination: our working-age population is greying while our young people are leaving for opportunities elsewhere.
6

The NWPB believes one of the highest priorities for Niagara must be the continued implementation of a youth-retention strategy. NWPB has demonstrated a commitment to this in founding NEXTNiagara. NWPB currently supports the Niagara Employment Crawl initiative led by Brock University and Niagara College. We welcome other opportunities to support the attraction and retention of young talent in Niagara.
This report builds upon labour market data explored in 2013’s Niagara Labour Market Update, as well as the ongoing issues identified and explored on the Niagara Workforce Blog. One such issue is Niagara’s seasonal economy, which harms seasonal workers during the off-season months. Unlike some other regions, Niagara lacks a cold-weather economy capable of employing displaced fair-weather workers. NWPB is concerned this may place a strain on the social safety net, create undue short-term hardships for individual workers, and prove potentially counter-productive to reducing poverty in the region.
Niagara continues to suffer from sluggish job growth, as has been the case since the late 1980s. Niagara remains one of the slowest-growing economies in Ontario, and has actually lost jobs since NWPB published the 2013 Local Labour Market Update.4 A realistic and evidence-based job-creation strategy
is vital for Niagara’s prosperity. When the predominance of micro-businesses in Niagara is taken into account, it is clear that initiatives aimed at nurturing and assisting entrepreneurs and small business owners should be undertaken.
As was the case in our 2013 report, NWPB received client data from Employment Ontario service providers for use in this publication. Employment Ontario’s employment service providers are an invaluable asset for addressing unemployment, underemployment, and skills misalignment in the Niagara region. NWPB is committed to supporting the work of employment service providers as a vital link in building a stronger labour market for Niagara.
While some of the issues outlined within this report are rooted in the local economy, it is important to acknowledge that others are related to Ontario’s sluggish recovery from the “Great Recession,” the observed relationship between manufacturing in Ontario and the Canada–United States exchange rate,5 and other challenges of a national or international nature. Nevertheless, it is incumbent upon local decision-makers to embrace a data-driven approach to economic and labour market planning such that local issues can be addressed to provincial and/or federal government in a clear and concise fashion.
Our vision is working
7

Background and context
This section provides an overview of NWPB as an organization and describes the purpose of this report. The report is a 23-page summary of a much broader body of evidence that is examined in greater detail on our blog. It captures the main issues of the day and is a living document that will evolve over time as we encounter new evidence and decision points, and as we implement solutions to overcome challenges.
NWPB is one of twenty-six Local Boards in Ontario and is funded by the Ministry of Training, Colleges and Universities (MTCU). Ontario is the only province in Canada to have a Local Board structure. NWPB is a partner in the Employment Ontario network of agencies, and we work to support front-line service organizations, and other educational/economic stakeholders with local research and information.
NWPB is a non-profit organization, and while our principal work involves the labour market, we support the delivery of targeted initiatives like the mentor-matching of foreign-trained professionals within the Niagara Immigrant Connections Initiative, and we welcome proposals for the use of our administrative and organizational capacity in leading or supporting workforce development initiatives.
The NWPB Board of Directors includes labour, business, and community leaders with a wide range of backgrounds and experiences. Our work engages Niagara’s community leaders and organizations, businesses and citizens in a variety of ways. NWPB invites those who feel they have something to provide to the labour market conversation to join the Board or participate in a working group.
We value partnerships with the community and we encourage others to employ an evidence-based strategic planning process. We also understand the fine balance needed when addressing some of the challenges Niagara faces, and that waiting until all the evidence is in before acting is not always practical.
8

This report is created to facilitate a continued understanding of Niagara’s labour market for a variety of audiences. It contains recommendations drawn from current and previous research. It does not contain all of our recommendations, but only those in key areas that we believe are essential for progress. Readers should reflect on our work here (and online) as a basis for their own understanding of how this report and other evidence influences workforce choices and opportunities.
We would also like to remind our readers that human stories are not always apparent in statistics. We know through our consultations that there are many successful programs and initiatives as well as many people who work hard to provide employment services and economic development to the community. Job loss is always difficult, but there are advisory services that provide support. We know that pursuing education and training is often difficult, and people facing this decision should know that there are organizations available to support them.
Our task is to acknowledge the evidence for Niagara’s successes and challenges in support of those who wish to see change. If we want to improve our labour market, many stakeholders must work together to make the necessary changes, and they must do so at a pace that is both sustainable and sufficient, and in keeping with innovations in other regions.
9

Analysis
10

11

Loca
l lab
our m
arke
t co
nditi
ons
Employment growth
A key challenge in Niagara is our highly seasonal economy, which causes large swings in the unemployment rate, diminishes opportunities, and likely reduces quality of life for many Niagara workers. Another is sluggish job growth, which is possibly linked to stagnant population growth. Niagara is unlikely to attract many new residents if it cannot offer work to so many who already live here.
In terms of job numbers, Niagara remains one of the slowest-growing regions in Ontario. Between 2012 and 2013, Niagara shed 4% of its jobs (figure 3). Only Guelph and Peterborough lost more, at 6.4% and 6.6%, respectively. Sluggish job growth in Niagara has been a trend for almost 30 years. Between 1996 and 2013, the number of jobs in Niagara grew by 15%, the fourth-slowest rate of growth in Ontario (figure 2). Comparisons can be made with peer regions such as Kitchener, where the number of jobs grew by 44% within the same timeframe, and Kingston, which saw an increase of 31%. Fewer data are available for the years between between 1987 and 1995, with only nine census metropolitan areas eligible for inclusion in a 1987–2013 time series.
Nevertheless, between 1987 and 2013, Niagara was the second-slowest-growing region of all, with just over one-quarter of the relative job growth shown by the top-performing region (figure 1). In order to reach even the national average unemployment rate (7.1% in 2013), Niagara would have to create about 3,000 jobs (assuming no change in population or workforce size)—a 1.5% increase. As these data are drawn from the 2013 Labour Force Survey, data for 2014 will not be available until January 2015.
Overcoming sluggish job growth and creating jobs in Niagara remains a key challenge, and NWPB urges economic planners and developers to give this issue top priority. Given Niagara’s status as an economy dominated by microbusinesses, initiatives aimed at nurturing start-ups and entrepreneurs would be a good start. One example of this type of support is the U.S. “Just Add One” initiative, which encourages small businesses to hire an additional employee.
12

0%
20%
40%
60%
80%
Oshawa Kitchener Toronto Kingston London Hamilton Windsor Niagara ThunderBay
Growth in employment 1987–2013
Average: 35.5%
0%
20%
40%
60%
80%
Growth in employment 1996–2013
Average: 29.5%
-8%
-4%
0%
4%
8%
Growth in employment 2012–2013
Average: 0.3%
Figure 1
Figure 2
Figure 3
Statistics Canada. Table 282-0114 - Labour force survey estimates (LFS), employment by census metropolitan area based on 2006 census boundaries and National Occupational Classification for Statistics (NOC-S), annual (persons), CANSIM (database).
Statistics Canada. Table 282-0059 - Labour force survey estimates (LFS), employment by census metropolitan area based on 2001 census boundaries and National Occupational Classification for Statistics (NOC-S), annual (persons), CANSIM (database).
Statistics Canada. Table 282-0114 - Labour force survey estimates (LFS), employment by census metropolitan area based on 2006 census boundaries and National Occupational Classification for Statistics (NOC-S), annual (persons), CANSIM (database).
13

Loca
l lab
our m
arke
t co
nditi
ons
Labour force composition
The composition of Niagara’s labour force in 2013 continued long-established trends. The workforce was evenly split along gender lines, and the age composition of the workforce changed little over the course of the year, save for seasonal fluctuations in the 15–24 age range caused by the ebb and flow of the student workforce.
The full-time workforce remained almost equally divided along gender lines, with males forming a slight majority; however, the part-time workforce remained predominantly female, with almost two part-time female workers for every male.
This gender balance fluctuated over the course of the year. In March 2013, 71% of the part-time workforce was female, but by November, this rate fell to 60%. Additionally, more females than males were not participating in the labour force (figures 4 and 5). The numbers were even in the 15–24 age range, but in the 25–54 range, there were 1.76 females for every male not participating (figure 6). This ratio decreased as age increased, but never returned to parity. Childcare, eldercare, and other family responsibilities not evenly split along gender lines are the most obvious cause for this phenomenon. It is fair to say that many females who leave the workforce never return to it.
Remedying this issue would require fairly major social innovations in the provision of childcare and eldercare, as well as upsetting the age-old gender inequity in unpaid domestic labour.
The number of retirement-age workers is also concerning. The number of workers aged 65 and over peaked at 11,700 in the summer of 2013. Research indicates that many of these jobs were entry-level, and, in the face of high youth unemployment, it might be better for the long-term health of the economy if these positions were held by the young.
14

0
10,000
20,000
30,000
40,000
50,000
60,000
70,000
80,000
15–24 25–54 55–64 65+
Persons not in labour force
Males Females
Statistics Canada. Table 282-0109 - Labour force survey estimates (LFS), by census metropolitan area based on 2006 census boundaries, sex and age group, 3-month moving average, unadjusted for seasonality, monthly (persons unless otherwise noted), CANSIM (database).
Figure 4
Figure 5
Figure 6
Statistics Canada. Table 282-0109 - Labour force survey estimates (LFS), by census metropolitan area based on 2006 census boundaries, sex and age group, 3-month moving average, unadjusted for seasonality, monthly (persons unless otherwise noted), CANSIM (database).
Statistics Canada. Table 282-0109 - Labour force survey estimates (LFS), by census metropolitan area based on 2006 census boundaries, sex and age group, 3-month moving average, unadjusted for seasonality, monthly (persons unless otherwise noted), CANSIM (database).
15
Unemployment
Loca
l lab
our m
arke
t co
nditi
ons
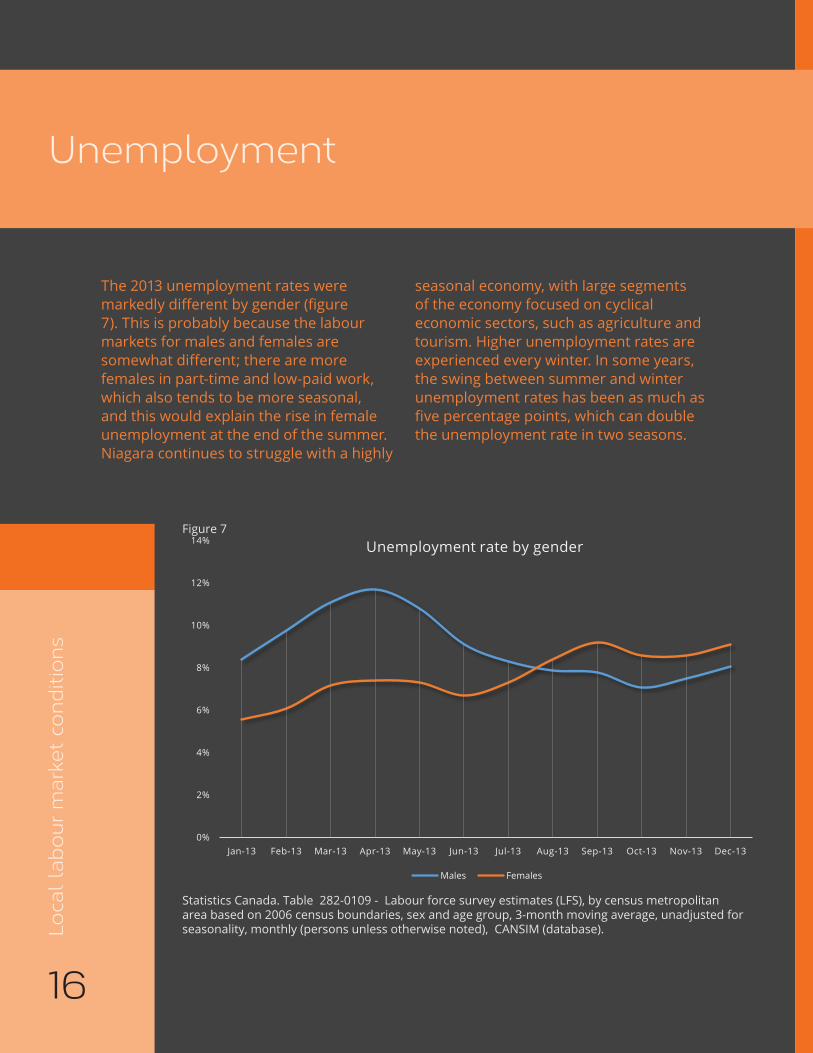
The 2013 unemployment rates were markedly different by gender (figure 7). This is probably because the labour markets for males and females are somewhat different; there are more females in part-time and low-paid work, which also tends to be more seasonal, and this would explain the rise in female unemployment at the end of the summer. Niagara continues to struggle with a highly
seasonal economy, with large segments of the economy focused on cyclical economic sectors, such as agriculture and tourism. Higher unemployment rates are experienced every winter. In some years, the swing between summer and winter unemployment rates has been as much as five percentage points, which can double the unemployment rate in two seasons.
0%
2%
4%
6%
8%
10%
12%
14%
Jan-13 Feb-13 Mar-13 Apr-13 May-13 Jun-13 Jul-13 Aug-13 Sep-13 Oct-13 Nov-13 Dec-13
Unemployment rate by gender
Males Females
Figure 7
Statistics Canada. Table 282-0109 - Labour force survey estimates (LFS), by census metropolitan area based on 2006 census boundaries, sex and age group, 3-month moving average, unadjusted for seasonality, monthly (persons unless otherwise noted), CANSIM (database).
16

Youth unemployment continues to remain a challenge for Niagara, although the region is by no means unique in this regard—the province and the country both struggle with the same problem. In 2013, the Canadian youth unemployment rate was almost double the overall rate (13.7% vs. 7.1%), and in Ontario, it was more than double (16.1% vs. 7.5%) (figure 8).
Contributing factors to this problem might include lack of experience, a perception that young people have traits undesirable for workers (whether generally true or not), higher dismissal rates among youth when older workers have more experience and seniority, following the “last in, first out” principle, as well as the facts that young people tend to have less experience in job-seeking, fewer contacts and networking opportunities, and credential inflation (the tendency for academic credentials to be more common, and thus worth less on the labour market, with each generation).
The Conference Board of Canada finds that poverty in childhood and youth leads to less time spent in education and increased poverty in adulthood and later life. While addressing youth unemployment likely won’t impact on this directly, facilitating access to the labour market early in a person’s career can only help in ameliorating the impact of poverty.7
0%
5%
10%
15%
20%
25%
Jan-13 Feb-13 Mar-13 Apr-13 May-13 Jun-13 Jul-13 Aug-13 Sep-13 Oct-13 Nov-13 Dec-13
Unemployment rate by age
15 to 24 years 25 to 54 years 55 to 64 years
Figure 8
Statistics Canada. Table 282-0109 - Labour force survey estimates (LFS), by census metropolitan area based on 2006 census boundaries, sex and age group, 3-month moving average, unadjusted for seasonality, monthly (persons unless otherwise noted), CANSIM (database).
17

EducationLo
cal l
abou
r mar
ket
cond
ition
s
Most people in the Niagara workforce have not completed any post-secondary education (figure 9). In 2011, there were 180,455 workers with no education past Grade 12, and 175,925 with at least some.
The most common fields of study within the Niagara labour force were in architecture, engineering, and related technologies, although these workers also had the second-lowest rate of labour force participation in Niagara. In terms of employment, the best field in Niagara to study remains education (figure 9) – majors have only a 3.3% unemployment rate.8
The worst is visual and performing arts and communications technologies, at 9.9% - although still ahead of the 11.9% rate for workers with no post-secondary education at all.9
Post-secondary education is clearly still a worthwhile investment, although if students are aiming for employment as an outcome of their education, a wise choice in the field of study can make an enormous difference. It can also pay to study outside the conventional “good job” fields. While agriculture, natural resources and conservation is the smallest field of study by number of workers, it also has one of Niagara’s highest labour force participation rates, and one of the lowest unemployment rates (figures 10 & 11).
60% 62% 64% 66% 68% 70% 72% 74% 76% 78%
Education
Architecture, engineering, and related technologies
Humanities
Health and related fields
Business, management, and public administration
Mathematics, computer, and information sciences
Physical and life sciences and technologies
Personal, protective, and transportation services
Social and behavioural sciences and law
Agriculture, natural resources, and conservation
Visual/perf. arts and communications tech
PARTICIPATION RATE
Workforce participation rates in Niagara by discipline of studyFigure 10
Statistics Canada, National Household Survey18

0% 2% 4% 6% 8% 10% 12%
Education
Agriculture, natural resources, and conservation
Health and related fields
Business, management, and public administration
Physical and life sciences and technologies
Humanities
Social and behavioural sciences and law
Architecture, engineering, and related technologies
Personal, protective, and transportation services
Mathematics, computer, and information sciences
Visual/perf. arts & communications tech
UNEMPLOYMENT RATE
Unemployment rates in Niagara by discipline of study
0 20,000 40,000 60,000 80,000 100,000
Agriculture, natural resources, and conservation
Physical and life sciences and technologies
Mathematics, computer, and information sciences
Visual and performing arts and communicationstechnologies
Humanities
Education
Personal, protective, and transportation services
Social and behavioural sciences and law
Health and related fields
Business, management, and public administration
Architecture, engineering, and related technologies
No post-secondary certificate, diploma, or degree
WORKERS
Most common fields of study in the Niagara labour force
Figure 11
Figure 9
Statistics Canada, National Household Survey
Statistics Canada, National Household Survey
19

Occupations and industries
Loca
l lab
our m
arke
t co
nditi
ons
It is notable that four of the five occupations with the highest unemployment rates in Niagara are highly seasonal, consisting of positions in agriculture, food service, trades, harvesting, and landscaping (figure 12). Seasonality doubtless plays a significant role in these high unemployment rates. These rates are averages for the year and thus do not show seasonal swings. It is also noteworthy that three of the five occupations with the lowest unemployment rates in Niagara are unionized, public-sector jobs, whereas the five occupations with the highest unemployment rates are predominantly private-sector and non-unionized. NWPB will examine these extremes in the coming year, as well as occupations with more moderate rates of unemployment.
15.0%
13.7%
12.3%
12.0%
11.9%
2.1%
2.0%
1.9%
1.5%
1.1%
0% 2% 4% 6% 8% 10% 12% 14% 16%
Harvesting, landscaping, and natural resources labourers
Trades helpers and labourers
Food counter attendants, kitchen helpers and related supportoccupations
Agriculture and horticulture workers
Other sales support and related occupations
Professional occupations in nursing
Retail and wholesale trade managers
Machinery and transportation equipment mechanics (exceptmotor vehicle)
Secondary and elementary school teachers and educationalcounsellors
Occupations in front-line public protection services
UNEMPLOYMENT RATE
Niagara's five best- and worst- major occupations by unemployment
Nia
gara
ave
rage
: 8.8
%
Figure 12
Statistics Canada, National Household Survey
20

0
5,000
10,000
15,000
20,000
25,000
Retail trade Accommodation andfood Services
Healthcare andsocial assistance
Manufacturing Educational services
Wor
kers
in o
ccup
atio
n
Occupational breakdown of Niagara's top five industries
Trades, transport, and equipment operators and related
Sales and service
Manufacturing and utilities
Education, law, and social, community, and government services
Natural and applied sciences and related occupations
Management
Health
Business, finance, and administration
* Occupations numbering at least 1,000 workers in Niagara's five largest NAICS codes by number of workers (place of work). NAICS at 2-digit level & NOC-S at 1-digit level.
The occupational composition of Niagara’s five largest industries, comprising almost a third of the entire Niagara workforce, is not very surprising (figure 13). However, there are a few interesting points to note, such as the large number of business, finance, and administrative occupations in healthcare.
Niagara’s healthcare and social assistance system as a whole contains roughly one administrator for every six healthcare or community service professionals. One in six Niagara workers in a hospital or a university setting works in an administrative, financial, or business capacity. In Niagara’s nursing and residential care facilities, this ratio is one in 28.
Over the following three years we will be exploring this pattern to see if it is consistent with that of other regions.
Figure 13*
Statistics Canada, National Household Survey
21

Employment Ontario overviewEm
ploy
men
t O
ntar
io c
lient
dat
a
Employment Ontario’s front-line service providers are one of Niagara’s best systems for addressing unemployment, under-employment, self-employment, literacy, and workplace skills training. As was the case for our 2013 Niagara Labour Market Update, the Ministry of Training, Colleges and Universities provided NWPB with aggregate client data for Niagara’s Employment Ontario service providers. In an attempt to integrate our analysis of these data with the expert opinions of individual service providers, NWPB conducted a survey, a preliminary briefing, and a focus group with EO network representatives before producing this report. Our observations are thus an attempt to synthesize as much of the available data as possible. It is our hope that this section represents a consensus among service providers in Niagara.
Table 1 presents data from all Employment Ontario providers in the Niagara region.
The total number of assisted Employment Service (ES) clients increased slightly from 7,056 in the 2013 fiscal reporting year, to 7,270 in the 2014 fiscal reporting year. Based on 2013 figures, this accounts for as much as 40% of Niagara’s unemployed population.10 The largest concentration of these clients is found in the 25–44 age demographic.
During the consultative phase of this report’s production, many ES agencies indicated that the age brackets provided to NWPB align with Statistics Canada’s age brackets but not with the default age groups utilized by Employment Service providers. We believe this to be a structural challenge that should be addressed in future collaborative efforts between the Local Board Network and Employment Ontario service providers.
0
500
1,000
1,500
2,000
2,500
3,000
3,500
2013 2014
Employment Services clients by age
15-24 25-44 45-64 65 and older
Figure 14
Ministry of Training, Colleges and Universities; EOIS-CAMS
22

Employment Service demographicsNumber of assisted clients 7,270Females 3,221Males 4,044Newcomer 189Visible minority 162Person with disability 310Aboriginal person 112
Education at intakeLess than grade 8 62Less than grade 12 897Completion of secondary 2,920Cert. apprentice/journeyperson 141Completion of college 2,038Completion of university 859Other 353
Source of incomeEmployment insurance 1,449Ontario Works 1,609Ontario Disability Support 146No source of income 2,169Other 1,897
Outcome at program exitEmployed 4,854Training or education 1,110Other 1,306
Literacy and basic skills demographicsNumber of learners 1,403Females 842Males 559Newcomer 38Visible minority 17Person with disability 204Aboriginal person 97
Labour force attachmentEmployed full–time 237Employed part–time 194Full–time student 52Part–time student 11Self–employed 20Under–employed 30Unemployed 842
Source of incomeOther 246Employed 360Employment Insurance 78No Source of Income 61Ontario Disability Support 262Ontario Works 302Self Employed 16
Table 1
Ministry of Training, Colleges and Universities; EOIS-CAMS
23

Education
This year, there was a 12.7% increase in the number of university-educated clients (figure 15). Consultations with ES providers offered some interesting insights into this particular demographic. A majority of providers indicated that these individuals are between the ages of 24 and 45 and that access to the Youth Employment Fund (YEF) is a likely reason for this growth.
While the YEF is a vital link in helping young people gain work experience, our consultations reveal that the increase in university-educated clients is symptomatic of university-educated individuals not being able to find work in their field. University-educated
ES clients were generally graduates of liberal arts programs, whereas college clients frequently had a general arts-and-sciences background.
Although these insights may speak to a skills mismatch, NWPB does not believe that the narrative of employment challenges for post-secondary graduates ends with the assertion that graduates are not taking the right programs to find a job. Indeed, a complete analysis of this issue requires research into hiring practices, particularly those that focus on “turnkey” employees (i.e., “entry-level” work that actually requires years of on-the-job experience.)
Empl
oym
ent
Ont
ario
clie
nt d
ata
0
500
1000
1500
2000
2500
3000
Niagara 2013 Niagara 2014
Employment Service client education
Less than grade 8 Less than grade 12 Secondary school College University Other
Ministry of Training, Colleges, and Universities; EOIS-CAMS
Figure 15
24

Time out of employment
Figure 16
Ministry of Training, Colleges, and Universities; EOIS-CAMS
In their 2013 “Employment Outlook for Canada” report, the Organisation for Economic Co-Operation and Development (OECD) cited long-term unemployment as a considerable risk factor for Canada’s economy.11 The OECD specifically noted that “the share of the unemployed who have been jobless for a year or longer has nearly doubled since the recession and this group needs additional assistance to be able to benefit from an improving labour market.”12
ES clients were twice as likely to be unemployed for over a year than the average unemployed Ontarian in 2013 (figure 16). Furthermore, our consultations with ES providers have revealed that the time out of employment measurement
in ES clients also includes a person’s time out of education. Conceivably, a person who is unemployed for five years, for example, but has completed a retraining program would effectively have his or her “unemployment clock” reset, despite still facing the difficulties that come with being out of the labour force for a prolonged duration.
This presents a considerable challenge in truly understanding the labour force engagement of ES clients. In terms of producing the best possible data for ES clients, NWPB recommends that future data sets offer a distinction between time out of education and time out of employment.
25

Occupations and industriesEm
ploy
men
t O
ntar
io c
lient
dat
a
Although we reviewed industry and occupation outcomes for ES clients in the 2013 Niagara Labour Market Update, we were not able to do so in this report. The data provided to NWPB included employment and industry data at a four-digit NAICS* and NOC-S** level. The four-digit level is very granular, and in a small population frequently produces categories with very small numbers which must be suppressed for privacy reasons (i.e. so that no reader can identify an individual in the report). This attempt at producing high-resolution data for a small population size, while laudable, resulted in invalid data due to widespread data suppression.
During consultations, ES providers confirmed that a comprehensive data source on a client’s point of exit from an ES program and re-entry into the workforce was also vital to their work. As such, we recommend a return to NAICS and NOC-S measurements at the 1- or 2-digit level, as we expect this will produce more consistent and useable data, while being less work for ES staff.
* NAICS: North American Industry Classification System; delineates industries or sectors** NOC-S: National Occupational Classification for Statistics; delineates occupations and trades
26
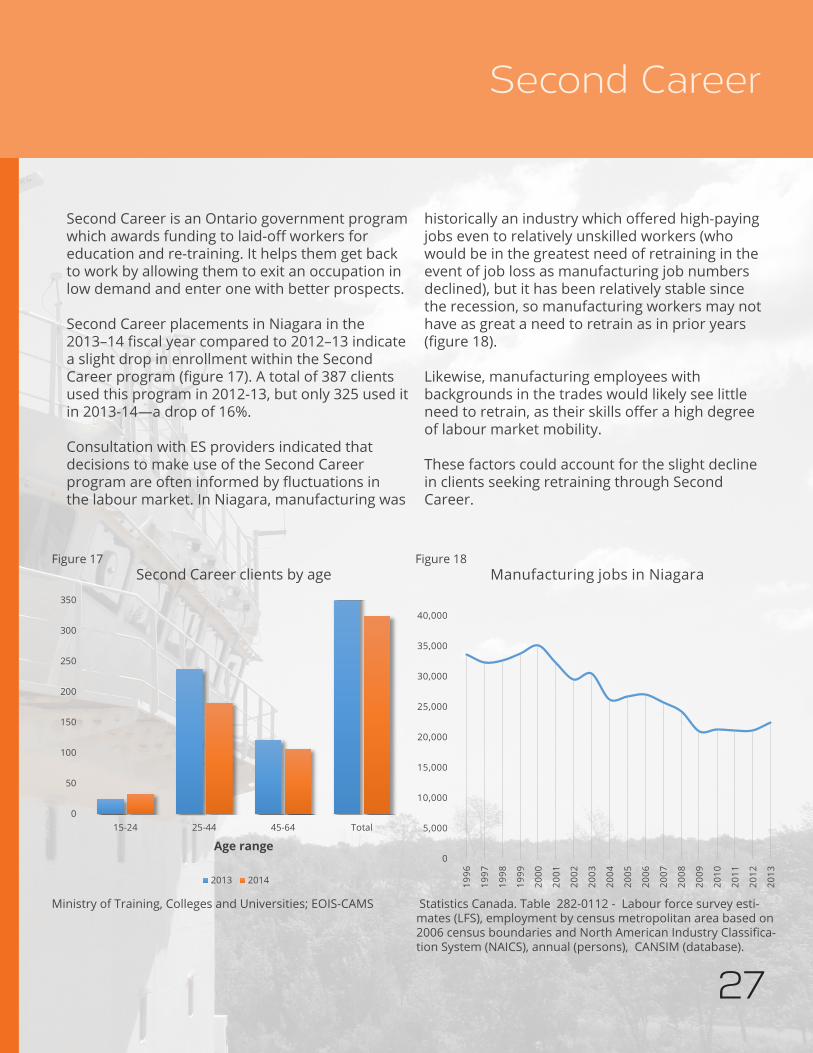
Second Career is an Ontario government program which awards funding to laid-off workers for education and re-training. It helps them get back to work by allowing them to exit an occupation in low demand and enter one with better prospects.
Second Career placements in Niagara in the 2013–14 fiscal year compared to 2012–13 indicate a slight drop in enrollment within the Second Career program (figure 17). A total of 387 clients used this program in 2012-13, but only 325 used it in 2013-14—a drop of 16%.
Consultation with ES providers indicated that decisions to make use of the Second Career program are often informed by fluctuations in the labour market. In Niagara, manufacturing was
historically an industry which offered high-paying jobs even to relatively unskilled workers (who would be in the greatest need of retraining in the event of job loss as manufacturing job numbers declined), but it has been relatively stable since the recession, so manufacturing workers may not have as great a need to retrain as in prior years (figure 18).
Likewise, manufacturing employees with backgrounds in the trades would likely see little need to retrain, as their skills offer a high degree of labour market mobility.
These factors could account for the slight decline in clients seeking retraining through Second Career.
Second Career
0
50
100
150
200
250
300
350
15-24 25-44 45-64 Total
Age range
Second Career clients by age
2013 2014
0
5,000
10,000
15,000
20,000
25,000
30,000
35,000
40,000
1996
1997
1998
1999
2000
2001
2002
2003
2004
2005
2006
2007
2008
2009
2010
2011
2012
2013
Manufacturing jobs in NiagaraFigure 17 Figure 18
Ministry of Training, Colleges and Universities; EOIS-CAMS Statistics Canada. Table 282-0112 - Labour force survey esti-mates (LFS), employment by census metropolitan area based on 2006 census boundaries and North American Industry Classifica-tion System (NAICS), annual (persons), CANSIM (database).
27

Loca
l em
ploy
men
t ch
ange
s
Employers in Niagara
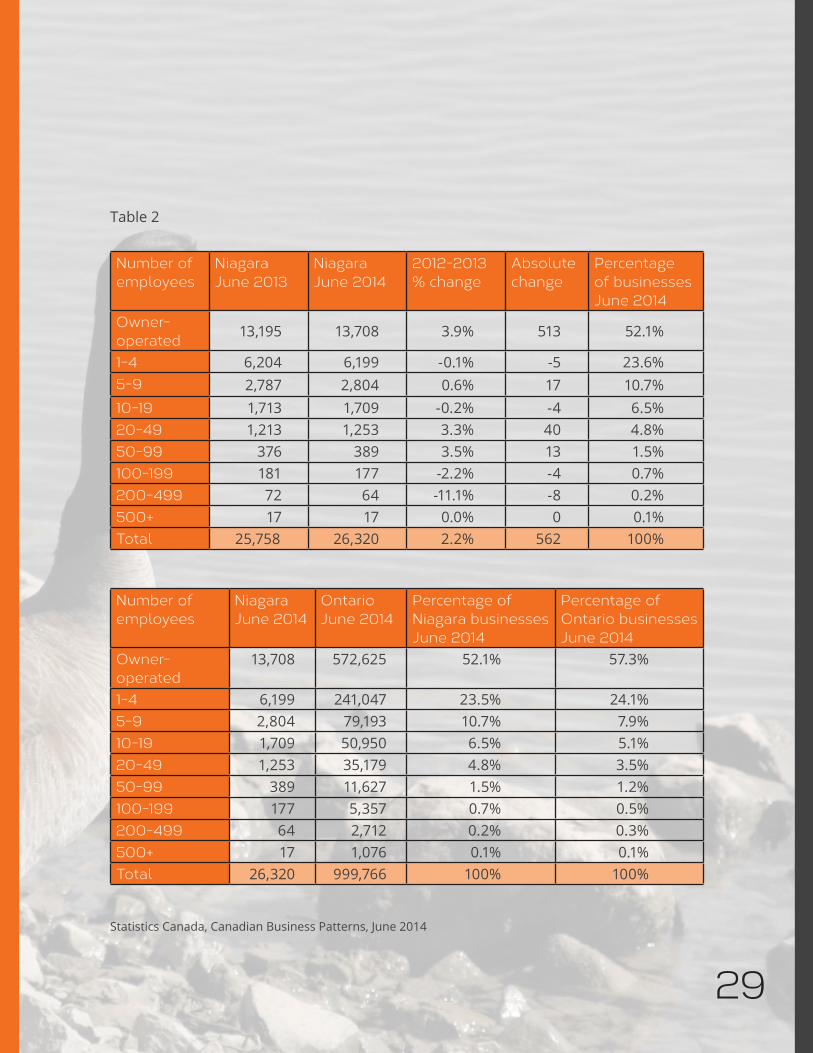
The most recent data from Statistics Canada’s Canadian Business Patterns database allow us to compare a snapshot of Niagara’s employers from June 2013 to June 2014. Here, we can see that there has been relatively little change in the composition of firms by number of employees in Niagara. The largest shift was in the number of owner-operated firms.13
In 2013, owner-operated firms accounted for 52.1% of all of Niagara’s employers. In absolute terms, the number of owner-operated businesses in Niagara increased from 13,195 in 2013, to 13,708 in 2014 (table 2). These data show that the number of medium and large enterprises in Niagara fluctuated between June 2013 and June 2014. While large employers (i.e., those employing more than 100 employees) decreased, there were some increases in the 20–49 and 50–99 cohorts. From the available data, it is difficult to determine if these changes reflect new businesses opening operations in Niagara or a change in the size of existing firms.
While these figures speak to the entrepreneurial strength of Niagara, they also indicate we have room to grow our base of owner-operated businesses before matching proportions seen at the provincial level. It is also possible that the increasing number of owner-operated enterprises in Niagara could be symptomatic of the stagnation and decline in medium- and large-sized employers in the region (i.e., many workers have struck out on their own since failing to find employment in existing enterprises). Whatever the case, this issue calls for greater local, provincial, and federal support for entrepreneurs and small businesses in Niagara.
With Niagara’s aging population and its growing number of smaller employers and self-employed individuals come questions about pensions, healthcare benefits, and increased burdens on social services. A detailed examination of this question is beyond the scope of this document, but we are interested in exploring it with others.
28
Number of employees
Niagara June 2013
Niagara June 2014
2012-2013 % change
Absolute change
Percentage of businesses June 2014
Owner-operated 13,195 13,708 3.9% 513 52.1%
1-4 6,204 6,199 -0.1% -5 23.6%5-9 2,787 2,804 0.6% 17 10.7%10-19 1,713 1,709 -0.2% -4 6.5%20-49 1,213 1,253 3.3% 40 4.8%50-99 376 389 3.5% 13 1.5%100-199 181 177 -2.2% -4 0.7%200-499 72 64 -11.1% -8 0.2%500+ 17 17 0.0% 0 0.1%Total 25,758 26,320 2.2% 562 100%
Number of employees
Niagara June 2014
Ontario June 2014
Percentage of Niagara businesses June 2014
Percentage of Ontario businesses June 2014
Owner-operated
13,708 572,625 52.1% 57.3%
1-4 6,199 241,047 23.5% 24.1%5-9 2,804 79,193 10.7% 7.9%10-19 1,709 50,950 6.5% 5.1%20-49 1,253 35,179 4.8% 3.5%50-99 389 11,627 1.5% 1.2%100-199 177 5,357 0.7% 0.5%200-499 64 2,712 0.2% 0.3%500+ 17 1,076 0.1% 0.1%Total 26,320 999,766 100% 100%
Statistics Canada, Canadian Business Patterns, June 2014
Table 2
29
Mig
ratio
n tr
ends
Migration trends
Migration data are often taken from the National Household Survey (NHS). However, please note that although the most recent data in this section is from 2011, these migration estimates are derived from taxation records for better accuracy.
Migration data from 2011 suggests Niagara is most attractive as a migration destination for individuals aged 45 to 64.14 Of the 1,817 net migrants to the Niagara region in 2011, 917 were between the ages of 45 and 64, and 298 were aged 65 and over. In other words, 67% of 2011’s net immigrants were individuals over the age of 45. For comparison, 28% of migrants were 17 or younger, and only 6% were aged 25 to 44. A net emigration of individuals between the ages of 18 and 24 is grounds for some concern, particularly for a region with a university and a college, even if the number is relatively small.
Niagara’s 2011 migration figures accounted for a mere 0.5% of the total 2011 population, half of the Canadian Census Metropolitan Area (CMA) average of 1%. These data suggest that Niagara is considerably less successful than the rest of the country’s urban centres in attracting individuals.
Net–migration patterns for Niagara from 2007 to 2011 are generally consistent with the 2011 data outlined in this section (figure 19). The migrant group aged between 45 and 64 represents 54% of Niagara’s migration between 2007 and 2011. Once again, the 25–44 cohort has the smallest positive net migration, accounting for 6% of total migration. Over this five-year period, youth emigration from Niagara was pronounced, with net emigration of 7%. Even if this were entirely caused by college-aged individuals leaving for education elsewhere, the lower number of net migrants aged between 25 and 44 indicates that some of them never return.
30

-1,000
0
1,000
2,000
3,000
4,000
5,000
6,000
7,000
All age groups 0 to 17 years 18 to 24 years 25 to 44 years 45 to 64 years 65 years and over
Popu
latio
n
Age group
St. Catharines–Niagara CMA: 2007-2011 net migration
-0.5%
0.0%
0.5%
1.0%
1.5%
2.0%
2.5%
3.0%
2011
mig
ratio
n as
% o
f 201
1 po
pula
tion
Canadian CMAs: 2011 net migration as a percentage of 2011 population
Statistics Canada. Table 111-0028 - In-, out- and net-migration estimates, by provincial regions and age group, annual (number), CANSIM (database).
Figure 19
Figure 20
Statistics Canada. Table 111-0028 - In-, out- and net-migration estimates, by provincial regions and age group, annual (number), CANSIM (database).
31

Migration trendsM
igra
tion
tren
ds
These data indicate a potential demographic challenge for Niagara in the coming years. While educational opportunities and family relocation may account for some of the emigration of Niagara’s 18- to 24-year-olds, the challenges of a relatively sluggish local labour market may also be a “push factor,” that is, these people have no choice but to leave for work.
With respect to younger workers, our goal should be to not only attract young, educated workers from outside Niagara, but also to retain those who are already here. Since this is easier said than done,
NWPB will be undertaking a study to attempt to better understand the entry-level opportunities available in Niagara for youth of all levels of education.
Niagara’s ranking in net migration for individuals aged between 45 and 64 raises interesting questions about what factors are pulling this cohort to Niagara (figure 21). Since this age group is not necessarily of retirement age, there is a possibility that jobs opportunities are bringing these people to Niagara. Over the coming three years, NWPB plans to explore the nature of the late-career work force opportunities
1,345
1,734
1,663
2,328
1,696
778
-50
404
834
1,888
1,292
1,817
-100 100 300 500 700 900 1100 1300 1500 1700 1900 2100 2300 2500
2000
2001
2002
2003
2004
2005
2006
2007
2008
2009
2010
2011
Population
St. Catharines–Niagara CMA: Annual net migrationFigure 21
Statistics Canada. Table 111-0028 - In-, out- and net-migration estimates, by provincial regions and age group, annual (number), CANSIM (database).
32

33

Update of previous actions
34

Upd
ate
of p
revi
ous
actio
ns
Niagara-wide employer survey/Employer One:
After releasing our 2013 report, NWPB was mandated by the Ministry of Training, Colleges and Universities to deploy Employer One, a regionally focused employer survey. In the lead-up to a January 2015 release, NWPB has met with other organizations to build marketing partnerships for this survey. NWPB continues to seek community partners who will help us in promoting this survey.
We would also like to note other excellent initiatives that will co-exist with Employer One. NWPB continues to support the outstanding work undertaken by the Employment Help Centre (EHC) with their quarterly employer survey, and the City of Port Colborne’s Business Retention and Expansion (BR+E) initiative.
The Niagara Employment Crawl:
NWPB continues to support Brock University and Niagara College’s Niagara Employment Crawl. This annual program exposes students at Niagara’s post-secondary institutions to high-paying, high-skill jobs available in the Niagara region. This year’s job crawl took place on November 3, 2014.
Labour market information system:
In August 2014, NWPB received funding from the Ontario Trillium Foundation to become Niagara’s lead agency for the Canadian Council on Social Development’s Community Data program. NWPB’s role will be two-fold. First, we will provide discounted access to the Community Data program to interested users in Niagara. Second, we will develop a series of training programs to facilitate easy use of the information contained within this database. It is our hope that these actions will demonstrate the value of Niagara’s participation in the Community Data program, leading to lasting support for this initative.
Agriculture and rural job survey:
NWPB is continuing to work on a profile of rural and agricultural occupations in the Niagara region. This project will culminate
in a set of insights illustrating the strengths and challenges of Niagara’s rural economy.
Social innovation:
Over the past two years NWPB supported two TEDx Cities events. These events focused on the past and present, laying the foundation for a third event that will look at Niagara’s future. These events were recorded and can be found at www.tedxstcatharines.com. NWPB is working with organizers to identify a timeframe for our third TEDx talk.
NWPB is committed to providing entrepreneurs and owner-operated businesses with useful labour market information. As most employers in Niagara are microenterprises, NWPB provided the funding necessary to form the Niagara chapter of Startup Canada. NWPB also partnered with Niagara College to provide a presentation on additive manufacturing at CONNECT2014. This effort further engages secondary schools and post-secondary institutions with the emerging skills needed to sustain a modern manufacturing sector.
General research:
Each year the NWPB produces timely research projects and presentations. Last November we convened the Niagara Apprenticeship Forum and produced the Destination: Apprenticeship guide.15 This year we provided a presentation to OneStep on open data, privacy protection, and other related legislation.
Given the aging workforce in Niagara, we are currently researching succession planning in Niagara’s small businesses.
This year, Dr. Jeff Boggs of Brock University’s Department of Geography joined the NWPB board and is working with staff to develop service learning opportunities. This pilot program offered NWPB resources to third- and fourth-year undergraduates engaging in practical research on issues relevant to Niagara’s local labour market conditions.
35

Action plan
NWPB recommends the following goals and targets for the coming year and afterward.
Niagara needs a well-coordinated employer-attraction program to create new jobs and to address population stagnation. To match the 2013 federal unemployment rate, Niagara would have had to have created 3,000 more jobs than it actually did. One of the key problems that Niagara employers cite is a lack of suitably skilled workers, particularly given the reduction of Niagara’s manufacturing base. If a body of unemployed former factory workers lacks the skills demanded by modern employers, and there is a lack of workers for industries such as advanced manufacturing, software development, or financial services, this creates a skills gap and contributes to persistently high unemployment. NWPB advocates innovations in retraining and education via an evidence-based strategy.
There are many needs and issues facing unemployed workers, especially older workers. Those people who can best develop new skills and adapt are those who are young and educated. Unfortunately, Niagara is an older and relatively uneducated region. This challenge must be addressed by all concerned through continued improvement and outreach in adult and continuing education opportunities.
A problem facing this undertaking, however, is the quality and availability of data for agencies tasked with addressing this challenge. Retraining, if it is to be productive, requires an investment in providing more accurate labour market information. Many, if not most, front-line service agencies do not have dedicated data staff or the resources to hire them. We recommend that the Ministry of Training, Colleges and Universities make funding available to each front-line service organization in Niagara for the express purpose of retaining a data analyst.
36

Our analysis of Employment Ontario data revealed an issue with data quality and misalignment. We recommend that the Employment Ontario agencies convene a board for data quality assurance which will develop best practices for data entry and management, and ensure those standards are maintained. We also recommend that the Ministry of Training, Colleges and Universities expand its work with local boards and provide raw data from the CAMS system, rather than aggregate data, to avoid data quality issues in the future. Since meaningful analysis of the CAMS data is not possible at the 4-digit NAICS/NOC-S level, we also suggest reverting to 1- and 2-digit NAICS/NOC-S codes. These improvements will provide more accurate and reliable data. Through our ongoing project to provide labour market information to Niagara, NWPB would also like to form data partnerships with Niagara’s Employment Ontario agencies for data-sharing and analysis.
NWPB greatly admires the work done by the Employment Help Centre in surveying employers, and recommends that its quarterly survey be conducted by all Employment Ontario agencies across Niagara. Putting the jobless back to work and into higher-paid and higher-skilled jobs will require an increasingly accurate picture of employer demand, and this survey could be a significant asset in creating that picture. Combined with Employer One, Niagara can utilize two complementary local methods for data-gathering and meeting the needs of private-sector employers.
Owner-operated firms have become the majority of businesses in Niagara during the past year. Over 75% of local businesses employ fewer than five people. While the number of small businesses has grown substantially, that of larger firms (over 200 employees, and particularly over 500) has shrunk.
This has both pros and cons. Small businesses and start-ups are usually more flexible and innovative, which are useful characteristics in the twenty-first-century economy, but they are also more vulnerable to market fluctuations, often lacking the cushion of a large cash reserve or a large client base.
Therefore, we recommend that Niagara invest substantially in efforts to support and nurture microbusinesses, as well as provide or subsidize professional and financial services to microbusinesses who may not have the resources or expertise to perform those services themselves. If the new Niagara economy is one with very few large employers and a great many small businesses, Niagara must adapt to grow and support that economy.
37

Action plan
Niagara has been most attractive for migrants in the 45-64 age bracket and, in second place, the 0-17 bracket (presumably, their children). The data shows that despite our best efforts to date, Niagara has not done a sufficient job at attracting and retaining migrants in the younger 25-44 group, and is actually losing people aged 18 to 24. Some of these are doubtless students leaving for college or university, but nevertheless, Niagara ranks as one of the regions least-able to attract and retain migrants in all of Canada (except for 45-64-year-olds, where it is the second-best). NWPB will examine opportunities related to the older workforce cohort, in an attempt to understand the labour force opportunities that present Niagara
as a destination for older workers. With these trends in mind another vital project for the future must be the creation of a skills task force to renew our work on attracting young people to Niagara and on retaining them, particularly well-educated young people in professions, trades, and creative professions. There are a few remarkable initiatives in place, but these can and should be expanded while others may be added. NWPB has shown this leadership in the past by initiating projects like NEXT Niagara, but this effort must be shared by many organizations across the community, and placed front-and-centre so we can address the challenges to our long term economic prosperity.
38

References and Notes
1. The St. Catharines–Niagara CMA includes the municipalities of St. Catharines, Niagara Falls, Welland, Fort Erie, Lincoln, Port Colborne, Thorold, Pelham, Niag-ara-on-the-Lake, and Wainfleet. Statistics Canada uses commut-er flow patterns to determine if a municipality will be included in a particular CMA. At present, Grimsby’s commuter flow pat-terns indicate a closer integration with Hamilton’s labour market, and as such, Grimsby is included in the Hamilton CMA. As of this report, West Lincoln is not affiliat-ed with any CMA.
2. Statistics Canada, Canadian Business Patterns, June 2014.
3. Statistics Canada, Migration Estimates, CANSIM 111-0028.
4. An online copy of the 2013 Ni-agara Labour Market Plan can be found at http://goo.gl/nkWxlC.
5. NWPB examined the relation-ship between manufacturing in Ontario and the US–Canada exchange rate in “Focus on Man-ufacturing, Part 2: The Ontario Picture,” at http://goo.gl/yTl7Fv.
6. Changes made in 1996 to geographical areas for statistical purposes render many historical comparisons invalid.
7. The original article can be found at http://www.conference-board.ca/hcp/details/society/child-poverty.aspx
8. This does not necessarily mean that education majors have found jobs in education, or even that they have found full-time work, merely that they have some kind of job. Further-more, these data are based on the National Household Survey (NHS), and there may be some gaps in the data that could skew these results. The NHS sampling methodology produced statisti-cally biased responses, unlike the older and less costly Long-Form Census. As a result, 2011 NHS data are not comparable to 2006 Long-Form data, and the 2011 NHS data are far less reliable indicators of actual trends.
9. The high unemployment rate and high labour force participa-tion rate for visual arts graduates may suggest that individuals from
this educational background are highly motivated to find work but are unable to do so.
10. Statistics Canada, Labour Force Survey, CANSIM 282-0110.
11. The original article can be found at http://www.oecd.org/employment/emp/Country%20Notes-CANADA.pdf
12. Ibid.
13. Canadian Business Pattern data is drawn from business registrations collected by the Canada Revenue Agency. As such, the Canadian Business Register defines owner-operated firms in as including “the self-employed, i.e., those who do not maintain an employee payroll but may have a workforce which consists of contracted workers, family members or business owners.”
14. Statistics Canada, CANSIM 111-0028: In-, out-, and net-migration estimates by provincial regions and age group.
15. A copy of the report can be found at http://goo.gl/tHIXq8.
39

Niagara Workforce Planning BoardOur Vision Is Working
36 Page Street, Suite 404St. Catharines ON L2R 4A7
905-641-0801www.niagaraworkforceboard.ca
www.niagaraworkforce.ca@NWPB