Embed Size (px)
Citation preview

Importante: Si usted tiene alguna pregunta sobre este informe favor de llamar a Lee County Utilities al 239-533-8845.
Lee County Utilities (LCU) is pleased to present a summary of the quality of the water provided to you, our customers, during 2017. This report is designed to inform you about your water quality and services that we provide every day. LCU is committed to delivering the safest and most reliable water supply possible. The Safe Drinking Water Act (SDWA) requires that utilities issue this annual Consumer Confi dence Report in addi-tion to other notices that may be required by law. We believe that informed consumers are our best allies in maintaining drinking water excellence.
LCU routinely monitors for contaminants in your drinking water according to federal and state laws, rules and regulations. LCU collects water samples and conducts water quality tests using the certifi ed laboratories of the Lee County Department of Health and the Lee County Environmental Laboratory to ensure that the public water supply is safe for human consumption. Except where indicated otherwise, this report is based on the results of our monitoring for the period of January 1, 2017 to December 31, 2017. Data obtained before January 1, 2017 and presented in the report are from the most recent testing done in accordance with the laws, rules, and regulations.
The U.S. Environmental Protection Agency (EPA) requires monitoring of over 80 drinking water contaminants. Those contaminants listed throughout the tables are the only contaminants detected in your drinking water. The state allows us to monitor for some contaminants less than once per year because the concentrations of these contaminants do not change frequently therefore, some of our data, though representative, are more than one year old.
IntroductionIntroduction
QUESTIONS REGARDING THIS REPORT
For more information regarding this report please contact:
Cadd Balogh239-694-4038
QUESTIONS REGARDING YOUR BILL
For all other questions and to request a hard copy of the report call:
Customer Service Center 239-533-8845
1-800-485-0214www.leegov.com/utilities
GET INVOLVED
We encourage our customers to become involved in decisions that may affect the quality of their drinking water by attending regularly scheduled meetings held by the Lee County Board of County Commissioners. Board meetings are held every 1st and 3rd Tuesday at the Lee County Courthouse at 2120 Main Street, Fort Myers. These meetings begin at 9:30 am and meeting agendas are available through Lee Cares at 2115 Second Street, Fort Myers, or on the Internet at www.leegov.com. Additionally, the Board holds public hearings at 5:00 pm on the 1st and 3rd Tuesday of every month.

Below are descriptions of our source waters and the type of treatment at each of our facilities:
Corkscrew Water Treatment Plant treats groundwater obtained from the Sandstone, Surfi cial, and Lower Hawthorn aquifers from the Corkscrew wellfi eld. This water is lime softened, chlorinated for disinfection and then fl uoridated for dental purposes. This water is then blend-ed with water from the Green Meadows Water Treatment Plant.
Green Meadows Water Treatment Plant treats groundwater from the Sandstone and Surfi cial aquifers from the Green Meadows well-fi eld. This water is treated for color removal, lime softened, fi ltered and chlorinated for dis-infection. This water is then blended with water from the Corkscrew Water Treatment Plant.
North Lee County Water Treatment Plant treats groundwater from the Low-er Hawthorn aquifer from the North Lee County wellfi eld. This water is treated by re-verse osmosis, chlorinated for disinfection and then fl uoridated for dental purposes.
Olga Water Treatment Plant treats wa-ter obtained from the Caloosahatchee Riv-er. This water is treated for color removal and fi ltered. It is chlorinated for disinfection and then fl uoridated for dental purposes.
Pinewoods Water Treatment Plant treats groundwater from the Sandstone and Surfi cial aquifers using nanofi ltration and water from the Lower Hawthorn aquifer using reverse osmosis from the Pinewoods wellfi eld. The water from both treatment units is then blended together and sent to degasifi ers, where hydrogen sulfi de is removed. Fluoride is added for dental purposes and then the water is chlorinated for disinfection.
Service Areas & Water ResourcesService Areas & Water Resources
Maximum Contaminant Level or MCL: The highest level of a contaminant that is allowed in drinking water. MCLs are set as close to the MCLGs as feasible using the best available treatment technology.
Maximum Contaminant Level Goal or MCLG: The level of a contaminant in drinking water below which there is no known or expected risk to health. MCLGs allow for a margin of safety.
Action Level (AL): The concentration of a contaminant which, if exceeded, triggers treatment or other requirements that a water system must follow.
Treatment Technique (TT): A required process intended to reduce the level of a contaminant in drinking water.
Maximum Residual Disinfectant Level or MRDL: The highest level of a disinfectant allowed in drinking water. There is convincing evidence that addition of a disinfectant is necessary for control of microbial contaminants.
Maximum Residual Disinfectant Level Goal or MRDLG: The level of a drinking water disinfectant below which there is no known or expected risk to health. MRDLGs do not refl ect the benefi ts of the use of disinfectants to control microbial contaminants.
Locational Running Annual Average (LRAA): The average of sample analytical results for samples taken at a particular monitoring location during the previ-ous four calendar quarters.
pCi/L = Picocurie Per Liter - measure of the radioactivity in water.
NTU = Nephelometric Turbidity Unit- measure of the clarity of water. Turbidity in excess of 5 NTU is just noticeable to the average person. Turbidity is a measure of the cloudiness of the water. We monitor it because it is a good indicator of the effectiveness of our fi ltration system. High turbidity can hinder the effectiveness of disinfectants.
ppm = Parts Per Million or Milligrams Per Liter (mg/L) - one part by weight of analyte to 1 million parts by weight of the water sample.
ppb = Parts Per Billion or Micrograms Per Liter (ug/L) - one part by weight of analyte to 1 billion parts by weight of the water sample.
ND = Means not detected and indicates that the substance was not found by laboratory analysis.
n/a = Not applicable
Terms & AbbreviationsTerms & Abbreviations
Note 1: For chloramines and chlorine, the level detected is the highest running annual average (RAA), computed quarterly, of monthly averages of all samples collected. For haloacetic acids and TTHM, the level detected is the highest RAA, computed quarterly, of quarterly averages of all samples collected if the system is monitoring quarterly. Range of results is the range of individual sample results for all monitoring locations.
Note 2: Results in the Level Detected column for radioactive contaminants and inorganic contaminants are the highest detected level at any sampling point.
Note 3: LCU performed a free chlorine fl ush from May 1 through May 29. Disinfection results include both chloramines and chlorine.
Note 4: The Olga Water Treatment Plant was not producing water during the month of June 2017 - July 10, 2017.

The sources of drinking water (both tap water and bottled water) include rivers, lakes, streams, ponds, reservoirs, springs, and wells. As water travels over the surface of the land or through the ground, it dissolves naturally occurring minerals and, in some cases, radioactive material, and can pick up substances resulting from the presence of animals or from human activity.
Contaminants that may be present in source water include:
(A) Microbial contaminants, such as viruses and bacteria, which may come from sew-age treatment plants, septic systems, agricultural livestock operations, and wildlife.
(B) Inorganic contaminants, such as salts and metals, which can be naturally-occurring or result from urban stormwater runoff, industrial or domestic wastewater discharges, oil and gas production, mining, or farming.
(C) Pesticides and herbicides, which may come from a variety of sources such as agri-culture, urban stormwater runoff, and residential uses.
(D) Organic chemical contaminants, including synthetic and volatile organic chemicals, which are by-products of industrial processes and petroleum production, and can also come from gas stations, urban stormwater runoff, and septic systems.
(E) Radioactive contaminants, which can be naturally occurring or be the result of oil and gas production and mining activities.
In order to ensure that tap water is safe to drink, the EPA prescribes regulations, which limit the amount of certain contaminants in water provided by public water sys-tems. The Food and Drug Administration (FDA) regulations establish limits for contami-nants in bottled water, which must provide the same protection for public health.
Drinking water, including bottled water, may reasonably be expected to contain at least small amounts of some contaminants. The presence of contaminants does not neces-sarily indicate that the water poses a health risk. More information about contaminants and potential health effects can be obtained by calling the Environmental Protection Agency’s Safe Drinking Water Hotline at 1-800-426-4791.
Some people may be more vulnerable to contaminants in drinking water than the gen-eral population. Immuno-compromised persons such as persons with cancer undergo-ing chemotherapy, persons who have undergone organ transplants, people with HIV/AIDS or other immune system disorders, some elderly, and infants can be particularly at risk from infections. These people should seek advice about drinking water from their health care providers. EPA/CDC guidelines on appropriate means to lessen the risk of infection by Cryptosporidium and other microbiological contaminants are avail-able from the Safe Drinking Water Hotline (800-426-4791).
Additional Health InformationAdditional Health Information

AN IMPORTANT WORD ABOUT LEAD
If present, elevated levels of lead can cause serious health problems, especially for pregnant women and young children. Lead in drinking water is primarily from materials and components associated with service lines and home plumbing.
Lee County Utilities is responsible for providing high quality drinking water, but cannot control the variety of materials used in plumbing components.
When your water has been sitting for several hours, you can minimize the po-tential for lead exposure by fl ushing your tap for 30 seconds to 2 minutes before using water for drinking or cooking. If you are concerned about lead in your water, you may wish to have your water tested. Information on lead in drinking water, testing methods, and steps you can take to minimize exposure is available from the Safe Drinking Water Hotline or at http://www.epa.gov/safewater/lead.
Lead in drinking water is rarely the sole cause of lead poisoning, but it can add to a person’s total lead exposure. All potential sources of lead in the household should be identifi ed and removed, replaced or reduced.SOURCE WATER ASSESSMENTS
In 2017, the Florida Department of Environmental Protection (FDEP) conducted a statewide assessment of our public drinking system to identify any sources of contamination in the vicinity of our wells and our surface water intake.The assessment found there were 27 unique potential sources of contamination identifi ed for our system.
The susceptibility of contamination for our ground water wells was low. The susceptibility of contamination for our surface water system was considered to be high due to many potential sources of contamination present in the assessment area. The complete assessment results are available on the FDEP Source Water Assessment and Protection Program website at www.dep.state.fl .us/swapp or they can be obtained from Lee County Utilities at 239-694-4038.
Additional InformationAdditional Information
HOW TO READ THE TABLES
LCU owns and operates fi ve (5) water treatment plants. LCU has a combined distribution system which allows us the ability to ensure you safe and reliable water at all times. This fl exibility allows us to shut down water treatment plants for annual maintenance or during emergency situa-tions.
In the following tables, samples taken in the distribution system represent all fi ve water treatment plants and include Microbiological Contam-inants, Stage 1 & 2 Disinfectants & Disinfection By-Products, and Lead & Copper (Tap Water) unless otherwise noted. Sampling taken directly from a water treatment plant will be listed individually and include Radioactive Contaminants and Inorganic Contaminants.
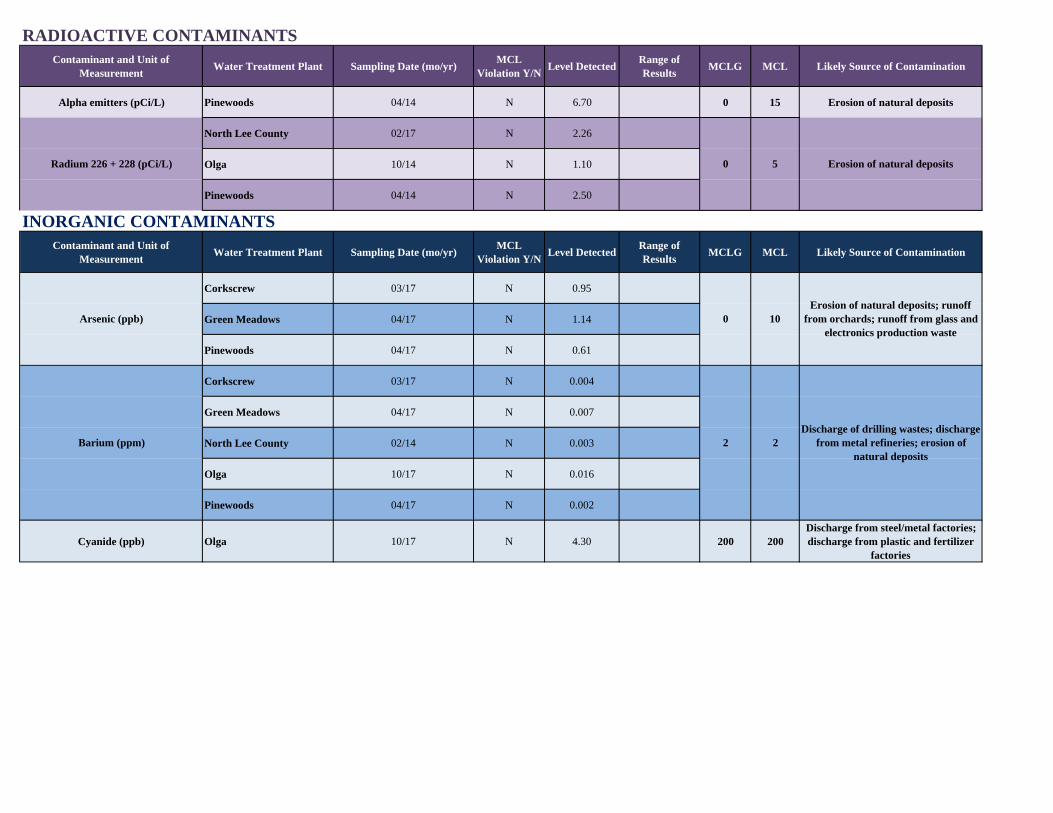
RADIOACTIVE CONTAMINANTSContaminant and Unit of
Measurement Water Treatment Plant Sampling Date (mo/yr) MCLViolation Y/N Level Detected Range of
Results MCLG MCL Likely Source of Contamination
Alpha emitters (pCi/L) Pinewoods 04/14 N 6.70 0 15 Erosion of natural deposits
North Lee County 02/17 N 2.26
Olga 10/14 N 1.10
Pinewoods 04/14 N 2.50
INORGANIC CONTAMINANTSContaminant and Unit of
Measurement Water Treatment Plant Sampling Date (mo/yr) MCLViolation Y/N Level Detected Range of
Results MCLG MCL Likely Source of Contamination
Corkscrew 03/17 N 0.95
Green Meadows 04/17 N 1.14
Pinewoods 04/17 N 0.61
Corkscrew 03/17 N 0.004
Green Meadows 04/17 N 0.007
North Lee County 02/14 N 0.003
Olga 10/17 N 0.016
Pinewoods 04/17 N 0.002
Cyanide (ppb) Olga 10/17 N 4.30 200 200Discharge from steel/metal factories; discharge from plastic and fertilizer
factories
Barium (ppm) 2 2Discharge of drilling wastes; discharge
from metal refineries; erosion of natural deposits
Erosion of natural depositsRadium 226 + 228 (pCi/L) 0 5
Arsenic (ppb) 0 10Erosion of natural deposits; runoff
from orchards; runoff from glass and electronics production waste

INORGANIC CONTAMINANTSContaminant and Unit of
Measurement Water Treatment Plant Sampling Date (mo/yr) MCL Violation Y/N Level Detected Range of
Results MCLG MCL Likely Source of Contamination
Corkscrew 1/17 - 12/17 N 0.56 0.16-0.56
Green Meadows 04/17 N 0.20
North Lee County 1/17 - 12/17 N 0.77 0.56 - 0.77
Olga 1/17 - 5/17 & 7/17 - 12/17 N 0.41 ND - 0.41
Pinewoods 1/17 - 12/17 N 0.64 0.19 - 0.64
Nickel (ppb) Olga 10/17 N 1.13 N/A 100 Pollution from mining and refining operations. Natural occurrence in soil
Corkscrew 10/17 N 0.035
Green Meadows 04/17 N 0.021
North Lee County 02/17 N 0.031
Olga 10/17 N 0.99
Pinewoods 04/17 N 0.032
Corkscrew 10/17 N 0.017
North Lee County 02/17 N 0.007
Olga 10/17 N 0.113
10 10Runoff from fertilizer use; leaching from septic tanks, sewage; erosion of
natural deposits
Nitrite (as Nitrogen) (ppm) 1 1Runoff from fertilizer use; leaching from septic tanks, sewage; erosion of
natural deposits
Nitrate (as Nitrogen) (ppm)
Fluoride (ppm) 4 4.0
Erosion of natural deposits; discharge from fertilizer and aluminum
factories. Water additive which promotes strong teeth when at the
optimum level of 0.7 ppm

INORGANIC CONTAMINANTSContaminant and Unit of
Measurement Water Treatment Plant Sampling Date (mo/yr) MCL Violation Y/N Level Detected Range of
Results MCLG MCL Likely Source of Contamination
Corkscrew 03/17 N 0.94
Green Meadows 04/17 N 3.60
North Lee County 02/17 N 1.42
Pinewoods 04/17 N 0.54
Corkscrew 03/17 N 84.80
Green Meadows 04/17 N 34.7
North Lee County 02/14 N 66.6
Olga 10/17 N 33.9
Pinewoods 04/17 N 59.4
SYNTHETIC ORGANIC CONTAMINANTS including PESTICIDES & HERBICIDESContaminant and Unit of
Measurement Water Treatment Plant Sampling Date (mo/yr) MCL Violation Y/N Level Detected Range of
Results MCLG MCL Likely Source of Contamination
2,4-D (ppb) Corkscrew 09/17 N 0.05
Green Meadows 03/17 N 0.063 ND-0.063
Olga 11/17 N 0.13
Contaminant and Unit of Measurement Sampling Date (mo/yr) AL Violation Y/N 90th
Percentile
No. of Sampling Sites Exceeding the
AL
MCLG AL
Copper (tap water)(ppm) 8/16 N 0.05 0 1.3 1.3
Lead (tap water)(ppb) 8/16 N 1.4 0 0 15
LEAD & COPPER (TAP WATER)
Likely Source of Contamination
Corrosion of household plumbing systems; erosion of natural deposits; leaching from wood
preservatives
Corrosion of household plumbing systems; erosion of natural deposits
Selenium (ppb) 50 50Discharge from petroleum and metal
refineries; erosion of natural deposits; discharge from mines
Sodium (ppm) N/A 160 Salt water intrusion; leaching from soil
Runoff from herbicide used on row crops 70 70

Contaminant and Unit of Measurement
Sampling Date (mo/yr)
MCL Violation Y/N
The Highest Single Measurement
The Lowest Monthly
Percentage of Samples Meeting
Regulatory Limits
MCLG MCL Likely Source of Contamination
Turbidity (NTU) (Olga WTP) 1/17 - 5/17 & 7/17 - 12/17 N 0.30 100% N/A TT Soil runoff
Disinfectant and Unit of Sampling Date MRDL Violation Level Detected Range of Results MRDLG MRDL Likely Source of ContaminationChlorine & Chloramines
(ppm)1/17 - 12/17 N 3.4 0-5.7 4 4.0 Water additive used to control microbes
Contaminant and Unit of Measurement
Sampling Date (mo/yr) TT Violation Y/N Level Detected Range of Monthly
Removal Ratios MCLG MCL Likely Source of Contamination
Total organic carbon (TOC) [Olga WTP]
1/17 - 5/17 & 7/17 - 12/17 N 2.01 1.60 - 3.08 N/A TT Naturally present in the environment
Contaminant and Unit of Sampling Date MCL Violation Level Detected Range of Results MCLG MCL Likely Source of ContaminationHaloacetic Acids
(HAA5)(ppb)1/17, 4/17, 7/17,
& 10/17 N 19.3 1.2 - 22 N/A 60 By-product of drinking water disinfection
Total trihalomethanes (TTHM)(ppb)
1/17, 4/17, 7/17, & 10/17 N 28.1 0.9 - 39.6 N/A 80 By-product of drinking water disinfection
STAGE 1 DISINFECTANTS & DISINFECTION BY-PRODUCTS
Note TOC: The monthly TOC removal ratio is the ratio between the actual TOC removal and the required TOC removal.
STAGE 2 DISINFECTANTS & DISINFECTION BY-PRODUCTS
MICROBIOLOGICAL CONTAMINANTS
Note Turbidity: The result in the lowest monthly percentage column is the lowest monthly percentage of samples reported in the Monthly Operating Report meeting the required turbidity limits.