Embed Size (px)
Citation preview

J
}
IJ
TK1425.58A23no.508
PRELIMINARY ASSESSMENT OF ACCESS
BY SPAWNING SALMON INTO
PORTAGE CREEK AND INDIAN RIVER
BY
E. WOODY TRIHEY, P.E.
P.O. BOX 10-1774
ANCHORAGE, ALASKA 99511
PREPARED FOR
ALASKA POWER AUTHORITY
ANCHORAGE, ALASKA"'1
MARCH 1983
LJIU·
1

[
[
[
[
[
[
[
CQ
E
Bob[
o[
[
L[
~
-~
Preliminary Assessment of Access
by Spawning Salmon into
Portage Creek and Indian River
by
E. Woody Trihey, P.E.
P. O. Box 10-1774
Anchorage, Alaska 99511
Prepared for
Alaska Power Authority
Anchorage, Alaska
March 1983
ARLISAlaska Resources
Library & InfonnatlOn ServIcesAnchorage, Alaska
1"kI Lj).5
. ~~11-1.3
~o, 50'b

ACKNm~LEOGMENTS
This report is based on field data obtained during the summer and
Barrett and Christopher Estes, Alaska Department of Fish and Game,
fall of 1982 by the Alaska Department of Fish and Game's Su-Hydro
Editorial assistance with the
organizational structure and format was provided by Linda Perry Dwight.
Aquatic Studies Team and R&M Consultants, Inc. Graphics were prepared
by Sally Donovan, Alaska Department of Fish and Game, Su-Hydro Aquatic
Studies Team. Technical reviews were provided by Larry Rundquist,
Woodward-Clyde Consul tants; Stephen Bredthauer and Jeff Coffi n, R&M
Consultants, Inc.; Charles "Mike" Prewitt and Mike Kelly, University of
Alaska, Arctic Environmental Information and Data Center; and Bruce
Su-Hydro Aquatic Studies Team.
[
[
[
['
[
[
[
[
[
G
B[j
CF'"I··C
[
bl'.0C
E
I'....VI'COMoooLC)LC)I'MM ARLIS
Alaska ResourcesLibrary & Infonmltlon SenrlOes
Anchorage, Alaska
i

[
[ CONTENTS
[
[ Acknowledgments
Page
i
[ Summary 1
[Introduction ••••••••••••••••••••••••••••••••••••••••••••••••••• 0. 3
[
••••••• -••••••••••••••••• 8 ••••••••••••••••••••••••• 00
••••••••• 0-. eo ••••••• 0 ••••••• 0' ••••••••••••••• 0 e •••••• 0 •••••
c6
Methods
Field Work
Analysis
••••••••••••• e- •••••• e-. 0 • 0 •• 0 0 ••••• _••••••••• 0 •••• CI 0
7
7
8
Indian River •••••••.••••.•...•••••••••••••••...•.•.••...•••.
•••••••••••••••••••••••••• 0 •••••••••••••••••••-.0 ••••••••••
Preproject Access
Postproject Access
55
55
58
11
11
32
•••••• •••••••• e ••••••••••••••••••••••••• _0 ••
• ........ e- •••••••••••• eo ••••••••• ••••••••••••• ".Portage Creek
Results
Discussion
c
c
oB
[J
c Literature Cited •••••••••••••••••• e- •••••••••••••••••••••••••••••• 63
c Appendix A-I
[
BE

[
r.'L~
[
[ ~
[
[
[
Ct[J
tobC[
C[
r~L
[
SUMMARY
Indian River and Portage Creek are the most important tributaries used
by spawning salmon in the Susitna River upstream from Talkeetna. The
mid-summer discharge of the Susitna River will be reduced by operation
of the proposed Susitna hydroelectric project. There is concern that
resulting shallow depths or high velocities at the mouths of these
tributaries could prevent adult salmon from accessing traditional salmon
habitats. An analysis was conducted of pre- and postproject depths and
velocities, which govern access by adult salmon into Indian River and
Portage Creek, and compared with recommended passage criteria for adult
salmon obtained from the literature. The analysis is based on field
data collected during the 1982 field season by R&M Consultants, Inc.
(R&M) and the Alaska Department of Fi sh and Game (ADF&G), Su-Hydro
Aquatic Studies Team.
Entrance conditions at the mouths of Portage Creek and Indian River were
evaluated for mainstem discharges at Gold Creek of 8,000, 13,400, 21,500
.and 34,500 cfs, which represent different operating scenarios. The
analysis indicates that access into Portage Creek and Indian River by
spawning salmon has not been a problem, and that it is unlikely to
become a problem were the proposed Susitna hydroelectric project
operated as outlined in Chapter 2 of the draft Exhibit E (Acres American
Incorporated 1982).
It is quite likely that naturally occurring tributary flows will alter
streambed gradients near the mouths of Portage Creek and Indian River as
-1-

[
[
[
[
[
[
[
oBoBoC
G
otCr.:'..LJ
[
a direct result of reduced mid-summer discharge in the Susitna River.
The downcutting, which is not expected to extend any great distance up
the tributaries, is suspected to establish new entrance conditions
(depths and velocities) at the mouths of these streams that would not be
much different from existing conditions. In the event that Portage
Creek or Indian River did not downcut their streambed, naturally
occurring tributary flows are expected to provide adequate depths for
adult salmon to enter these streams without the assistance of mainstem
backwater effects. Therefore, it is not e~pected that operation of the
proposed project will have any negative impact on the abil ity of adult
salmon to enter Portage Creek or Indian River during the spawning
season. A discussion of the rationale supporting these statements is
provided in later sections of this paper.
-2-

[
[
[
[
[
[
[
C
BUBoCfe"
lJ
[
C[
C
E
INTRODUCTION
The proposed Susitna hydroelectric project will alter the existing
streamflow, sediment, and thermal regimes of the Susitna River. The
project would reduce streamflows at Gold Creek during summer and
increase them during winter. Suspended sediment, turbidity, and water
temperatures are expected to follow similar patterns. Natural flows for
the Susitna River at the Gold Creek stream gage conunonly range between
20,000 and 30,000 cfs during June, July, and August (~&M Consultants,~ .... ...-.---.....-.......~.~__~.~--...."....,..,..~,.---r__.,...,..' ,.,,-._._~.,., "'_.~,. .,--.,.-.,-,.~ .......- ... .. .... -, . ~-=~'T"'.""",_
Inc. 1982a). Average monthly postproject streamflows at Gold Creek areI;;"----~-~.~;.:.;;~;~-~,~,.._.7"'••<....-'-- ~_~,c•.._ .__ ._~_T•.i__,.........,-,~,~:~.~·;"....... ,.,.,..,,_- "'.,.,'~,...-.'m'.._=~~'""~,~_._".:,:!_, ..,.._..,"',.,...,-_~, •.,":!" ..~.;"'.,•.".v.,~_.~-~~.~ ...,,'r• ..
forecast to be in the range of 7,000 to 11,000 cfs during June, July,.~~..:,<.",- ...-:;;- ... i"-""-~ ~"
early August. A controlled flow of no less -than 12,000 cfs from,_,,'__""_''''''-'''__.~ ,~._., .. _,,,.,.,.."""~, .•-.,_'"'":""':.....,~__ ""'==,~,..,.~,...,.-_-:-,=.,.._. ""C' -,• .._""""~lJ::,.,.""""'~ ...~').','...,·...~"""'""~~;~':".,.,..."..",..~'.:_~,"'}. '
m;cf":August to mi d-September is proposed by the Al aska Power Authori ty
(Acres American Incorporated 1982).
. Although some mainstem spawning has been documented, the most
intensively used spawning areas within the Talkeetna to Devil Canyon
reach are located in tributary streams and side sloughs. Indian River
and Portage Creek are the most important tributaries used by spawning
sa1mon ; n the Sus; tna dra; nage upstream from Talkeetna. The comb; ned
escapements of chinook and chum salmon into these two tributaries
exceeds the total escapement of these species into all other tributaries
entering the Susitna River above Talkeetna (ADF&G 1981, 1983b).
Presently, mid-summer streamflows in the Susitna River are large enough
to cause a backwater effect at the mouth of Portage Creek and Indian
-3-

[
[
[
[
[
[
[
Ct[j
B0:;;CB[
C[
CE
River. The backwater effect reduces velocity and increases depth at the
mouths of these tributaries and is generally thought to facilitate
access for migrating fish.
The proposed project flows would reduce mid-summer water surface
elevations of the Susitna River near Portage Creek and Indian River
approximately 3 feet below present levels. Because of the magnitude of
this anticipated decrease in mainstem water surface elevations during
the salmon inmigration and spawning period, there is concern regarding
the ability of adult salmon to enter Portage Creek and Indian River.
The purpose of this paper is to present a preliminary analysis of the
influence that mainstem discharge has on access to spawning areas in
Portage Creek and Indian River. The paper has been prepared at the
request of the Alaska Power Authority and in cooperation with the Alaska
Department of Fish and Gamel s Su-Hydro Aquatic Studies Team and R&M
Consul tants, Inc.
Insufficient data are available to provide a rigorous comparison between
pre- and postproject hydraulic conditions at the mouths of Portage Creek
and Indian River. However, it is possible. to estimate mid-channel
depths and velocities at the mouths of these tributaries, in the absence
of mainstem backwater effects, and then compare these values with
passage criteria for adult salmon available in the literature. Used in
this manner, the existing data base is adequate to determine whether or
not mainstem backwater effects are necessary in order for adult salmon
to enter Portage Creek or Indian River.
-4-

[
[
[
[
[r
[r
!'!-
GBb
ccr-::~
[
~
Lr~6
E
By assuming that uniform flow occurs in the lower reaches of these
tributaries, the data base is also sufficient to support a preliminary
evaluation of stream channel stability and to determine whether or not
naturally occurring tributary flows appear adequate to provide for the
passage of adult salmon into Portage Creek or Indian River in the event
that their existing streambed elevations change.
Several hydraul ic terms and equations are used in this report that may
warrant further explanation than is presented in the Methods or Results
sections. An appendix has been prepared to provide definitions for the
various types of open channel flow mentioned in the report and to
explain how Manning l s equation and Shield l s criteria were used in the
analysis. These explanations are based upon the author l s general
knowledge of ri ver mechani cs or were extracted from 1ecture notes
previously prepared by the author while serving as training officer for
the U.S. Fish and Wildlife Service1s Cooperative Instream Flow Service
Group. A list of relevant text books follows the appendix for those
interested in pursuing the concepts further.
-5-

rL~
[
cr[
[
[
oooBoCQ
[
C
C
LE
METHODS
Field Work
Cross section and streambed profile surveys were completed during the
1982 field season by R&M at the mouths of Portage Creek and Indian
River. Each confluence area is described by three mainstem cross
sections, a fourth cross section across the mouth of the tributary, and
a streambed and water surface profile for the tributary, which extends
800 to 1,000 feet upstream from the tributary mouth (R&M Consultants,
Inc. 1982b).
ADF&G personnel installed staff gages at mainstem river cross sections
upstream and downstream from each tributary and periodically recorded
the mainstem water surface elevation (WSEL) throughout the 1982 open
water field season (ADF&G 1983a). The timing of the arrival of each
species of adult salmon in Indian River and Portage Creek was
established through aerial and ground surveys (ADF&G 1983b).
In addition, a partial record of daily streamflows was obtained for both
tributaries. A pressure transducer was installed by the author in the
streambed of each tributary and connected to a mi11i-volt recorder to
obtain a continuous record of water depth. Periodic streamflow
measurements and gage height readings were obtained by R&M to develop
preliminary discharge curves for Portage Creek and Indian River. These
rating curves and the WSEL traces from the pressure transducers were
-7-

[
[
[
[
"
~~
---J
""
]-"
~
...:::J
~
::;j
~
~
---.JI
-~
d
-icii
.....;
used by ADF&G to determine average daily streamflows for both streams
from August 9 through October 22, 1983 (ADF&G 1983a).
Analysis
Cross section and streambed profiles were plotted to describe the
channel geometry near the mouth of each tributary. Mainstem water
surface elevations and discharge on the date of the cross section survey
were noted.
The observed mainstem water surface elevations at each staff ga.ge site
were tabulated, and stage-discharge curves were developed for each gage
by plotting the observed water surface elevations against the
corresponding average daily discharge of the Susitna River at Gold
Creek. These plots were compared with simulated stage discharge curves
developed for the same mainstem river cross sections using results from
a 1981 HEC-2 analysis (R&M Consultants, Inc. and Acres American Inc.
1982) • When making th is compa ri son, more credence was given to the
field observations than to the predicted water surface elevations.
However, the simulated WSEL data from the HEC-2 analysis were useful for
extending the empirical curves beyond observed values.
Mainstem water surface elevations were determined at each staff gage
location directly from the stage-discharge curves for mainstem flows at
Gold Creek between 8,000 and 34,500 cfs. The slope of the mainstem
water surface profile was assumed constant between the the staff gage
locations upstream and downstream of the tributary mouth. The water
-8-

'"1
..-J
'1
_J
"1
.--'
~
---'
~
'1
r-,
'1.!.
J
.-,1\~
~.;:j.u
~
D
o[
Q
[
C
E
surface elevations of the mainstem directly opposite the mouths of the
tributaries were determined by linear interpolation. Mainstem water
surface el evations correspondi ng to Gol d Creek di scharges of 8,000,
13,400, 21,500 and 34,500 cfs were plotted for comparison with surveyed
streambed and water surface profiles of the tributaries.
Characteristic mid-summer tributary flows were estimated on the basis of
partial streamflow records for 1982 and a comparison of 1982 precipita
tion data with the historic record available for Talkeetna, Alaska.
Unit discharge (cfs per foot of channel width) relationships were
determined for each tributary as a function of total streamflow. - These
relationships were used throughout the analysis to facil itate computa
tional procedures and to provide pre- and postproject estimates of the
hydraulic conditions that would govern access by salmon into the
tributaries. Representative mid-channel depths and velocities were
calculated as functions of unit discharge based on fully developed
uniform flow existing in a natural channel. Because this is unlikely to
occur, a conscious effort was made throughout the analysis to evaluate
plausible worst case entrance conditions.
It was assumed that postproject mainstem water surface elevations would
not cause a backwater effect in the mouth of Portage Creek or Indian
River. Although this assumption may not be completely valid, it results
in a more critical evaluation of postproject entrance conditions for
adult salmon attempting to enter these tributaries. By assuming that a
backwater effect does not exist, shallower depths and higher velocities
-9-

[
[
[
[
[
[
[
nooBoD
C[
[
CCE
are calculated for postproject entrance conditions than would actually
exist. Thus, if it is determined that adult spawners could migrate
upstream given the calculated depths and velocities in the absence of
backwater effects, they shoul d have less difficul ty in passing through
actual postproject conditions encountered.
A somewhat similar approach was taken with regard to evaluating
streambed stability and estimating the resultant (postproject) slope of
the streambed upstream from the mouth of the tributary. Because of a
limited data base and the inability to calculate specific depths and
velocities in the tributaries, envelope curves representing populations
of plausible depths and velocities were generated for use in evaluating
entrance conditions for migrating salmon and the stability of various
streambed particle sizes. A postproject streambed slope was selected
for use in the analysis that might never actually exist, but which is
thought to represent a plausible worst case entrance condition for
upstream migrants.
Much of the discussion and the conclusions presented in the latter
portion of thi s report are based on the author's experience and di rect
observation. Corroborative field data to support the hydraulic analysis
presented in this report are limited. Continuing field work and
analysis could be undertaken to substantiate various figures and
estimates contained in this report. Although this work might result in
different numerical values being calculated, it is not likely that the
concluding statements in this report regarding project effects on access
by adult salmon into Portage Creek or Indian River would be altered.
-10-

[e_
L[ ;
-"
[
[
[
[
CoC
R
oon
lJ
[
b[
Hu
c···.---
-'
RESULTS
Portage Creek
A planimetric sketch of the Portage Creek-Susitna River confluence is
provided as Figure 1. Field observations indicate that Portage Creek
flows within a well-defined single channel nearly rectangular in shape
throughout much of its length. Approximately 300 feet above its
confluence with the Susitna River, Portage Creek divides into two
channels, which cross alluvial outwash and enter the Susitna River at
River Mile 148.9
The mainstem study reach extends 1,100 feet between LRX-61 and LRX-62;
LRX-61 is 710 feet downstream and LRX-62 is 390 feet upstream of the
center line of Portage Creek. The study area also includes an BOO-foot
reach of Portage Creek immediately upstream from its mouth. Staff gages
were installed on the north bank of the Susitna River at LRX-61 and
LRX-62, and a stage recorder was installed on the east bank of Portage
Creek approximately 550 feet above its mouth.
Cross section data indicate that this reach of the mainstem Susitna
River is approximately 300 feet wide and 15 feet deep during a typical
summer discharge of 21,500 cfs (Figure 2). Stage discharge curves
developed for LRX-61 and LRX-~2 from 1982 staff gage data (ADF&G 1983a)
and a 1981 HEC-2 analysis (R&M Consultants, Inc. and Acres American Inc.
1982) indicate that the response of mainstem water surface elevations to
incremental changes in discharge is well defined in this reach for a
range of flows between 8,000 cfs and 34,000 cfs (Figure 3). Results
-11-

[
[
[
[
r.-'lJ
[
[
CD
CBoC
C[
[
[
C[
from the HEC-2 analysis were used as a guide to extend the stage
discharge curves beyond the upper limit of observed data.
Table 1. Water Surface Elevations of the Susitna River at the mouth ofPortage Creek for selected mainstem streamflows at Gold Creek.
Mainstem Mainstem Mainstem MainstemDischarge WSEL WSEL WSEL
Gold Creek LRX-61 Portage Creek LRX-62(cfsL- (ft) (ft) .J..tt)
8,000 832.4 833.6 834.312,000 833.7 835.1 835.913,400 834.2 835.7 836.516,000 834.8 836.2 837.120,000 835.6 837.1 838.021,500 836.1 837.6 838.424,000 836.5 837.9 838.828,000 837.2 838.7 839.632,000 838.0 839.4 840.334,500 838.5 840.0 840.8
Mainstem WSEL. Mainstem water surface elevations were determined above
and below the mouth of Portage Creek from the stage discharge curves for
mainstem streamflows between 8,000 and 34,500 cfs (Table 1). The slope
of the mainstem water surface profile between the staff gages at LRX-61
and LRX-62 was assumed constant and water surface elevations of the
mainstem opposite the mouth of Portage Creek were calculated. Mainstem
water surface elevations were determined to range from 833.6 to 840.0
feet as the mainstem discharge at Gold Creek increased from 8,000 to
34,500 cfs. Mainstem water surface profiles across the mouth of Portage
Creek were plotted for discharges of 8,000, 13,400, 21,500 and 34,500
cfs (Figure 4).
-12-

r-J ~. ~ [T""] ~ L".!.,] rr--.J C.,.,., "..J LJ"J IT"] C.JJ L":J c-J ,.---,~ lJ c-J ~ r--l
\h,.. , ii"..i l .J ~ , d l J
SCALE: 1"5 &OOft.
6 STAFF GAGE~ STREAM6AGE RECORDER
II CLEARWATER
sUS/rNA....,.:
I.....WI
Figure 1. Planemetric sketch of the Mouth of Portage Creek.(Adopted from 1:6000 scale blueline 'prints, R&M Consultants,Inc., 1980)

CROSS-SECTION NUMBER 81RM 148.73/ THALWEG ELEVATION 819.5
(Lookin~ Down River)
850
810Iii iii i
820Iii , , , i
100
Mainstem River Cross Sections near the mouth of PortageCreek. (Adapted from R&M Consultants, Inc. and AcresAmerican Inc. 1982~14-
200 300 400 500 800
HORIZONTAL DISTANCE (FEET)
CROSS-SECTION NUMBER 62R'M 148.94 I THALWEG ELEVATION 822.3
(Looking Down River)
100 200 300 400 500
HORIZONTAL DISTANCE (FEET)o
o 100
Figure 2.
860
- 850I-1&.11&.1I&--z2 840 I , WSEL =838.4 2It~OO ehl-e(
>1&.1..J1&.1
830
- 840I-1&.1 I I WSEL= 836.1 21.~00ch1&.1I&--Zo 830l-e(>1&.1..J1&.1 820
Fcc,
b
[
E[
[j
E
r-l
l~
lJ
C
B[
B[1
.J
C

..,
-'
1·
"'1
-ji
'I
oJ
0'"
_.~
-••u.
oIt)
00t .
..JlIJen~-
LRX - 61RM 148.73
• 1982 Observations
o HEC-2 Forecast
2OPOO
at Gold Creek In eft,000
2 , , , , , iii , , , , , i •~=~
:~
........i
5OPOO
..'"
"
20.000IOPOO5.,000
-15-
Malnstem Discharge at Gold Cree~ In cfs
Comparison between observed and forecast mainstem water·surface elevations near the mouth of Portage Creek.(Adapted from R&M Consultants, Inc. and Acres AmericanInc. 1982, ADF&G 1983a.)
LRX-62RM 148.94
• 1982 Observations
o HEC-2 Forecast
2,000
Figure 3.
It
10
~ 9
~8
8 1rt>006t
~5en~-4
3 , iii' iii iii iii i
D~~
oQ
§
lE[
CE

rn c:::::J ....---, (T'""j ------- rr'"""""l. iIT:-.] L.", j co rc=J CD i,
J ] j .J J .Jl. ...J I, " . J L..,.I,i .J)
"
1100
LRX'ezRM 1.1.••
fLOW
14,500
11,'0011,400-1,000 ....,
1000900800700
THALWEG ELEVATION8:23.8
RM 148.86
600
WSEL
.---.140.1:'" ~.............•~....-- 1.1 4. /. '~.. .-.----••••"\:.!!... ••••••••••••••••••••••-................ I't.'
154.'
CROSS·SECTION AT THEMOUTH OF PORTAGE CREEK
lED ELEVATION 835
RIVER --
csoo400300
OVERFLOW CHANNELNO PASSAGE INTOPORTAGE CREEK
UNLESS WSEL >843
..... sus/rNA
STREAMBED PROFILESUSITNA RIV ER
200
PLOW'4,100 . _ •••--.-
11,100 --••-.-----.-•••-.-•••••-II, 400 ••••- •••••••••••••••••••••••••••••••-_ - •••••••-" 000 .••••••••••••_••••••••••_•••_••_ ••••_•••••••••••••••••••••••••••__•••_ ••••••••••••••••••••••••••••••••••••••••••••••••••••••••••••••••
100
WtEL
-"I.I
-1.1.1-114.1-111..4
o
LItX-tlRM 141.n
8~0
tLLILLILL.
Z--Zo~~821..JILLI
HORI~ONTAL DISTANCE IN FEET
Figure 4. Streambed and water surface profiles of the Susitna River at the Mouth ofPortage Creek.
..

[
[
[
[
[
[
[
C
6C
R
o6E[
[
[
UE
Mainstem water surface elevations were also compared with surveyed
streambed and water surface profiles for Portage Creek (Figure 5). A
representative streambed elevation for the mouth of Portage Creek is 835
feet. Mainstem water surface elevations opposite the mouth of Portage
Creek can be shown to equal or exceed 835 feet for discharges in excess
of 12,000 cfs at Gold Creek.
Portage Creek Hydraulics. The total discharge of a stream divided by
the representative channel width is called the unit discharge (q). The
concept of a unit discharge is often used when applying hydraulic
formulas to open channel flow to facilitate computational procedures.
This concept is most applicable to straight, rectangular channels with a
known top wi dth •.
Field observations indicate that the lower reach of Portage Creek is
relatively straight and nearly rectangular in cross section.
Approximately 300 feet downstream of the gage site, Portage Creek
divides into two channels, which also are nearly rectangular in cross
section. Field measurements were obtained near the Portage Creek stream
gage site that indicate the degree to which top width varies with
discharge (Table 2). Based on these data and observations, the
relationship between total discharge and unit discharge was estimated
for Portage Creek (Figure 6).
-18-

rn r: r' teJ (".,JJ rJ::J Dl L,,,,, "" ) IT""] c:J ,L"LJ [,_,.,8 ,~~ ~ r:J :-J c=J ,--.,l l ) .. I
I .. REACH GRADIENT .02 hilt _I... REACH GRADIENT .004 Hlft •
---------..
ESTIMATED WATERSURFACE PROFILE
Q -400ch
STREAMBED PROFILEPORTAGE CREEK
9+50DISCHARGE TRANSECT
ANDSTREAM GAGE
PORTAGE CREEKOBSERVED WATERSURFACE PROFI LEO.lie"860 _
OBSERVED WSEL137.18 il,lOOcfa
~iY'I9" WUL PLOWI- 140
1I4Q.O
L&JLaJ liT••
LL 11lI."
Z III.'
I 830.,..Z\001_
~> 820L&J.JLIJ
CROSS-SECTION OF SUSITNAOFF MOUTH OF PORTAGE CREEK
810-f ' RM 148.88
HORIZONTAL DISTANCE IN FEET
Figure 5. Existing streambed profile of Portage Creek and the adjoining cross section forthe Susitna River at RM 148.86.

-,
-,
,
1
""l
"1
-1
--'
'~
-J
1j
1J
Table 2. Hydraulic parameters for Portage Creek.
Top X-Sect Mid-Chnl Hydraul ic AverageDate Discharge Width Area Velocity Depth Velocity1982 (cfs) (ft) (ft2) (fps) (ft) (fps)
Oct 6 434 84 185 2.3-3.3 2.2 2.3
Sep 4 632 84 215 2.5-4.0 2.6 2.9
Jul 8 1188 94 272 3.3-5.9 2.9 4.4
R&M Consultants, Inc., 1982, unpublished streamflow data.
30 • i,~
'1~~
:J
1~J
C1
j
~
:J
---.....•-~ 20
LLt(!)a::c(:x:otJ)
o 10
t-z·~
,/
/',/
/.//'
./
,///
c;
.::i
..;;;}
...J
~.
~
oIii Io 1000 2000 3000
PORTAGE CREEK STREAMFLOW (cfa)
Figure 6. Relationship between unit discharge and total discharge forthe single channel reach of Portage Creek above its mouth •
-20-

..,
r-,
rr"'"
.-J
--'
=>
...,LLJ
c
Streambed and water surface profiles for Portage Creek (Figure 5) show
that a noticeable change in gradient occurs near station 700. Given the
relatively uniform width for this reach of Portage Creek, the much
steeper gradient downstream of station 700 can be expected to cause
higher velocities and shallower depths downstream of station 700 than
occur upstream of this location. (Hydraulic calculations indicate that
for streamflows in excess of 650 cfs (7.5 cfs/ft) flow passes from
subcritical to supercritical near station 700) •
Depths and velocities calculated to occur near station 700 and in the
adjacent upstream and downstream reach are presented in Figure 7 as
functions of unit discharge. Depths and velocities upstream of station
70n (represented by the dotted curve) are not considered a potential
impediment to upstream migrants, which could pass through the adjacent
downstream reach. The dashed line represents depths and velocities near
station 700; the solid 1ine depicts depths and veloci ties for ful
ly-developed uniform flow downstream of station 700.
-21-
represented by the sol id 1ine can be expected to occur anywhere that
mainstem backwater effects are not present between station 700 and the
It is likely that streambed irregularities would prohibit the exact
depths and velocities depicted by these curves from being attained.
These curves do, however, describe a plausible envelope of theoretical
depths and velocities forecast for an BOO-foot tributary reach
immediately upstream from the mouth of Portage Creek. The occurrence of
depths and velocities depicted by the dashed line will be restricted to
A
LJ
n
U
t[
U
E
the immediate vicinity of station 700. Depths and vel oci ties

rn CJ r-J [T""J c---n CJ":"J ~ c=J tH: . ..1 c-J crJ c:J c-J r-J ;~ c--1 .:--l c-J c-J
• • • • •• ABOVE STATION 700- - - - NEAR STATION 700
BELOW STATION 700
12 • I
10 20 30
Streamflow per unit widthcfs/ft
O~o". ..00.; •••
'11' •~ .•
Oil< •o •" .
0,'. •••
3 i • :A 10••
~O. •O'
1-".,."'.
2 0. ... - 8"~ ...- C'.!:- •
c: "'. >-- o. -• ,9-(,)-Q. "'. 0
CD •• CD0 • >• 6
I ,Nto)I
IO~ i 4,0 10 20 30
Streamflow per unit widthch/ft
2 .0
Figure 7. Depths and velocities above the mouth of Portage Creek calculatedas functions of unit discharge in the absence of mainstem backwater effects.

[r'L~
[
[
l'~
[
[
C
E[
BCC
C[
[fl
[
E
mouth of Portage Creek. Mainstem backwater effects would reduce the
velocities and increase the depths depicted by this curve. Inasmuch as
the depths and velocities defined by the solid line in Figure 7
represent plausible worst case entrance conditions for adult salmon
entering Portage Creek, these curves were used as the principal
indicators of access for the existing channel geometry.
The 1982 streamflow data for Portage Creek suggest that typical
streamflows during the June through August period are in the range of
500 to 800 cfs (ADF&G 1983a). Review of these data in association with
1982 and long-term precipitation data for Talkeetna suggests that 300
cfs might be an abnormally low sUlTD11er streamflow for Portage Creek.
This figure was used to determine entrance' depths associated with a
probable "worst case" low flow for Portage Creek.
Field observations and cross section data indicate that a stream flow of
300 cfs in Portage Creek would result in an effective top width of
approximately 75 feet near the stream gage and approximately 60 feet for
the primary channel at the mouth (Table 2, and R&M Consultants, Inc.
1982b). Within the single channel reach of Portage Creek near the
stream gage site, a total discharge of 300 cfs and top width of 75 feet
is equivalent to a unit discharge of approximately 4 cfs (refer to
Figure 6). For an effective primary channel width of 60 feet at the
mouth of Portage Creek, 300 cfs is equivalent to a discharge per unit
width of 5 cfs/ft. Given existing channel geometry for Portage Creek
and no backwater effect from the Susitna River (Gold Creek flow less
than 12,000 cfs), a discharge of 300 cfs would provide an average depth
-24-

[
[
[
[
r'Li
l~-'
[
C[j
[
CCCF'b
C[
[
[
E
of approximately 0.9 feet and mid-channel velocities of approximately
5.5 fps at the mouth of Portage Creek. The presence of mainstem
backwater effects woul d tend to increase thi s depth and reduce the
velocity.
Mean annual floods for Portage Creek have been estimated to range
between 1,450 and 1,850 cfs (R&M Consultants, Inc. 1982b). The peak
dai ly di scharge recorded duri ng 1982 for Portage Creek was 1,673 cfs
(ADF&G 1983a). This author estimates peak daily streamflows may be as
large as 2,500 to 3,000 cfs (15 to 20 cfs/ft). Streamflows of this
magnitude would likely result in depths near 2 feet and mid-channel
velocities between 8 and 9 fps at the mouth of Portage Creek, were no
mainstem backwater effects present (Figures 6 and 7).
Review of a previous analysis of flow variability (R&M Consultants, Inc.
1981) and the 1982 streamflow data for Portage Creek suggests that the
duration of streamflows of such magnitude would probably be limited to
three days or less. Once Portage Creek streamflows decreased to the 500
to 800 cfs range (6 to 10 cfs/ft), depths should range between 1.0 and
1.5 feet at the mouth of Portage Creek and mid-channel velocities would
be from 6 to 7 fps.
Channel Stability. It is not expected, however, that the streambed
above the mouth of Portage Creek will remain stable (R&M Consultants,
Inc. 1982b). The movement of streambed particles is principally a
function of discharge, reach gradient, and particle size. Threshold
values of incipient motion for various particle sizes were estimated
-25-

[,,~.
[
[
[
[
[~
[
CE[
CCCC[
[
LLE
(Figure 8) as a function of discharge using Shield's criteria and the
depth and velocity curves previously introduced. Application of these
threshold values to the aDO-foot study reach above the mouth of Portage
Creek indicates that a stable channel would exist if the size of the
predominant streambed materials were in the range of 6 to a inches.
These are theoretical values and are somewhat conservative. Particles
in the 5- to 7-inch range would likely be stable in a "seasoned" natural
channel.
Personal observations indicate that streambed particles in the lower
reach of Portage Creek are typically 6 to 7 inches in size, interbedded
among boulders and large gravels. Smaller particle sizes (3 to 5
inches) are fairly common near the mouth of Portage Creek along
streambank margins and in the streambed. The occurrence of smaller
particle sizes near th~ mouth of Portage Creek is attributed to
backwater effects of the mainstem, which reduce the sediment transport
capacity of Portage Creek near its mouth. This hypotheses is, in part,
supported by the flatter slope of the streambed and water surface
profiles at the mouth of Portage Creek (Figure 5), which reflect the
desposition of streambed material at this location.
In the absence of mainstem backwater effects, midchannel velocities and
the associated sediment transport capacity would be expected to increase
near the mouth of Portage Creek. As a result, smaller particle sizes (3
to 5 inches) would be removed and the streambed would degrade. Degra
dation would increase the channel slope, thereby increasing velocities
and allowing even larger particles to be transported. The degradation
-26-

10 ,,---------------i
oIii I
-- -- -- Near Station 700Below Station 700
-27-
10 20 30
Streamflow per unit widthcfs/ft
Streambed particle sizes moved near the mouth ofPortage Creek in the absence of mainstem backwatereffects as a function of unit discharge.
o
2
s..0~
uc:c:
'0 a•>0e•~..•- ....2-...0~
Figure 8.
[
[
L[
[
[
[
oECCCAbj
C[
C[
[j
t

[
[
[
[
[
['
[
CbCC[J
ECC[
loL
process would depend to a large degree on the frequency and duration of
Portage Creek flows in excess of 1,500 cfs and the availability of 6- to
8-inch diameter material within the existing alluvial deposit at the
mouth of Portage Creek.
This author estimates that naturally occurring tributary flow in
association with the proposed regulation of mainstem discharge could
result in Portage Creek downcutting its mouth approximately 3 feet.
Thi sis approximately the same magni tude as the difference forecast
between mainstem water surface el evations associ ated wi th the most
prevalent pre- and postproject summer streamflows. Based on the
assumptions that Portage Creek would downcut approximately 3 feet and
that a moderate amount· of 6- to 8-inch material is present within the
alluvial deposit at the mouth of Portage Creek, the streambed gradient
immediately upstream from the mouth of Portage Creek is expected to
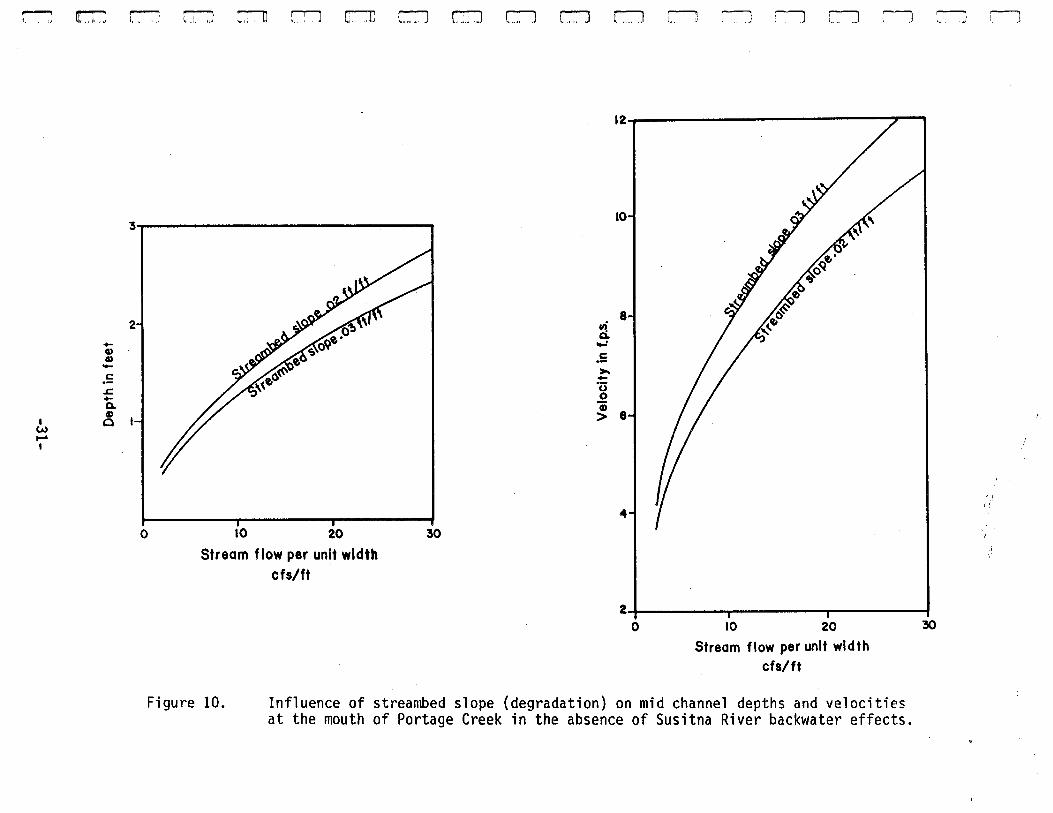
increase from .02 ft/ft to .03 ft/ft (Figure 9). This increased
gradient is forecast to result in slightly shallower depths and
approximately 1 fps increase in the mid-channel velocities above those
that would occur at the mouth of Portage Creek if the streambed were not
to degrade (Fi gu re 10). The predomi nant size of streambed materi a1s
would probably increase from 6 to 7 inches to 7 to 8 inches.
-28-

rn ~ r--'1 CD CJ CJ LJ,:ll CJ IT] CJ r:o L.,J c-l ~ C~ ;~ c-J r:--J LJ., oj 1•. -.-,
850
....LLI 840LLIiL.
z-z0 830-....<>LLI.J
~ 820I
810
ESTIMATED POST-PROJECT WATERSURFACE PROFILE FOR PORTAGE CREEK
PRE-PROJECT STREAMBED ANDWATER SURFACE PROfiLES
~':.!..N!!.E!!.~E!:.8.!!.!- _2~~ !!.I _
j"' MAINSTEM WSEL 853.8 8,000 efa ~.~1o·•• el
f,o.o.0....•...•.•.'.p,O.:.,~. ELEVATION MOUTH a 832.~':' . ·:ts i.("
···t~~~.O" ", , ,.~~... ~.9iIJ.~a~ ..,-r~ ..- POST-PROJECT GRADIENT 0.0311/1'."J~~g:~,s~:.~!1.Q. ,.p.o';.~:6:·~,?i:rrif:.~~~::9",..r -+- UPSTREAM GRADIENT 0.004 It 1ft •CROSS-SECTION OF aU81TNA RIVER ~PRE-PROJECTGRADIENT 0.02 tt/ft-..OFF THE MOUTH OF PORTAGE CREEK
RM 148.18
1'00 200 300 400 500 600
HORIZONTAL DISTANCE IN FEET
700 800 900
Figure 9. Estimated postproject streambed and water surface profiles for Portage Creekadjoining the Sustina River at RM 148.86.
rTJ rr:::J r---:, rT"J ~ O!"JJ rr-JD c::J L:~J c-J en CJJ [""J r-J c-l c--l c-J c-J ~LJ
12 , > I
/iI!'
3010 20
Stream flow per unit widthefslft
2Iii Io
4
10
3010 20
Stream flow per unit widthcfs/ft
o
3, ,
28
.- ~Q)
...,:
Q)- .:.: >.
.s= -- (j
~
0
ICD
'ii
w 0 I > 8
.....I
Fi gure 10. Influence of streambed slope (degradation) on mid channel depths and velocitiesat the mouth of Portage Creek in the absence of Susitna River backwater effects.

[
r[
[
[
[
[
o6CBor6
B[
CLCE
Indian River
Field observations indicate that Indian River is highly braided. A
large alluvial deposit exists at the mouth, which extends approximately
one mile upstream. In the first mile above its mouth two, and in some
reaches three, secondary channels convey streamflow in addition to the
main channel. Indian River enters the Susitna at River Mile 138.7. A
planimetric view of the Susitna-Indian River confluence is presented in
Figure 11. The mainstem study reach extends from LRX-50 (RM 138.48)
upstream 2,165 feet to LRX-51 (RM 138.89). The study area also includes
the 1,000-foot reach of Indian River immediately upstream from its
mouth. Staff gages were installed on the north bank of the Susitna
River at LRX-50 and LRX-51 and a stage recorder was installed on Indian
River approximately one mile above its mouth.
Mainstem cross section data indicate that, for a typical summer dis
charge (21,500 cfs), thi s reach of the Susitna River is approximately
550 feet wide and 10 feet deep (Figure 12). Stage-discharge curves for
LRX-50 and LRX-51 developed from 1982 staff gage data (ADF&G 1983a) and
a 1981 HEC-2 analysis (R&M Consultants, Inc. and Acres American Inc.
1982) indicate that the response of mainstem water surface elevations to
incremental changes in discharge is fairly well defined for a range of
flows between 8,000 and 25,000 cfs (Figure 13). Since results from the
HEC-2 analysis for this reach did not coincide closely with observed
WSEL IS, they were not consi dered as usefu1 for extendi ng the stage
discharge curves beyond the upper limit of observed data for this study
reach as they were at the mouth of Portage Creek. The best fi t
-32-

rn Q"" ,,,,; r--, rJ C':'1 C'JT:J rr-JID c:J [,:,".1 C"J co c::J r---i ~ i~I.. Ii" 1....,. .J l"":l L-:J ~ c-J
IWWI
••)(
II:
""
tJs,r NA
~S
R·
SC ALE: I": !500ft.
~ STAFF GAGEID CLEAR WATER
Figure 11. Planemetric sketch of the Mouth of Indian River(Adopted from 1:6000 scale blueline prints t R&M Consultants t Inc., 1980)

700
700
800
800
200 300 400 500HORIZONTAL DISTANCE (FEET)
200 300 400 500HORIZONTAL DISTANCE(FEET)
Mainstem River Cross Sections near the mouth of IndianRiver. (Adapted from R&M Consultants, Inc. and AcresAmerican Inc. 1982t34-
CROSS-SECTION NUM BER 51RM 138.89/ THALWEG ELEVATION 701.9
(Lookl ng Down RIVlr)
CROSS- SECTION NUMBER 50RM 138.48/ THALWEG ELEVATION 693.5
(Lookin~ Dow n stream)
Figure 12.
730
Iiiiii880"1 lboo
720
IiiIiI890 , I~o
- 710I-IIJ
I \IIJ WSEL 705.3 21,500 cfsI&.-Z0 700
l-e(
>IIJ..JIIJ 890
-I- 720IIJIIJI&.-Z
~ 710..1\ WSEL 709.5 21,500 cisl-e(
>IIJ..JIIJ 700
[
[
[
[
[
[
coEo[J
oC
G
C
CCoE

50POO
50,00020,000_10,0005POO
~poo IOPOO 20,000
Mainltem Dilcharge at Gold Creek in cfa
Comparison between observed and forecast mainstem watersurface elevations near the mouth of Indian River.(Adapted. from R&M Consultants, Inc. and Acres AmericanInc. 1982, ADF&G 1983a.)
-35-
LRX - 51RM 138.89
Figure 13.
• 1982 Observations
2.0~ 0 HEC-2 Forecast
2,000
-~~oo,....I-JWen 3
~
2,000
Malnstem Dischar~e at Gold Creek in cfs
10.0'1 LRX- 50RM 138.48
8.0
8.0-t, • 1982 Observationso HEC-2 Forecast
6.0 I , , iii iii ii" ,
-CDCDu.:5"o,....I
...JW
~ 10.0
2.0.0
30.0
[
[]
[
[
[
[
[;
oE[
ocCG
CCCCE

[
[
[
[
[
[
[
o6ooC
DB[
C
C
C
E
1ine through observed data points at LRX-50 and LRX-51 was simply
extended as a means for estimating mainstem water surface elevations
associated with flows in excess of 25,000 cfs.
Mainstem water surface elevations were determined above and below the
mouth of Indian River from the stage-discharge curves for various
mainstem streamflows and between 8,000 and 34,500 cfs (Table 3). The
Table 3. Water Surface Elevations of the Susitna River at the mouth ofIndian River for selected mainstem streamflows at Gold Creek.
Mainstem Mainstem Mainstem MainstemDischarge WSEL WSEL WSELGold Creek LRX-50 Indian River LRX-51
(cfs) -lliL- (ft) (ft)
8,000 702.0 704.2 707.012,000 703.1 705.1 708.013,400 703.5 705.6 708.216,000 704.2 706.0 708.720,000 705.2 706.8 709.321,500 705.3 707.0 709.524,000 705.5 707.3 709.928,000 705.8 707.6 710.332,000 706.1 708.0 710.934,500 706.3 708.4 711.1
slope of the mainstem water surface profile between the staff gages at
LRX-50 and LRX-51 was assumed constant when calculating mainstem
water surface elevations opposite the mouth of Indian River. Mainstem
water surface elevations at the mouth of Indian River were determined to
-36-

[
[
[
[
[
[
coG
C
G
oD
G
CC'_.-'--
.Ji
C
C[
increase from 704.2 to 708.4 feet as the discharge at Gold Creek
increased from 8,000 to 34,500 cfs. Water surface profi 1es for the
Susitna River across the mouth of Indian River were plotted for
discharges of 8,000, 13,400, 21,500, and 34,500 cfs (Figure 14).
The water surface elevations of the mainstem opposite the mouth of
Indian River were also compared with surveyed streambed and water
surface profiles for Indian River (Figure 15). The streambed elevation
of the mouth of Indian River is approximately 705 feet. Mainstem
discharges at Gold Creek in excess of 12,000 cfs can be shown to provide
mainstem water surface elevations off the mouth of Indian River that
equal or exceed 705 feet (Table 3).
Indian River Hydraulics. Field observations indicate that the lower
reach of Indian River is highly braided. It is also known that
secondary and main channels have often changed following high runoff
periods (P-ers. Conm. B. Barrett, ADF&G; S. Bredthauer, R&M). However,
no data are available which define the relative amount of streamflow
conveyed by these various channels. Therefore, the relationship between
total instantaneous discharge of Indian River and the instantaneous
discharge and top width of its main channel at the mouth (Table 4) was
estimated on the basis of the cross section survey data and field
observations by the author. It appeared to the author that
approximately 90% of the total Indian River flow enters the Susitna
River through its main channel when Indian River streamflows range from
100 to 500 cfs. During high flow periods (2,000 to 2,500 cfs) it was
assumed that only two-thirds of the total flow of Indian River entered
-37-

rn lr:1 r"""J r;7J L, . .,If [jJ["'J t:r=1ID c._",,) Lid C"J CD [,LJ r-J c-J rJ r:J rJ ':-J r-J
701.8
fLOW
14,100 21,500 11,400 -1.000 -
WSt:L
_ •••••__••••••••••••••••••••••_._._•••••_ ••••_.............. 711.''~••••_ •••••••••••••••••••••••••••••••••••••••••••••••••••••••••• 701.5
.. •••••••••••_ •••••••••_ •••:--_•••__••••••••••••••••••••••••••••••••• 701.2•••••••••••••••••••••••_ •••_ ••••••••••••••__•••••__••_............ 707.0
THALWEG ELEVATION881.1
RM 131.88
CROSS - SECTIONMOUTH Of
INDIA" RIVER.ELEVATION 705
f\.OWWSt:L_7Qe.1-705.1-701.5-702.0
720
690
tI&JI&JI.L. 710zzQti 700>,li(.)JOI&J'
LRlC-60RM 131.41
LRlC-11lRM IH.llI
2200
HOR IZONTAL DISTANCE IN FEET
Figure 14. Streambed and water surface profiles of the Susitna River at the Mouth ofIndian River.

r-J Ir::'J CJ rr::-J r:=-:n GlT'J CC""JID c:J ao C"'""J [I] c:::J CJ r-l c--l ~ .:---J rJ r-J
720
...&IJ 710liJIL
Z
z 70001-~
~&IJ.J&IJ 690
OBSERVED WSEL101.' 28,8'00
JULY 24.1982
II REACH GR~DIENT .008 ttlft ~I,HRE~CH GRADI ENT
.05 ftlft INDIAN RI VEA OBSERVEDWATER SURFACE PROFILE
JULY 24,1982fLOW UNKNOWN
ELEVATION 105CROSS- SECTION
MOUTH OF INDIAN RIVERPRESENTED IN fIG;·14
100 200 300 400 500 600 700 800 900 1000 1100 1200 1300 1400
Figure 15.
HORIZONAL DISTANCE IN FEET
Existing streambed profile of Indian River and the adjoining cross section forthe Susitna River at RM 138.66.

-42-
Figure 16. Relationship between unit discharge and total discharge forthe primary channel of Indian River at its mouth.
the Susitna through the main channel. Based on these opinions and the
estimated top widths, a rel ationship between total discharge and uni t
discharge was derived for Indian River (Figure 16).
Table 4. Estimated primary channel streamflows and top widths at themouth of Indian River in response to total Indian Riverdischarge.
30 i I
PrimaryChannelWidth(ft)
60657090
100100
3000
PrimaryChannel
Flow(cfs)
90225450800
13401675
909090806767
PrimaryChannel
{%}
,,/
,//
//
//.,.,""
",""
.,.,"/,"
//
//
0-1 I I Io 1000 2000
INOlAN RIVER STREAMFLOW (eta)
---.......•-u 20--LdC)a::c(:I:oUJ
a 10
I-
Z::>
100250500
100020002500
TotalDischarge
{cfs)
[
c[
[
[
[
[
oBoBooD
C[}
C
ob

[
[
[
[
[
~
[
oBoBoCB[
C[
UE
The streambed and water surface profiles for Indian River presented as
Figure 15 indicate a significant change in gradient occurs at station
850. The much steeper gradient downstream of station 850 will result in
higher stream velocities than exist upstream, particularly when the
mainstem di scharge at Gol d Creek is such that there is no backwater
effect present in the mouth of the tributary.
Depths and velocities calculated to occur in Indian River near its mouth
are presented in Figure 17 as functions of unit discharge. The dashed
1ine depicts depths and velocities expected to occur at station 850.
The sol id line represents theoretical flow conditions downstream of
station 850 without the influence of mainstem backwater, while the
dotted line represents depths and velocities for fully-developed uniform
flow upstream of station 850.
It is expected that streambed irregularities will prevent the exact
depths and velocities represented by the dashed and dotted curves from
being attained in the study reach above station 850. However, these
curves should provide a reasonable estimate of depths and velocities in
riffle and run areas. The instability of the stream channel will likely
prevent the much higher theoretical velocities represented by the solid
line from ever being attained. Velocities in the range of those
represented by the solid line would cause the rapid degradation of the
streambed near station 850, thereby reducing channel slope and velocity
near the mouth (station 780). Inasmuch as the dashed line describes the
more plausible worst case entrance conditions that presently exist at
-43-

rn ~ r:-J rr:J CJ on [[""'] c:J em CJ OJ c:J c-J c--:-:J c-J r-J .c-J r---J c-J
/'/ ..
•/ ..•
~ ...•/ .;..,
• 0/ _./'/
• ~"J0......~
•/ .~_~O
/ .,,'.0,
•I :
•••••
3 I • >1 12•••
~ ... /"o~.·/
/~.2 ..0· /' I 10
0"'· /0.(,- ..~ ~./ 'c & ~.- , 0"· d-
i O ·/ '= I,,'· ';~ 0, • ._Q» I· /o I ~/ ~ 8
~I :I >
~ O~ I I, I 6o 10 20 30
Streamflow per unit width! cfs/ftIII
i 4,
i
i- - - -I- - ABOVE STATION 850--l- NEAR STATION 850
r BELOW STATION 850I
14 , ».
2 I , , I
o
Figure 17,
10 20Streamflow per unit width
oh/ft
Depths and velocities above the mouth of Indian River calculatedas functions of unit discharge in the absence of mainstem backwater effects.
30

CnL
[
[
[
[
[
o6oBoQn
E
o[
ccc
the mouth of Indian River, these depths and velocities should be used as
the principal indicators of access by adult salmon for existing channel
conditinns.
Streamflow data for Indian River suggest that typical streamflows during
the June through August period might be in the range of 200 to 500 cfs
(ADF&G 1983a). Review of the 1982 Indian River streamflow record in
association with 1982 and long-term precipitation records from Talkeetna
suggest that 100 cfs might be an abnormally low summer stream flow for
Indian River. Consequently, this figure was selected to calculate the
entrance depth associated with a probable "worst case" low flow in
Indian River.
Based on the estimated relationship between streamflow and unit dis
charge at the mouth of Indian River (refer Figure 16), 100 cfs repre
sents a discharge per unit \'lidth of 1.5 cfs/ft. Given the existing
channel geometry for Indian River and no backwater effects from the
Susitna River (Gold Creek flow less than 13,000 cfs), a streamflow of
100 cfs would provide depths of approximately 0.5 feet and velocities of
approximately 3.5 fps at the mouth of Indian River. Mainstem backwater
effects would tend to increase the depth of flow and reduce the velocity
(Fi gure 17).
Mean annual floods for Indian River have been estimated to range between
700 and 850 cfs (R&M Consultants, Inc. 1982b). The peak daily discharge
recorded during 1982 was 1,815 cfs (ADF&G 1983a). This author estimates
peak daily streamflows may be in the range of 2,000 to 2,500 cfs
-46-

[
[
[
[
[
1
-~
[
[
o6".-c,
oBoo6o[
cu[
-"
(approximately 15 cfs/ft). Streamflows of this magnitude are forecast
to result in depths near 2 feet and mid-channel velocities in excess of
7 fps at the mouth of Indian River, were no mainstem backwater effects
present (Figures 16 and 17).
Based upon review of a previous analysis of flow variability for the
Susitna River (R&M Consultants, Inc. 1981) and the 1982 streamflow
record for Indian River, it is not expected that streamflows of this
magnitude would persist for more than three consecuti've days. After
Indian River flows receded to the 200 to 500 cfs range, the depth of
flow at its mouth should range between 0.7 and 1.2 feet and mid-channel
velocities would range from 4 to 6 fps.
Channel Stability. It is not expected, however, that the streambed
above the mouth of Indian River will remain stable (R&M Consultants,
Inc. 1982b). Threshold values of incipient motion were estimated for
various streambed particle sizes as a function of unit discharge (Figure
18) us i ng Shi e1ds cr; teri a (Appendi x A) and the depth and vel ac i ty
curves presented as Figure 17. Application of these threshold values to
the lower reach of Indian River indicates that the mouth of Indian River
is unstable. Upstream of station 850 the maximum streambed particle
size typically transported would likely be in the range of 4 inches.
However, downstream from station 850 6- to 8-inch particles could be
transported with little difficulty. Field observations indicate that
streambed particles in the lower portion of Indian River are generally 2
to 4 inches interbedded with 5- to 6-inch material. The larger particle
sizes are more commonly found in the primary channel.
-47-

r"1
lJ
[
[
[
[
cC
BoBoC
B[
C[
C[
• • • • •• Above Station 850--- -- - Near Station 850
Below Station 850
8 • > i
• 6 /'"•J:.
/(,)
.5c ,/'~ /o.G•>0e 4
/ o'!>~ ••••• .,#. •~ ••• / o'!>o. ••• •• ~ .
Q~ ••(,)
/ o •-- s··· •...~
•2 ••••••••
o-C . • .0 lO 20 30
Streamflow per unit widthcfs/ft
Figure 18. Streambed particle sizes moved above the mouth ofIndian River in the absence of mainstem backwatereffects as a function of unit discharge.
-48-

[
[
[
[
r~
[
[
C
6C
B0,···,
.i
on~
[
[
[
C
E
A large alluvial deposit exists at the mouth of Indian River. This
author estimates that naturally occurring tributary flow in association
with the proposed regulation of mainstem discharge would result in
Indian River downcutting portions of its streambed above the mouth 1 to
2 feet and extending its channel into the Susitna River. Although this
process is not expected to significantly reduce the streambed elevation
at the mouth of Indian River, it would result in a steeper gradient
channel than presently exists upstream of station 850.
In the absence of mainstem backwater effects, the gradient at the mouth
of Indian River could increase from 0.01 ft/ft to 0.05 ft/ft. Such an
increase would likely be only temporary. Tributary flows in excess of
1,200 cfs (10 cfs/ft) are expected to provide main channel velocities of
sufficient magnitude to downcut the streambed near station 850 and
extend the mouth of Indian River into the channel of the Susitna. The
streambed elevation at station 850 is estimated to degrade from 708.5 to
706.0, with the elevation at the mouth (station 800) remaining near 705
(Figure 19) •
Based upon this occurring, the streambed gradient in .the lower 300-foot
reach of Indian River is estimated to increase from 0.01 ft/ft to 0.02
ft/ft. This increased gradient would have a negligible effect on depths
at the mouth of Indian River and would cause approximate.ly a 0.5-fps
increase in mid-channel velocities during typical summer streamflows
(200-500 cfs). Du·ring peak flow periods, depths are forecast to be
approximately 0.5 feet shallower and mid-channel velocities approxi
mately 1 fps greater were the streambed not to have degraded (Figure
20).
-49-

rJ r:::J r'""J ~ c--, OJ[] [rJ l""uJ CD Cl CD Ld.,~J c-J ~ c--J II c--J c--J Ll
130
I- 120LLJLLJLa.
Z
zo-~
I >U1 LLJ.... ..JI LLJ
710
100
690
STREAMBED PROFILE
200 400 600 800 1000 1200
HORIZONTAL DISTANCE IN FEET
1400 1600.
Figure 19. Estimated postproject streambed and water surface profiles for Indian Riveradjoining the Sustina River at RM 138.66.

r-:J c::J c-:J C.:., ..J c-JJ G1T'"J CE:JIJ Ccc.J ULJ L."._J C1J L ..LJ c-J I=-:J c--J c--:J rJ ,----."L..... J. .J
121 1
10
4
iii 8Q....:
>....gG)> 6
.s
3·0ro toStream flow per unit width
cfs/ft
o
2'
3 1 I
..Q)Q)c-.&:..Q.Q)
o101W1
2·1 I I Io 10 20 30
Stream flow per unit widthcfs/ft
Figure 20. Influence of streambed slope (degradation) on mid channel depths and velocitiesat the mouth of Indian Creek in the absence of Susitna River backwater effects.

[
[
[
[
[
[
[
C
EC
D
D
CR~..•o
[
C[
U
E
DISCUSSION
Preproject Access
Adult pink and chum salmon di d not appear to experience any diffi cul ty
entering Indian River or Portage Creek during the low-flow period
witnessed during mid-August, 1982 (Table 5). The inmigration period for
pink and chum salmon entering Indian River occurred during the first and
second weeks of August. The inmigration period for these species
entering Portage Creek was during the second and third weeks of August.
During the first two weeks of August 1982, mainstem flows at Gold Creek
ranged between 14,000 and 18,000 cfs. Indian River streamf10ws ranged
from 170 to more than 260 cfs. During the second and third weeks of
August 1982, Portage Creek streamflows decl ined from 600 to 400 cfs
whi 1e the mainstem di scharge at Go1 d Creek decreased from 17,000 to
12,000 cfs.
Mainstem discharges at Gold Creek during the second and third weeks of
August, 1982 represent some of the lowest average daily streamf10ws of
record for that month. Normally mainstem discharges at Gold Creek range
between 19,000 and 21,000 cfs during August (R&M Consultants, Inc.
1982a). Streamflows of this magnitude provide mainstem water surface
elevations off the mouth of Indian River and Portage Creek from 1.0 to
1.5 feet higher than those which occurred during August, 1982 (refer to
Tables 1 and 3). These higher mainstem water surface elevations reduce
velocities and increase depths at the mouths of these tributaries,
thereby improving access conditions. Thus, it could be concluded that
-55-

t...J m:::JTABLE S.
c-:J rT:J t.,: J CJTJ cr-:l L",.J t"J,U c:J CD CO c-J rJ ["""""""] c=:J c-J C':"]Comparison of 1982 pink and chum salmon inmigrations into Indian River and Portage Creek with average daily tributary and mainstemstreamflows. (Adopted from USGS 1982, ADF&C 1983a, ADF&G 1983b)
C'""l
Susitna River Indian River ADULT SALMON ENUMERATED ADULT SALMON ENUMERATEDDischarge Discharge Pink Chum Portage Creek Pink Chum
Date 1982 Gold Creek cfs Live Dead Total Live Dead Total Discharge cfs Live Dead Total Live Dead Total
August 3 19,800 No Record 24 -0- 24 No Record -0- -0- -0- -0- -0- _O_c
4 18,500 " "5 17,400 " 202 1 203 15 -0- 16a "6 14,800 " "7 16,500 " "8 16,600 " "9 17,000 260 600 146 -0- 146 25 -0- 25d
10 16,700 240 62011 15,400 230 735 3 738 134 -0- 134b 59012 14,400 200 58013 13,600 180 49014 13,600 170 48015 14,800 170 49016 15,600 160 537 22 559 362 5 367b 450 166 3 169 71 -0- 71 e
17 15,100 170 46018 14,200 180 450
: 19 13,300 160 42020 12,500 150 39021 12,200 140 38022 12,200 130 360 111 -0- 111 143 10 153e
23 12,300 130 238 329 567 184 15 199b 37024 12,SOO 130 37025 13,400 130 37026 13,600 130 39027 12,900 120 360 .28 12,400 120 34029 12,200 140 8 339 347 120 48 168b 380 15 126 141 21 7 28e
30 13,100 280 60931 16,000 450 766
IU'I...,I
a index area from mouth to 4 miles upstream.
b index area from mouth to 1 mile upstream.C index area from mouth to 15 miles upstream.
d index area from mouth to .5 miles upstream.e index area from mouth to 0.25 miles upstream.

[
[
[
[
[
[
[
o6oBCCfl
ls
EC[
U[
preproject access into Indian River and Portage Creek by adult salmon is
normally as good or better than it was during August, 1982.
Postproject Access
Although mainstem water surface elevations near the mouths of Portage
Creek and Indian River are forecast to be from 3 to 4 feet lower than
preproject elevations during the inmigration period for tributary
spawners, access into Portage Creek and Indian River by adult salmon is
not expected to be adversely affected. The analysis presented in this
paper indicates that naturally occurring tributary flows are sufficient
to provide adequate depths at the mouths of Portage Creek and Indian
River for adult salmon to enter these tributaries without assistance
from mainstem backwater effects {Table 6}. It was also determined that
streambed degradation would have little effect on the depth of flow at
the mouths of these tributaries.
Table 6. Estimated depths of flow* at the mouth of Portage Creek andIndian River without mainstem backwater effects.
Portage Creek Indian River
Flow Depth Depth Flow Depth Depth{cfs} {Not Degraded} {Degraded} {cfs} {Not Degraded} (Degraded)
300 0.9 0.8 100 .5 .4
500 1.1 0.9 300 .8 .7
800 1.4 1.2 500 1.1 1.0
*Refer to figures 6 and 10; 16 and 20
-58-

-59-
Fish normally employ cruising speeds during migration, sustained speed
for passage through difficult areas, and darting speed for feeding or
escape. Swimming abil ity varies among species of salmon. Cruising
Three terms are generally used to describe swirrming speeds of fish:
Cruising - a swimming speed that can be maintained for hours,
usua'lly ranging from 2 to 4 body lengths per second;
Insufficient data are available to compare preproject (mainstem
backwater effects present) and postproject (mainstem backwater effects
absent or reduced) velocities at the mouths of Portage Creek and Indian
River. However, it is possible to estimate mid-channel velocities at
the mouths of these tributaries in the absence of mainstem backwater
effects, then compare these velocities with passage criteria for adult
salmon. Used in this manner, the existing data base is adequate to
determine whether or not mainstem backwater effects are necessary during
periods of high tributary flow in order for adult salmon to enter
Portage Creek or Indian River.
a single burst of effort maintained only for a few
seconds, which may range from 8 to 12 body lengths
per second (Watts 1974).
a swimming speed that can be maintained for several
minutes, ranging from 4 to 7 body lengths per
second; and
Darting
Sustained -
c.[
[
[
[
[
[
C6[
CoCBb[
CoE

[
[
[
c[
[
coooBoDf"
~
C[
[
C
E
speeds for adult salmon' typically range between 1 and 3 fps, sustained
speed 4 to 10 fps, and darting speeds may range as high as 20 fps (Bell
1973). Velocities of 10 to 13 fps approach the upper swimming ability
of salmon and may retard upstream migration (Reiser and Bjornn 1979).
Thompson (1972) has recommended depth and velocity criteria for
successful upstream migration of adult salmon (Table 7).
Table 7. Depth and velocity criteria for successful upstream migrationof adult salmon (from Thompson 1972).
Minimum MaximumFish Depth Velocity
Species (ft) J.!I?s)
Chinook salmon 0.8 8Coho salmon 0.6 8Chum salmon 0.6 8Pink salmon 0.6 7Sockeye salmon 0.6 7
Swimming speeds and migration success may be affected by available
oxygen and water temperature (Bell 1973 and Reiser and Bjornn 1979).
However, it is not expected that the proposed project will affect
naturally occurring dissolved oxygen levels or water temperatures within
Portage Creek or Indian River. Nor is it thought that naturally
occurring dissolved oxygen levels or water temperatures in these
tributaries presently inhibit the swimming performance of adult salmon
attempting to enter them.
-60-

[
[
[
[
[
[
coECBCC~
C[
CU·.>;·
-.3
[
High flows in Portage Creek and Indian River can produce velocities
capable of reworking streambed materials near their mouths. The fore
cast reduction in mainstem water surface elevations of 3 to 4 feet
during summer months would stimulate changes in the existing stream
channel geometry near the tributary mouths. Streambed gradients
probably would steepen, resulting in somewhat higher velocities than
otherwise would have occurred at the tributary mouths (Table 8).
Table 8. Estimated mid-channel velocities* at the mouth of PortageCreek and Indian River without mainstem backwater effects.
Porta,2e Creek Indian River
Flow Velocity Velocity Flow Velocity Velocity(cfsL-- (Not Degraded) (Degraded) (cfs) (Not Degraded) (Degraded)
1000 7.3 8.2 750 5.8 6.6
1500 8.3 9.4 1000 6.4 7.2
2500 10.1 11.5 2000 6.5 8.4
*Refer to figures 6 and 10; 16 and 20.
Although peak flows may delay entry into Portage Creek, comparison of
these velocities to swimming speeds for adult salmon does not suggest
that high velocities would prohibit adult salmon from entering Portage
Creek or Indian River. Mid-channel velocities associated with flows in
excess of 1,000 cfs in Portage Creek and Indian River are comparable to
sustained swimming speeds of adult salmon. Thus an adult salmon would
be capable of holding a stationary position in the water column at
-61-

[
[
[
[
[
[
[
ocC
oB[
C6EC[
C
E
mid-channel. Forward progress would be expected if the fish were to
migrate along the stream margins. During the more common flow periods
(500-800 cfs at Portage Creek and 200-500 cfs at Indian River),
mid-channel velocities at the tributary mouths would be only slightly
higher than the cruising speed of adult salmon.
-62-

[
[
[
[
[
[
[
oBoBoC·
EtC[
oE
LITERATURE CITED
Acres American Incorporated. 1982. Chapter 2 in Susitna HydroelectricProject FERC License Application Exhibit E. Draft Report.
Bell, M.C. 1973. Fisheries Handbook of Engineering Requirements andBiological Criteria. Fisheries - Engineering Research ProgramCorps of Engineers, North Pacific Division. Portland, Oregon.
Alaska Department of Fish and Game. 1981. Adult Anadromous Phase 1Final Draft Species/Subject Report, for Al aska Power Authority,Susitna Hydroelectric Project.
Alaska Department of Fish and Game. 1983a. Su-Hydro Aquatic StudiesPhase II: Basic Data Report. Volume 4 Aquatic Habitat andInstream Flow studies (Draft); for Alaska Power Authority, SusitnaHydroelectric project.
Alaska Department of Fish and Game 1983b. Su Hydro Aquatic StudiesPhase II: Basic Data Report, Volume 2 Adult Anadromous Studies(Draft); for Alaska Power Authority, Susitna Hydroelectric Project.
R&M Consultants, Inc. 1981. Flow Variability; for Acres AmericanIncorporated, Susitna Hydroelectric Project.
R&M Consultants, Inc. 1982a. River Morphology, appendix B-9; for AcresAmerican Incorporated, Susitna Hydroelectric Project.
R&M Consultants, Inc. 1982b. Tributary Stability Analysis; for AcresAmerican, Incorporated, Susitna Hydroelectric Project.
R&M Consultants, Inc. and Acres American Inc. 1982. Hydraulic and IceStudies; for Alaska Power Authority, Susitna Hydroelectric Project.
Reiser, D.W. and T.C. Bjornn. 1979. Habitat Requirements of AnadromousSamonids. Idaho Cooperative Fishery Research Unit. University ofIdaho, Moscow. In: USDA Forest Service General Technical ReportDNW-96. Pacific Northwest Forest and Range Experiment Station.Portland, Oregon.
Thompson, K. 1972. Detennining streamflows for fish life. InProceedings, Instream Flow Requirement Workshop Pacific NorthwestRiver Basin Commission. Vancouver, Wash., p. 31-50.
USGS. 1982. Provisional Streamflow Record Susitna River at Gold Creek.
Watts, F.J. 1974. Design of Culvert Fishways. Idaho Water ResourcesResearch Institute, Moscow, Idaho.
-63-

[
[
r'~,[
[
[
[
D
EoB
oC
6Eo[
E[
APPENDIX
Introduction
Streamflow can be classified in various ways and evaluated with a variety of
hydraulic formulas. Several hydraulic terms and equations are mentioned in
the preceding portions of this report that may warrant further definition and
explanation. With the exception of the explanation of unit discharge and
Shield's criteria, the following information has been extracted from lecture
notes used by the author while serving as Training Officer with the U.S. Fish
and Wildlife Service1s Cooperative Instream Flow Service Group in 1978-79.
The explanation of unit discharge and Shield's criteria is based upon the
author's general knowledge of these concepts. A partial listing of relevant
1iterature has been included for those interested in knowing more about the
definitions and formulas introduced in this appendix.
Steady and Unsteady Flow
Streamflow is said to be steady if the depth of flow at a given location in
the channel remains constant during the time interval under consideration.
The flow is unsteady if the depth changes with time.
It should be apparent that the time interval chosen as the classification
criterion will dictate how an actual flow event is classified. For example,
if a one-year period is chosen as the time interval, then the passage of the
annual stream hydrograph past some point along the stream bank is classified
as being unsteady; i.e. depth of flow and velocity at that point do change
A-I

[
[
[
['
[ '
.,
r-'L)
[
U['o
C
BCC
~
E[
[
U[
within the chosen time interval. On the other hand, if an infinitessimally
small increment of time were chosen as the criterion, then flo\'1 conditions
associated with a flood wave or hydropower peaking surge could be classified
as steady state; i.e. the time interval being considered is so brief that
depth and velocity conditions would be treated as constants at the transect.
Although both these situations are technically correct, neither is very
compatible with field situations.
The time interval that is to be used as the criterion for classifying flow
must be both representative of field conditions and pertinent to the analysis.
One approach would be to define the time interval as the length of the study
reach in feet divided by the mean reach velocity in feet per second.
reach length (feet)Time interval (seconds) =mean reach velocity (ft/sec)
However, from an appl ications view the time interval chosen as the criterion
must be ~qual to or greater than the time required for a field crew to gather
the necessary flow data. The essential question to answer in the affirmative
is, "Can I assume that the depth and velocity at each transect in the study
reach will remain constant during the time interval required to measure and
record flow data throughout the study reach?1l This is of considerable
importance when gathering data for calibrating hydraulic simulation models.
Indifference on the part of field personnel toward ensuring that flow data is
obtained in a manner consistent with steady flow assumptions can result in a
very erroneous assessment.
A-2
A-3
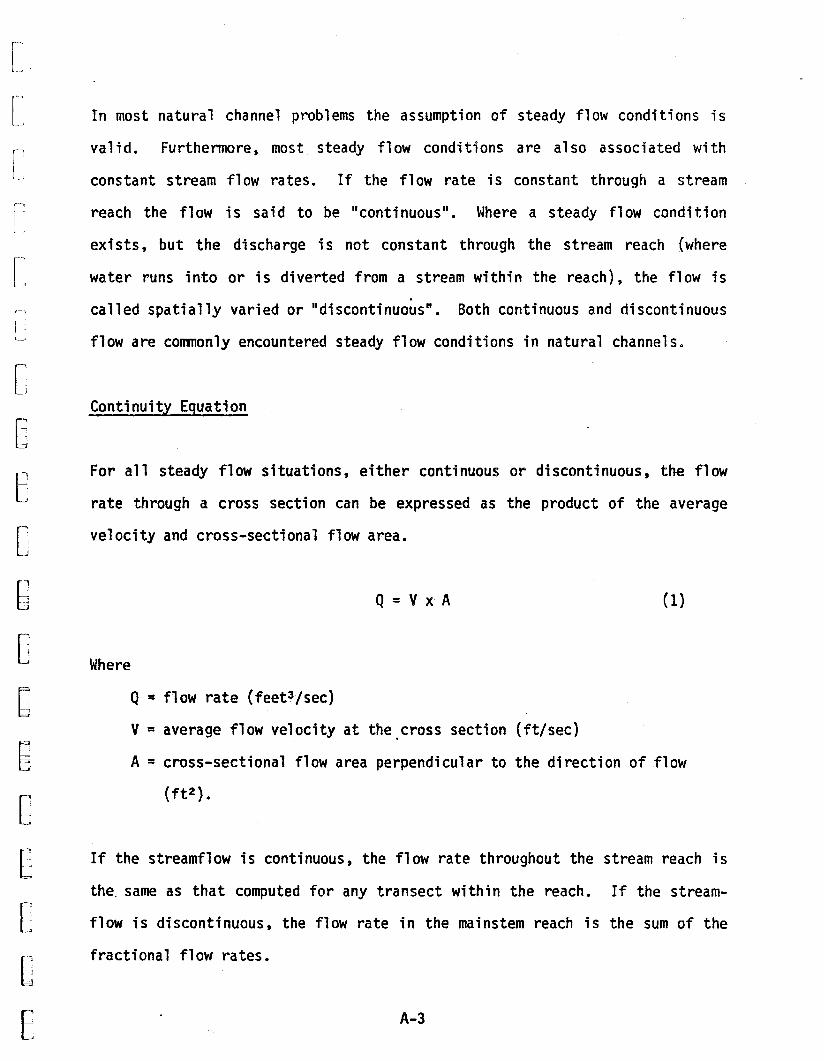
Conti nui ty Equation
For all steady flow situations, either continuous or discontinuous, the flow
rate through a cross section can be expressed as the product of the average
velocity and cross-sectional flow area.
If the streamflow is continuous, the flow rate throughout the stream reach is
the. same as that computed for any transect within the reach. If the stream
flow is discontinuous, the flow rate in the mainstem reach is the sum of the
fractional flow rates.
(I)Q= Vx A
Where
Q =flow rate (feet3jsec)
V =average flow velocity at the cross section (ft/sec)
A= cross-sectional flow area perpendicular to the direction of flow
(ft2 ).
In most natural channel problems the assumption of steady flow conditions ;s
valid. Furthermore, most steady flow conditions are also associated with
constant stream flow rates. If the flow rate is constant through a stream
reach the flow is said to be "continuous". Where a steady flow condition
exists, but the discharge is not constant through the stream reach (where
water runs into or is diverted from a stream within the reach), the flow is
called spatially varied or "discontinuous". Both continuous and discontinuous
flow are commonly encountered steady flow conditions in natural channels.
tC>
8
E[
[
BE
n
I>
[
[
[
[
D
E
C
B
C
C
[
[

[
[:
[
[
[
r.~'
-'
[
C6C§
D
CG
C[
[
oE
Uniform and non-uniform flow
Uniform flow is the fundamental type of flow treated by open channel theory.
Open channel flow is said to be uniform if the average velocity and depth of
flow are constant throughout the section of channel being studied. In order
for the depth and average velocity to remain constant, energy must be dissi
pated at a constant rate. Therefore, uniform flow requires that all hydraulic
parameters are constant throughout the study reach. This requires that a
symmetrical channel of uniform substrate exists. Flow in natural channels is
seldom uniform. Uniform flow conditions are approximated in rather long
straight natural channels with constant cross sectional geometry, or in
man-made canals and ditches.
Flow is non-uniform if depths and velocities are not constant throughout the
study reach. Depending upon how abrupt the changes in velocity and depth are,
non-uniform flow may be classified as either "rapidly" or "gradua1ly varied".
Flow is rapidly varied if velocity and depth change markedly within a short
distance.
Rapidly varied flow can be viewed as a localized phenomena, such as flow
around large boulders, cascading rapids, or at the head end of a plunge pool.
Rapidly varied flow does not lend itself well to either field measurement or
theoretical analysis; it can best be evaluated by developing site specific
empirical relationships.
A-4

Subcritical, Critical, and Supercritical Flow
The effect of gravi ty on the state of flow is represented by the rati 0 of
inertial force to gravitational force. This ratio is called the Froude Number
(Fr) and is defined as:
The state, or behavior, of open channel flow is governed by the effects of
viscosity and gravity relative to the inertial force of the flow. Viscosity
and the surfa·ce tension of water may effect the behavior of flow under certain
circumstances, but neither plays a significant role in most open channel flow
problems.
On the other hand, gradually varied flow lends itself quite well to analytical
treatment by application of uniform flow theory. The more gradual the change
in velocity or depth through the study reach, the more closely uniform flow
conditions are approximated and the more applicable become fundamental
hydraulic formulae. Fortunately, gradually varied flow conditions are
extremely prevalent in natural channels and are quite often associated with
riverine fishery habitat.
(2)
A-5
VFr = (gy)' 5
Where
Fr = a dimensionless ratio
V = average flow velocity (feet/sec)
g = gravitational acceleration (32.2 ft/sec 2 )
y =depth of flow (feet)
['
[
[
[
[
['
[
C
E[
6CC
BC[
[
CE

[
cc[
[
[
[
oED
B
oC
B[j
[j
[
o[
In examining the above formula for the Froude number, three possibil ities
exist. The Froude number may be less than one, equal to one, or greater than
one.
When the Froude number is equal to one, the flow is said to be in a critical
state. Critical flow is generally an unstable (transitory) situation in
natural channels. An important property of critical flow is that it connotes
the point of minimum specific energy for a given discharge, but also it
describes the maximum discharge for a given set of channel conditions.
If the Froude number is less than unity, the flow is called "subcritical".
This is the most common type of flow occurring in natural channels. In this
state, the role played by gravity forces is more pronounced so that the flow
is characterized by a lower velocity and greater depth than exists in the
critical flow state. Potential energy, in the form of flow depth, is domi
nant. Subcritical flow is often described as tranquil or streaming flow.
If the Froude number is greater than unity, flow is said to be supercritical.
In this state, inertial forces are dominant. Supercritical flow is .charac
terized by high velocity and shallow depth. It is characteristically accom
panied by standing waves immediately downstream from where it occurs. Super
critical flow in natural channels is generally a temporary situation accom
panying peak flow events. It is usually described as rapid or shooting flow.
A-6·

[
r[
[
[
[
[
oB
Cn6
C
DB
C[
[
C
E
Manning's Equation
Although uniform flow is not common, many natural flow situations occur which
approximate the uniform flow condition. Experimental work by Robert Manning
(1889) has provided the English speaking world with its most commonly used
uniform flow equation. On the European continent Manning's equation is
sometimes known as Strickler's equation. Other uniform flow equations,
notably' Ganguillet and Kutter (1869), Bazin (1897), and Powell (1950), have
been proposed and us~d, however they have not received as wide acceptance as
the Manning equation.
Manning's experimental work was done in metric units. In order to use the
same value of "nil with English units, the factor 1.49 (the cube root of the
number of feet in a meter) was introduced by Buckley in 1911. The Manning
equation relates average flow velocity (V) to the channel slope (S), the
channel roughness (n), and the hydraulic radius (R) in the following manner:
V - 1.49 ·67 '5- --;- R S (3)
Determination of an accurate Manning's n value is difficult for a natural
channel without reach specific information and practical experience. The
value of n depends on streambed composition, vegetation, channel alignment,
channel size and shape, depth of flow, suspended sediment and bed load, and
seasonal changes. Recommended Manning's n values, and a method for estimating
Manning's n values for both man-made and natural channels- has been provided by
Chow (1959).
A-7

A-a
Unit discharge (q) is the flow rate per foot of channel width. It may be
calculated by dividing total discharge at a cross section by the effective top
width of the stream at that location.
The hydraulic radius (R) is defined as the ratio of the cross sectional flow
area to the wetted perimeter. For channels in which the top width is more
than 30 times- the average depth of flow, depth may be substituted for the
hydraulic radius without any appreciable effect on the accuracy of the calcu
lations.
In the analysis of access conditions at Portage Creek and Indian River,
Manning's equation (Equation 3) was combined \t/ith the continuity equation
(Equation 1) and applied using the concept of unit discharge. The combined
equation which expresses total discharge past a cross section in terms of the
Manning parameters is shown below:
(4)Q= 1.49 R·67 5. 5 An
The slope (5) represents the rate energy is di ssipated (energy grade 1i ne) in
order to overcome the resistance to flow caused by the streambed and
streambank irregularities. As previously mentioned uniform flow requires that
depth and average velocity are constant through the study reach. In order for
this to occur energy must be expended at a constant rate through the study
reach. Hence the energy grade line, water surface profile, and streambed
profile must be parallel. Thus the channel slope is commonly used in place of
the slope of the energy gradient when applying the Manning equation.
[
[
[
[
[
[
[
oEoooDG
D
C
C
oE

A-9
This equation can be rewritten to express depth (y) as a function of unit
di scharge (q).
Thus the depth of flow (y) can readily be determined (estimated) for any unit
discharge. And by applying the continuity equation (Equation 1), the corre
sponding velocity of flow can be determined (estimated for that same unit
discharge).
This is the basic equation used to determine the relationships of depth and
velocity to unit discharge in Figures 7 and 17. For the specific portions of
Indian River and Portage Creek being evaluated both nand 5 were known
(estimated). Thus the first terms in the equation may be viewed as a con
stant, and rewritten as:
(7)
(6)
(5)1.49 5. 5 y1067q =---n
q = K yl.67
y = +.6
where K = 1.49 5· 5n
The cross sectional dimensions of the stream tube that conveys the unit
discharge is, by definition, one foot wide and "y" feet deep. The wetted
perimeter of the stream tube is one foot, and its cross sectional area is "y"
square feet. Thus the hydraulic radius, or ratio of the cross sectional flow
area to the wetted perimeter, is "y" feet. Therefore, Manning's equation of
continuity for unit discharge may be written as:
cc[
[
[
[
[
6Bo8C
D
Q
C
C[
D
t

The streamflow which causes incipient motion of streambed materials may be
estimated using Shields criterion. If the Shields parameter is equal to or
greater than 0.047, a sediment particle of diameter ds will begin to move.
The dimensionless Shield's parameter is defined as
(9)
(8)
A-tO
IfF*= (1fIs-V) ds
If = 1/8 fpV2
If = bed shear stress (lbs/ft2 )
p = density of water (1.94 slugs/ft3 )
V = velocity of flow (ft/sec)
f = Darcy Weisbach Friction Factor
where
with If defined as:
Streambed Stability
[
[
[
[
[
[
[
IJ where
F* = Shield's parameter (dimensionless)
[J Vs = specific weight of sediment particles (lbs/ft3 )
(J V =specific weight of water (62.4 lbs/ft3 )
------ud=-s--""="---U-diamete~Lsedime~t-panic1-e-<-ft-)f-------------------
B If = bed shear stress (lbslft2 )
oC'
~
oo[
D[

(l2)
(11)
Cht::l:.Y HZ: V= c «schez, (2 .. 1~
(10)
Set Ma.."i"T~ Ea' eIM.o. b C}u:c.y t~.
1.:'1 R' 'Y& S Y''Z,. -=j d'i R·YZ. S Vz.
f'
~ R Y'- - ~
[
h -"J'7s ..l,sittu41L ~ ~_ R
8y· 33
If' = 116n2 p V2•
n2f = 116 7 33
A-11
f = Darcy Weisbach Fricti·on Factor
If' = 28
n = Manning's n
n = Manning's n
If' = bed shear stress
v = average velocity of flow determined from Manning's equation
y = depth of flow determined from Manning's equation
y = depth of flow (feet)
as:
where
which can be simplified by combining the constant values to
where
The Darcy Weisbach Friction Factor can be expressed in terms of Manning's nI. 'IY Ys ~ Y2,.
Mc". ;"1s ~!: ,,= n R ~
The above equation can be substituted for the Darcy Weisbach friction factor
(f) and bed shear stress defined in terms of Manning's n as:
[
n[
[
[
[
[
BOJ,
C6oU
Q
D
C
C
C[

A-12
The bed shear stress ('I') calculated with Equation 12 was used to determine the
diameter of the particle ·sizes moved as a function of unit discharge. The
results from these calculations are presented in Figures 8 and 18 of the
report.
Bed shear stress ('I') was determined as a function of unit discharge using
Equation 12 and the same Manning equation parameters used to calculate the
depth and velocity relationships presented in Figures 7 and 17. The results
of these calculations (bed shear stress vs. unit discharge) are not presented
in the report since they are an intermediate step in determining streambed
stability.
Shield's criterion and Equation 12 for were used to estimate the velocity at
which various size streambed particles begin to move. Shields parameter was
given a value of 0.047 and the specific weight of streambed material in
Portage Creek and Indian· River was estimated to be 165-170 lbs/ft3 • Using
these values and 62.4 lbs/ft3 as the specific weight for water, Shield's
equation was solved to express the diameter (ds ) of a streambed particle
(inches) moved as a function of the bed shear stress.
(13)ds = 2.43 'I'
nEj
G
D[
o[
[
[
c[
[
[
[
D
BD
ooD

[
[ '
.J
[
[
[
[
co6G[]
0;,
oG
C
C[.
oE
REFERENCES
Chow, V.T. 1959. Open Channel Hydraulics, McGraw Hill, New York, New York.
Henderson, F.M. 1966. Open Channel Flow, MacMillian Company. New York, New
York.
Simons, Li, & Associates. 1982. Engineering Analysis of Fluvial Systems.
Simons li &Associates, Ft. Collins, Colorado.
A-13


![SUSITNA HYDROELECTRIC PROJECT · susitna hydroelectric project federal energy regulatory commission project no. 7114 aquatic monitoring manual [m]~[ffi~~c:j~~~®~@ susitna joint venture](https://img.dokumen.tips/doc/110x75/6028408ba29dea20926a6e59/susitna-hydroelectric-project-susitna-hydroelectric-project-federal-energy-regulatory.jpg)