Embed Size (px)
Citation preview

Living Wages at the Port of Oakland
Carol Zabin*** Michael Reich**
Peter Hall*
with the assistance of Melanie McCutchan, Christopher Niedt and Egon Terplan
Center for Labor Research and Education Center on Pay and Inequality
Institute of Industrial Relations UC Berkeley CA 94720
December 1999
***Ph. D., Economist, Center for Labor Research and Education **Ph. D., Professor of Economics *Ph. D. candidate, Department of City and Regional Planning

Living Wages at the Port of Oakland
Contents Page Summary and Main Findings 1 1. Introduction and overview of living wage ordinances 5
Purpose of this report 5 The Oakland Living Wage Ordinance in national perspective 6 Oakland's wage standard and coverage 7 2. Recent growth and income distribution trends in Oakland 9 Economic growth in Oakland 9 Those left behind 9 3. Employment and pay at the Port of Oakland 11 The Port's transformation 11 The Port's expansion 12 Current Port employment patterns 13 4. The benefits of the proposed Living Wage Ordinance 15 Benefits to workers 15 Benefits to employers 16 Benefits to governmental entities 18 5. The costs and affordability of the ordinance 19
Costs to employers 19 Costs to workers 20 Affordability 20 Affordability at the Airport 21 Affordability at the maritime Division 23 Affordability at the Real Estate Division 24
6. Conclusion 26 Appendices 28 A. Survey method and data sources 28
B. Supplementary wage calculations 32 Acknowledgments and author biographies 35 References 36 List of tables 39

Living Wages at the Port of Oakland 1
Summary and Main Findings
In June of 1999, a coalition of citizen groups proposed that the City of Oakland’s Living Wage Ordinance should be extended to cover workers employed by leaseholders and contractors of the Port of Oakland. The Port is currently excluded from the City law. The Port of Oakland is the city’s biggest public asset and is frequently touted as the city's principal engine of economic growth. Businesses at the Port's three divisions-- the maritime port, Oakland International Airport, and the waterfront real estate division, which includes Jack London Square-- employ over 11,000 workers and generate indirectly another 11,000 jobs. The Port is planning expansions that will increase these numbers dramatically.
This study estimates the costs and benefits of implementing a specific living wage policy proposal which would cover the leaseholders and on-site service contractors of the Port of Oakland. We based our analysis on the assumption that the living wage policy would follow the provisions of the Oakland law, except that the Port policy would include the category of leaseholders. Leaseholders are only covered in the Oakland law if they receive direct city financial assistance. Following the Oakland law, the proposal we analyzed would require covered businesses to pay their workers $8.30 per hour if they provide health benefits or $9.55 per hour without benefits, with wages indexed to cost-of –living adjustments every year. The proposal would also provide a floor of 12 days of paid leave (and 10 days unpaid leave) for illness, holidays and vacation.
The information used in this analysis is based largely on contract and economic
data that we obtained from the Port and from a detailed survey that we conducted of the Port’s leaseholders and on-site contractors. Our survey examined the 140 businesses at the Port who would be covered by the proposed ordinance because they are leaseholders or on-site subcontractors, and who employ over five workers. The survey compiled extensive information on firms, jobs and workers, supplemented when necessary by estimates derived from government data sources, by a briefer survey we conducted of firms located near Jack London Square and by selected on-site interviews. We also obtained useful comments from Port officials and other stakeholders.
What kinds of jobs does the Port create and who holds them?
Thirty years ago much of the employment at the Port consisted of highly-paid longshoring jobs in the maritime division. Since then, the number of longshoring jobs in the Bay Area has fallen by half, while employment at the Port's airport and real estate divisions both have increased and are expected to continue to grow in the coming decade. As a result, the maritime division currently contains the lowest number of jobs at the Port (about 2,050), although at the highest average wages (about $32 per hour). The airport is by far the biggest job generator at the Port, with almost 7,300 employees and average wages of $14.50. The real estate division, with 2,100 jobs, produces the lowest wage employment, with an average wage just under $11. Unionized jobs are concentrated
Living Wages at the Port of Oakland 2
in the maritime division and pay much higher wages than non-union jobs, which are most concentrated in the real estate division. The individual economic sectors with the lowest average wage rates at the port are the hotel, restaurant, parking, security and skycaps, and other services sectors.
Approximately 54 percent of Port workers live in Oakland and about 35 percent
are women. About 36 percent of Port workers are African American, about the same as their representation in Oakland as a whole. Asian Americans and Latinos comprise 14 percent and 24 percent of Port workers, respectively.
Average wage disparities among ethnic groups in the Port as a whole are fairly
small, with the notable exception of Asian Americans, who earn substantially less than other groups. Within the Port's divisions, however, racial wage disparities have been overcome only in the maritime division, where African Americans constitute about half of the highly-paid longshore workers. In both the airport and the real estate divisions, average wages of whites are about 50 percent higher than those of African Americans.
What would be the benefits of a living wage policy at the Port?
About 2,600 low-paid workers at the Port of Oakland would benefit directly from the proposed living wage ordinance. They would receive an average pay and benefits increase of $2.25 per hour, and up to 12 days of paid leave per year. In total, these low-wage workers would receive an additional $4.7 million in wages and $3.3 million in health benefits each year.
In addition, approximately 500 more workers would benefit indirectly because of
a “wage push” effect. They would receive an average pay increase of $1.16 per hour. The total indirect wage push for workers just above and below the living wage level amounts to a $2.1 million increase each year.
The 3,100 living wage beneficiaries would comprise about 27 percent of all non-
supervisory employees of Port leaseholders. About 41 percent of the direct beneficiaries would be African American, 25
percent would be Latino, 19 percent would be Asian American and 15 percent would be white. People of color, especially African Americans, are represented in greater proportions among the benefiting workers than among Port workers as a whole, because currently they are over-represented in low wage jobs. Oaklanders would also benefit disproportionately, comprising 65 percent of the beneficiaries.
What are other benefits of the ordinance?
Firms would receive some benefits due to lower turnover costs and higher productivity among workers earning the living wage standard.

Living Wages at the Port of Oakland 3
The ordinance would contribute to the county, state and federal public coffers through savings in county health expenditures for the uninsured and increased revenues from income and payroll taxes. This is a small but positive but effect on public finance.
What would be the costs of a living wage policy at the Port?
Living wage costs would increase Port leaseholders’ wage bill by 4.4 percent and comprise about 1 percent of leaseholders' annual business revenues.
The total cost to employers of the living wage policy would be about $13 million
per year. The cost of increasing wages to $8.30 an hour is about $4.7 million; the costs of providing more health care coverage is $3.3 million; the costs of paying an indirect wage push is $2.1 million; and the costs of paying 12 days of paid leave is $2 million. Employers would also pay an additional $1 million in payroll tax, bringing the total cost increase to about $13 million.
Since not all leases are up for renewal every year, the costs would be phased in
over time.
Who would bear the costs and would business growth in Oakland be hurt?
The maritime division would experience almost no increase in cost. Cost increases in the airport and real estate divisions would constitute about 1.5 percent and 4.3 percent of leaseholders' business revenues, respectively.
For the airport, this cost amounts to $0.59 per passenger departure, not enough to
change passenger preference for flying out of Oakland. Low wages are concentrated in a few firms who are subcontractors to the major airlines. The airlines could easily absorb these small cost increases and would pass some of them on to consumers.
For the real estate division, the increase in wages and benefits amounts to $0.66
per visitor to Jack London Square annually. The increase in costs to the affected restaurants and hotels is smaller than the premium they get for locating near the waterfront and in Jack London Square, compared to similar businesses in less desirable locations. With business growing in the area, the relatively small increase in costs should not affect the overall business climate.
Employment at the Port would continue to grow and at a rate that is unlikely to be
affected by the proposed ordinance. Revenues collected by the Port are also likely to continue to increase.
Living Wages at the Port of Oakland 4
Conclusions
Enacting a living wage ordinance at the Port of Oakland would help increase the incomes of 3,100 low-wage workers. The costs of the proposed ordinance are about $13 million and comprise only about 1 percent of Port leaseholders' business revenues.
We conclude that these costs will be absorbed easily by Port leaseholders, visitors
to the waterfront, and passengers at the Oakland airport. Business will not be driven away and Port revenues will not go down. Bond ratings for the Port should remain unaffected.
The Port will continue to generate large numbers of jobs for Oakland and the
region but, without public policy intervention to affect the quality of jobs, many of these will be low-wage jobs. Moreover, racial wage disparities will be perpetuated by this pattern of growth. The structure of job growth at the Port is not unique; it parallels the private economy as a whole. The question facing policy-makers is whether or not a public agency like the Port should act to reverse this pattern of increasing wage polarization as well as the growth of the working poor.

Living Wages at the Port of Oakland 5
1. Introduction and overview of Living Wage Ordinances Purpose of this report
This report estimates the costs and benefits of a Living Wage Ordinance that would cover the Port of Oakland. The Oakland City Council unanimously passed a Living Wage Ordinance in March of 1998. Oakland is one of forty cities and counties across the United States that have adopted living wage laws; over fifty others currently are in the process of considering such an ordinance. The Oakland Ordinance did not include the Port of Oakland, which is a semi-autonomous department of the city, governed by an appointed Port Commission.
In June of 1999, a number of citizen’s groups, under the banner of the Coalition
for an Accountable Port, proposed that the Oakland Ordinance should be extended to cover contracts, rental agreements or leases with the Port of Oakland. The basis for the extension is that the Port of Oakland is the city’s biggest public asset and it is frequently touted as the city's principal engine of economic growth. The Port's three divisions-- the maritime port, Oakland International Airport, and the waterfront real estate division, which includes Jack London Square-- generate over 22,000 jobs and the Port is planning expansions that will increase this number dramatically.
The proposed living wage ordinance is designed to increase the pay and benefits of low-wage workers by requiring covered employers to pay a "living wage. Absent a specific written policy proposal from the citizen’s groups, we evaluated a living wage proposal that assumed the same wage and benefit provisions as those stipulated in the City of Oakland’s ordinance. This would set a wage floor of $8.30 per hour if the employer also pays for health benefits, or $9.55 without health benefits, to be is indexed to inflation in future years. The proposed ordinance would also mandate a floor of 12 days of compensated time off for illness, holidays and vacation. However, it should be noted that the City of Oakland ordinance currently covers leaseholders only if they receive direct public assistance, while the proposal we analyze includes all leaseholders at the Port of Oakland.
Living wage campaigns have arisen in response to the growing problem of
inequality and of poverty even among full-time workers. The idea of a living wage is simple. Workers should be able to support themselves and their dependents at a basic self-sufficiency standard on the earnings they receive from full-time employment.
At one time, the minimum wage was set to provide self-sufficiency but it no
longer does so. The real buying power of the California minimum wage in 1999 is three-quarters of what it was in 1968, despite the fact that the U.S. economy is 54 percent more productive in 1999 than it was in 1968. If the 1968 minimum wage had kept pace with inflation and productivity growth, it would now be about $11.80 per hour. Since the statewide minimum wage has not been raised to a level sufficient to support a family, the Living Wage campaign represents an attempt to use local government to reinstate a meaningful minimum wage.

Living Wages at the Port of Oakland 6
A weakness of living wage laws is that in some cases they cover a small number of workers. Estimates of the impact of the City’s ordinance have ranged from 400 to 2,200 employees (City of Oakland, 1998). However, only 56 workers on service contracts and 31 workers employed by City financial assistance recipients had received wage increases as of October 1999.1 This figure is expected to rise as contracts are executed, but even when fully implemented, City personnel have concluded that the number of affected workers will be much closer to the estimate of 400 than to the larger estimate of 3,000.
In some cities, the numbers of workers benefiting from living wage policies
is much greater. In Los Angeles, about 9,000 workers may benefit, largely because leaseholders at the Los Angeles International Airport are covered (Uchitelle, 1999). Living wage proponents in Oakland targeted the Port as a way to extend the benefits of the living wage idea to more workers.
This study estimates both costs and the benefits of the proposed ordinance, in the hopes of promoting informed debate among Oakland residents, elected officials, and Port commissioners. While proponents see the living wage as a way to bring low-wage workers out of poverty, there are costs. Opponents are concerned that the proposed policy could drive business away from the Port of Oakland, or could lower revenues for the Port, which is self-supporting. We analyze who is likely to bear the costs of the proposed living wage policy, and whether or not the costs are affordable.
The study was carried out by a team of economists and students from the
University of California, Berkeley. It was funded by the UC California Policy Research Seminar, at the request of Senator Don Perata.
We organize the report as follows. We first provide background information on Living Wage ordinances around the country. We then discuss Oakland's economy, with emphasis upon how recent economic growth continues to generate inequality. Next we profile the employment created by businesses who hold leases at the Port of Oakland, using data from a survey of employers that we conducted over the spring and summer of 1999. Using this survey data, we then estimate the benefits and costs of the proposed ordinance and examine the affordability of the ordinance in the context of the Port’s overall economic activity.
The Oakland Living Wage Ordinance in national perspective
The Oakland Living Wage Ordinance covers all private businesses and non-profit
organizations that have city contracts worth at least $25,000 or receive at least $100,000 in city subsidies per year (and their tenants and leaseholders). The Ordinance initially required a wage of $8.00 per hour with health benefits, and $9.25 without, and is adjusted each year in accordance with the Bay Region Consumer Price Index. The 1999 adjusted
1 Personal communication, Vivian Inman, Office of Contract Compliance, City of Oakland.

Living Wages at the Port of Oakland 7
wage level is $9.55 an hour, or $8.30 if the firm provides health benefits.2 The Ordinance also entitles covered workers to 12 paid days off per year (and 10 days unpaid leave) and it contains an “opt out” provision by which a collective bargaining contract can supersede the requirements of the ordinance.
Oakland's wage standard and coverage
The wage standard in Oakland’s Ordinance is lower than estimates of a self-sufficiency wage for the city and lower than the levels mandated in some of the living wage ordinances elsewhere. The California Budget Project has estimated a self-sufficiency wage for Alameda County at $12.92 per hour, substantially above the current Oakland living wage (California Budget Project, 1999). This self-sufficiency wage is based on a family with two parents who are both working and with two children who squeeze into a one-bedroom apartment and use family day care (generally the most inexpensive kind of childcare).
The Oakland standard is also modest compared to other cities that have adopted
living wage ordinances, once Oakland’s high cost of living is taken into account. As Table 1-1 shows, Baltimore’s living wage of $7.90 is equivalent in purchasing power to a wage of $13.27 in Oakland, and Boston’s living wage of $8.23 would be $9.29 in Oakland. The $7.51 Los Angeles living wage is equivalent in purchasing power to a wage of $9.52 in Oakland. This ordinance includes workers at LAX airport. The recently announced living wage agreement at the SFO airport provides for $9 per hour, increasing to $10 per hour after one year (Epstein, 1999). This level is equivalent to purchasing power of $8.62 in Oakland.
The City of Oakland’s Living Wage Ordinance covers the city's contractors and subsidy recipients. The proposed living wage policy for the Port would include leaseholders, a category of employers not currently covered by the City’s Ordinance unless they are also city financial assistance recipients (CFARs) or their tenants. Leaseholders have been included in a number of other living wage policies around the country, including the Los Angeles and Miami airports, and have been proposed for San Francisco’s airport and maritime port.
Living wage ordinances around the country vary with respect to the set of
employers they cover. However, the underlying principle is similar in all cases: the ordinances recognize the impact of local governments’ business decisions on job creation. The living wage mandates that public entities directly or indirectly create good jobs in a particular locality, whether through direct expenditures on contractors or the opportunities created by publicly owned assets such as waterfront property or port facilities.
2 An official at the Port of Oakland has questioned the accuracy of the cost of living adjustment of the current City of Oakland Living Wage. The small adjustment suggested - to $8.22 rather than $8.30 - does not materially affect the estimates presented here, and thus we have used the official living wage.

Living Wages at the Port of Oakland 8
Some living wage ordinances contain additional provisions, such as local hiring requirements, and public disclosure and/or enforcement stipulations. Most living wage laws provide exemptions for small firms: Oakland’s Living Wage Ordinance, and the proposal evaluated here, only applies to firms with more than five employees.

Living Wages at the Port of Oakland 9
2. Recent growth and income distribution trends in Oakland
The Oakland economy is currently undergoing an upswing, with high rates of job
and income growth. However, this economic prosperity is distributed unevenly and the area faces a legacy of inequality that will be exacerbated by the current growth trajectory. In this context, policies such as a living wage ordinance can help to distribute the benefits of growth more equitably.
Economic growth in Oakland Like the rest of California, Oakland experienced an economic recession in the
early 1990s. From 1990 to 1993, employment among Oakland residents fell from 167,600 to 162,700, while the city's unemployment rate increased from 6.4 percent to 10.3 percent. With the state's economic recovery in recent years, job and income growth in Oakland has also resumed and the ingredients for a substantial economic boom are in place. In 1998, employment had risen to 174,000; the unemployment rate had fallen to 6.5 percent, and by the third quarter of 1999 it was down to 5.3 percent (Employment Development Department, 1999). Between 1998 and 1999, the Oakland MSA created a net 28,100 new jobs, for a growth rate of 2.9 percent3 (CB Richard Ellis, 1999). Oakland’s central location, good public transportation infrastructure, strong maritime port and air cargo airport, potentially highly valuable housing stock and a number of other elements have combined to create strong growth.
This growth is reflected in rising commercial and residential property values.
Class A rents in the East Bay office market have increased 9 percent in the past year, and are projected to increase further (CB Richard Ellis, 1999). Nonresidential construction grew 68 percent between 1996 and 1997, more than double the statewide average of 28 percent, although lagging the Bay Area rate of 83 percent (SF Airport Commission, 1999). The residential housing market is also healthy. Median home prices in Alameda County rose to $247,000 in 1999, nearly double the U. S. urban average, and grew 7.4 percent over the previous year. These real estate statistics provide evidence that Oakland is becoming a more attractive investment and development location.
Those left behind
California has experienced substantial increases in income inequality over the last two decades, even more than the nation as a whole (California Budget Project, 1998; Daly and Royer, 1999). Although we have no detailed studies of recent patterns of inequality in the Bay Area, there are strong indications that the Bay Area is still experiencing growing inequality. We can document continuing inequality both between Oakland and other Bay Area cities and within Oakland itself.
Although Oakland's economy as a whole has begun to catch up to other Bay Area
cities, income in Oakland is still lower than elsewhere in the Bay Area. Average wage 3 The Oakland MSA includes Alameda County and Contra Costa County. Wherever possible, we use data for the City of Oakland.
Living Wages at the Port of Oakland 10
data also indicate an ongoing between Oakland and its richer neighbors, San Francisco and San Jose, as is shown in Table 2-1.
A large fraction of Oakland residents earn low wages. The latest government survey data show that 45 percent of Oakland workers earn below the self-sufficiency wage of $12.74 per hour while 28 percent earn below the Oakland’s living wage of $8.30.4 By contrast, 40 percent of workers in the Bay Area earn below $12.74 and less than 20 percent earn below the $8.30 wage. Paralleling the rest of California, wage rates of local jobs are increasingly polarized. Many middle-income jobs have declined in number and the new jobs that are being created are concentrated at the high and low ends of the income scale. As Table 2-2 shows, the two occupations with the greatest projected job growth between 1995 and 2002 in Alameda County are cashiers and retail salespersons, both of which paid on average less than $8 per hour in 1997. Among the top ten occupations in Oakland, about half the total projected number of jobs in 2002 and half of the projected increase from 1995 to 2002 are in jobs earning less than $20,000 per year (in 1997 dollars).
Low wages and poverty are still concentrated in communities of color. African Americans represent 44 percent of the city’s total population, but comprise 56 percent of those living below the federal poverty level (Bay Area Economics, 1999). Substantial inequality also exists within Oakland, with significant numbers of the working poor and pockets of poverty concentrated among certain neighborhoods and ethnic groups, especially among African Americans and Latinos. The West Oakland neighborhood that abuts the Port suffers from many of the negative side effects of a successful port, such as traffic congestion, noise, dust, and air pollution. In 1998, median household income in West Oakland was $14,788 and an estimated 22 percent of West Oakland residents received welfare (Bay Area Economics, 1999).
4 The percentages are calculated in constant 1999 dollars using the CPS March Supplement sample of Oakland and Bay Area residents between 1996 and 1999.

Living Wages at the Port of Oakland 11
3. Employment and pay at the Port of Oakland In 1995, as Table 3-1 indicates, about 22,500 jobs were directly or indirectly attributed to the Port of Oakland, according to surveys carried out by consultants to the Port (Martin Associates, various years). This estimate includes Port tenants, leaseholders and contractors, and other firms whose businesses are directly dependent on the Port of Oakland.5 At one time, the Port provided mainly middle-income jobs in its main activity, maritime shipping, where largely unionized longshore and trucking jobs provided important opportunities for upward mobility, particularly for African American workers in Oakland. As we discuss below, the transformation of the Port's uses and its projected expansions have resulted in the growth of low-wage jobs and will continue to do so in the future.
The Port's transformation
The Port has undergone substantial change over the past thirty years. During this period, revenues and shipping volume have grown rapidly in the maritime port, as San Francisco traffic has shifted to Oakland and trade volumes have risen. However, the number of jobs created for each dollar of goods shipped has declined, and the number of longshore jobs in the Bay Area has fallen to half the level of thirty years ago (Pacific Maritime Association, various years). In contrast, the Port’s air and real estate divisions, while producing smaller revenue growth, have created growing numbers of jobs and will continue to do so in the future. The real estate division, and to a lesser degree the airport division, create substantial numbers of low wage jobs.
In the maritime port, automation in containerized shipping has sharply reduced
the number of jobs generated per ton of cargo moved. The San Francisco Bay longshore workforce fell from 5,366 in 1951 to 1,049 in 1998, while throughput increased from 7 million to 23 million tons during the same period (Pacific Maritime Association, various years).6 The leading West Coast ports in Southern California and Seattle have maintained longshore employment only because of tremendous growth in the volume of cargo. Cargo throughput in Oakland has grown at a healthy 2.5 percent per year since 1992, but this growth is much less than the annual growth at Long Beach (14 percent), Los Angeles (6.7 percent) and Seattle (5.0 percent) (Port of Oakland, 1998). The Port of Oakland expects to increase cargo throughput as a consequence of its expansion plans, which may lead to a one-time jump in maritime jobs, but long-term employment growth remains limited by on-going automation and constraints on increasing Oakland’s market share.
5 The latter category comprises port-related businesses such as freight forwarders, customs brokerage houses, and trucking and warehousing firms. These businesses would not be located in the Bay Area without the Port of Oakland, but may not be located on Port land or have a direct financial relationship to the Port. Consequently, they would not be affected by a Living Wage ordinance. 6 A significant portion of the loss of longshore jobs occurred in San Francisco, although we cannot give an exact breakdown because of lack of data. Oakland essentially has taken over shipping from San Francisco.

Living Wages at the Port of Oakland 12
Besides stevedoring, short haul trucking is the main on-site occupation in the maritime port (Thurston, 1999). As a consequence of deregulation and de-unionization, about 85 percent of these workers are now owner-operators. While their employment status disqualifies them from coverage under a typical living wage policy, it should be noted that their annual net earnings are quite low.7
At the same time, air transport has grown tremendously. Centrally located,
Oakland is well situated to serve Alameda and Contra Costa County, which in 1997-8 had the highest population growth in the Bay Area (Willis, 1999). In the last ten years, the number of passengers at Oakland grew by 130 percent, and Oakland’s market share for passenger travel for the three major Bay Area airports increased from 10 percent to 15 percent. More dramatically, Oakland has become the main air cargo terminal in the Bay Area. In 1998 Oakland International Airport managed around 50 percent of all Bay Area domestic air cargo, up from around 20 percent in 1987 (Port of Oakland, 1999).
Alternative uses of the Port of Oakland’s waterfront real estate have also grown,
and created many more jobs in entertainment, leisure and recreation activities. As in other urban areas, there are mounting pressures to make waterfront land accessible for the public use. Over the next few years, uses that are compatible with public access, such as Jack London Square and similar developments, are likely to be supported and prosper. Indeed, after many years of disappointing activity, Jack London Square is becoming a lively commercial and entertainment locale, producing $60 million in business revenues in 1996, with further growth projected (Howe, 1997). Embarcadero Cove, on the southern tip of the estuary, is also slated for mixed use development in the coming years.
The Port's expansion The Port of Oakland has just begun an unprecedented expansion that involves up
to two billion dollars of capital improvements over the next five years. The maritime expansion plan includes the Vision 2000 program of building new berths and a new joint intermodal terminal, and dredging the channel to 50 feet. The expansion plan for Oakland International Airport includes new terminal buildings, a parking garage, and a cross-airport roadway. Revenue bonds will finance maritime and airport expansion. The Port has also recently proposed a $200 million plan for developing the waterfront in the Jack London Square area and has requested bids from private developers (DelVecchio, 1999). The Port does not expect to borrow funds to support this development.8
Port expansion is projected to lead to over 5,000 new jobs in the airport and close
to 5,000 jobs in the maritime port.9 Job projections are not yet available for the real estate division.
7 A recent survey of short-haul independent operators in Seattle found that average hourly wages were about $8.50 (Farb and Tomescu, 1999). 8 Personal communication, Omar Benjamin, Director of the Port of Oakland’s Real Estate Division. 9 Personal communication, Ann Whittington, Strategic Planner, Port of Oakland.

Living Wages at the Port of Oakland 13
Current Port employment patterns
The process of transformation and growth described above has created many more low-wage jobs, while many well-paid, largely unionized jobs have been lost. Here we analyze the current employment and workforce profiles of Port leaseholders in more detail. We find a pattern of high wages in the maritime division, low wages in the real estate division, and a range of wages in the airport division.
This analysis is based on a survey carried out by the UC Berkeley research team. The survey was necessary because the Port does not maintain detailed information about the employment generated by their tenants. (See Appendix A for a detailed description of our survey methodology.) Our survey comprises all businesses that hold leases with the Port and draws upon a list of tenants provided to us by Port officials. Contractors are included only if they have a substantial on-site presence or are direct subcontractors of leaseholders. We excluded building contractors and professional services firms because they are unlikely to employ workers at less than Oakland’s living wage level. We did not include any port-related employers that were off-site, since they would not be covered by the proposed ordinance. We excluded employers with five employees or less, since Oakland’s Living Wage Ordinance exempts such employers.
After these exclusions, we obtain a total of 140 Port leaseholders who employ
about 11,400 workers (see Table 3-2a). These are the employers who would be covered by the proposed ordinance. In Section 4 we will analyze which of these employers would actually be affected by the ordinance because they currently pay low wages.
As Table 3-2a shows, the maritime division generates the highest average wages (about $32 per hour), but the lowest number of jobs, about 2,050. The real estate division produces slightly more jobs, but at much lower average wages, under $11. The airport is by far the biggest job generator, with 7,270 jobs, at average wages of $14.50. The wage differences among the Port's divisions correlate with widely different unionization rates. The maritime division is highly unionized, and the real estate division mostly non-union.
We provide a more detailed breakdown of employment, by economic sector rather
than port division, in Table 3-2b. The lowest average wage rates at the port are concentrated in the hotel, restaurant, parking, security and skycaps, and entertainment and personal services sectors.10
The Port's workforce is unevenly distributed across ethnicity, gender, and
residence. These patterns are presented in Table 3-3. About 54 percent of Port workers live in Oakland and about 35 percent are women. About 36 percent of Port workers are African American, similar to their representation in Oakland as a whole (US Bureau of the Census, 1990).
10 Since retail, restaurant, car rental and parking establishments are located in both the airport and real estate divisions, the sectoral breakdowns do not correspond to different port divisions.

Living Wages at the Port of Oakland 14
Average wages within Port divisions also vary by demographic group. Table 3-4 presents these patterns, weighted by the number of workers in each category. The wage gap between white and African American workers has been overcome only in the highly unionized maritime division. While overall average wages for African Americans are only slightly lower than for whites ($18.75 compared to $19.73), the wage gap is greater for the airport division ($10.96 compared to $15.80) and the real estate division ($8.88 compared to $12.53). The small number of women in the maritime division partly accounts for their low overall wage relative to workers as a whole.
A relatively small number of jobs and sectors account for most of the low-wage
employment. Table 3-5 illustrates the kinds of low wage jobs that exist at the Port. Prominent low-wage occupations include restaurant waiters, rental car agents, airport ramp agents, and entertainment and personal services.
In sum, the survey data tell a powerful story about the types of jobs that are
generated by the Port of Oakland. Clearly, the highly unionized maritime division provides the best-paid jobs for Oakland’s diverse (male) population. However, these jobs stand in sharp contrast to the many low-wage jobs created in the real estate and airport divisions. Without public policy intervention to affect the quality of jobs, the Port will continue to contribute to the polarized growth trajectory of Oakland and the region. Moreover, racial inequities will be perpetuated by this pattern of growth.

Living Wages at the Port of Oakland 15
4. The benefits of a living wage ordinance Enacting a living wage ordinance at the Port could change the mix of jobs and increase wages for the lowest-paid workers. However, such a policy will generate costs as well as benefits. In this section we present our best estimates of the benefits to workers, to employers and to governmental entities of a living wage ordinance at the Port. The benefits for workers are the pay and health coverage increases among workers employed by Port leaseholders, including the indirect pay increases that result from wage push. We discuss how different demographic groups would benefit from the living wage ordinance. Benefits to employers consist of reduced turnover costs and increases in worker productivity. Benefits to governmental entities include reduced demands upon public health facilities and increased income and payroll taxes. We present our estimates of the costs in the succeeding section. Our estimates of both benefits and costs are the most careful that can be developed from the available data.
Benefits to workers
We present the number of low-wage workers who will be affected by the living wage ordinance in Table 4-1. The first and second columns estimate the direct beneficiaries of the ordinance. The first column shows that about 1,750 workers currently earn less than the living wage ($8.30 per hour) and would thus become eligible for a wage and benefit increase. This increase would bring them up to $8.30 per hour with health benefits or $9.55 without health benefits. The second column shows an additional 815 workers currently earn $8.30, but do not receive full health benefits. They are eligible for an improvement in their health benefits or for an increase in their wage to $9.55 per hour. We assume, following the proposed ordinance, that health benefits cost employers $1.25 per hour worked.
Table 4-2 indicates the demographic composition of the workers who would benefit directly from the living wage ordinance. African Americans, Latinos and Asian Americans, comprise a disproportionate number of living wage beneficiaries because they are currently over-represented in low wage jobs. For example, as is shown in Table 4.2b, African Americans comprise 36 percent of all workers at the Port, but 41 percent of workers making less than $9.54 per hour. Whites are over-represented among higher wage workers who would not be affected by the proposed ordinance. Women are over-represented among low-wage workers. Oakland residents are also over-represented among the low-wage category, and thus will also benefit disproportionately from the living wage ordinance.
Following previous research, we estimate that those workers who earn between
$7.65 and $11.44 receive a wage increase due to the effect of a “wage push.” This effect occurs because employers tend to raise the wages of the next tier of workers when the lowest paid workers in a firm receive a wage hike. Employers do this in order to maintain some of the relative pay differences for those with longer service, more skills or responsibility, or other job-related factors. Studies of wage-push effects find that wage

Living Wages at the Port of Oakland 16
push pressure is generally confined to wage rates just above the floor wage (see Appendix B). To estimate this effect, we have drawn on research by Card and Krueger (1995), and followed the methodology used in the San Francisco living wage study by Reich et al (1999a and 1999b).
Table 4-3 summarizes the benefits for workers. About 2,600 workers will be
directly affected by an increase in wages and/or benefits; and an additional 550 workers will be affected due to the wage push effect, bringing the total number of beneficiaries to over 3,100 workers. Directly affected workers will experience, on average, an increase of $2.25 in their hourly wage, totaling an additional $4.7 million in wages and $3.3 million in health benefits each year (see Table 4.4). Indirectly affected workers will gain $1.16 per hour. The total indirect wage push for workers just above and below the living wage level amounts to a $2.1 million increase each year. These total benefits to workers add up to $10.1 million. The 3,100 living wage beneficiaries would comprise about 27 percent of all non-supervisory employees of Port leaseholders. In addition, employees in covered firms would receive 12 days paid leave per year.
Benefits to employers The living wage ordinance will increase worker pay, which frequently leads to
some savings for employers. We examine here two sources of such savings: the reduced employee turnover costs and the increased productivity that economists expect to occur when wages are increased. These benefits to employers from paying higher wages will offset some of the increased costs, especially among the lowest-paying employers, and it is useful to consider the amounts involved.
Our best data on potential savings concern turnover, which we obtained through
our employer survey. According to our summary calculations from the survey data, employee turnover at the Port averages about 25 percent per year, but it is nearly 20 percentage points higher among low-wage firms than among high-wage firms. A recent National Restaurant Association annual survey also found that turnover is about 20 percentage points lower in higher-wage establishments (Restaurants USA, 1999).11
Using the 20 percent expected decline in turnover, we calculated the savings in
turnover costs as follows. According to the findings in the previous section, we estimate that the proposed ordinance would create an average wage increase of about $2.05 for over 3,000 workers. Increasing pay from $7.50 to $9.55 is equivalent to an increase of about 27 percent. According to the current research literature, as summarized by Card
11 The same survey reports annual turnover rates among low-wage restaurants that are often in
excess of 100 percent (see also Card and Krueger, 1995). The reported turnover rates in our sample may understate considerably the true turnover, especially at low-wage firms at the Port. Some of the respondents may have misinterpreted the survey question on this topic and reported monthly rather than annual turnover statistics. For this reason, we do not present a table with the turnover data, and we use only the summary figures to generate an estimate of the savings that are likely if turnover were reduced. Our calculations do not depend upon the turnover level, only the reduction, and this figure is likely to be robust .

Living Wages at the Port of Oakland 17
and Krueger, this increase should reduce quits by an equal 27 percent. To be conservative, we use an estimate of 20 percent instead.
This reduction of 20 percentage points in turnover means that in a workplace of
100 people, there will be 20 fewer quits and consequently 20 fewer replacement hires will take place to keep the firm at the same size. Each quit that does occur generates a cost to the firm to replace the worker. This replacement cost consists of lost output while the vacancy has not been filled as well as the recruiting, interviewing, screening and training costs of filling the vacancy and then bringing the new worker up to speed. The training costs usually involve both formal and informal on-the-job training and take the time both of coworkers and the new workers. Replacement costs generally are a higher proportion of pay for occupations higher on the skill ladder, but an estimate of 20 percent of annual salary for each replacement is in the middle of a range for low-paid and unskilled jobs (Brown et al 1997). We use this figure of 20 percent as the replacement cost per replaced worker.
The firm's overall turnover costs consist of the replacement cost per replaced
worker multiplied by the number of replaced workers. If 20 fewer workers out of a workforce of 100 have to be replaced, the firm saves the replacement cost per replaced worker (20 percent) multiplied by the 20 percent reduction in the replacement rate, for a 4 percent saving of its labor costs. Since the wage bill usually amounts to 25 to 50 percent of business costs for these firms, a 4 percent saving on labor costs translates into a 1 to 2 percent offset to increased business costs. In other words, the 1.1 percent increase in business costs could be offset entirely by reduced turnover costs.
Productivity is also known to respond to wage increases, as recent economic
theory and research findings have emphasized (Freeman and Medoff, 1984; Katz, 1986). This research literature on efficiency wages identifies a number of possible channels through which wage increases generate productivity improvements. For example, higher wages can increase productivity through improved management incentives and efforts to utilize labor more efficiently and to economize on nonlabor inputs. Some of the increase can arise because new hires may come from a more experienced or skilled labor pool. Other productivity improvement sources that are associated with higher wage rates include lower employee supervision costs, increased morale and lower absenteeism and greater amounts of informal and formal training.
Improvements in productivity are particularly important in creating room for
firms to increase wages without having to reduce employment or profits or to increase prices. Whenever productivity growth occurs, by definition output per worker hour goes up. Also by definition, wage costs per unit of output are equal to wages per hour divided by output per hour. Consequently, wages per hour can increase at the same rate as output per hour without increasing wage costs per unit of output. Wage costs per unit of output are also known as unit labor costs. If unit labor costs do not increase, firms can maintain profit margins without increasing prices.

Living Wages at the Port of Oakland 18
Without much more data than are available, we cannot quantify the magnitudes of these effects for firms at the Port. We do know that labor productivity improvements have averaged 2 percent per year in the nonfarm private economy over the past 4 years. An older literature (reviewed by Freeman and Medoff, 1984) showed that firms experienced even greater productivity increases when unionization created a one-time shock to pay of 20 percent or more. More recently, when minimum wages in California went up by 27 percent in 1988 and by 35 percent in 1996-98, low-wage sectors such as restaurants and retail did not experience declines in employment and their prices did not increase faster than overall inflation. In the current era of rapid technological change associated with the computer and the Internet, many establishments have been able to achieve cost reductions in purchasing of supplies, management of records and a host of other improvements. These cost reductions have occurred in low-wage sectors such as restaurants and would be further accelerated by pay increases.
Benefits to governmental entities
The proposed living wage ordinance will also have some impact on public
finances. In general we find that these effects will be positive but small. The public sector will collect more revenue as a result of the proposed ordinance, and will contribute less to various subsidy programs.
Increasing pay will mean that the Federal and state governments will collect higher payroll and income tax revenues. We estimate that employers will pay an additional $1 million in payroll taxes (see Table 4-4). This amount includes social security payments, and training, disability and unemployment insurance levies. Individual employees will also pay higher taxes, and/or qualify for a smaller Earned Income Tax Credit. We have not calculated the changes in individual tax payments since we do not have data on the household and tax status of employees.
Public agencies will see savings as some low-wage workers reduce their usage of various public assistance programs. The main decreases probably involve reduced usage of county public health services and reduced food stamp usage. We have not attempted to estimate the reduced food stamp usage since we do not have data on the household characteristics of employees or on program uptake rates. We can, however, indicate the order of magnitude of the impact on the public health system.
Using data provided by the Alameda County Health Department and the state's
Medically Indigent Care Reporting System, we estimate that indigent health care currently costs Alameda County approximately $160 annually for each person who does not have private insurance or HMO/prepaid plan. Since we have estimated that the Living Wage Ordinance would extend health benefits to at least 1,550 currently uninsured people, the County's public health savings could amount to some $250,000 per year. This relatively small financial impact is likely to be felt as a positive reduction in waiting times and in the burden on over-worked public-sector health care providers.

Living Wages at the Port of Oakland 19
5. The costs and affordability of the proposed ordinance In this section we examine the increased costs to Port leaseholders and the portion of these costs that are likely to be passed on to the Port of Oakland or to consumers. We begin by presenting our estimates of the aggregate costs of complying with the proposed ordinance, in both absolute dollars and relative to the magnitude of Port businesses. We then examine the distribution of those costs among Port divisions and economic sectors. We also consider the impact of higher pay upon employment trends at the Port.
To analyze the affordability of the proposed ordinance we focus on how many firms in each sector would experience cost increases of different magnitudes. We can then consider how the costs might be shifted and borne by the various parties. Finally, we address whether Port firms would lose business or leave the Port and whether other firms would be deterred from locating on the Port because of the proposed ordinance.
Costs to employers
A first approximation of the total cost of the proposed ordinance is equal to the direct and indirect wage and benefit increases documented in the previous section. These costs are shown in Table 5-1. The cost of bringing wages up to $8.30 an hour is about $4.7 million, the costs of providing more health care coverage is $3.3 million, the costs of paying an indirect wage push is $2.1 million, and the costs of paying 12 days of paid leave is $2 million. These costs add up to a total of $12.1 million. In addition, employers must also pay an additional $1 million in payroll taxes, bringing the total cost of the proposed ordinance to about $13 million. To put this figure in perspective, we have computed the cost as a percentage of the total wage bill that Port leaseholders paid to their workers and as a percentage of the business revenue received by the leaseholders. As Table 5-1 indicates, our calculations show that enacting the living wage ordinance would increase leaseholders’ aggregate wage bill by 4.4 percent and that the increase would constitute 1.1 percent of their current revenue. These aggregate figures indicate that the overall cost increases could be absorbed relatively easily. However, the costs of complying with the living wage ordinance will be felt unevenly, and some sectors will experience smaller impacts than others.
We present the distribution of the costs by Port division and economic sector in Table 5-2. As Table 5-2a shows, the maritime division would bear less than $2 million of the cost and the airport and real estate divisions would each bear close to $6 million. To place these absolute dollar amounts in context we also present the increases as percentages of the relevant leaseholders' wage bill and business revenue. Using this yardstick, the real estate division, with an increase equivalent to 14.4 percent of the wage bill and 4.3 percent of revenue, would be most affected by the proposed ordinance. The effect on the airport would not be as great: 4.9 percent of the wage bill and 1.5 percent of

Living Wages at the Port of Oakland 20
revenue. The effect upon the maritime division is nearly insignificant: 1.2 percent of the wage bill and 0.25 percent of business revenue.
Table 5-2b presents a breakdown in the costs of complying with the living wage
ordinance by economic sector. Several activities and industry sectors account for the lion’s share of low-wage workers, and therefore of the costs of the proposed ordinance. The sectors that would experience a cost increase greater than 10 percent of their business revenues are airport security, airport curbside assistance, and entertainment and personal services. Restaurants, hotels, warehousing, retail stores, car rental agencies and parking lots all would experience smaller, but significant, increases in costs.
Costs to workers Economics students are taught that the quantity of labor demanded by firms goes
down when the price of labor goes up. Much of the evidence for this prediction comes from past studies of minimum wage increases, which reported declines of about one to three percent in employment for each 10 percent increase in the minimum wage. However, more recent studies have found no measurable decline in employment resulting from minimum wage increases, even when they were comparable in percentage terms to the increases that the living wage ordinance would generate (for a survey, see Card and Krueger, 1995). When studies did find employment reductions, they tended to be concentrated among teenagers.
The relevance of the minimum wage literature for the proposed ordinance is only
suggestive, since the pay rates considered here are at higher levels and are greater in absolute terms. Nonetheless, the recent studies indicate that employment reductions are likely to be much smaller than is often considered. The earlier literature neglected to examine the savings in turnover and the increases in productivity that permit wage increases to occur without employment declines. The Port has smaller than average rates of teenage employment, even in the commercial real estate division, which also mitigates employment effects. Finally, since employment at the Port is projected to grow in coming years, we do not expect employment declines to result from a living wage ordinance, although there could be a small decline in the rate of growth of employment.
Affordability We have estimated that enactment of the proposed living wage ordinance would
cost about $13 million in the aggregate. To put this figure in perspective, it amounts to about 8.5 percent of the overall revenue generated by the Port in 1998 (Table 5-3), and 1.1 percent of Port leaseholders' annual revenue. It is also equivalent to the Port's biennial growth rate in revenue over the past five years.
Another perspective on the affordability of a living wage ordinance relates the
cost for each of the port's divisions to the business done per customer in each division. These comparisons indicate that living wage costs are equal to 59 cents per passenger departure at the airport, 6 cents per ton of containerized cargo at the Maritime Port, and

Living Wages at the Port of Oakland 21
66 cents per visitor to Jack London Square. These figures, while small, are not definitive, as we have not yet considered who would actually bear these costs. Nonetheless, their modest size suggests that enacting a living wage for the Port of Oakland could have a minimal financial impact on the Port while benefiting over 3,000 low-wage workers and their families.
For a fuller affordability analysis, we supplement these aggregate costs and the
costs per customer figures with a more analytical discussion and examine the affordability issues separately for each of the Port's divisions.
The logical place to begin the analysis is with the firms. To simplify the analysis, we first consider the proportion of firms that would experience little or no direct cost impact from the proposed ordinance and we then turn to the firms that would experience a greater impact. Based upon our survey data and as reported in Table 5-4, 43 percent of all the firms at the port would experience a direct impact that amounted to less than 1 percent of their business revenue. About 14 percent of firms would experience an impact greater than 1 percent but less than 3 percent of business revenue. For this combined 57 percent of the firms, we expect that reductions in turnover costs and normal productivity improvements alone would mean that the firms could offset the entire cost without reducing sales, employment or profits.
A second group in Table 5-4 consists of firms that would experience moderate cost increases. We estimate that 21 percent of the firms would have increases of more than 3 percent but less than 6 percent and that 9 percent would see increases between 6 and 10 percent. A combined 30 percent of firms thus falls into this second group.
Finally, some firms in Table 5-4 would see higher cost increases. About 12
percent of the firms would experience an increase of between 10 and 15 percent of their costs. Only one firm would face a cost increase over 15 percent; as we discuss below, this firm is a subcontractor to the airline companies.
We turn next to considering the likely behavioral response of the firms, separately
by port division and economic sector, limiting the discussion to the firms with moderate or greater costs.
Affordability at the Airport
As mentioned, the aggregate cost of the proposed ordinance at the airport amounts to $0.59 per departing passenger. This cost to pay for the living wage will not affect airport demand. Even if passengers were to absorb the entire increase, they would not choose to fly out of another airport to avoid paying this minor expense. The costs to the Airport Division of the Port consequently will be small.
At the airport, the major sectors are the airlines themselves, airline servicing,
airport security and curbside assistance, parking, car rental and retail. Of these, the airline companies generally face very small direct cost increases, under 2 percent in Table 5-1b. This sector consists of very large companies that can absorb these costs easily. Southwest

Living Wages at the Port of Oakland 22
Airlines, the Oakland Airport’s largest airline and second highest revenue source, accounts for nearly 13 percent of all the airport’s revenue. Southwest has had significant growth in recent years as net income in 1998 increased to $433 million, up from $207 million in 199612. Oakland’s second largest airline, United, had net earnings in 1998 of $6.83 billion, up from $5.06 billion in 1996. The airline service sector (fuelers, cabin cleaners, caterers, baggage handling) generally faces slightly higher costs increases of 1.2 percent of business revenue (see Table 5-1b). These costs are distributed unevenly, but are never greater than 6 percent per firm. The cost increases for these firms presumably would be passed on to the airlines themselves. Some of the firms in this sector are also large. For example, LSG Sky Chef has annual sales of $1.6 billion and is owned by Lufthansa, the German airline company.
The same pattern of small increases applies for airport security. Most of the employment in this sector is for baggage screeners. Again any increased costs are likely to be passed on to the airlines. If the Port pays a security company for overall guard service, it should be possible for the Port to easily pass increased costs to the airlines as well. For example, the landing fees the Airport charges to airlines currently are much lower than for other leading airports: one-half lower than at LAX and one-third lower than at SFO (Reich and Hall, 1999b).
The biggest cost increase-- 40 percent of business costs-- in our sample is for a
firm that provides curbside and wheelchair assistance. This firm operates as a subcontractor for the airline companies. Although the cost increase to the firm is substantial, insofar as the organization of work does not permit improving productivity, the firm is likely to pass its increased costs to the airlines, who have a much greater ability to pay. The cost for the airlines would constitute a minimal increase of 1 percent or less. Whether the full cost increase would in turn be passed onto airline passengers and to cargo customers is difficult to determine. Although a partial pass-through is more likely, even a full pass-through would not be noticeable to the airlines' customers.
The other low-wage workers in the Aviation Division are located primarily in car rental, parking and restaurant sectors. Six car rental companies operate at the airport: Alamo, Avis, Budget, Dollar, Hertz, and National. Half of the rental companies in our sample would experience a cost increase of just over 1 percent, an easily-absorbed amount. One company would experience a 4 percent increase, which is also easily affordable. Each of the car rental companies is a well-known national corporation. For example, the parent company of National Car Rental, one of the largest car rental employers, had revenues of nearly $10 billion in the first six months of 1999 alone. National Car Rental sales at the Oakland location are over $10 million per year.
Many of the other low-wage employers at the airport are likely to have a significant ability to pay. Such firms include Huntleigh and ABC Security. Huntleigh Corporation has sales of over $5 million per year.13 ABC Security has annual sales in
12 Company revenue details provided in this section are drawn from the American Business Directory. 13 This is the figure for the Los Angeles office.

Living Wages at the Port of Oakland 23
Oakland of over $5 million. California One Services has subsidiaries or branches at 17 other airports. At most of these they have a very similar presence to Oakland: $1-2.5m sales and 50-99 employees.
The implementation of the proposed ordinance at the airport would not occur in a
single year. Since the air passenger license and temporary use agreements typically are renewed annually, the Airport has significant flexibility in setting rates and it is not locked into long-term contracts. Consequently, without long lease durations in the way, the implementation of a living wage ordinance could take place rather quickly for this group of airport workers. But the rental car, air cargo, air maintenance, and restaurant and bar facilities typically have long-term lease agreements. For these sectors, the implementation of an ordinance is likely to take place over time. Such a phase-in implies that the costs per year would also be phased in over time.
In summary, only a few firms at the airport will actually have significant cost increases. Demand for departures from Oakland is not likely to be affected by a 59 cent increase. Airline services will be able to pass on increases to the airlines, and the airlines will be able to pass on increases to their customers. Many of the firms at the airport have a high ability to pay a living wage. The revenue implications for the Airport consequently are minimal and should not affect any bond-financed expansion costs.
Affordability at the Maritime Division
The impact of a living wage on the Maritime division will be significantly less
than in the other divisions. According to Table 5-1a, the cost will be $1.68 million, equivalent to 0.25 percent of business revenue. As is shown in Table 5-1b, the impact within the maritime division upon maritime shipping activities themselves is 0.02 percent, which is essentially zero.
The impact on trucking and warehousing within the maritime division will be
larger, about 4.2 percent of business revenue. Some of the trucking companies that will experience a cost increase are large firms that may be able to pay higher wages. For example, according to publicly available business sources, Pacific America, a trucking company and a major employer in the Maritime Division, has over $5 million in sales.
From our survey (but not reported in the table), we know that the bulk of the costs
of enacting the living wage will be carried by non-maritime businesses that are located on maritime port land, such as a car rental agency and a restaurant.
In summary, taking all the sectors within the maritime division into account, the
overall costs are so small and the pass-through and impact upon the firms' revenue is likely to be even smaller. Consequently, there should not be much impact upon the Port's revenues or bond ratings.

Living Wages at the Port of Oakland 24
Affordability at the Real Estate Division .
The affordability issues at the Real Estate Division are somewhat different from those at the Airport and Maritime Divisions of the Port. First, the overall percentage cost increase is larger: 4.3 percent of business revenue. Second, many of the activities at the port are more subject to competition from nearby businesses. Location at the airport and the port is essential to most of the activities there, so the issue of competition with offsite businesses that pay lower wages is small. At the waterfront, offsite competition is a greater issue. Nonetheless, location of restaurants and other retail businesses at the waterfront provides them with competitive advantages: scenic views, city and port-supported infrastructure created by previous public investment, and a critical concentration of retail businesses. Whether this premium is sufficient to offset the cost increases is the principal issue.
The Port's revenue from the real estate division is also much lower than in the
other two divisions. Not counting the revenue growth related to Oakland Portside Associates, operating revenue in the commercial real estate division has hovered at about $10 million in recent years, or one-seventh of the operating revenue in each of the other two divisions. More disturbing, the real estate division has been losing money. Its net operating income has been negative, even before taking depreciation and interest expenses into account (Table 5-3). Any possible reduction in rents in this division consequently generates a great affordability concern for the Port.
Our findings suggest that most of the firms that would be significantly affected by
the proposed ordinance are concentrated in the real estate division. Except for about a dozen of these firms, the impact is less than 10 percent of their business costs. To examine whether the Port location provides a corresponding premium, we examined prices charged by businesses at Jack London Square to others at nearby locations.
Businesses on Port-owned land do charge more for their services than in nearby
locations, presumably because of the locational advantages. For example, the Motel 6 on Port property is 18 percent more expensive than the Motel 6 adjacent to Port property. Additionally, the Airport Hilton, the Waterfront Plaza Hotel, and the Embarcadero Executive Inn charged on average 32 percent more than hotels immediately adjacent to Port property. Compared to similar hotels in surrounding cities, the three hotels on Port property charged 6 percent more.14
For another comparison, we sampled the prices of restaurants in and near Jack London Square. Comparing similar menu items, we found that restaurants on Port land charge on average 16 percent to 30 percent more than restaurants in the surrounding area.15 These differences are greater than the cost of the proposed ordinance to
14 Comparable hotels are Radisson, Clarion Suites, Four Points Hotels-Sheraton, and Holiday Inn in the Berkeley Marina, Lake Merritt, and Emeryville respectively. 15 We compared prices at five restaurants in Jack London Square with prices at five restaurants in the surrounding area. The methodology involved comparing menu prices among the restaurants for both the least expensive seafood and the cost of dinner with the seafood entrée and a caesar salad.

Living Wages at the Port of Oakland 25
restaurants. They suggest that an increase in costs of 66 cents per customer is affordable without hurting revenue.
Some of the employers in this division are large and profitable companies with a regional or national presence. Potentially affected companies leasing property from the commercial real estate division include Best Western, Motel 6 and the Old Spaghetti Factory. Best Western is an independently owned member of Best Western International, whose hotels had sales in 1998 of $70 million. The Motel 6 on Port property has sales of over $1 million per year while the Motel 6 not on Port property has sales of less than $1 million. The Old Spaghetti Factory has annual revenues of between $2.5 and $5 million and is part of a private company with over 40 total restaurants and $54.6 million in sales. Vacancy rates at Jack London Square are currently low, which supports recent publicity suggesting that retail establishments at or near Jack London Square are facing increasing market rents. The rent increases reflect the success of local economic development and again indicate that a living wage ordinance can be absorbed by this sector. Indeed, cost increases as a result of rising rents may well dominate any labor cost increases in coming years. It does not seem likely that businesses would be deterred from locating at Jack London Square in such an environment. In summary, the cost increases for leaseholders in the commercial real estate division are greater than in the other divisions, but are below 10 percent of current business revenue for all but a dozen firms. Even without taking into account the likely business savings due to lower turnover costs and higher productivity, most firms should be able to adjust to the higher labor costs without reducing their workforce or relocating from the Port. Of the dozen firms with greater impact, most will be able to pass on increases to consumers without hurting sales.
In a context of rising rents near Jack London Square, the firms that are most affected are much more likely to increase prices than to obtain reductions in the rent they pay to the Port. Firms that are less affected are also not likely to obtain rent reductions. We conclude that Port revenues in the commercial real estate division should not decline significantly as a result of the proposed ordinance.

Living Wages at the Port of Oakland 26
6. Conclusion
The Port of Oakland is Oakland’s largest public asset and is one of the most important generators of jobs in the City and its environs. In the past, work in the maritime industry provided substantial numbers of well-paid jobs, which provided a path to the middle class for many Oaklanders, especially for African Americans, who currently comprise 50 percent of the Port’s longshore workers.
In the future, however, the greatest job growth will occur in the airport and real
estate divisions, not the maritime division. The lowest average wage rates at the port are concentrated in the hotel, restaurant, parking, security and skycaps, and other services sectors. These sectors are all part of the growing airport and real estate divisions, where we see both lower average wages and higher wage disparities between whites and people of color.
Without public policy intervention to affect the quality of jobs, the Port will continue to generate large numbers of jobs for Oakland and the region, but many of these will be low-wage jobs. Moreover, racial wage disparities will be perpetuated by this pattern of growth.
Enacting a living wage ordinance at the Port of Oakland would help increase the
incomes of 3,100 low-wage workers. The average affected worker will see an increase in income including health benefits of $2.06 per hour. Employees will also get paid leave.
The costs of the proposed ordinance are about $13 million and comprise only
about 1 percent of Port leaseholders' business revenues. The maritime division would experience only a very small increase in cost, with shipping activities essentially unaffected. Cost increases in the real estate and airport divisions would constitute about 4.3 percent and 1.5 percent of leaseholders business revenues, respectively.
For the airport, this amounts to $0.59 per departure, certainly not enough to
change passenger preference for flying out of Oakland. Low wages are concentrated in a few firms, many of whom are subcontractors to the major airlines. Since they provide essential onsite services, they will be able to pass most cost increases to the airlines, who can easily absorb them and/or pass them on to passengers.
For the real estate division, the increase in wages and benefits amounts to $0.66 per visitor to Jack London Square annually. The increase in costs to the affected restaurants and hotels is smaller than the premium they get for locating near the waterfront and in Jack London Square, compared to similar businesses in less desirable locations. With business growing in the area, the small increase in costs should not affect the overall business climate.
We conclude that the increased wage bill costs can be absorbed by the Port's leaseholders, visitors to the waterfront and passengers at the Oakland airport. Businesses

Living Wages at the Port of Oakland 27
should not be driven away, Port revenues should not go down and bond ratings for the Port should remain unaffected. The overall effects of a living wage ordinance-- considering the benefits and as well as the costs-- should be to redirect economic growth at the Port toward the more equitable path that it had sustained in previous decades.
.
Living Wages at the Port of Oakland 28
Appendix A: Survey method and data sources
The primary data source for the Port of Oakland study was a telephone and in-person survey of Port leaseholders and their on-site subcontractors that we conducted in the spring and summer of 1999. Where necessary, we collected supplementary data from a variety of official sources. This appendix discusses the sample universe, sample realization, weighting, estimation procedures, survey methodology, the survey instrument and the supplementary data.
Sample universe and realization
The universe – the list of all firms that are tenants of the Port of Oakland - for the sample survey was generated from the following sources. First, we obtained a list of tenants compiled by the Government Affairs Division of the Port of Oakland. When it became clear that some gaps existed in this data source, requests were directed at the Real Estate and Airport Divisions for further information. Their responses to our requests provided the second source of information. Third, we conducted field visits to complete the universe, in particular to complete the lists of sub-tenants at 80 Swan Way, Embarcadero Cove and Jack London Village and subcontractors such as security and skycap firms at the airport.
From these sources, we generated a list of leaseholders of the Port of Oakland. After duplications, name changes and other sources of error had been identified and corrected or removed, we were left with a list of 278 firms.
We attempted to survey all 278 firms on the list and continually monitored progress in order to ensure a balanced sample realization across port divisions, sectors and geographic areas. Our interviews revealed that 30 firms were no longer tenants of the Port, leaving a total of 248 firms in our universe. About one-third of the firms were not surveyed because they refused to answer our questions or were not traceable. Table A-1 shows the sample realization results.
Weighting procedure
The 168 surveyed tenants / service contractors of the Port of Oakland employ some 9,518 people (both managerial and non-managerial). When data from the American Business Directory for unsurveyed firms is added to this, the total estimated employment at the Port of Oakland is 13,787. The gap between these figures is explained by the fact that we successfully surveyed 68 percent of the possible firms. To adjust for this discrepancy, we weighted each surveyed firm.
The goal of weighting is to determine how many actual firms or employees is represented by each surveyed firm or employee. We generate a factor by which to ‘expand’ each surveyed firm and employee to generate the actual number of firms and employees. Following standard sample survey methodology, we tried to increase the

Living Wages at the Port of Oakland 29
accuracy of our weighting (or expansion) factors by comparing apples with apples. For example, a restaurant in the airport should not be taken to represent a trucking firm in the port.
Thus, in the weighting procedure, we used 11 industrial classes (construction, manufacturing, truck, maritime, air, retail, restaurant, finance and related, hotel, services and other) and 7 port regions (Hegenberger, Airport, Embarcadero, Jack London Village, Jack London Square, Port). This means, for example, that each surveyed retail worker in Jack London Square is taken to represent 1.25 actual retail workers in Jack London Square. The weights thus vary by sector and region, thus minimizing the errors in the weighting process.
Once the weights had been applied, we estimated that there were 13,010 people working in the Port of Oakland. This is only slightly lower than the estimate that includes ABD data. Once managerial employees, and those working for firms employing fewer than 5 people are excluded, we are left with 11,430 people. These are the workers who would be covered by a Living Wage Ordinance.
Our overall employment estimate compares well with a combination of employment estimates derived from the Martin Associates (various dates) reports for the Real Estate, Airport and Maritime Port Divisions. This data source is out of date – the reports are dated from 1992 to 1997 – and includes all employment related to port activity, regardless of whether it is on Port property or not. However, a realistic estimate of on-site employment from this source ranges between 11,000 and 18,000.
The reported number of firms is also affected by weighting. The 123 surveyed firms that employ one or more non-managerial worker represent 174 firms when weights are applied. Of these, 140 have five or more employees (see Table 3.1). The 45 surveyed firms that have no employees represent 74 actual firms. Thus the weighted number of firms equals the universe of 248 firms.
Questionnaire
The questionnaire for the survey was designed and pilot-tested with restaurant and retail sector employment as the primary target. With minor modifications we made it applicable to other employment sectors. Survey interviews took between 10 and 20 minutes, depending on the number of job titles in the firm. Questions were directed only towards the employment at the establishment on port property (or on employment linked to port-related service contracts) and not the entire firm.
The first section of the questionnaire dealt with the employment profile of the workforce in terms of job permanence, demographic characteristics, unionization levels and benefits. In order to reduce the length of the questionnaire, these questions were applicable only to the non-managerial workforce, and thus demographic profiles per job title / occupation are estimates.

Living Wages at the Port of Oakland 30
In the second section of the questionnaire, information was collected on each non-managerial job title. This included the number of people with the job title, minimum educational and other qualifications, and starting and average pay. In one-third of all job titles, the average wage was not provided, requiring supplementary information (see below).
The third section of the questionnaire dealt with the recruitment and training practices of the establishment. The questionnaire concluded with two very sensitive questions - the revenue and labor share of business costs - questions which most respondents would not or could not answer.
Supplementary data
Given these and other gaps it became necessary to supplement the survey data in four ways. First, we used the American Business Directory to identify the location, sector, employment and revenues of 190 of the firms. This information helped us to complete the sample universe, to identify potential respondents, to fill information gaps in the interviews, for purposes of weighting the sample, and to check the survey-based total employment estimate.
Second, as noted above, in about one-third of (119 out of 360) job titles surveyed we were not provided with average wage data. To fill this gap, we searched for comparable job titles in comparable firms within the sample, and where appropriate used this source. This filled 34 of the missing average wage rates. In a further 42 cases, we had been provided with the starting wage but no average wage. We multiplied the starting wage by a factor of 1.559 in the case of unionized job titles, and 1.341 in the case of non-unionized job titles to estimate average wages. These factors were generated from the available survey data, and reflect the fact that tenure-based pay increases are larger for unionized than for non-unionized workers. Finally, in 33 cases we were able to fill the average wage gap using average wage data for the 1997 Occupational Employment Series for the Oakland Primary Metropolitan Statistical Area. This left 10 job titles for which we were unable to generate an average wage.
Third, most of the firms employing members of the ILWU (i.e., stevedores and terminal operators) were unable to provide information on the number of longshoremen and clerks they employ, and their pay and benefit scales. This employment is distinguished from other (generally administrative) employment within such firms, and for which we generally were provided full information. In order to complete this component of employment by port tenants, we collected wage and demographic information from the Pacific Maritime Association and from Lawrence Tiebout, the President of ILWU Local 10, and his staff. Although this data is subject to inaccuracy because the San Francisco ILWU hiring hall covers the entire Bay Area, wage rates for these workers are all above $20 per hour. Thus this supplementary data will not bias estimates of the cost and benefit of a Living Wage Ordinance.

Living Wages at the Port of Oakland 31
Fourth, we extracted microdata from the March Supplement of the Current Population Survey for 1996-9 for the Bay Area Statistical Area. This data provided hourly wage data for the entire Bay Area, for Alameda County and for the City of Oakland.
We also used this data source to supplement our health benefit coverage information. In the questionnaire, we did not distinguish whether employers or employees paid for health coverage, and thus we could not use our survey data to estimate this aspect of the impact of a Living Wage Ordinance. For each job title, we estimated the value of health benefits paid by the employer for each job title based on the average health coverage rates for similar job titles and sectors in the Bay Area.

Living Wages at the Port of Oakland 32
Appendix B: Supplementary wage calculations
This appendix is devoted to two technical issues in the study. The first issue concerns the impact on wage scales within a firm when the lowest paid workers receive a wage increase. We discuss our methodology and assumptions for estimating these so-called wage push effects of the proposed living wage ordinance. The second issue concerns tip income. Our discussion highlights the complexities of this issue, although our estimates indicate that including a tip credit in the proposed ordinance would make little difference in the aggregate.
Wage push calculations Although the proposed ordinance mandates pay increases only for workers who are paid less than $8.30 per hour, it is reasonable to ask whether employers would feel pressure to raise the pay of other workers as well. Such wage push pressure would be expected to arise primarily from workers whose wages fall just above the living wage level, since most pay comparisons involve workers in closely related job classifications. Pay increases might be required in order to maintain relative pay differences for those with longer service, more skills or responsibility, or other job-related factors. These indirect effects, which we have called “wage push,” have also received such labels as “wage creep,” “ripple effects” and “wage contour effects”. An accurate accounting of such increases depends upon our knowledge of the rigidities and flexibilities of the occupational wage structure. The current state of such knowledge is imperfect. Although relative wage structures have compressed in the past, notably in the 1960s and 1970s, in more recent decades they have widened. In the past three years they have stabilized and in some instances have narrowed. A large literature by economists has debated the relative importance of market-based and institutional-based causes of these patterns. Nonetheless, we can draw upon recent experience with minimum wage increases and with living wage ordinances in other cities to develop some reasonable estimates.
The best wage-push analysis of minimum wages is by Card and Krueger (1995), who examined the impact of minimum wage increases upon the pay of above-minimum workers. They found that the indirect effects did indeed concentrate at just above the new minimum. The percentage pay increase for those just above the new minimum averaged less than half of what the workers at the old minimum received. In other words, recent minimum wage increases have led to some compression of the wage structure.16 This compression is not surprising in historical perspective, since wage inequality in the 1990s has been higher than at any other period since the Bureau of the Census began collecting reliable data in 1947.
16 Sachdev and Wilkinson (1998) obtain similar findings for the United Kingdom. Both studies find negligible adverse employment effects. See also Reich (1999).

Living Wages at the Port of Oakland 33
Card and Krueger’s results do not apply directly to a living wage ordinance, but they are very suggestive. Since the increases contemplated by the ordinance are greater, in percentage terms, than the minimum wage increases studied by Card and Krueger, the indirect effects may also be greater. On the other hand, minimum wage increases apply to all low-wage workers in the labor market, while living wage ordinances apply only to a small percentage. Consequently, the indirect effects may be restrained by larger labor market forces and could be somewhat smaller. These two considerations work in opposite directions and probably cancel each other.
It therefore seems reasonable to translate Card and Krueger’s findings as suggesting that if the largest wage increase at the Port of Oakland were about $4 per hour, an increase of up to $2 per hour might occur for workers currently paid $9.55 per hour. The total wage bill would not go up proportionately, however, because there are fewer workers at the more skilled and supervisory levels that receive higher pay.
Using the underlying survey data on the proportion of workers at each pay level,
we have assumed that each worker currently earning between $7.65 to $9.55 would actually receive $10.03 per hour after the Living Wage is implemented. We have also calculated the cost of bringing all workers who are currently paid between $9.55 and $11.44 up to $11.45. We estimate that these indirect wage gains could amount to $2.2 million for employees of Port tenants.
Tip income calculations
The impact of the Living Wage Ordinance depends in part on how tip income is treated. This is a complicated issue that can become a source of controversy. In this appendix we present and discuss our findings in the interests of a more informed debate on this topic, without making a specific recommendation for dealing with tip income. We show that the overall impact of a tip credit would be relatively modest, although it may be important for specific sectors or employers.
Tips constitute an important source of income for employees in various service-sector occupations. In the Oakland Port context, over 1,000 restaurant workers, skycaps and parking valets may earn up to half their income in tips (see Table B-1). For this reason, employers may resist increasing the wages of workers who earn above the living wage level when tips are taken into account. A solution to this problem may be to estimate the value of tip income earned by each employee and allocate this as a tip credit.
However tips are by their nature highly irregular, prone to under-reporting and often inequitably distributed. These features make regulation very difficult and could in restaurants create great inequities since not all employees collect tips directly. Bussers, cleaners and cooks only receive tip income where a pooling system operates. Tips also vary considerably across different restaurants, and workers in fast-food and cafeteria-

Living Wages at the Port of Oakland 34
style restaurants generally do not receive tips.17 Enacting and enforcing an equitable tip credit system would be very complicated, and the impact on costs would be modest.
We estimated the value of tips for certain categories of workers. In the case of waiters, bartenders and cocktailers, we assumed that tips added a further 70 percent to an individual’s wage. We based this estimate on interviews with restaurant workers and a review of the limited literature on this subject. For other restaurant workers, including bussers, food preparers and other employees, we assumed that tip income would increase an individual’s earnings by 10 percent. This amount takes account of the tip sharing that occurs in some establishments. For skycaps and parking valets at the airport, we assumed tips to value of $2 per hour. This assumption was based on interviews with airport workers. In the report, wage data and estimates of the costs and benefits of a Living Wage Ordinance are generally presented without including tips as income
Table B-2 shows that the number of workers benefiting from the Living Wage Ordinance would only fall marginally with a tip credit – from 3,100 to 3,050. This small effect occurs because the estimated value of tip income brings most employees closer to the living wage level without taking them above it. However, the average hourly wage increase per worker falls from $2.06 to $1.67.
A tip credit would result in a decrease in the annual cost of the proposed ordinance of almost $2 million (see Table B-3). Most of this decrease – some $1.5 million - occurs within the restaurant sector. The decrease in costs for the Security and Curbside Assistance sector is small in absolute terms, but it is relatively important since it represents 10 percent of the wage bill in this sector.
17 The 1988 bill to raise the California minimum wage originally contained a tip credit, but this provision was eliminated by a court decision.

Living Wages at the Port of Oakland 35
Acknowledgments and author biographies We would like to thank officials at the Port of Oakland for providing the list of leaseholders and other information. We also thank the California Policy Research Seminar and Senator Don Perata for their support of this project. Finally, we appreciate the assistance of UC Berkeley students in the Spring 1999 Economics 153 class for their enthusiastic interviewing of employers. Carol Zabin is a labor economist at the Center for Labor Research and Education in the Institute for Industrial Relations at UC Berkeley. She received her Ph.D. in Economics from UC Berkeley in 1990. She has previously held faculty positions at Tulane University and UCLA. She has published numerous articles and reports on labor markets, immigration and other subjects. She is the author of two other reports on living wage ordinances in California.
Michael Reich is Professor of Economics at UC Berkeley and Director of the Center on Pay and Inequality at the Institute of Industrial Relations at UC Berkeley. A specialist in labor economics, he has published dozens of scholarly articles and nine books, including Labor Market Segmentation; Racial Inequality; Social Structures of Accumulation; and Work and Pay in the United States and Japan. He received his Ph.D. in Economics from Harvard University in 1974, has served as Editor of the scholarly journal Industrial Relations and as Research Director of the National Center for the Workplace. In 1999 he was lead author of two reports on the proposed Living Wage Ordinance in San Francisco.
Peter Hall received a M. Sc. from the London School of Economics in 1995 and is also a graduate of the University of Cape Town in South Africa. He has worked as a research consultant and in local government economic development. He is currently a Ph.D. candidate in City and Regional Planning at UC Berkeley.
Melanie McCutchan is a 1999 UC Berkeley graduate. She co-authored a student report on the proposed Living Wage in Richmond, California. Christopher Niedt is a Ph.D student in Geography at UC Berkeley. He received a BA degree from Johns Hopkins University. He has worked as an economic development consultant and was lead author of a report on the Baltimore Living Wage ordinance. Egon Terplan is a graduate student in City and Regional Planning at UC Berkeley. He received a B.A. from Swarthmore College and has worked as a trade union researcher and organizer, and in local government.

Living Wages at the Port of Oakland 36
References: American Business Directory (ABD). Commercial CD-ROM directory of company information, accessed UC Berkeley Libraries 1999. Bay Area Economics, 1999. 7th Street / McClymonds Neighborhood Improvement Initiative: Community Plan. Consultants report submitted to the William and Flora Hewlett Foundation, Bay Area Economics. Brown, Clair, Yoshifumi Nakata, Michael Reich, and Lloyd Ulman 1997. Work and Pay in the United States and Japan. New York: Oxford University Press. Card, David and Alan B. Krueger. 1995. Myth and Measurement: the New Economics of the Minimum Wage. Princeton, NJ: Princeton University Press. California Budget Project, 1998. Unequal gains: the state of work in California. California Budget Project: Sacramento. California Budget Project, 1999. Making Ends Meet: How much does it cost to raise a family in California. California Budget Project: Sacramento. CB Richard Ellis. 1999. Oakland-East Bay Real Estate, First Quarter 1999. National Real Estate Index. City of Oakland, 1998. “Implementing Rules and Regulations of the Living Wage Ordinance”. Agenda Report from the Contract Compliance Division, June 16. Daly, Mary and Royer, Heather. 1999. “Who has benefited from California’s recovery?” FRB-SF Economic Letter no. 99-26, 3 September. San Francisco: Federal Reserve Bank of San Francisco. DelVecchio, Rick 1999. “$200m plan for Jack London Square”, San Francisco Chronicle 28 October. Employment Development Department, 1999. Web site of California Labor Market Information, Employment Development Department, State of California (http://www.calmis.cahwnet.gov/). Epstein, Edward 1999. “Brown raises pay for lowest-paid airport workers”, San Francisco Chronicle 22 November. Farb, Julie, and Phil Tomescu. "Bustling ports, suffering drivers". King County Labor Council, Seattle, August 24, 1999.

Living Wages at the Port of Oakland 37
Freeman, Richard and James Medoff. 1984. What do unions do? New York: Basic Books. Howe, Kenneth 1997. “Renaissance in Oakland: Jack London Square becoming a commercial center”, San Francisco Chronicle 27 June. Katz, Lawrence 1986. "Efficiency Wage Theories: a Partial Evaluation." in Stanley Fischer ed. NBER Macroeconomics Annual. Cambridge, MA: MIT Press. Martin Associates 1994. “The Economic Impact of the Port of Oakland’s Commercial Real Estate Tenants.” (Consultant report prepared for Port of Oakland). Martin Associates 1996. “The Local and Regional Economic Impacts of Maritime Activity at the Port of Oakland, 1995.” (Consultant report prepared for Port of Oakland). Martin Associates 1997. “The Local and Regional Economic Impacts of Oakland International Airport.” (Consultant report prepared for Port of Oakland). Restaurants USA 1999. Restaurant Industry Operations Report, 1999. Report CS959. National Restaurant Association. Pacific Maritime Association (various years). Pacific Maritime Association, Annual Report. San Francisco. Pollin, Robert and Stephanie Luce 1998. The Living Wage: Building a Fair Economy. New York: The New Press. Port of Oakland 1998. “Capital Improvement & Financing Plan: Fiscal Years 1998-99 through 2002-03.” Port of Oakland 1999. “Year-to-date Air Passenger and Air Freight Activity Reports for Bay Area Airports, 1998 and 1988”. Unpublished report of the Port of Oakland. Reich, Michael, Peter Hall and Fiona Hsu. 1999a. Living Wages and the San Francisco Economy: the Benefits and the Costs. Center on Pay and Inequality, Institute of Industrial Relations, University of California, Berkeley. Reich, Michael and Peter Hall 1999b. Living Wages at the Airport and Port of San Francisco: the Benefits and the Costs. Center on Pay and Inequality, Institute of Industrial Relations, University of California, Berkeley. Sachdev, Sanjiv and Frank Wilkinson 1998. “The Labour Market, the Minimum Wage and the Low Pay Commission Report.” ESRC Working Paper 110, ESRC Centre for Business Research, University of Cambridge.

Living Wages at the Port of Oakland 38
SF Airport Commission 1999. Official Statement of Airport Commission City and County of San Francisco. $250,000,000 San Francisco International Airport Second Series Revenue Bonds. Spain, Selena, Tse-Ming Tam and Chris Thomas. 1997. Living Wage Policies Nationwide: An Analysis for the City of Oakland. National Economic Development and Law Center: Oakland. Thurston, Jack. 1999. “Sitting on the Dock of the Bay? Policies to increase the local economic benefit of maritime activity at the Port of Oakland.” Goldman School of Public Policy, unpublished Master’s thesis. Uchitelle, Louis 1999. “Minimum wages are being set city by city." New York Times 17 November. U. S. Bureau of the Census, 1990. 1990 US Population Census Data accessed from the US Bureau of the Census Web Site, STF3A Series (www.census.gov). West Oakland Army Base Task Force. 1997. “A Community-Based Reuse Strategy: Homeless, Public Benefit, and Economic Development Proposals for the Oakland Army Base.” (Unpublished report submitted to Oakland Base Reuse Authority). Willis, D. 1999. “State finds population up 537,000 in 1997-8”, Orange County Register, 28 January. Zabin, Carol. 1996. “Assessing the Costs and Benefits of the ‘Living Wage Ordinance’: a Review of the Evidence.” Policy Brief #1, UCLA Labor Center. Zabin, Carol. 1999. "Living Wage Campaigns in the Economic Policy Arena: Four Case Studies in California". The Phoenix Fund for Workers and Communities, The New World Foundation.

Living Wages at the Port of Oakland 39
List of Tables Table 1-1 Cost of Living and Living Wage comparisons Table 2-1 Comparison of wage rates for selected Bay Area Central Cities Table 2-2 Top Ten Occupations with greatest absolute job growth in Alameda
County 1995-2002 Table 3-1 Port-related employment
Table 3-2a Tenants of the Port of Oakland: firms and employment by revenue
division Table 3-2b Tenants of the Port of Oakland: firms and employment by sector Table 3-3a Port employment and demographic profiles by revenue division Table 3-3b Port employment and demographic profiles by industry sector Table 3-4 Average wage by revenue division and demographic group Table 3.5 Low-wage employment at the Port of Oakland Table 4-1a Number of employees by wage category and revenue division Table 4-1b Number of employees by wage category and sector Table 4-2a Wage groups by gender Table 4-2b Wage groups by ethnicity Table 4-2c Wage group by place of residence Table 4-3 Affected workers and wage and benefit increases Table 4-4 Total annual costs Table 5-1a Cost summary, by revenue division Table 5-1b Cost summary, by sector Table 5-2 Port of Oakland Revenue Divisions: Annual Revenues 1993-1998 Table 5-3 Distribution of firms by increase in business costs Table A-1 Sample realization Table B-1 Tipped employees Table B-2 Wage and benefit increases (with and without tip credit) Table B-3 Cost summary for sectors with tipped employees

Living Wages at the Port of Oakland 40
Table 1-1 Cost of Living and Living Wage Comparisons
Living wage1
(unadjusted)
Wage adjusted with
Oakland Cost of Living2
Oakland
$8.30
$8.30
National Comparisons
Baltimore
$7.90
$13.27
Boston
$8.23
$9.29
Miami
$8.56
$12.96
Regional Comparisons
Los Angeles
$7.51
$9.52
San Francisco3
$11.00
$9.48
San Jose
$9.50
$8.35
Sources: ACCRA Cost of Living Index and Wider Opportunities for Women, Self-Sufficiency Worksheets.
Notes: 1. Living wage with health benefits. 2. Adjusting factor = Oakland CofL/City’s CofL (using ACCRA Composite Index for Baltimore, Boston, Los Angeles and Miami,
and W.O.W. index for San Francisco and San Jose). 3. Proposed Living Wage. 4. Cost data are for the city, except for Boston (PMSA) and Miami (Dade County).

Living Wages at the Port of Oakland 41
Table 2-1 Comparison of wage rates for selected Bay Area Central Cities
Average hourly wage, 1996-9
Oakland
$14.52
San Francisco
$15.97
San Jose
$18.99
All Bay Area Central Cities
$17.68
Source: Hourly wage from authors analysis of March Supplement of the BLS Current Population Survey, Bay Area Counties, 1996-9 extraction. Adjusted for inflation using the San Francisco-Oakland-San Jose CMSA all urban consumers consumer price index.

Living Wages at the Port of Oakland 42
Table 2-2 Top Ten Occupations with greatest absolute job growth in Alameda County 1995-2002 Job Title
1995
2000
Total
Change
Median Hourly Wage1
Mean Annual
Low-wage occupations Cashiers
13,450
15,410
1,960
$7.65
$19,190
Retail Salespersons
19,500
21,450
1,950
$7.78
$19,910
Assemblers and Fabricators
7,720
9,210
1,490
$9.21
$20,550
Waiters/Waitresses
6,240
7,480
1,240
$5.67
$13,110
Low-wage total
46,910
53,550
6,640
-
$18,904
Medium-wage occupations Sales Representatives2
8,350
9,370
1,020
$19.17
$44,910
Secretaries3
11,810
12,700
890
$14.16
$29,870
Teachers (Secondary)
5,170
5,950
780
$24.294
$50,530
Medium-wage total
25,330
28,020
2,690
-
$39,045
High-wage occupations General Managers
17,450
19,380
1,930
$36.93
$74,660
Computer Engineers
1,660
2,800
1,140
$33.81
$65,710
Systems Analysts
1,820
2,870
1,050
$31.41
$61,860
High-wage total
20,930
25,050
4,120
-
$72,837
Source: California Employment Development Department. Note: 1. 1997 wage rates for the Oakland PMSA. 2. Sales representatives not including retail or scientific. 3. Secretaries not including legal or medical. 4. No median wage available for teachers. Median hourly wage given is mean yearly wage divided by 2080 hours.

Living Wages at the Port of Oakland 43
Table 3-1 Port-related employment1 1995 Projected 2010
Airport
10,200
16,500
Maritime
8,800
12,700
Commercial real estate
2,900
Not available
Port staff
580
Not available
Total port employment
22,480
32,680
Total Alameda County employment
525,444
784,840
Sources: County Business Patterns, ABAG web site, Martin and Associates Note: 1. Includes off-site employment.

Living Wages at the Port of Oakland 44
Table 3-2a Tenants of the Port of Oakland: firms and employment by revenue division
Revenue Division Firms1 Employees2 Percentage of
total workforce3
Average wage4, $/hour
Percent of employees unionized
Airport 36 7270 63.6 14.50 44.1 Maritime port 20 2050 17.9 31.66 80.5 Real estate 84 2110 18.4 10.54 4.9 Total
140
11430
100.0
16.80
43.4
Table 3-2b Tenants of the Port of Oakland: firms and employment by sector
Industry Sector Firms1 Employees2 Percent of
total workforce3
Average wage,
$/hour4
Percent of employees unionized
Air Cargo 4 4164 36.4 15.84 34.8 Passenger airlines 6 1109 9.7 16.00 82.3 Airline support services 8 745 6.5 12.91 27.5 Security and curbside assistance 3 223 2.0 7.02 0.0 Car rental 6 445 3.9 10.15 57.5 Parking services 3 300 2.6 9.90 69.3 Retail 22 371 3.2 10.65 5.4 Restaurant 16 918 8.0 8.07 23.5 Hotel 16 324 2.8 9.30 0.0 Maritime 9 1601 14.0 37.99 98.0 Trucking and warehousing 10 365 3.2 12.76 7.1 Construction and Manufacturing 4 113 1.0 12.54 72.2 FIRE5 7 146 1.3 18.4 0.0 Professional services 21 257 2.2 19.14 5.4 Entertainment and personal services
5 350 3.1 7.32 0.0
Total
140
11430
100.0
16.80
43.2
Source: UC Berkeley (CLRE) Employer Survey Notes: 1. Excluding firms with fewer than 5 employees. 2. Non-managerial employees only. 3. Non-managerial employees in sector / total non-managerial employees. 4. Including health benefits. Based on the occupation-weighted sample. 5. Finance, Insurance, and Real Estate.

Living Wages at the Port of Oakland 45
Table 3-3a Port employment and demographic profiles by revenue division
Percent of employees who are:
Revenue Division Women
Oakland residents
African-American
Asian- American
Latino
White
Airport 7,270 40.8 69.0 41.9 22.0 16.4 19.6 Maritime Port 2,050 11.3 27.7 37.0 2.4 34.1 26.4 Real Estate 2,110 55.1 64.3 29.1 17.9 23.4 29.6 Total 11,430 35.8 53.9 35.8 14.0 23.8 26.5
Table 3-3b Port employment and demographic profiles by industry sector
Percent of employees who are:
Industry Sector Women
Oakland residents
African-
American
Asian-
American
Latino
White
Air Cargo 4,164 25.5 60.0 12.1 0.9 2.8 84.1 Passenger airlines 1109 63.6 75.5 28.3 24.1 23.5 24.1 Airline support services 745 45.1 66.7 57.4 9.8 8.8 23.9 Security and curbside assistance 223 27.1 74.3 65.6 26.6 6.0 1.8 Car rental 445 43.9 81.4 63.7 13.8 16.0 6.5 Parking services 300 72.4 40.3 40.2 46.3 1.5 11.1 Retail 371 45.2 72.4 35.3 7.6 18.1 39.4 Restaurant 918 52.3 56.1 23.0 13.3 38.2 25.5 Hotel 324 67.8 85.0 30.0 16.6 40.9 12.4 Maritime 1,601 7.4 31.7 39.8 1.6 21.8 36.9 Trucking and warehousing 365 33.6 10.4 15.1 6.0 63.4 15.2 Construction and Manufacturing 113 4.2 15.7 3.6 4.2 71.4 20.3 FIRE1 146 60.5 27.0 14.6 4.9 3.5 77.0 Professional services 257 62.1 28.2 10.6 35.3 9.9 44.2 Entertainment and personal services 350 41.7 92.5 57.2 28.9 3.5 10.4 Total 11,430 35.8 53.9 35.8 14.0 23.8 26.5 Source: UC Berkeley (CLRE) Employer Survey Notes: 1. Finance, Insurance, and Real Estate. 2. The number of employees by sector and the percent of employment by demographic group were calculated based upon the firm-
weighted sample universe. See Appendix A.

Living Wages at the Port of Oakland 46
Table 3-4 Average wage by revenue division and demographic group
Average wage, $/hr1
Revenue Division
All
Employees Women Oakland residents
African-American
Asian-American
Latino White Unionized
Airport
14.50
13.42
12.18
10.96
11.80
13.07
15.80
14.91
Maritime Port
32.12
23.60
37.29
37.48
21.03
26.27
34.41
37.87
Real Estate
10.27
10.88
8.58
8.88
10.70
9.15
12.53
13.70
All Divisions
16.81
13.41
15.27
18.75
11.88
17.89
19.73
22.19
Source: UC Berkeley (CLRE) Employer Survey Notes: 1. Including health benefits, not including tips. 2. Average hourly wages are weighted by the number of employees in each category.

Living Wages at the Port of Oakland 47
Table 3.5 Low-wage employment at the Port of Oakland1
Industry Sector Job Title Employees Average wage,
$/hour2 Wage range,
$/hour3
Fueler / Ramp agent 250 8.40 6.50-9.15 Airline Support services
Food preparation 90 9.10 6.40-10.20
Skycap and screeners 160 5.95 5.75-6.25 Security and skycap
Security 60 9.00 6.50-9.00
Rental Cars Rental and service agents, shuttlers 350 8.90 5.75-12.85
Parking Services Cashier, Valet 225 8.55 5.75-9.05
Retail Cashier and sales 200 8.25 5.75-12.00
Busser 45 5.90 5.75-7.70
Dishwasher 90 7.60 5.75-9.40
Cook, food preparation 190 8.20 5.75-10.70
Restaurant Waiter, cocktail server,
bartender, host 490 7.45 5.75-15.00
Housekeeper / room cleaner 150 7.15 5.75-9.50
General Maintenance 30 7.90 5.75-8.50
Hotel
Desk clerk 60 8.55 5.75-9.25
Trucking And warehousing
Packagers and general labor 200 6.75 5.75-8.50
Entertainment and personal services
Customer services, cleaning 240 6.25 5.75-6.25
Source: UC Berkeley (CLRE) Employer Survey Notes: 1. Low-wage job titles are defined as those where the starting wage is below $8.30 per hour. Due to tenure-based pay scales, average
wage rates for some of these job titles may exceed $8.30 per hour. Since we do not have detailed data on wage scales, the number of workers reported includes all employees within the firm in the relevant job title.
2. Average hourly wages are weighted and do not include tips. 3. Minimum of wage range is lowest starting wage and maximum of wage range is highest average wage. 4. All numbers have been rounded.

Living Wages at the Port of Oakland 48
Table 4-1a Number of employees by wage category and revenue division
Industry All Employees
Earning below the proposed
living wage1
Earning below the proposed living
wage plus health benefit level2
Indirectly affected by the proposed living wage ordinance3
Unaffected by the proposed living wage ordinance4
Airport 7265 551 513 321 5880
Maritime Port 1979 175 66 50 1688
Real Estate 2050 1032 236 167 615 Total
11294
1758
815
538
8183
Table 4-1b Number of employees by wage category and sector
Industry All Employees
Earning below the proposed
living wage1
Earning below the proposed living
wage plus health benefit level2
Indirectly affected by the proposed living wage ordinance3
Unaffected by the proposed living wage ordinance4
Air Cargo 4164 4164 Passenger airlines 1109 54 22 178 855 Airline support services 745 48 66 127 504 Security and curbside assistance 223 157 66 Car rental 445 86 193 166 Parking services 300 50 176 74 Retail 371 119 60 56 136 Restaurant 918 691 65 38 124 Hotel 324 171 26 66 61 Maritime
1509 45 1464 Trucking and warehousing 362 140 65 157 Construction and Manufacturing 101 5 96 FIRE5 146 146 Professional services 252 20 232 Entertainment and personal services 325 242 76 3 4 Total 11294 1758 815 538 8183
Source: UC Berkeley (CLRE) Employer Survey Notes: 1. Earning below $8.30 per hour. 2. Earning between $8.30 and $9.54 per hour. 3. Earning between $9.55 and $11.44 per hour. 4. Earning more than $11.45 per hour. 5. Finance, Insurance, and Real Estate.
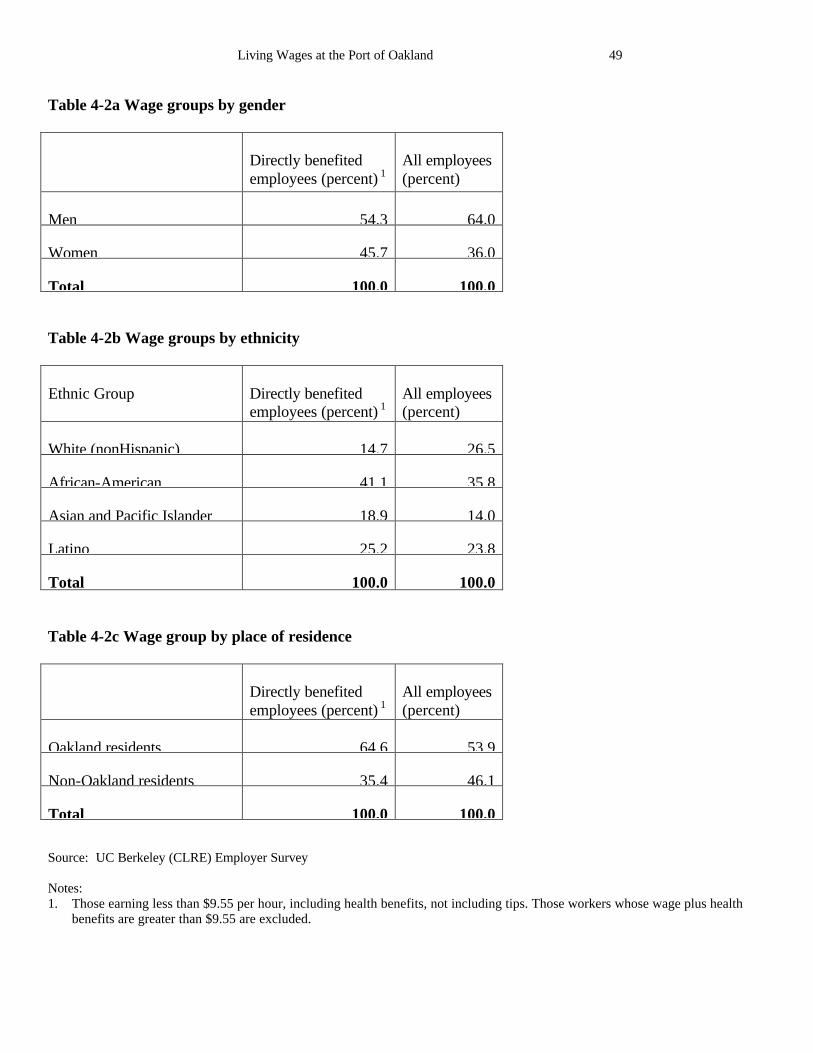
Living Wages at the Port of Oakland 49
Table 4-2a Wage groups by gender
Directly benefited employees (percent) 1
All employees (percent)
Men
54.3
64.0
Women
45.7
36.0
Total
100.0
100.0
Table 4-2b Wage groups by ethnicity Ethnic Group
Directly benefited employees (percent) 1
All employees (percent)
White (nonHispanic)
14.7
26.5
African-American
41.1
35.8
Asian and Pacific Islander
18.9
14.0
Latino
25.2
23.8
Total
100.0
100.0
Table 4-2c Wage group by place of residence
Directly benefited employees (percent) 1
All employees (percent)
Oakland residents
64.6
53.9
Non-Oakland residents
35.4
46.1
Total
100.0
100.0
Source: UC Berkeley (CLRE) Employer Survey Notes: 1. Those earning less than $9.55 per hour, including health benefits, not including tips. Those workers whose wage plus health
benefits are greater than $9.55 are excluded.

Living Wages at the Port of Oakland 50
Table 4-3 Affected workers and wage and benefit increases
Wage Category
Average hourly wage increase1
Average annual wage increase2
Number of employees
Full-time: $4,500
Directly affected workers (earning under $9.55/hr.)
$2.25 Part-time: $2,300
2,573
Full-time: $2,400
Indirectly affected workers3 (earning between $9.55 and $11.44/hr.)
$1.16
Part-time: $1,200
538
Full-time: $3,800
Total affected workers
$2.06 Part-time: $2,00
3,111
Source: UC Berkeley (CLRE) Employer Survey Notes: 1. Average wage increase attributable to the proposed living wage ordinance, including health coverage but excluding paid days off. 2. Full-time employees are assumed to work 2000 hours per year; part-time employees work on average 1070 hours per according to
survey data. 3. Indirectly affected workers are those workers who would benefit from upward wage push pressure with the new higher wage
floor.

Living Wages at the Port of Oakland 51
Table 4-4 Total annual costs
Total Costs $ millions
Percent of original wage bill
Original annual wage bill, including health insurance 296.5 100.0 Cost of increasing Wages to $8.30 4.7 1.6 Cost of providing health insurance ($1.25/hour)1 3.3 1.1
Cost of the indirect wage push2
2.1 0.7
Cost of paid days leave3
2.0 0.7
Subtotal (benefits to workers) 12.1 4.1
Cost of employer-paid taxes on increase4 1.0 0.3
Total cost 13.0 4.4
Source: UC Berkeley (CLRE) Employer Survey Notes: 1. Health insurance costs are the cost of raising each employee's total compensation to $8.30 per hour with health benefits or $9.55
per hour, less the direct costs of raising workers’ wages to $8.30 per hour. 2. Indirect wage push refers to upward wage pressure with the higher floor wage of a living wage. We assumed that wages between
$7.65 and $11.44 would be subject to wage push effects. 3. Paid leave costs provide all employees with a leave benefit at the post-ordinance wage rate, taking into account currently received
paid leave. Full-time workers are to get 12 days paid leave per year and part-time workers get 6 days. 4. Employer paid taxes are 11.15% of wage bill, including health insurance. Oakland payroll taxes are fixed per employee and are
thus unaffected by the living wage ordinance.

Living Wages at the Port of Oakland 52
Table 5-1a Cost summary, by revenue division
Revenue Division Total cost $ millions
As percent of old wage
bill
As percent of business
revenue Airport 5.84 4.92 1.52
Maritime Port 1.68 1.21 0.25
Real Estate 5.53 14.37 4.31
Total
13.0
4.41
1.11
Table 5-1b Cost summary, by sector
Industry sector Total cost $ millions
As percent of old wage
bill
As percent of business
revenue
Air cargo 0.11 0.32 0.10 Passenger airline 1.34 3.63 1.45 Airline services 0.88 4.03 1.21 Security and curbside assistance 1.38 40.0 28.0 Car rental 0.82 9.69 1.94 Parking services 0.55 8.58 6.00 Retail 0.76 10.8 2.15 Restaurant 3.44 28.1 6.56 Hotel 1.11 17.2 5.17 Maritime 0.10 0.08 0.02 Trucking and warehousing 1.41 14.0 4.20 Construction and Manufacturing 0.05 1.91 0.76 FIRE 0.04 0.92 0.37 Professional services 0.06 0.57 0.17 Entertainment and personal services 0.98 29.9 12.0 Total 13.0 4.41
1.11
Notes: Estimated using labor shares of business revenue derived from the 1998 American Restaurant Association Survey, and the Economic Censuses of Construction, Service Industries, Retail Trade, Manufacturing and Transportation, Communication and Utilities as reported in the US Bureau of the Census web site and the Statistical Abstract of the United States, 1997 and adjusted according to authors’ survey.

Living Wages at the Port of Oakland 53
Table 5-2 Port of Oakland Revenue Divisions: Annual Revenues 1993-1998 (millions $)
Revenue Division
Years ended
June 30
Property Lease
Rentals1
Parking Dockage and wharfage, and landing fees2
Other Operating Revenue3
Total Operating Revenue
Net Operating Income (loss)4
1993 25.9 14.3 7.9 8.8 56.9 4.9 1994 25.9 15.5 8.4 8.4 58.0 (0.2) 1995 26.9 17.6 10.2 8.2 62.7 4.6 1996 28.2 19.1 10.2 8.7 66.1 3.1 1997 29.3 21.6 9.6 8.4 69.1 6.2
Aviation
1998 30.7 21.9 9.9 8.9 71.3 5.4
1993 1.7 - 42.6 7.2 51.5 15.6 1994 1.5 - 43.7 7.1 52.3 11.1 1995 2.5 - 49.3 8.3 60.1 11.5 1996 4.6 - 51.9 9.4 65.9 13.8 1997 6.0 - 53.5 8.2 67.6 11.9
Maritime
1998 6.8 - 56.7 9.2 72.6 14.7
1993 6.7 0.9 - 1.0 8.6 (6.2) 1994 6.9 0.9 - 1.0 8.9 (5.8) 1995 7.0 1.0 - 1.0 9.0 (12.1) 1996 7.5 1.3 - 1.0 9.7 (8.4) 1997 7.8 1.9 - 1.0 10.7 (8.8)
Commercial Real Estate5
1998 6.9 2.6 - 1.1 10.6 (9.0)
1993 34.3 15.2 50.5 17.0 117.0 14.3 1994 34.3 16.1 52.0 16.5 118.9 5.1 1995 36.4 18.6 59.4 17.4 131.8 4.0 1996 40.2 20.3 62.1 19.0 141.7 8.5 1997 43.1 23.5 63.1 17.6 147.4 9.3
Total
1998 44.4 24.5 66.6 19.1 154.6 11.1 Source: Port of Oakland Supplementary Schedule of Revenues and Expenses Notes: 1. Includes airport terminal rental, concessions and other aviation rentals, maritime space assignments and rentals, and lease rentals. 2. Includes dockage, wharfage and related accounts and landing fees. 3. Includes airport field revenue and ground access revenue, cranes, storage and demurrage, marinas and utilities. 4. Net operating income is Total Operating Revenue less Operating Expenses, Depreciation, Amortization and Interest Expense. 5. Excludes Oakland Portside Associates, a subsidiary property management company of the Port of Oakland. According to port
officials, Oakland Portland Associates has made a loss during recent years.

Living Wages at the Port of Oakland 54
Table 5-3 Distribution of firms by increase in business costs Costs of living wage
as percent of business revenue
Percent of firms
Percent of increased
costs
Percent of non-managerial employment
0-1%
43.1
5.8
62.9
1-3%
13.8
15.4
12.8
3-6%
20.6
23.7
9.1
6-10%
9.0
19.5
6.6
10-15%
12.6
26.1
7.1
15%+
0.9
9.5
1.4
Total
100.0
100.0
100.0
Source: UC Berkeley (CLRE) Employer Survey Notes: For details of business revenue estimates, see Table 5-1.

Living Wages at the Port of Oakland 55
APPENDIX TABLES Table A-1 Sample Realization
Firms
Survey Result
Number
Percent Interview completed
123
44
Done
No employees on site
45
16 Refusal
58
21
Not Done
Not traceable
22
8 Closed / no longer tenants
30
11
Total
278
100

Living Wages at the Port of Oakland 56
Table B-1 Tipped Employees
Occupation
Number of
workers
Average
wage1, $/hour
Average wage,
with tips2, $/hour
Waiters, bartenders, cocktail server
420
7.87
13.63
Other restaurant employees
500
8.24
9.04
Valet parking
40
7.19
9.19
Skycaps, curbside assistants
100
5.94
7.94
Source: UC Berkeley (CLRE) Employer Survey Notes: 1. Including health benefits. Based on the occupation-weighted sample. 2. See Appendix A for details.

Living Wages at the Port of Oakland 57
Table B-2 Wage and benefit increases (with and without tip credit)
Without tip credit
With tip credit1
Wage Category Average hourly wage increase2
Number of workers
Average hourly wage increase2
Number of workers
Directly affected workers (earning under $9.55/hr.)
$2.25
2,573
$1.89
2,192
Indirectly affected workers3 (earning between $9.55 and $11.44/hr.)
$1.16
538
$1.09
855
Total affected workers
$2.06
3,111
$1.67
3,047
Source: UC Berkeley (CLRE) Employer Survey Notes: 1. Tip credit added to employer-provided wage including health benefits. Hourly tips were estimated for waiters, valets, and
skycaps. See Appendix A. 2. Average wage increase attributable to the proposed living wage ordinance. 3. Indirectly affected workers are those workers who would benefit from upward wage push pressure with the new higher wage
floor.
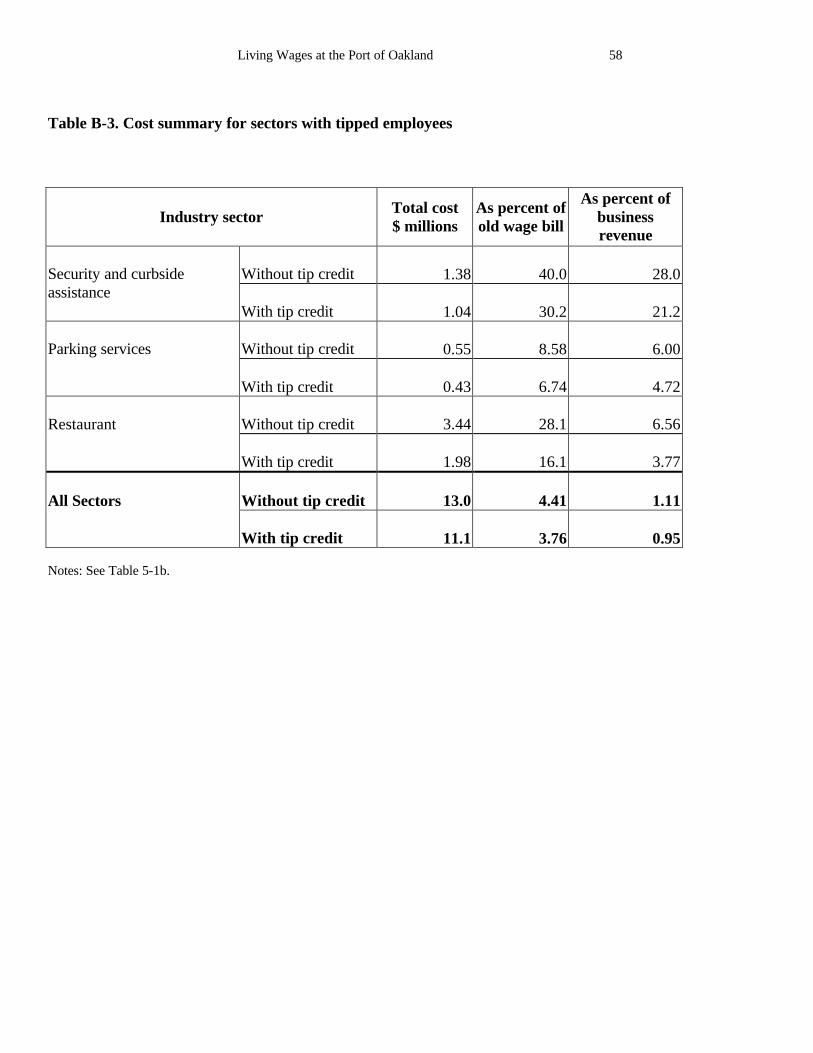
Living Wages at the Port of Oakland 58
Table B-3. Cost summary for sectors with tipped employees
Industry sector Total cost $ millions
As percent of old wage bill
As percent of business revenue
Without tip credit 1.38 40.0 28.0
Security and curbside assistance
With tip credit 1.04 30.2 21.2 Without tip credit 0.55 8.58 6.00
Parking services
With tip credit 0.43 6.74 4.72 Without tip credit 3.44 28.1 6.56
Restaurant
With tip credit 1.98 16.1 3.77 Without tip credit 13.0 4.41 1.11
All Sectors
With tip credit 11.1 3.76 0.95
Notes: See Table 5-1b.