Embed Size (px)
Citation preview

This presentation has been provided to you for use in a private and confidential meeting to discuss potential or existing investment advisory relationship. This presentation is not an advertisement and is not intended for public use or distribution beyond our private meeting.
Mitch Stapley, CFAChief Fixed Income Officer
Fifth Third Asset Management
Living In The U.S. Of AA+

2
Source: Bloomberg PIIG 2 Year Yields 1/13/06 – 1/11/12
Greece – Going, Going…

3
Mr. Market not believing the 50% haircut
Remember the “Voluntary” 50% Haircut?

4
Total Gross Federal Debt And GSE Debt To GNP/GDP
1916, 7.3%
1929, 16.3%
1975, 28.9%
1946, 115.7%
1919
34.7%1867, 30.7%
2011est.
101.0%
2010, 146.03%
0%
20%
40%
60%
80%
100%
120%
140%
160%
17
91
18
01
18
11
18
21
18
31
18
41
18
51
18
61
18
71
18
81
18
91
19
01
19
11
19
21
19
31
19
41
19
51
19
61
19
71
19
81
19
91
20
01
20
11
20
21
0%
20%
40%
60%
80%
100%
120%
140%
160%
Civil War
WW1
WW2
1791 to 1928 = GNP
1929 to 2010 = GDP
If GSEs Are
Counted
This Is AAA? U.S. Debt To GDP
Source: Bianco Research

5
Federal Gov't Spending and Revenue
(Pct. GDP, OMB Proj. '10-'20)
10
12
14
16
18
20
22
24
26
'46 '56 '66 '76 '86 '96 '06
Spending
Revenue
Spending At
Highest Level Since
WWII
Again, This Is A AAA Credit?
Spending = 24.5% GDPRevenues = 15.6% GDPDeficit = (8.9)% of GDP
% of GDP
Source: Strategas

6
Growth In Mandatory Entitlement SpendingSocial Security, Medicare, Medicaid

7
Source: Bloomberg C15
Imagine If They Had Cut Us To BAA?!Treasury Yields Post – Downgrade to AA+

8
$14,582
$5,878$5,497
$3,309$2,560 $2,246 $2,087 $2,051
$1,729 $1,574 $1,479 $1,407$1,039 $1,014
0
2000
4000
6000
8000
10000
12000
14000
16000
Global GDP = $63.0 trillion
Biggest Is Best
Source: Bloomberg

9
Holdings of Treasury SecuritiesThe Federal Reserve, Japan and China
0
100
200
300
400
500
600
700
800
900
1,000
1,100
1,200
1,300
1,400
1,500
1,600
1,700A
pr-
00
De
c-0
0
Au
g-0
1
Ap
r-0
2
De
c-0
2
Au
g-0
3
Ap
r-0
4
De
c-0
4
Au
g-0
5
Ap
r-0
6
De
c-0
6
Au
g-0
7
Ap
r-0
8
De
c-0
8
Au
g-0
9
Ap
r-1
0
De
c-1
0
Au
g-1
1
Ap
r-1
2
Bill
ion
s o
f D
olla
rs
0
100
200
300
400
500
600
700
800
900
1,000
1,100
1,200
1,300
1,400
1,500
1,600
1,700
Bill
ion
s o
f D
olla
rs
Japan
China
Federal Reserve
Source: Arbor
Don’t Fight the Fed

10
Source: www.crgraphs.com
Operation Twist –How Much Bang For The Buck?
QE I
QE II
Twist

11
Presidential Re-Election &
Change In The Unemployment Rate
-15%
-10%
-5%
0%
5%
10%
15%
20%
25%
-3 -2 -1 0 1 2
'04
'96
'80
'92
'84
'54
'7 2Margin of
Reelection
Victory
Change In Election Y ear
Unemployment Rate
No post-WWII presidenthas won re-election with arising unemployment ratein a presidential electionyear & vice versa.
The Ultimate Presidential Election Indicator

12
'82 '84 '86 '88 '90 '92 '94 '96 '98 '00 '02 '04 '06 '08 '102,000
4,000
6,000
8,000
10,000
12,000
14,000
16,000
80,000
90,000
100,000
110,000
120,000
130,000
140,000
150,000
Employment
GDP (left)
Gross Domestic Product, Bil. $, Saar - United States (Left)All Employees, Total Nonfarm Payroll, Thousands Of Persons, Sa - United States (Right)Recession Periods - United States
Source: FactSet
GDP Back To New Highs – With 7 MillionFewer Jobs

13
'07 '08 '09 '10 '110
500
1,000
1,500
2,000
2,500
5,500
6,000
6,500
7,000
7,500
8,000
8,500
9,000
Bank
Deposits
w ith Fed
(R)
Corporate
Cash (R)
Bank
Deposits (L)
Cash piles continue to build on the sidelines...
H.8, Liabilities Of Commercial Banks, Deposits, Bil. Usd, Sa - United States (Right)H.4.1- Liabilities of All Federal Reserve Banks, Deposits, Depository Institutions (Mil $) - United States / 1000 (Left)Nonfarm Nonfinancial Corporate Business - Total Liquid Assets, L.102 - Levels - United States (Left)Recession Periods - United States
Vote With Your Cash
Source: FactSet
14
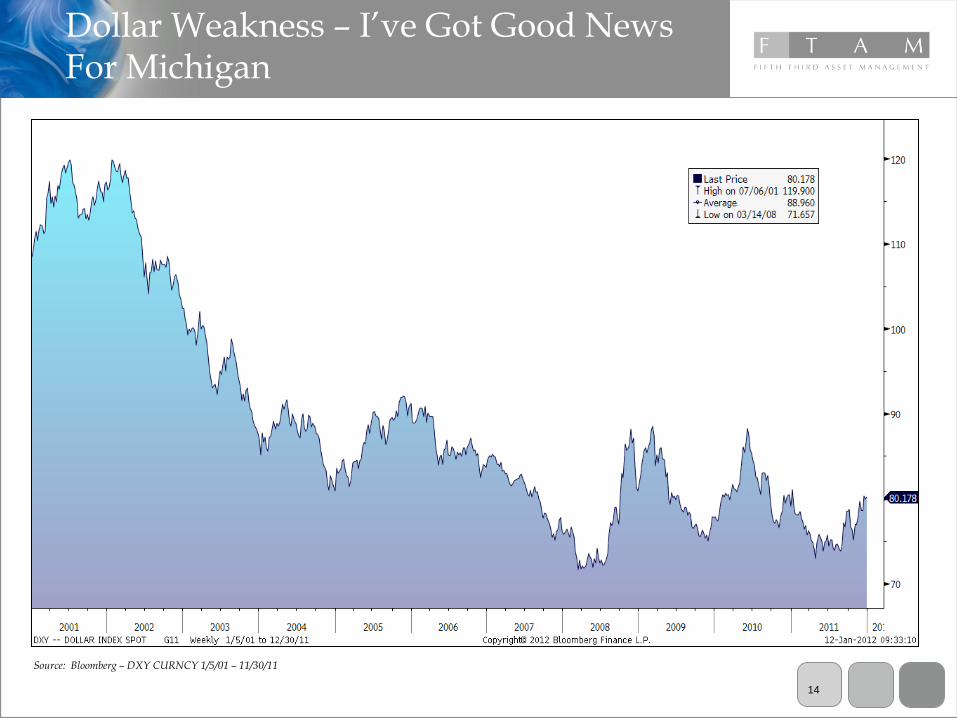
Dollar Weakness – I’ve Got Good NewsFor Michigan
Source: Bloomberg – DXY CURNCY 1/5/01 – 11/30/11
Flight to Quality
Back to Reality?
Flight to Quality
Back to Reality?Flight to
Quality

15
'82 '84 '86 '88 '90 '92 '94 '96 '98 '00 '02 '04 '06 '08 '108
10
12
14
16
18
20
22
24
0
200
400
600
800
1,000
1,200
1,400
1,600
1,800
2,000
Housing
Starts
Vehicle
Sales (L)
Construction
($bil l ions)
Exports
($bil l ions)
Economic Trends
Motor Vehicles Total vehicle sales, Number of, Annual Rate, SA - United States (Left)Housing Starts 1 unit, Number of, Annual Rate, SA - United States (Right)Total Construction Put in Place, Mil. USD, SA - United States / 1000 (Right)Net Exports Of Goods & Services, Exports, Bil. Chained 2005 $, Saar - United States (Right)Recession Periods - United States
Source: FactSet
Exports Driving The Economy

16
Source: Bloomberg Michigan Employment 12/31/1980 – 11/30/2011
Michigan On The Mend
Michigan Unemployment
Rate
Total Michigan Manufacturing Jobs
National – UR 8.5%
GR Wyoming – UR 7.1%

17Source: Ward’s Autodata (unadj.), Updated YTD 12/31/11
Detroit TurnaroundU.S. Market Share of Major Automakers:
GM FORD TOYOTA CHRYSLER HONDA NISSAN
19.6% 16.8% 12.9% 10.6% 9.0% 8.2%
35.5%
19.6%
7.6%
12.9%
23.9%
16.8%
12.2%
10.6%
6.2%
9.0%
4.5%
8.2%
0%
5%
10%
15%
20%
25%
30%
35%
40%

18
Source: Bloomberg GM UN Equity 11/18/2010 – 12/31/2011
Remember that $33 IPO Price?GM Looking Better

19
2.6%
-3.7%
-12.9%
-18.4%
7.7%
13.5%
4.9%
8.9%
-8.5%
8.4%
-25%
-20%
-15%
-10%
-5%
0%
5%
10%
15%
20%
S&P 500 Russell 2000
MSCI EAFE
MSCI EM BC Agg Bond
BC TIPS BC HY Bond
S&P REIT
CRB Index
Gold
YTD Asset Class Total Returns
Source: Bloomberg/FactSet; As of 12/31/2011

20
Source: Bloomberg SPX Index 12/31/10 – 12/31/2011
All This to End Up Unchanged?

21
Source: FactSet
PE And EPS Have Traded Places Since 1999
'92 '93 '94 '95 '96 '97 '98 '99 '00 '01 '02 '03 '04 '05 '06 '07 '08 '09 '10 '1120
30
40
50
60
70
80
90
100
110
120
8
10
12
14
16
18
20
22
24
26
28
PE Multiple
Trendline
Trendline
EPS
S&P 500 - Earnings per Share vs. PE Multiple
S&P 500 - Earnings per Share (Left)S&P 500 - Price to Earnings Ratio (Right)
Recession Periods - United StatesTrendline: Linear
Trendline: Linear

22
21.113.6
9.915.5
23.1
51.1
0x
10x
20x
30x
40x
50x
60x
60's 70's 80's 90's 00's Current
Average Bond “P/E” by Decade(100/10-Year Treasury Yield)
18.1
12.5 11.7
19.5 20.1
12.1
0x
5x
10x
15x
20x
25x
60's 70's 80's 90's 00's Current
Average S&P 500 Trailing “P/E”By Decade
29.716.0 10.6
20.0
49.6
100.0
0x
20x
40x
60x
80x
100x
'60's '70's '80's '90's '00's Current
Average Cash “P/E” by Decade(100/Fed Funds Rate)
What’s Cheap? Stocks, Bonds or Cash….
Source: Strategas

23
Source: Bianco Research
Treasury Constant Maturity 10 Year Yields
9/22/2011, 1.72%
12/18/2008, 2.08%
4/5/1946, 1.54%
9/30/1981, 15.84%
0%
2%
4%
6%
8%
10%
12%
14%
16%6
/2/1
94
1
5/2
9/1
94
3
6/1
/19
45
7/3
0/1
94
7
12
/22
/19
49
5/2
0/1
95
2
10
/13
/19
54
3/1
2/1
95
7
8/4
/19
59
1/2
/19
62
5/2
8/1
96
4
10
/21
/19
66
3/2
0/1
96
9
8/1
7/1
97
1
1/1
5/1
97
4
6/1
1/1
97
6
11
/8/1
97
8
4/8
/19
81
8/3
1/1
98
3
2/3
/19
86
6/2
7/1
98
8
11
/19
/19
90
4/1
5/1
99
3
9/7
/19
95
1/3
0/1
99
8
6/1
9/2
00
0
11
/8/2
00
2
2/2
5/2
00
5
6/1
5/2
00
7
10
/2/2
00
9
1/2
0/2
01
2
5/9
/20
14
0%
2%
4%
6%
8%
10%
12%
14%
16%
Last: Oct-11, 2011: 2.18%
How Low Can They Go?

24
'02 '03 '04 '05 '06 '07 '08 '09 '10 '11-6-6
-4-4
-2-2
00
22
44
66
88
2-year
5-year
10-year
30-year
©FactSet Research Systems
Real Treasury Yields
US Benchmark Bond - 2 Year - Yield - CPI-U All Items U.s. City Average SA 1982-84=100 - United States
US Benchmark Bond - 5 Year - Yield - CPI-U All Items U.s. City Average SA 1982-84=100 - United States
US Benchmark Bond - 10 Year - Yield - CPI-U All Items U.s. City Average SA 1982-84=100 - United States
US Benchmark Bond - 30 Year - Yield - CPI-U All Items U.s. City Average SA 1982-84=100 - United States
Recession Periods - United States
Financial Repression –How Long Can It Last?

25
4/10 7/10 10/10 1/11 4/11 7/11 10/11 1/12-2-2
00
22
44
66
88
1010
Money
Markets
10yr
Treasury
S&P 500
DJIA
LQD
HYG
Comparative Current Yields
US Benchmark Bond - 3 Month - Yield
DJ Industrial Average - Dividend Yield
iShares iBoxx $ InvesTop Investment Grade Bond Fund - Dividend Yield
iShares iBoxx $ High Yield Corporate Bond Fund - Dividend Yield
US Benchmark Bond - 10 Year - Yield
S&P 500 - Dividend Yield
Where Do I Go For Yield?

26
Source: Bloomberg MUB US Equity 12/31/2008 – 12/31/2011
Muni’s Bouncing Back - +12.98% in 2011
*Only 10 municipal defaults in 2011
Meredith Moment

27
-40.0%
-30.0%
-20.0%
-10.0%
0.0%
10.0%
20.0%
30.0%
PIT
Sales Tax
Total
Year –Over-Year Nominal Change in State Tax Collections
State Tax Collections Continue To Rebound
Source: Rockefeller Institute

28
Source: Bloomberg – CPI YOY Index 12/31/71 – 12/31/2011
Flight to Quality
Back to Reality?
Flight to Quality
Back to Reality?Flight to
Quality
CPI – Inflation Creeping Back

29
TIPS A Better Hedge Than Hedge Funds?

30
Putting the Federal Budget in Perspective
U.S. Federal Government Example Using Median U.S. Household Income
Example Using Hypothetical Household Income of $100,000
Annual Income $2,228,000,000,000¹ $49,777³ $100,000
Annual Spending $3,708,000,000,000¹ $82,8434 $166,4274
Annual Deficit $1,480,000,000,000¹ $33,066 $66,427
Total Debt $14,993,709,044,141² $334,9834 $672,9674
¹Estimates for 2011 from the Congressional Budget Office’s ‘Budget and Economic Outlook: Fiscal Years 2011 to 2021,’ Table 1-1.
²Total public debt outstanding as of 10/31/2011 as reported by Treasurydirect.gov, ‘The Debt to the Penny and Who Holds It.’
³Median household income in the U.S. as of 2009 as reported by the U.S. Census Bureau, ‘The 2012 Statistical Abstract,’ Table 690.
4Calculations based on percentage of ‘Annual Income’ in proportion to that of ‘U.S. Federal Government’ figures.
What personal finances of typical U.S. households would look like if they mirrored the finances of the U.S. Federal Government

31
Fifth Third Asset Management, Inc. is an investment adviser registered under the Investment Advisers Act of 1940. Theinformation presented in the material is general in nature and is not designed to address your investment objectives, financialsituation or particular needs. Prior to making any investment decision, you should assess, or seek advice from a professionalregarding whether any particular transaction is relevant or appropriate to your individual circumstances. Although taken fromreliable sources, FTAM cannot guarantee the accuracy of the information received from third parties. Graphs and charts, bythemselves, cannot be used to make investment decisions.
The opinions expressed herein are those of FTAM and may not actually come to pass. This information is current as of the date ofthis newsletter and is subject to change at any time, based on market and other conditions.
Disclosures
FTAM January, 2011