Embed Size (px)
Citation preview

LIVER TRANSPLANTION FOR NASH: Optimizing Post-Transplant Care
M. Shadab SiddiquiVirginia Commonwealth University
November 14, 2016

Objectives
• Trends in liver transplantation for NASH
• Mortality in liver transplant recipients
• Impact of immunosuppression on metabolic
diseases
• Optimizing care in patients with liver
transplant for NASH

NAFLD is a Multisystem Disease
Diabetes Mellitus
Dyslipidemia
Obesity
Hypertension
Fatty Liver

Recognition of NAFLD in Clinical Practice is Sub-Optimal
Siddiqui et al. Gastro 2013
NormalALT62%
HighNormalALT26%
ElevatedALT12%
Blais et al. Am J Gastroenterol 2015
0
20
40
60
80
100
60.6
39.4
NAFLDCare:39%-Recogni onofALTincrease22%-DiagnosisofNAFLD/NASH15%-Recommendlifestylechanges10%Referraltospecialist
NONAFLDCARE

NAFLD is a Multisystem Disease
Diabetes Mellitus
Dyslipidemia
Obesity
HypertensionAtherosclerosis
NASH withFibrosis
Renal Insufficiency
Heart Failure
NASHCirrhosis
TransplantedLiver

NASH as the listing diagnosis among new liver transplant waitlist registrants is rapidly increasing
Wong et al. Gastro 2015
NASH as an indication for liver transplantation is increasing
Charlton et al. Gastroenterology. 2012

Survival in Liver Transplant Recipients is Improving
Watt KD. Nat. Review. Gastro 2015

Survival in Patients Transplanted for NASH are similar to other indications
Charlton et al. Gastroenterology. 2012
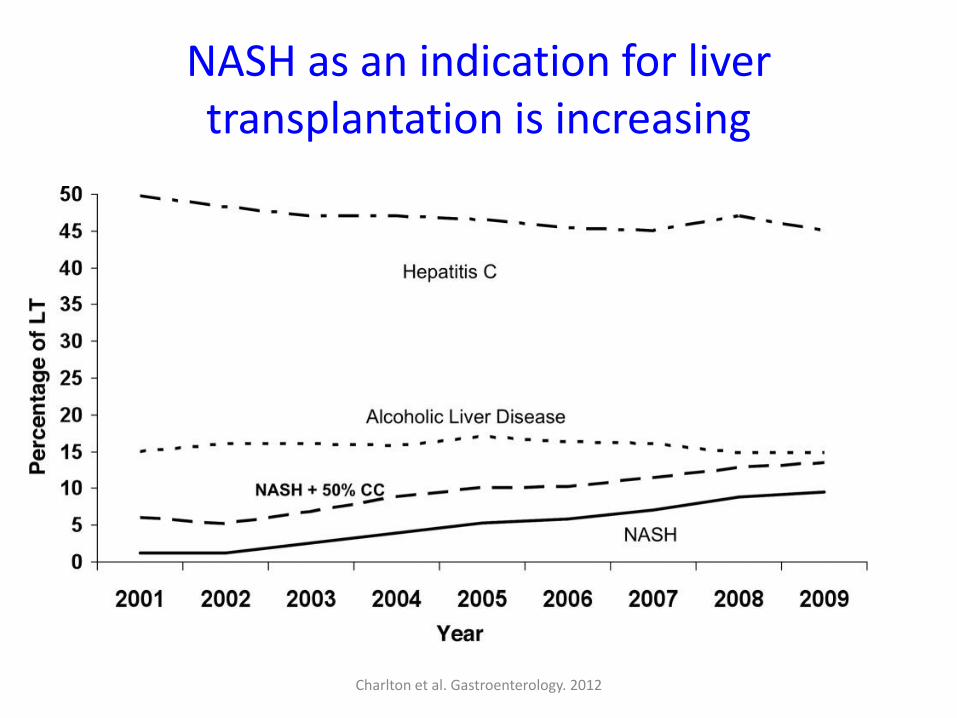
Aberg et al. Hepatology 2015.
Survival in LTR is Lower Than Non-Transplant Population
General Population
Liver Transplant Recipients

11
Cardiovascular disease is one of the leading cause of death in liver transplant recipients
Watt et al. Am J Transplant. 2010
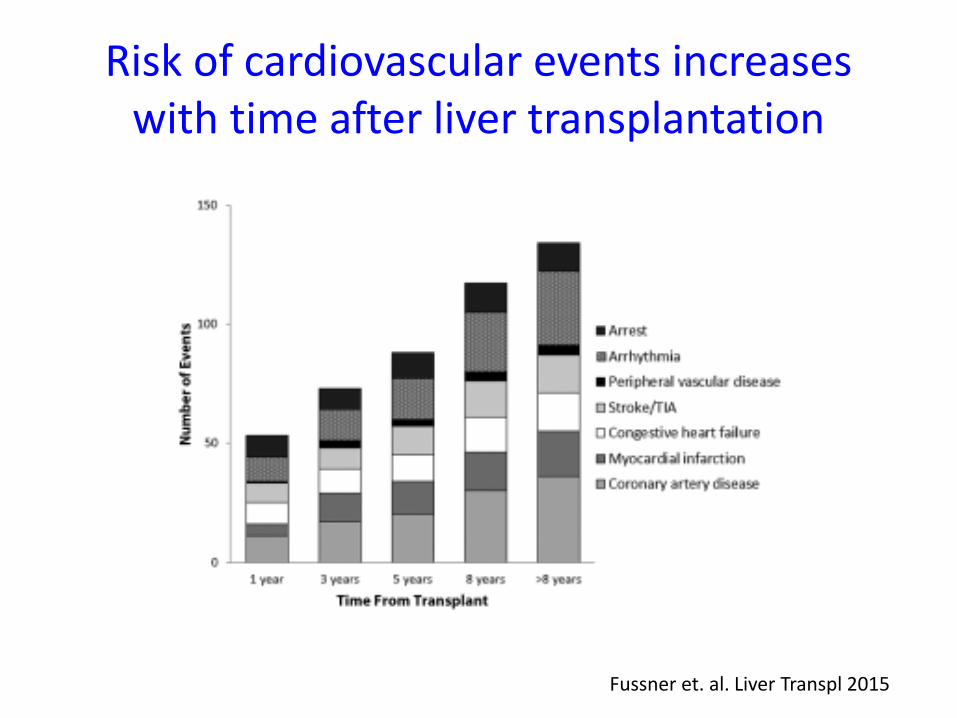
Risk of cardiovascular events increases with time after liver transplantation
Fussner et. al. Liver Transpl 2015

Causes of Long-term mortality in patients receiving a LT for NASH
Figure 3C
24.98% Cancer
24.98% Infection
21.88% Heart
18.78% Other
9.39% Liver
Figure 3C
Cancer, Heart, Infection
Other
Graft Cirrhosis
Bhati et al. AASLD 2016

ImmunosuppressionRecurrent
Liver DiseaseLipids Obesity HTN
Cancer Surveillance
T2DM
Hepatologist
Care of A Transplant Patient(Expectation)
Primary Care

Role of Primary Care in Managing Liver
Transplant Recipients
0 20 40 60 80
Defer ALL care to LT center
Comfortable with ALL care
Comfortable managing familiar disease
Consult Transplant Center
for only transplant related care
PCP feels comfortable 73%
55%
36%
9%
9%
McCashland, Liver Transpl, 2001

ImmunosuppressionRecurrent
Liver Disease
Lipids Obesity HTNCancer
SurveillanceT2DM
Care of A Transplant Patient(Reality)
Hepatology
Primary Care

Transplant
Optimizing Care of Patients Receiving Liver Transplantation for NASH Cirrhosis
Siddiqui and Charlton Gastro. 2016
Pre-Transplant
Transplant
Post-Transplant
• Patient Selection• BMI• CVD evaluation
• Steroid free/Reduced Steroid• Renal protective protocols• Management of hyperglycemia
• Reducing rejection rates• Limiting metabolic complications• Reducing disease recurrence

Goals of Immunosuppression
Reduce Rejection
Reduce Complications
Role in Recurrent Liver
Disease

Consequences of Long Term Immunosuppression
• Metabolic Syndrome (its component)
– Type 2 diabetes mellitus
– Hypertension
– Obesity
– Hyperlipidemia
• Cardiovascular Disease
• Renal Disease
• De novo Cancer

20
Metabolic Syndrome is common post-transplant
26
43 3946
0
5
10
15
20
25
30
35
40
45
50
GeneralPublic
PostTransplant
Early (12 mo) Late (72 mo)
Francioso et al. J of Hepatol. 2008

21
Components of metabolic syndrome are common after liver transplantation
31%
50%
40%
0%
10%
20%
30%
40%
50%
60%
70%
80%
PTDM PTHTN PT Obesity
Tueche SG. Transplant Proc. 2003

Metabolic syndrome increases cardiovascular mortality in general population
McCullough A. J Dig Dis. 2011 22
No Metabolic Syndrome
Metabolic Syndrome

Post-transplant metabolic syndrome is associated with increased and accelerated vascular events
Laryea et al. Liver Transplantation. 2007 23
PTMS No PTMS
ACS 13% 4%
MI 10% 0
TIA 6% 2%

24
Weight gain in post transplant period
Richards et al. Transplant International. 2004
Body Weight at the time of transplant
26.3% became obese
15.5% became obese
25
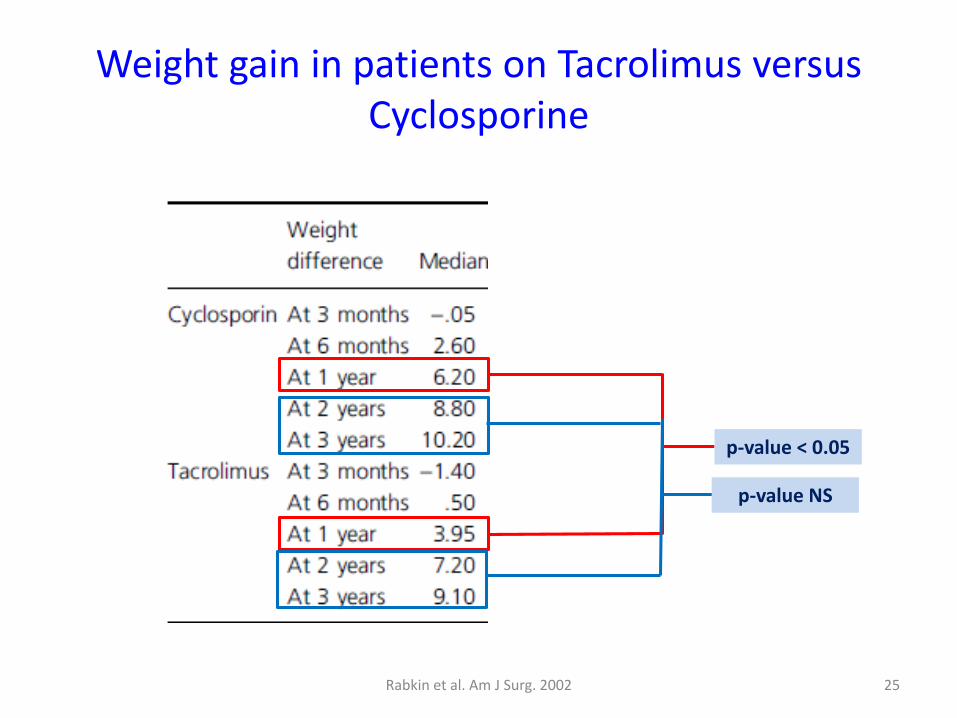
Weight gain in patients on Tacrolimus versus Cyclosporine
p-value < 0.05
p-value NS
Rabkin et al. Am J Surg. 2002
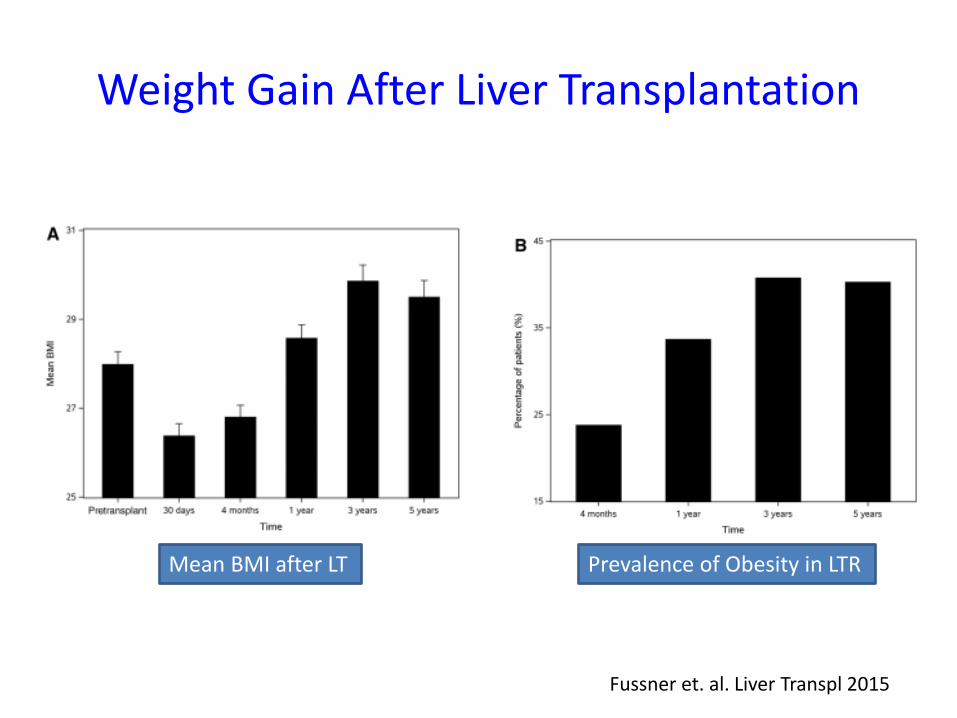
Fussner et. al. Liver Transpl 2015
Weight Gain After Liver Transplantation
Mean BMI after LT Prevalence of Obesity in LTR
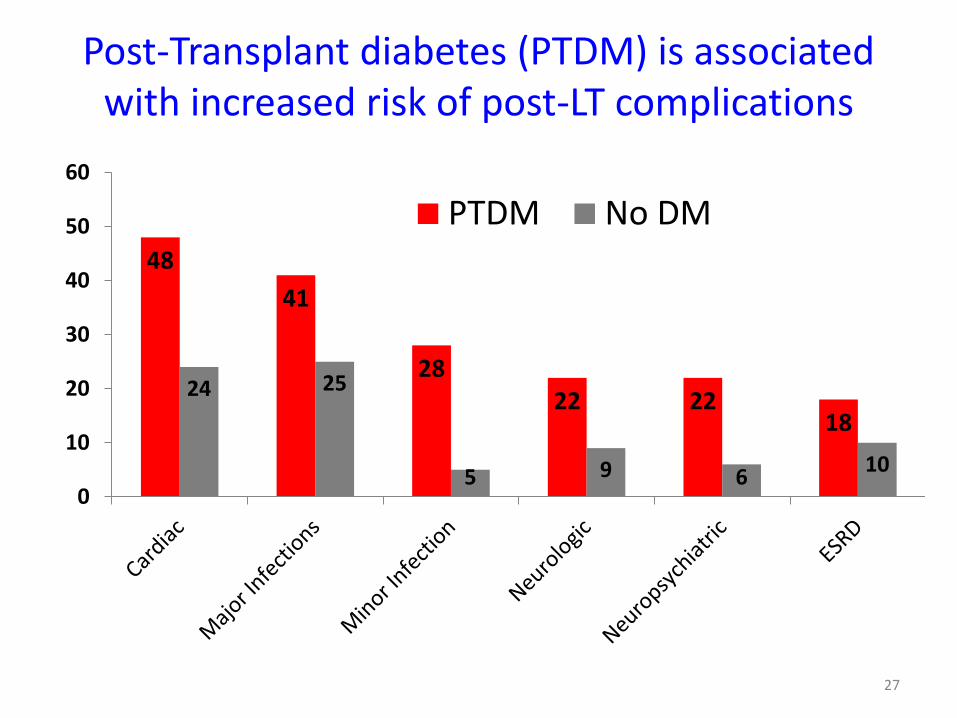
27
Post-Transplant diabetes (PTDM) is associated with increased risk of post-LT complications
48
41
2822 22
18
24 25
5 9 610
0
10
20
30
40
50
60
PTDM No DM

28
Patient & Graft Survival based on sub classification of PTDM
Moon et al. Transplantation. 2006
1: Pre-transplant DM 2: Sustained NODM 3: Transient NODM 4: Normal

29
Tacrolimus is associated with increase incidence of PTDM
Vincenti et al. Am J Transplant. 2007
Incidence of PTDM at 6 months was 8.9% in CsA and 17% in Tac
30
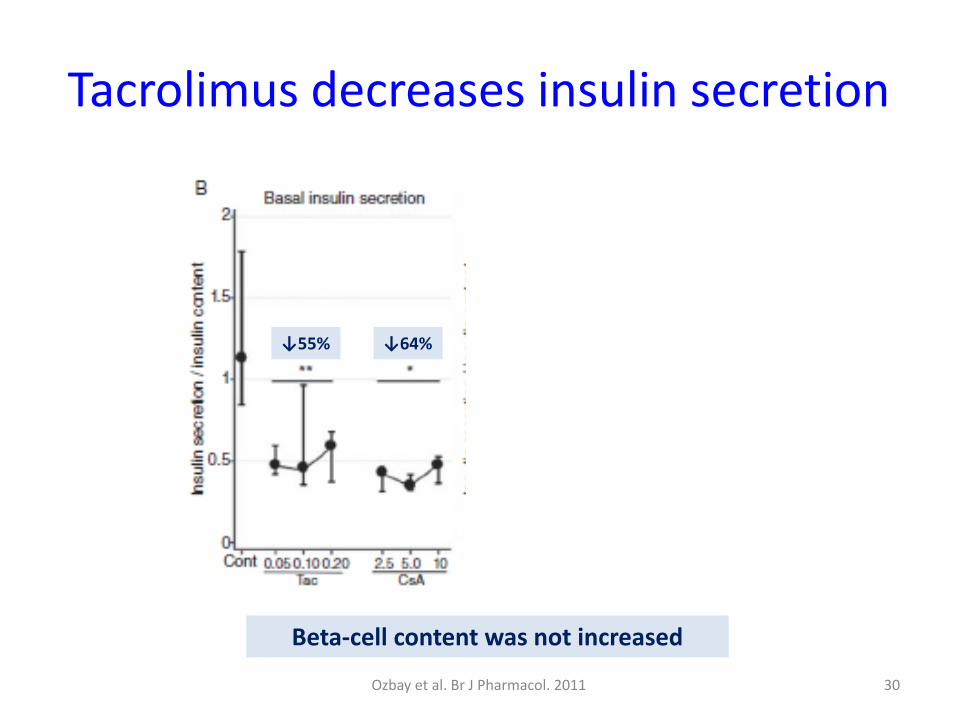
Tacrolimus decreases insulin secretion
Ozbay et al. Br J Pharmacol. 2011
Beta-cell content was not increased
↓55% ↓64%
↓79%
↓46%

• 16 randomized controlled trials• Tacrolimus associated with:
– Reduced 1 year mortality (RR 0.85)– Reduced graft loss (RR 0.73) – Acute rejection (RR 0.81)
• Tacrolimus associated with more de novo insulin requiring diabetes (RR 1.38)
31
Cochrane Review – PTDM CsA v Tac
Haddad et al. Cochrane Database Syst Rev. 2006
• Characterized by:
– Decreased HDL-C
– Increased TG, Cholesterol, LDL-C
• Cyclosporine use was associated with:
– Increased LDL-C
– Total Cholesterol
32Perrea et al. Int Urol Nephrol. 2008.
Post-transplant Dyslipidemia

33
Discontinuing CsA improves Lipid Profile
Hulzebos CV et al. Liver Transplant. 2004
• Total cholesterol ↓ by 18%• LDL-C ↓ 27%• HDL-C was not affected
• Triglycerides ↓ by 23%

Roy et al. Transplantation. 2006 34
Tacrolimus as treatment for post-OLT dyslipidemia
Switch to Tacroliums:• Reduced total Cholesterol• Modest reduction in LDL-C
No change in HDL-C• Reduction serum Triglycerides

Cyclosporine is associated with atherogenic lipoproteins
Chhatrala et al. Liver Transpl 2015

Steatosis and cyclosporine use are associated with atherogenic lipoprotein sub-particles
No
NAFL
NAFL CsA Tac0
500
1000
1500
2000
Sm
all d
en
se L
DL
part
icle
co
ncen
trati
on
Idowu et al. Liver Transpl 2016
Subjects with steatosis

Renal Function in Patients who Received a Liver Transplant for NASH cirrhosis
Houlihan et al. Liver Transpl 2011

Impact of Immunosuppression on Metabolic Conditions
CalcenurinInhibitors
MycophenolateMofetil
mTORinhibitors
Steroids
Diabetes Potential Benefit Potential Benefit
Dyslipidemia Less than CNI *
Hypertension Less than CNI
Malignancy
Renal Injury Less than CNI & mTOR inhibitors
Less than CNI
Weight Less weight gain
than CNILess weight gain
than CNI

Recurrence of NAFLD after LT and its association with liver enzymes
No Recurrence NAFL NASH0
10
20
30
40
50
% o
f C
oh
ort
Figure 1A
No Recurrence NAFL NASH0
50
100
150
Seru
m A
LT
(IU
/L)
Figure 1D

Rejection
• Rates of rejection:– Acute rejection 10-40%
– Chronic Rejection 5%
• Rates of Rejection in NASH:– Acute rejection 12.6%
– No chronic rejection
– 2.9% of AR occurred after 1 year and none after 18 months

Suggestions
• NASH cirrhosis patients undergoing LT at highest risk of developing – Metabolic complications and CVD events
– Renal dysfunction
• Post LT NASH patients have low risk of AR >1 year after LT
• Immunosuppression strategies:– Reducing CNI doses
– Combination strategies
– Individualize therapy


![EST CHP 4- Pg 4.14 pg 1-30 [SHADAB].pptx](https://img.dokumen.tips/doc/110x75/577c865a1a28abe054c0d0a9/est-chp-4-pg-414-pg-1-30-shadabpptx.jpg)