Embed Size (px)
Citation preview

Livelihoods Key Program Indicators List
1
LIVELIHOODS KEY PROGRAM INDICATORS LIST
1. OBJECTIVE AND BACKGROUND
There has been an outstanding effort to develop key indicators and promote their use by different
humanitarian actors and in different fora or coordination spaces, like The Sphere Project, thematic
clusters, etc. A good example could be the Key Results Indicators (KRI) for the sectors of food, nutrition,
health, wash and shelter introduced by DG ECHO for funded operations.
Additionally there has been considerable advance in the main sectors such as WASH, shelter, nutrition,
services in internally displaced or refugee camps... However, regarding Livelihoods programming there is
still the need to have commonly agreed standard indicators evidenced-based to facilitate quality project
design and results assessment.
Therefore, the goal of this list is to fill this gap, offering to humanitarian actors a list of Livelihoods Key
Programming Indicators. This list aims to be adopted as a standardized way to measure and analyze
livelihoods wide-impact (aggregating metrics from all livelihoods operations), and to facilitate the quality
program design and reinforce consistency of the projects in Livelihoods.
The Livelihoods Resource Centre (LRC), in consultation with practitioners1 (specialized in Livelihoods and
Monitoring & Evaluation) from different organizations (and after analyzing more than thirty different
indicators sets), has developed the livelihood key indicators' list (included in this document) as part of a
coordinated effort to achieve a standardized tool that will enable a wide-sight or analysis of livelihood
programs' impact and to improve organizations accountability.
1.1. Livelihoods Key Program Indicators List. Structure
This document provides to livelihoods practitioners and organizations with a list of Livelihoods Key
Program Indicators developed by the IFRC-Livelihoods Centre within the framework of the ERC-ECHO2.
1 Detail information about organizations and consultants that have contributed to produce this Livelihoods Key Program Indicators list in “4. ACKNOWLEDGES”) 2 The ERC (Enhance Response Capacity) program financed by ECHO, is a global outreach project that has as objective “to contribute to build and strengthen the capacities of humanitarian actors for Livelihoods and Cash based responses in disaster risk reduction, emergency and first-recovery situations”. Even if the grant holder is Spanish Red Cross (the NS who is hosting the Livelihood Resource Centre), the project involves different organizations/partners working in consortium: LRC, IFRC, French Red Cross, Oxfam Intermon, CaLP (Cash Learning Partnership, composed of Oxfam GB, Save the Children, the British Red Cross, Action against Hunger / ACF International and the Norwegian Refugee Council). Within this ERC-ECHO project, the LRC (Livelihoods Resource Centre) has developed two outcomes or products related to standardization of livelihoods indicators: The list of Key Program Indicators (shown in this document), and a Compilation list of livelihoods indicators. All the details about objectives, structure, definitions, etc., of these two

Livelihoods Key Program Indicators List
2
A total of twenty (20) Key Livelihoods Program Indicators have been identified. They are grouped under
eight different categories (that were identified during the analysis process). These categories are (or are
related to) livelihoods objectives/purposes (following the ECHO-KRI approach or pattern)3:
The assembling categories are:
Achieving survival and/or livelihoods protection
threshold
Ownership and access to productive assets
Productivity enhancement
Increase and/or diversification of incomes
Gain and application of productive knowledge
Access to livelihoods support services and markets
Disaster Risk Reduction and Natural Resources
Management
Livelihoods rights, policies and regulations
improvement
In order to make the indicator more comprehensible, in terms of the meaning, its purpose, how to
measure it and its scope, each indicator has been defined together with the following complementary
and definition elements1:
Indicator
Description / Definition (with explanation of the rationale behind the indicator)
Detail / disaggregate by (with detail information that could be included to the indicator to specify
target group, geographical zone, etc.)
Trend
Data Source (including Unit of measurement detail)
Measurement Guidance (as a guidance on methodology and consideration to take into account)
Also for each indicator, practitioners and users could also find some examples to support them in the
indicators definition.
outcomes are presented and explained in the Guide “ECHO. Livelihoods Indicators Guide”: Livelihoods Standard Indicators Tools Guide. Link: www.livelihoodscentre.org 3 Following ECHO KRI (Key Results Indicators) pattern, the project has identified eight objectives / purposes, to categorize (or assemble) the Livelihoods Key program indicators. These categories (objectives) range from the achievement of survival and/or livelihoods protection threshold (related to emergency and recovery), until the changes in the structures and processes that regulate and enable the livelihoods development environment. Each objective/purpose, and depending on their nature or scope, contains between one and four indicators.
These categories are not mutually exclusive,
existing a closer cause-effect relationship
between some of them (e.g. productivity
enhancement increase of incomes;
application productive skills productivity
enhancement).
They have been defined to allow practitioners
to find the indicators that better match with
the project/program objectives.
For instance, if our program has as objective
to increase population better practices to
improve and protect livelihoods and natural
resources.
We can select indicators from categories:
“Gain and application of productive
knowledge”
“Disaster Risk Reduction and Natural
Resources Management”
Livelihoods Key Program Indicators List
3
The details of the Livelihoods Indicators outcomes developed within this program (objective, definition,
indicators elements, analysis dimensions, sources, etc.) are explained in the Livelihoods Indicators
Guide4.
1.2. Livelihoods Key Program Indicators List. Terminology and Notes
Acronyms and definitions: Acronyms and technical concepts, used in the indicator definition or
description, are explained and detailed in the same indicator, and are also compiled at end of the
document (3. DEFINITIONS AND ACRONYMS).
Format: Indicators definition use a specific format to allow their some use flexibility.
<…>: different options to consider, select one of them
[…]: extra information to include in the indicator that depends on the program definition, context,
etc., (e.g. [specify the type of asset]).
(…): explanatory comment
Notes:
1) Measurement of guidelines includes a list of secondary data sources that can be used, when
adequate, to save time and money (when relevant and reliable); however, this can be changed if
felt misleading.
2) Disaggregated data / detail. To measure disaggregation (by gender, age, or other group),
remember that analysis should be done in a statistically significant way (do not extrapolate from
a subset back to the larger sample unless it were statistically valid).
3) Disaggregated data / detail by religious, ethnic or political minorities. Be careful with the
collection of this information. It can be seen as inclusion but could also compromise the
independence and neutrality of the humanitarian spirit. In some areas, it is better not to collect
this type of data for fear of reprisals.
4 Reference: “ECHO. Livelihoods Indicators Guide”: Livelihoods Standard Indicators Tools Guide. Link: www.livelihoodscentre.org

Livelihoods Key Program Indicators List
4
2. LIVELIHOODS KEY PROGRAM INDICATORS LISTS
2.1. OBJECTIVE 1. Survival and Livelihoods Protection Threshold
"Change or improvement of household ability to meet survival and livelihood protection thresholds.
It includes households’ capacity to respond to their immediate needs, to restore their livelihoods and
the change in use of negative coping strategies"
INDICATOR. 1 KRI-1-1A Number/percentage of targeted households [have enough <food, cash, incomes> to] meet their survival
threshold
Description
Change in household capacity to meet their survival threshold
This indicator uses the HEA/HES approach to determine households’ survival threshold (food needs), and
population ability to meet their food needs, using their coping strategies or other strategies, as per the baseline.
Includes food/cash distributions interventions
Includes livelihoods restarting interventions (sources of food and income).
Remark: This indicator is more related to Food Security sector, bit it is included because supporting households
food needs contributes to protect their livelihoods.
Definitions:
Survival threshold5: The Survival Threshold represents the total income required to cover:
- 100% of minimum food energy needs (2100 kcals per person), plus
- The costs associated with food preparation and consumption (i.e. salt, soap, kerosene and/or
firewood for cooking and basic lighting), plus
- Any expenditure on water for human consumption.
HEA: Household Economic Approach
HES: Household Economic Security
Detail / Disaggregate by:
Geography/Livelihoods zone;
Head of household gender, age, disabilities, chronic diseases, dependency ratio,
and any other relevant criteria, such as urban/rural, religious, ethnic or political
identities;
Wealth groups; Livelihoods group (e.g. pastoralist, farmers, traders)
Period to achieve the objective;
Trend / Change:
Increase
Data source:
Both secondary and primary data collection can be
used according to context.
Measurement Guidance:
5 Source: Practitioners’ Guide to HEA, Introduction to the Household Economy Approach Framework
Livelihoods Key Program Indicators List
5
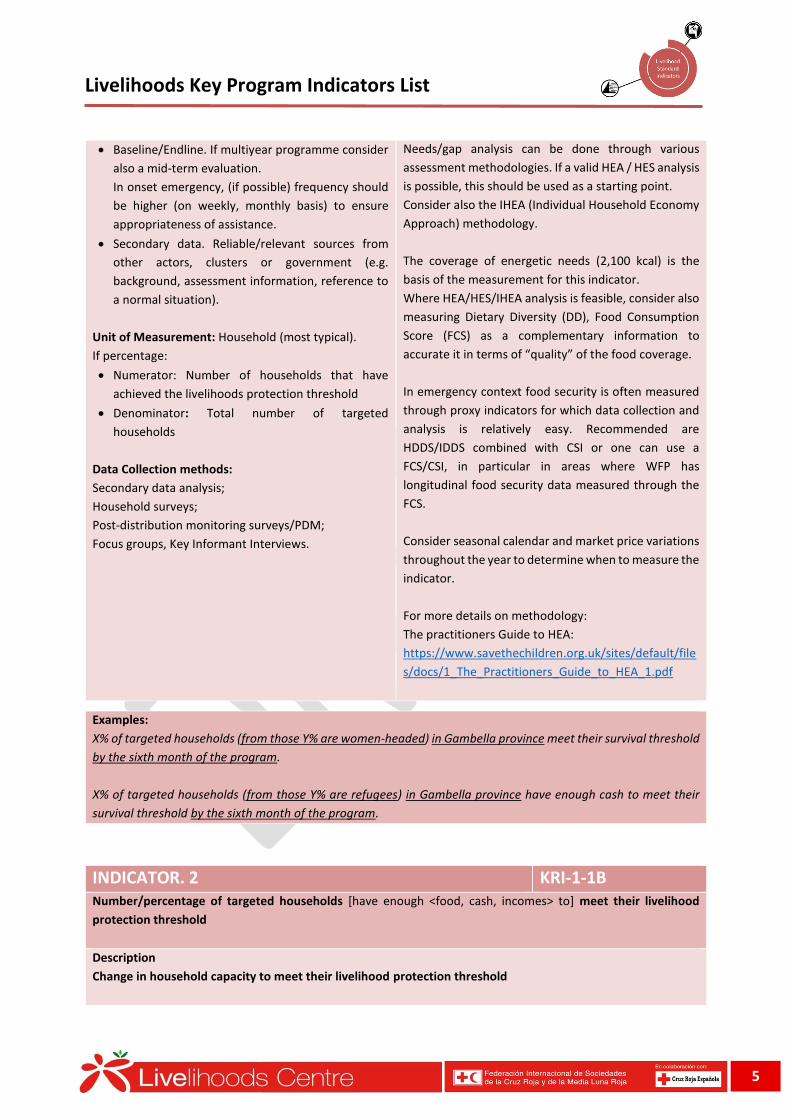
Baseline/Endline. If multiyear programme consider
also a mid-term evaluation.
In onset emergency, (if possible) frequency should
be higher (on weekly, monthly basis) to ensure
appropriateness of assistance.
Secondary data. Reliable/relevant sources from
other actors, clusters or government (e.g.
background, assessment information, reference to
a normal situation).
Unit of Measurement: Household (most typical).
If percentage:
Numerator: Number of households that have
achieved the livelihoods protection threshold
Denominator: Total number of targeted
households
Data Collection methods:
Secondary data analysis;
Household surveys;
Post-distribution monitoring surveys/PDM;
Focus groups, Key Informant Interviews.
Needs/gap analysis can be done through various
assessment methodologies. If a valid HEA / HES analysis
is possible, this should be used as a starting point.
Consider also the IHEA (Individual Household Economy
Approach) methodology.
The coverage of energetic needs (2,100 kcal) is the
basis of the measurement for this indicator.
Where HEA/HES/IHEA analysis is feasible, consider also
measuring Dietary Diversity (DD), Food Consumption
Score (FCS) as a complementary information to
accurate it in terms of “quality” of the food coverage.
In emergency context food security is often measured
through proxy indicators for which data collection and
analysis is relatively easy. Recommended are
HDDS/IDDS combined with CSI or one can use a
FCS/CSI, in particular in areas where WFP has
longitudinal food security data measured through the
FCS.
Consider seasonal calendar and market price variations
throughout the year to determine when to measure the
indicator.
For more details on methodology:
The practitioners Guide to HEA:
https://www.savethechildren.org.uk/sites/default/file
s/docs/1_The_Practitioners_Guide_to_HEA_1.pdf
Examples:
X% of targeted households (from those Y% are women-headed) in Gambella province meet their survival threshold
by the sixth month of the program.
X% of targeted households (from those Y% are refugees) in Gambella province have enough cash to meet their
survival threshold by the sixth month of the program.
INDICATOR. 2 KRI-1-1B Number/percentage of targeted households [have enough <food, cash, incomes> to] meet their livelihood
protection threshold
Description
Change in household capacity to meet their livelihood protection threshold

Livelihoods Key Program Indicators List
6
This indicator uses the HEA/HES approach to determine households’ livelihoods protection threshold, and
population ability to meet their basic needs, using their coping strategies or other strategies, as per the baseline.
Includes food/cash distributions interventions
Includes livelihoods restarting interventions (sources of food and income)
Definitions:
Livelihoods protection threshold6: The Livelihoods Protection Threshold represents the total income required
to sustain local livelihoods. This means total expenditure to:
- Ensure basic survival needs, plus
- Maintain access to basic services (e.g. routine medical and schooling expenses), plus
- Sustain livelihoods in the medium to longer term (e.g. regular purchases of seeds, fertilizer,
veterinary drugs, etc.), plus
- Achieve a minimum locally acceptable standard of living (e.g. purchase of basic clothing, coffee/tea,
etc.).
HEA: Household Economic Approach
HES: Household Economic Security
Detail / Disaggregate by:
Geography/Livelihoods zone;
Head of household gender, age, disabilities, chronic diseases, dependency ratio,
and any other relevant criteria, such as urban/rural, religious, ethnic or political
identities;
Wealth groups; Livelihoods group (e.g. pastoralist, farmers, traders)
Period to achieve the objective;
Trend / Change:
Increase
Data source:
Both secondary and primary data collection can be
used according to context.
Baseline/Endline. If multiyear programme consider
also a mid-term evaluation.
In onset emergency, (if possible) frequency should
be higher (on weekly, monthly basis) to ensure
appropriateness of assistance.
Secondary data. Reliable/relevant sources from
other actors, clusters or government (e.g.
assessment information, reference to a normal
situation).
Unit of Measurement: Household (most typical).
If percentage:
Numerator: Number of households that have
achieved the livelihoods protection threshold
Denominator: Total number of targeted
households
Measurement Guidance:
Use HEA/HES measure approach.
Consider also the IHEA (Individual Household Economy
Approach) methodology.
Consider seasonal calendar and market price variations
throughout the year to determine when to measure the
indicator.
For more details on methodology:
The practitioner guide to HEA:
https://www.savethechildren.org.uk/sites/default/file
s/docs/1_The_Practitioners_Guide_to_HEA_1.pdf
6 Source: Practitioners’ Guide to HEA, Introduction to the Household Economy Approach Framework
Livelihoods Key Program Indicators List
7
Data Collection methods:
Secondary data analysis;
Household surveys;
Focus groups, Key Informant Interviews.
Example:
X% of targeted pastoralist households in Dawa Region meet their livelihoods protection threshold at the end of
the program.
INDICATOR. 3 KRI-1-2 Number/percentage of targeted population's livelihoods <restored to, improved from> <pre disaster level,
baseline level, last year -same period-, normal year>
Description
Change in population's livelihoods compared with a reference level (pre disaster level, baseline level, etc.)
This indicator measures the population / households / productive organizations / micro, small and medium
enterprises (MSME) capacity to restore their livelihoods (source of food and income).
Includes in-kind distributions (seeds, livestock, tools, etc.) that allow targeted population to restore their
livelihoods
Includes cash distribution interventions to restart targeted population's livelihoods
Includes all kind of livelihoods restarting interventions (sources of food and income)Includes in-kind
distributions (seeds, livestock, tools, etc.) that allow targeted population to restore their livelihoods
Definitions:
MSME: micro, small and medium enterprises (formal or informal)
Detail / Disaggregate by:
Geography/Livelihoods zone;
Gender, age, disabilities, chronic diseases (if individuals, associations members, etc.);
Head of household gender, age, disabilities, chronic diseases, dependency ratio (if
households), and any other relevant criteria, such as urban/rural, religious, ethnic or
political identities;
Wealth groups; Livelihoods group (e.g. pastoralist, farmers, traders)
Period to achieve the objective;
Trend / Change:
Increase or restore
Data source:
Both secondary and primary data collection can be
used according to context.
Baseline/Endline. If multiyear programme consider
also a mid-term evaluation.
Secondary data. Reliable/relevant sources from
other actors, clusters or government (e.g.
Measurement Guidance:
Measure this indicator asking households directly
about the recovery of their livelihoods activity, and
through questions related to it (e.g. number of Ha
planted and/or harvested number of daily labour hired,
number of heads of livestock, etc.).

Livelihoods Key Program Indicators List
8
assessment information, reference to a normal
situation).
Unit of Measurement: Population, but can also be
households or productive organizations, or MSME. If
percentage:
Numerator: Number of targeted population that
have restored/improved their livelihoods activity
Denominator: Total number of targeted population
Data Collection methods:
Secondary data analysis;
Household surveys.
MSME or productive organizations records, focus
groups, key informant interviews and surveys.
For productive organizations and MSME (micro, small
and medium enterprises) use also record information
(in/out sales, employees/ members, etc.)
Improvement/increase threshold must be defined in
advance using baseline and secondary information.
Consider seasonal calendar and market price variations
throughout the year to determine when to measure the
indicator.
Example:
X targeted population’s livelihoods (from those Y are women) in the urban area of Freetown restored to pre
disaster level
INDICATOR. 4 KRI-1-3 Number/percentage of targeted households reduce their coping strategies compared with <pre disaster level,
or baseline level, last year -same period-, normal year>
Description
Change of households' coping strategies compared with pre disaster levels, or baseline level, last year -same
period-, normal year.
Reducing coping strategies indicates improved food security, recovery of food and income sources, less pressure
on alternative coping strategies and improved resilience.
Affected households may use coping strategies to deal with a reduced ability to access food, related to change of
food consumption behavior, and other adaptation/response strategies that could be damaging for
households/people livelihoods.
Definitions:
Coping Strategies7: are mechanisms that people choose as a way of living through difficult times. They are
usually set off by events affecting their livelihoods and way of living. Some coping strategies are not damaging
to livelihoods and are easily reversible: for example, short-term dietary changes, migration of individuals for
work, use of savings or solidarity networks. Other strategies may be damaging and tend to be harder to
reverse: for example, sale of land, sale of ‘productive’ assets, intensive use of wood from nearby causing
deforestation, taking children out of school to make them work (child labour) or prostitution.
Detail / Disaggregate by: Trend / Change:
7 Source: IFRC guidelines for Livelihoods programming, IFRC.

Livelihoods Key Program Indicators List
9
Geography/Livelihoods zone;
Head of household gender, age, disabilities, chronic diseases, dependency ratio, and
any other relevant criteria, such as urban/rural, religious, ethnic or political identities;
Wealth groups; Livelihoods group (e.g. pastoralist, farmers, traders)
Period to achieve the objective;
Decrease
Decrease must be
relevant.
Data source:
Both secondary and primary data collection can be
used according to context.
Baseline/Endline. If multiyear programme consider
also a mid-term evaluation.
In onset emergency, (if possible) frequency should
be higher (on weekly, monthly basis) to ensure
appropriateness of assistance.
Secondary data. Reliable/relevant sources from
other actors, clusters or government (e.g.
assessment information, reference to a normal
situation).
Unit of Measurement: Household.
If percentage:
Numerator: Number of households that have
reduced their coping strategies
Denominator: Total number of targeted
households
Data Collection methods:
Secondary data analysis;
Household surveys;
Focus groups, Key Informant Interviews.
Measurement Guidance:
Change in Coping Strategies can be measured by the
Coping Strategy Index, the Household Hunger Scale or
similar hunger experience indicator.
CSI (Coping Strategy Index) comprises a series of
questions about how households manage to cope with
a shortfall in food, that looks at both the frequency of a
coping behavior (how often is the strategy used) and
severity (what degree of food insecurity do they
suggest). Can be used for targeting and monitoring.
To use this indicator (due the fact that coping strategies
can be measure using multiple components), it’s
important to define (and rank) the list coping strategies
that we are going to measure over the project at the
beginning of the project –assessment-, based on
targeted group and context, and including relevant
coping strategies related to livelihoods protection (e.g.
sale of productive assets, migration, consumption of
seed stock)
Measure:
> Number of coping strategies used relative to baseline
> Frequency of use of coping strategies
Decrease/reduction threshold must be defined in
advance using baseline and secondary information.
• Standard CSI for food security and livelihood is
preferred.
• Ranking can support assessing change and
importance of coping strategy pattern.
• Expanded context-adapted CSI for livelihoods can be
developed if time and means allow. Note that
comparison across livelihood zones might be
compromised.
• Needs to consider potential changes in seasonal
coping and explanation of the same, e.g. normality vs
abnormality.
Watch Out For!
- Coping strategies may vary between cultural contexts
and should be verified and adapted where necessary.
Livelihoods Key Program Indicators List
10
- Coping strategies vary in terms of severity.
Accordingly, the use of coping strategies over a long
period will have a different effect on a household’s
ability to recover.
For more details on methodology:
Coping Strategies Index Field Methods Manual:
http://www.seachangecop.org/sites/default/files/doc
uments/2008%2001%20TANGO%20-
%20Coping%20Strategies%20Index.pdf
Household Hunger Scale:
http://www.fao.org/fileadmin/user_upload/wa_works
hop/docs/HH_Hunger_Scale.pdf
Example:
At the end of the program X% of targeted households (from those Y% are women-headed) in the agro-pastoralist
area of Awsard reduce their coping strategies compared with baseline.

Livelihoods Key Program Indicators List
11
2.2. OBJECTIVE 2. Ownership and Access to Productive Assets
“Change in number of productive assets owned or accessed by targeted population (households,
communities, productive associations).
Includes the capacity to protect or replace productive assets after a shock, increase the number and/or
the improvement or access to improved assets. Considers the equitable access to productive assets”
INDICATOR. 5 KRI-2-1 Number/percentage of targeted population <households, communities, productive organizations, MSME> are
able to <protect, replace, increase, improve> their productive assets (specify if needed) [above <pre disaster
level, baseline level, a normal year, last year -same period->] [in a safe manner]
Description
Change in number or quality of productive assets owned or accessed by targeted population.
Increased number, improvement, preservation or reduced depletion of livelihoods productive assets indicates
increase in food security, economic security and resilience.
This indicator is focused on equipment, infrastructures and inputs provision and access, supported with different
mechanisms (cash, in-kind, income/employment support, safety nets, etc.).
• Includes group and individual agriculture assets/inputs supply (e.g. seeds, tools, irrigation systems, land)
• Includes livestock, pisciculture, aquaculture, apiculture, cuniculture, etc., support (e.g. distribution of
productive assets, reduction of depletion, etc.).
• Includes group and individual IGA (income generation activities) assets distribution/support.
• Includes any type of assets support (recovery, improvement) to agro based, non-agro based, or service based
income generating activity, can include value addition or transformation etc.
• Includes the support on improved productive assets (e.g. improved seeds)
• Includes household/community/productive association creation or reconstruction of productive
infrastructures.
At community level we need to specify the type of community/group and to indicate the inclusion/access of all
members of these groups to the common assets.
This indicator also include the "build back better" approach, which not just recover what households/productive
groups had before the crisis/shock, but also improve it to make them more resilient and sustainable.
Definitions:
MSME: micro, small and medium enterprises (formal or informal)
Safe manner: To include considering the context (mostly in conflict areas). Interventions that promote the
replacement, increase or improvement of productive assets must assure security of targeted population.
Detail / Disaggregate by:
Geography/Livelihoods zone;
Gender, age, disabilities, chronic diseases (if individuals, associations members, etc.);
Head of household gender, age, disabilities, chronic diseases, dependency ratio (if
households), and any other relevant criteria, such as urban/rural, religious, ethnic or
political identities;
Trend / Change:
Restore or increase

Livelihoods Key Program Indicators List
12
Wealth groups; Livelihoods group (e.g. pastoralist, farmers, traders)
Period to achieve the objective;
Data source:
Both secondary and primary data collection can be
used according to context.
Baseline/Endline. If multiyear programme consider
also a mid-term evaluation.
Secondary data. Reliable/relevant sources from
other actors, clusters or government (e.g.
assessment information, reference to a normal
situation).
Unit of Measurement: Population, but can also be
households or productive organizations, or MSME.
If percentage:
Numerator: Number of targeted population able to
<protect, restore, increase, improve> their
productive assets.
Denominator: Total number of targeted population
Data Collection methods:
Secondary data analysis;
Household/productive organizations/etc. survey and
focus groups;
Key Informant Interviews;
Assets distribution reports;
MSME / productive organizations’ assets records;
Measurement Guidance:
Measure the number of productive assets owned (e.g.
livestock heads, land, tools, equipment) or able to
access (e.g. seed for the next plantation, access to
land).
Comparison of number of productive assets should be
done related to:
- normal year (note that in some cases targeted
population could have problems to inform about "a
normal year" mostly in slow onset disasters)
- baseline
- last year -at the same period-
[primary production] Consider potential changes in
seasonal asset ownership and active seasonal depletion
or explanation of the same (e.g. sold a goat to buy food
at the beginning of the lean season; destocking, pests
and diseases prevalence depending, etc.).
Consider market price variations throughout the year.
Examples:
At the end of the program X% of targeted households (from those Y% are household with a high dependency ratio)
in Podor region are able to restore their productive assets above pre disaster level
At the end of the program X targeted productive organizations (from those Y are women organizations) in Podor
region are able to increase their productive assets above baseline level.
INDICATOR. 6 KRI-2-2 Number/percentage of targeted population <households, productive organizations, MSME> have enough
productive assets (specify the type of asset if necessary) to <recover, strengthen> their livelihoods
Description
Change in number of targeted population that have enough productive assets to recover, resume or strengthen
their livelihoods

Livelihoods Key Program Indicators List
13
Increased number, improvement, preservation or reduced depletion of livelihoods productive assets to ensure
households/productive associations/MSMEs capacity to restore or improve their livelihoods activities (compared
with baseline or pre-shock).
This indicator is focused on equipment and inputs provision and access, supported with different mechanisms
(safety nets, cash, in-kind, income/employment support, etc.) and its comparisons with beneficiaries’ needs.
This indicator also include the "build back better" approach, which not just recover what households/productive
groups had before the crisis/shock, but also improve it to make them more resilient and sustainable.
Definitions:
MSME: micro, small and medium enterprises (formal or informal)
Detail / Disaggregate by:
Geography/Livelihoods zone;
Gender, age, disabilities, chronic diseases (if individuals, associations members, etc.);
Head of household gender, age, disabilities, chronic diseases, dependency ratio (if
households), and any other relevant criteria, such as urban/rural, religious, ethnic or
political identities;
Wealth groups; Livelihoods group (e.g. pastoralist, farmers, traders)
Period to achieve the objective;
Trend / Change:
Restore or increase
Data source:
Both secondary and primary data collection can be
used according to context.
Baseline/Endline. If multiyear programme consider
also a mid-term evaluation.
Secondary data. Reliable/relevant sources from
other actors, clusters or government (e.g.
assessment information, reference to a normal
situation).
Unit of Measurement: Population, but can also be
households or productive organizations, or MSME. If
percentage:
Numerator: Number of targeted population with
enough productive assets to <restore, strengthen>
their livelihood activity.
Denominator: Total number of targeted population
Data Collection methods:
Secondary data analysis;
Household/productive organizations/etc. survey and
focus groups;
Key Informant Interviews;
Assets/cash distribution reports;
Productive organizations/MSMEs’ assets records;
Measurement Guidance:
Measure the number of productive assets owned (e.g.
livestock heads, land, tools, equipment) or able to
access (e.g. seed for the next plantation), and
comparison of the achievement (or preservation) with
the needs to restart, resume or strengthen the
livelihoods activity.
Measure of needs could be difficult depending on the
livelihoods activity.
[primary production] Consider potential changes in
seasonal asset ownership and active seasonal depletion
or explanation of the same (e.g. sold a goat to buy food
at the beginning of the lean season; destocking, pests
and diseases prevalence depending, etc.).
Consider market price variations throughout the year.

Livelihoods Key Program Indicators List
14
Examples:
X targeted productive organization (from those Y are women members) in the urban area of Kirehe district have
enough productive assets to recover their livelihoods by the sixth month of the project.
X% of targeted households in Kirehe district have enough irrigation points to strengthen their livelihoods activity
at the end of the project.
INDICATOR. 7 KRI-2-3 Number of livelihoods productive assets/infrastructures (specify, e.g. productive lands, transformation
infrastructures, etc.) <restored to, improved from, build> [if necessary, specify the reference period for
comparison <pre disaster level, baseline level>]
Description
Change in number and/or quality of livelihoods productive assets/infrastructures
Increased number, improvement or preservation of livelihoods assets and infrastructures indicates increase in
food security, economic security and resilience. This indicator is aligned with the two previous indicators, but
focused infrastructures and productive assets, that at the same time support the production capacity of
households/communities/productive associations.
• Includes all kind of livelihoods physical/natural assets recovery activities (e.g. productive land, forestry area,
river basin, transformation infrastructures)
• Includes group and individual IGA (income generation activities) infrastructures recovery or improvement.
• Includes agriculture, livestock, pisciculture, aquaculture, apiculture, cuniculture, etc., infrastructure support (for
their recovery or improvement).
• Includes household/community/productive association creation or reconstruction of productive
infrastructures.
At community level we need to specify the type of community/group and to indicate the inclusion/access of all
members of these groups to the common assets.
This indicator also include the "build back better" approach, which not just recover what households/productive
groups had before the crisis/shock, but also improve it to make them more resilient and sustainable.
Detail / Disaggregate by:
Geography/Livelihoods zone;
Wealth groups; Livelihoods group (e.g. pastoralist, farmers, traders)
Period to achieve the objective;
Trend / Change:
Restore or increase
Data source:
Both secondary and primary data collection can be
used according to context.
• Baseline/Endline. If multiyear programme consider
also a mid-term evaluation.
• Secondary data. Reliable/relevant sources from
other actors, clusters or government (e.g.
Measurement Guidance:
Measure of infrastructures build/rebuild, Ha of
recovery lands/forestry areas, meter of
recover/improved irrigation channels, etc.
Depending on the type of intervention, the change
should be measured using technical methods.

Livelihoods Key Program Indicators List
15
assessment information, reference to a normal
situation).
Unit of Measurement: Depending on the livelihood
infrastructure/asset (e.g. forest Ha, coastline meter-
kilometer, number of water sources, etc.)
Data Collection methods:
Secondary data analysis;
Livelihoods infrastructure recovery measure;
Household surveys and focus groups;
Key Informant Interviews.
It is important to define how to measure the
change/improvement before using the indicator. If for
example we want to measure the number of hectares
recovered after floods, it's necessary to define in
advance the recovery techniques (e.g. cleaning up of
crop lands, construction-reconstruction of terraces and
embankments).
Examples:
At the end of the project X Ha of agricultural land in Mahama sector restored to pre disaster level
X Km of irrigartion chanels in rural area of Kirehe district restored and improved from base-line level
X cooperative warehouses build in Kihere district at the end of the project

Livelihoods Key Program Indicators List
16
2.3. OBJECTIVE 3. Productivity Enhancement
“Increase of productivity (primary production, income generation activities, etc.), considering that it
means the relationship between production and resources/time dedicated to obtain them.
Includes the increase of production, the reduction of resources and/or the reduction of production
losses”.
INDICATOR. 8 KRI-3-1 Number/percentage of targeted population <households, productive organizations, MSME> improve their
production by (specify how much) [specify type of production if necessary], [due to <new practices, new
technology, trainings, etc.>]
Description
Change in targeted population production and/or the production quality compared to a normal year or baseline
level.
This indicator is focused on production increase (or improvement) supported by different mechanisms (cash/in-
kind productive assets, technical support, new or improved productive assets, etc.).
Includes staple crop, vegetable and agroforestry production support.
Includes livestock, pisciculture, aquaculture, apiculture, cuniculture, etc., support.
Includes the use of improved productive assets (e.g. improved seeds)
Includes group and individual IGA support (handicraft, byproducts, primary production transformation, etc.).
Includes education training and capacity building activities.
Includes household / community / productive association / MSME creation or reconstruction of productive
infrastructures that allow the improvement of production (irrigation infrastructures, etc.).
Definitions:
MSME: micro, small and medium enterprises (formal or informal)
IGA: income generation activities
Detail / Disaggregate by:
Geography/Livelihoods zone;
Gender, age, disabilities, chronic diseases (if individuals, associations members, etc.);
Head of household gender, age, disabilities, chronic diseases, dependency ratio (if
households), and any other relevant criteria, such as urban/rural, religious, ethnic or
political identities;
Wealth groups; Livelihoods group (e.g. pastoralist, farmers, traders)
Period to achieve the objective;
Trend / Change:
Increase
Data source:
Both secondary and primary data collection can be
used according to context.
Baseline/Endline. If multiyear programme consider
also a mid-term evaluation.
Secondary data. Reliable/relevant sources from
other actors, clusters or government (e.g.
Measurement Guidance:
Improvement/increase threshold must be defined in
advance using baseline and secondary information.
[primary production] Consider seasonal calendar to
determine when to measure the indicator (e.g. main

Livelihoods Key Program Indicators List
17
assessment information, reference to a normal
situation).
Unit of Measurement: Population, but can also be
households or productive organizations, or MSME. If
percentage:
Numerator: Number of targeted population that
have improved their production (fixed threshold).
Denominator: Total number of targeted population
Data Collection methods:
Secondary data analysis;
Household/productive organizations/etc. survey and
focus groups;
Key Informant Interviews;
Production monitoring reports/records.
harvest, pests and diseases prevalence depending on
the period.)
If necessary, link the increase of the productivity/or the
quality of the products with the new practices or
technologies provided by the project/program (e.g.
new kind of cash crop)
Note that improvement of quality should require some
certification/quality tests.
Examples:
X% handcraft targeted cooperatives (from those Y% are refugee members) in Bangui improve their production by
Z% during the program period.
X targeted households (from those Y are women-headed) in Dawa province improve their staple crops production
by Z% during the program period due to the use of improved seeds.
INDICATOR. 9 KRI-3-2 Number/percentage of targeted population <households, productive organizations, MSME> reduce their
production losses by (specify how much) [specify type of production if necessary], [resulting from use of
improved practices (specify practices)]
Description
Change in targeted population production losses compared to a baseline level (or normal year, same period
last year, etc.) resulting from use of improved practices.
Indicator focused on reducing production losses (e.g. post-harvest crop loss, herd heads, etc.) through product
processing, storage and preservation improvement, use of new technologies, reduction of herd diseases, etc.
Includes staple crop, vegetable and agroforestry production conservation/processing.
Includes livestock, pisciculture, aquaculture, apiculture, cuniculture, etc., veterinary and conservation
support.
Includes group and individual IGA support (handicraft, byproducts, primary production transformation,
conservation good practices etc.)
Definitions:
MSME: micro, small and medium enterprises (formal or informal)
IGA: income generation activities
Livelihoods Key Program Indicators List
18
Detail / Disaggregate by:
Geography/Livelihoods zone;
Gender, age, disabilities, chronic diseases (if individuals, associations members, etc.);
Head of household gender, age, disabilities, chronic diseases, dependency ratio (if
households), and any other relevant criteria, such as urban/rural, religious, ethnic or
political identities;
Wealth groups; Livelihoods group (e.g. pastoralist, farmers, traders)
Period to achieve the objective;
Trend / Change:
Decrease
Data source:
Both secondary and primary data collection can be
used according to context.
Baseline/Endline. If multiyear programme consider
also a mid-term evaluation.
Secondary data. Reliable/relevant sources from
other actors, clusters or government (e.g.
assessment information, reference to a normal
situation).
Unit of Measurement: Population, but can also be
households or productive organizations, or MSME. If
percentage:
Numerator: Number of targeted population that
have reduced their production losses.
Denominator: Total number of targeted population
Data Collection methods:
Secondary data analysis;
Household/productive organizations/etc. survey and
focus groups;
Key Informant Interviews;
Production monitoring reports/records.
Measurement Guidance:
Losses reduction threshold must be defined in advance
using baseline and secondary information.
For some livelihoods activity this indicator is difficult to
measure. If we need to compare initial and final
production losses (or the losses in a normal
year/period) due to the use of production processing or
conservation.
Otherwise, we can measure the difference in incomes
(increase of revenues due to the sale of processing
production) or the reduction in expenses food/seeds
(due to production conservation).
[Primary production] Consider seasonal calendar to
determine when to measure the indicator.
[Livestock, agriculture] measure the disease/pests
cases before and after.
Examples:
X% of targeted gardening women associations (from those Y% belong to household with a high dependency ratio)
in Kiffa province reduce by at least X% their production losses resulting from use conservation preservation and
transformation practices in the first year of the program.
At the end of the project, X% of the pastoralist targeted households in Dawa province reduce by at least Y% their
herds losses resulting from use of thanks to improved practices.

Livelihoods Key Program Indicators List
19
2.4. OBJECTIVE 4. Increase and/or Diversification of Incomes
“Increase and/or diversification of household’s income in a sustainable way.
Includes all kind of interventions that promote and strengthen formal or informal employment creation
(considering both employment and self-employment), promote the income generation sources
diversification, and stabilize and strengthen existing sources of incomes to increase the net incomes.”
INDICATOR. 10 KRI-4-1 Number/percentage of targeted population <households, productive organizations, MSME> that <stabilize,
improve> their net income by (specify the improvement) during a defined period (specify), [due to (specify if
necessary the livelihoods activity and the cause of improvement)].
Description
Change in number of targeted population stabilizing or improving their <monthly/weekly/annual> net income
for a defined period (e.g. six, twelve months).
Stabilizing and Increasing net income indicates: or improvement of productivity (primary production, IGA), or
improvement of market-links (value chain, sell prices), or efficient application of productive/business skills
(reduce of expenses), or access to new or better-paid employment.
To show sustainability it is necessary that income increase or stabilization last a defined period of time (6 months,
12 months), depending on the duration of the program.
Increase of income (or stabilized income) should be fixed and (if possible) reference to context wage/salary/etc.
Includes any type of agro based, non-agro based, or service based income generating activity, can include
market chain support, value addition or transformation etc.
Includes access to employment.
Includes strengthening of existing sources of income, or creation/diversification of sources of income.
Definitions:
MSME: micro, small and medium enterprises (formal or informal)
IGA: income generation activities
Detail / Disaggregate by:
Geography/Livelihoods zone;
Gender, age, disabilities, chronic diseases (if individuals, associations members, etc.);
Head of household gender, age, disabilities, chronic diseases, dependency ratio (if
households), and any other relevant criteria, such as urban/rural, religious, ethnic or
political identities;
Wealth groups; Livelihoods group (e.g. pastoralist, farmers, traders)
Period to achieve the objective;
Trend / Change:
stabilize or increase
increase must be
relevant
Data source:
Both secondary and primary data collection can be
used according to context.
Baseline/Endline. If multiyear programme consider
also a mid-term evaluation.
Measurement Guidance:
Data collection should show the stability/increase of
household incomes over the defined period.
Measurement period and frequency depend on the
income generation activity.

Livelihoods Key Program Indicators List
20
Secondary data. Reliable/relevant sources from
other actors, clusters or government (e.g.
assessment information, reference to a normal
situation).
Unit of Measurement: Population, but can also be
households or productive organizations, or MSME. If
percentage:
Numerator: Number of targeted population that
have improved/stabilized their net income.
Denominator: Total number of targeted population
Data Collection methods:
Secondary data analysis;
Income records (MSME, productive organization);
Household survey;
Focus groups, Key Informant Interviews.
Depending on the source of incomes, consider to
collect monthly records.
Increase of income (or stabilized income) must be
relevant. It should be fixed and (if possible) reference
to context wage/salary/etc.
[primary production] Consider seasonal calendar to
determine when to measure the indicator.
Consider market price and labour wages according to
season variations throughout the year.
Need to measure gross income + productive expenses
both in baseline and in endline or scheduled
monitoring.
Net income is more accurate than gross income,
because reflects also livelihoods expenses that could
influence in production increase and in
revenues/benefits (e.g. use of improved productive
assets -more expensive-, or access to productive
services -veterinary-)
Take into consideration that measurement difficulty
depends on the income generation activity.
Example:
Number of targeted population in Conakry urban area (from those Y% are under 26 years old) that improve their
net income to the interprofessional minimum wage during at least six months.
INDICATOR. 11 KRI-4-2 Number/percentage of targeted population <households, productive organizations, MSME> diversify (quantify
if necessary) their incomes generation activities (specify source/s if necessary) [increasing their net income by
(specify the improvement)].
Description
Change in targeted population incomes generation activities sources through participation in the program
Significant change in income sources suggests reduced vulnerability and increased food/incomes access and
resilience.
Income sources breakdown most commonly used: sale of own production (crops, livestock, etc.), sale of wild
gathered items, casual labour, skilled labour, salary, petty trade and commerce/business, value addition or
transformation, loans, remittances, gifts and assistance.
Includes any type of agro based, non-agro based, or service based income generating activity, can include
market chain support, value addition or transformation etc.
Includes agriculture and livestock diversification.
Includes the diversification of production within the same livelihoods activity (e.g. crop diversification)
Includes access to employment.

Livelihoods Key Program Indicators List
21
Income sources diversification can (or cannot) be accompanied with an increase of incomes, in this sense the last
part of the indicator “increasing their net income by specify the improvement]” is optional, depending on the
program/project objectives.
Definitions:
MSME: micro, small and medium enterprises (formal or informal)
Detail / Disaggregate by:
Geography/Livelihoods zone;
Gender, age, disabilities, chronic diseases (if individuals, associations members, etc.);
Head of household gender, age, disabilities, chronic diseases, dependency ratio (if
households), and any other relevant criteria, such as urban/rural, religious, ethnic or
political identities;
Wealth groups; Livelihoods group (e.g. pastoralist, farmers, traders)
Period to achieve the objective;
Trend / Change:
Increase
Data source:
Both secondary and primary data collection can be
used according to context.
Baseline/Endline. If multiyear programme consider
also a mid-term evaluation.
Secondary data. Reliable/relevant sources from
other actors, clusters or government (e.g.
assessment information, reference to a normal
situation).
Unit of Measurement: Population, but can also be
households or productive organizations, or MSME. If
percentage:
Numerator: Number of targeted population that
have diversified their sources of income.
Denominator: Total number of targeted population
Data Collection methods:
Secondary data analysis;
Income records (MSME, productive organization);
Household surveys and focus groups;
Key Informant Interviews.
Measurement Guidance:
Commonly measuring changes in type and diversity of
income sources, and proportion towards the overall
income of the household.
Data collection should show the increase of household
incomes due to the diversification of the income
generation sources.
[primary production] Consider seasonal calendar to
determine when to measure the indicator (e.g. main
harvest, pests and diseases prevalence depending on
the period.)
Consider market price and labour wages according to
season variations throughout the year.
Link the increase of incomes (if so) with the new
sources of incomes.
Take into consideration that measurement difficulty
depends on the income generation activity.
Example:
- with income increase:
X% of targeted small-scale livestock holders from Dawa region (from those Y% are women headed) diversify their
incomes generation activities at the end of the project, increasing their net income by Z%.
-without income increase:

Livelihoods Key Program Indicators List
22
X% of targeted small-scale livestock holders from Dawa region (from those Y% are women headed) diversify at
least the Z% of their incomes generation activities at the end of the project
INDICATOR. 12 KRI-4-3 Number/percentage of targeted population employed or self-employed in sustainable livelihoods activities
(specify if necessary) for a defined period.
Description
Change in the number of people employed or self-employed in sustainable livelihoods activities for a defined
period.
To show sustainability, employment or self-employment should last a defined period of time (6-12 months), and
show quality aspects (work conditions).
Includes the increase of people employed or self-employed
Includes the increase of job created
Consider formal and informal employment
Highlight the equally of opportunities for men/women; youth; other remarkable group (e.g. ethic, religious)
Equal opportunities for women/youth/other groups applies depending on the program, normally when the
employment/self-employment intervention is not addressed to a specific group.
It doesn't includes cash for work interventions (temporary employment)
Detail / Disaggregate by:
Geography/Livelihoods zone;
Gender, age, disabilities, chronic diseases (if individuals, associations members, etc.);
Head of household gender, age, disabilities, chronic diseases, dependency ratio (if
households), and any other relevant criteria, such as urban/rural, religious, ethnic or
political identities;
Wealth groups; Livelihoods group (e.g. pastoralist, farmers, traders)
Period to achieve the objective;
Trend / Change:
Increase
Data source:
Both secondary and primary data collection can be
used according to context.
Baseline/Endline. If multiyear programme consider
also a mid-term evaluation.
Secondary data. Reliable/relevant sources from
other actors, clusters or government (e.g.
assessment information, reference to a normal
situation).
Unit of Measurement: Population, but can also be
households or productive organizations, or MSME. If
percentage:
Numerator: Number of targeted population
employed or self-employed.
Denominator: Total number of targeted population
Measurement Guidance:
Employment/self-employment sustainability should be
defined (e.g. type of contract; duration of the
employment/self-employment since it started -six
months / one year-, number of client contracts -for self-
employments/IGA-, etc.).
Consider not just the access to employment (self-
employment) in a quantitative way, but also in quality:
job quality (work conditions) and/or beneficiaries’ self-
confidence (qualitative change).
Job creation might be difficult to measure unless: the
intervention is long term, or it is measured against
small business or IGA which create employment for
others.

Livelihoods Key Program Indicators List
23
Data Collection methods:
Secondary data analysis;
Household survey and focus groups;
Key Informant Interviews;
Salary records;
MSME/productive organization survey and records.
Example:
X of affected vulnerable workers in Conakry urban area (from those Y are women) are employed in livelihoods
activities (micro-business, small and medium enterprises) for six or more months through the intermediation
program.
INDICATOR. 13 KRI-4-4 Number of sustainable micro, small and medium enterprises (MSME) initiatives (specify if necessary) <created,
strengthened> due to the intervention.
Description
Change in the number of employment / self-employment initiatives or their capacity due to the intervention.
To show sustainability initiatives should last a defined period of time (6 months, 12 months).
Includes micro, small and medium enterprises (MSME) initiatives of all kind of sectors (agro-business -primary
production transformation-; transport; new technologies related business -internet, mobile phone-;
retailers/dealers; carpenters; tailors; hostelry, etc.)
Includes group and individual income generating activities for contribution to household economy.
Highlight the equally of opportunities for men/women; youth; other remarkable group (e.g. ethic, religious)
Equal opportunities for women/youth/other groups applies depending on the program, normally when the
employment/self-employment intervention is not addressed to a specific group.
The focus of this indicator is in the creation or strengthening of employment initiatives, not in the number of new
people employed, even if both indicators can be used in the same kind of projects/programs.
Definitions:
MSME: micro, small and medium enterprises (formal or informal)
Detail / Disaggregate by:
Geography/Livelihoods zone;
Gender, age, disabilities, chronic diseases (if individuals, associations members, etc.);
Head of household gender, age, disabilities, chronic diseases, dependency ratio (if
households), and any other relevant criteria, such as urban/rural, religious, ethnic or
political identities;
Wealth groups; Livelihoods group (e.g. pastoralist, farmers, traders)
Period to achieve the objective;
Trend / Change:
Increase
Data source: Measurement Guidance:

Livelihoods Key Program Indicators List
24
Both secondary and primary data collection can be
used according to context.
Baseline/Endline. If multiyear programme consider
also a mid-term evaluation.
Secondary data. Reliable/relevant sources from
other actors, clusters or government (e.g.
assessment information, reference to a normal
situation).
Unit of Measurement: MSME
Data Collection methods:
Secondary data analysis;
MSME records;
Focus groups, Key Informant Interviews.
To measure the creation of new MSME initiatives we
can use all formal documentation and records
generated to achieve it.
To measure the strengthening of existent MSME we
could use the production/sales/clients/stocks records
as a base to compare between baseline and endline.
Sustainability criteria should be defined and measure
(e.g. progression of the number of employees over a
period of time, number of client contracts, buys and
sales records, infrastructures and productive assets
owned, etc.).
Example:
X sustainable micro and small businesses created in Port au Prince urban area (from those Y are managed by under
26 years old) that have achieved business objectives at the end of the program due to the intervention

Livelihoods Key Program Indicators List
25
2.5. OBJECTIVE 5. Gain and Application of Livelihoods Activities Knowledge
“Improvement of livelihoods activities knowledge and application of these livelihoods new practices/
knowledge/techniques; it includes both aspects GAIN OF KNOWLEDGE and APPLICATION of this new
knowledge for all kind of livelihoods activities (primary production, transformation, etc.)”
INDICATOR. 14 KRI-5-1 Number/percentage of targeted population provided with new <skills, knowledge> to <strengthen, diversify,
protect> their livelihoods [specify if necessary: primary production, MSME, compete in the job market, etc.]
Description
Change in number of people equipped with new skills/knowledge strengthen, protect or diversify their
livelihoods thanks to the program/project
Increase of skills/knowledge to improve/strength/launch household livelihoods activities.
Includes all kind of education training and capacity building activities developed by extensionist workers,
organization’s trainers, etc.
Includes skills to grow/launch a business, get a paid job, compete in job market
Includes skills / knowledge to improve primary production: staple crop, vegetable and agroforestry
production, livestock, pisciculture, aquaculture, apiculture, cuniculture production, etc.
Includes skills/knowledge to strength targeted population’s micro-small or medium enterprises.
Definitions:
MSME: micro, small and medium enterprises (formal or informal)
Detail / Disaggregate by:
Geography/Livelihoods zone;
Gender, age, disabilities, chronic diseases, and any other relevant criteria, such as
urban/rural, religious, ethnic or political identities;
Wealth groups; Livelihoods group (e.g. pastoralist, farmers, traders)
Period to achieve the objective;
Consider disaggregation of information by trained and non-trained households.
Trend / Change:
Increase
Data source:
Both secondary and primary data collection can be
used according to context.
Baseline/Endline. If multiyear programme consider
also a mid-term evaluation.
Secondary data. Reliable/relevant sources from
other actors, clusters or government (e.g.
assessment information).
Unit of Measurement: Population (trained people). If
percentage:
Numerator: Number of targeted population that
Measurement Guidance:
Measure of the gained knowledge.
Compare them with the needed skills to develop a
specific livelihoods activity (educational plan,
standardized extension trainings, etc.).
This should be done by training or session test and not
linked only to participation in training or sessions.

Livelihoods Key Program Indicators List
26
has gained new knowledge / skills.
Denominator: Total number of trained people
Data Collection methods:
Secondary data analysis;
Focus groups, Key Informant Interviews.
Knowledge or KAP Survey;
Pre & post training evaluation;
6-12 months after training survey;
Examples:
At the end of the project X% of targeted population in Gambella (from those Y% are refugees) equipped (or
provided) with new skills to launch a new business.
At the end of the project X% of targeted population in the urban area of Sidon district (from those Y% are women)
provided with new skills to compete in the job market.
INDICATOR. 15 KRI-5-2 Number/percentage of targeted population <households, productive organizations, MSME> apply new
acquired <knowledge, skills> promoted by the project to <strength, diversify, protect> their livelihoods [specify
if necessary: improve the primary production or MSME, acquire a paid job, etc.]
Description
Change in number of people applying newly acquired skills, knowledge promoted by the project to improve
(strength, diversify, protect) their livelihoods activities
Increased application of knowledge and practices gained in all kind of livelihoods activities:
primary production: application of best practices in agriculture; livestock; forestry; fishing
transformation and production processing
income generation activities and employment: improve or launch a business, get a paid job
Definitions:
MSME: micro, small and medium enterprises (formal or informal)
Detail / Disaggregate by:
Geography/Livelihoods zone;
Gender, age, disabilities, chronic diseases (if individuals, associations members, etc.);
Head of household gender, age, disabilities, chronic diseases, dependency ratio (if
households), and any other relevant criteria, such as urban/rural, religious, ethnic or
political identities;
Wealth groups; Livelihoods group (e.g. pastoralist, farmers, traders)
Period to achieve the objective;
Consider disaggregation of information by trained and non-trained households.
Trend / Change:
Increase

Livelihoods Key Program Indicators List
27
Data source:
Both secondary and primary data collection can be
used according to context.
Baseline/Endline. If multiyear programme consider
also a mid-term evaluation.
Secondary data. Reliable/relevant sources from
other actors, clusters or government (e.g.
assessment information).
Unit of Measurement: Population (trained people) but
can also be households, productive organizations, or
MSME. If percentage:
Numerator: Number of trained people that is
applying new knowledge / skills.
Denominator: Total number of trained people
Data Collection methods:
Secondary data analysis;
Household surveys and focus groups;
Key Informant Interviews;
Productive organization, MSMEs survey, focus groups
and records;
Observation (crops, herds management, etc.)
Measurement Guidance:
Measure the use of the gained knowledge (all of them
or one part). Typical approaches look at "X out of Y key
practices" that drive productivity or quality.
Measure application of good production practices and
their effects such as: change of household incomes;
change of market links, etc. (depending on the acquired
knowledge).
[primary production] Consider seasonal calendar to
determine when to measure the indicator (e.g. main
harvest, pests and diseases prevalence depending on
the period).
[employment] Consider measuring not just
quantitative aspects (get a new paid job) but also
qualitative aspects (such as: prepare a CV, self-
confidence, know worker’s rights and duties, etc.).
Examples:
At the end of the project X% of targeted farmers from Somaliland and Puntland (from those Y% are women) apply
new livestock rearing and management techniques promoted by the project and the extension system to
strengthen their livestock production.
At the end of the project X% of targeted traders and small-medium businesses from Somaliland and Puntland
(from those Y% are headed by women) apply new market techniques promoted by the project to strengthen their
business.
At the end of the vocational training program X% of trained people (from those Y% are women) apply new
knowledge to acquire a paid job.

Livelihoods Key Program Indicators List
28
2.6. OBJECTIVE 6. Access to Livelihoods Support Services and Markets
“Increase the households/communities/productive associations’ capacity to access to markets and/or
other livelihoods support services (formal or informal).
Includes access to markets, extension workers trainings and services, veterinary services, legal advisor
services or all kind of formal/informal financial services (e.g. credit, insurances).”
INDICATOR. 16 KRI-6-1 Number/percentage of targeted population <households, productive organizations, MSME> gain improved
access to <livelihoods support services, markets> (specify if necessary) due to program intervention.
Description
Change in number of population (households, productive organizations, MSME) with improved access to
livelihoods support services (veterinary services, financial services, trainings, etc.) and/or markets.
Livelihoods support services are all kind of services that allow improve or strength livelihoods activities and their
productivity. This indicator measures the access to these services:
Includes improvement of linkages between markets and small holders producers (to allow them to improve
or to obtain incomes from the own production)
Includes access to credit and other financial services (insurances, microcredits).
Includes access to technical services such as trainings (public extensionist/extension workers), other
productive services (e.g. veterinary services, business support services, etc.), or legal, financial, and
networking advice.
Includes access to legal services relating to employment, work permits or business registration permits
Includes all formal and informal services
Definitions:
MSME: micro, small and medium enterprises (formal or informal)
Detail / Disaggregate by:
Geography/Livelihoods zone;
Gender, age, disabilities, chronic diseases (if individuals, associations members, etc.);
Head of household gender, age, disabilities, chronic diseases, dependency ratio (if
households), and any other relevant criteria, such as urban/rural, religious, ethnic or
political identities;
Wealth groups; Livelihoods group (e.g. pastoralist, farmers, traders)
Period to achieve the objective;
Trend / Change:
Increase
Data source:
Both secondary and primary data collection can be
used according to context.
Baseline/Endline. If multiyear programme consider
also a mid-term evaluation.
Secondary data. Reliable/relevant sources from
other actors, clusters or government (e.g.
Measurement Guidance:
Measure the increase in number, frequency, amount (if
financial service) of the support service accessed in
comparison with the baseline (or other base
information).
Consider (depending on the service, e.g. veterinary
service, market access, etc.) to measure the

Livelihoods Key Program Indicators List
29
assessment information, reference to a normal
situation).
Unit of Measurement: Population, but can also be
households, productive organizations, or MSME. If
percentage:
Numerator: Number population accessing to
livelihoods support services.
Denominator: Total number of targeted population
Data Collection methods:
Secondary data analysis;
Household surveys and focus groups;
Key Informant Interviews;
Productive organizations, MSMEs’ survey and records;
Livelihoods support services’ records (Financial
institutions records, etc.)
improvement in the production/productivity due to the
livelihoods support service access.
Example:
X of targeted farmer organizations (from those Y are women organization) gain improved access to animal health
services as a result of the project.
All targeted populations from Cayes Jacmel district have safe and full access to market goods, services and systems
throughout the duration of the programme.
At the end of the program, X% of targeted small and medium businesses from Cayes Jacmel district are able to
access credit/loans as a result of the project.
INDICATOR. 17 KRI-6-2 Number of targeted <livelihoods support service initiatives (specify), markets> provided or strengthened
(specify if necessary) through program intervention.
Description
Change in number of livelihoods support service initiatives and/or markets available and/or strengthened
Livelihoods support services are all kind of services that allow improve livelihoods activities and their productivity.
This indicator measures the availability or strengthening of these services :
Includes the support to markets/traders (formal or informal)
Includes the support to credit and other financial services initiatives (insurances, microcredits)
Includes the support to technical services such as trainings (public extensionist /extension workers), or other
productive services (e.g. veterinary services, etc.)
Includes the support to all kind of formal and informal livelihoods support services
Detail / Disaggregate by: Trend / Change:

Livelihoods Key Program Indicators List
30
Geography/Livelihoods zone;
Gender, age, disabilities, chronic diseases (of the support service holder) and any other
relevant criteria, such as urban/rural, religious, ethnic or political identities;
Period to achieve the objective;
Increase
Data source:
Both secondary and primary data collection can be
used according to context.
Baseline/Endline. If multiyear programme consider
also a mid-term evaluation.
Secondary data. Reliable/relevant sources from
other actors, clusters or government (e.g.
assessment information, reference to a normal
situation).
Unit of Measurement: livelihoods support service,
market
Data Collection methods:
Secondary data analysis;
Service availability / coverage assessment in a
geographical area.
Focus groups, Key Informant Interviews;
Livelihoods support services’ records (Financial
institutions records, etc.).
Observation
Measurement Guidance:
Depending on the type of service, the indicator
measure:
- the number of services available;
- the change in service coverage (rate de
services par targeted population);
- the improvement of the service (e.g.
formalized, increase in the number of
credits/amount of credits).
Example:
At the end of the project X% of targeted extension workers from Dawa region are available to work with
communities through program intervention.
X% of supported microfinance institutions (MFI) in Cayes Jacmel district strengthened and showing a positive
return on average through program intervention

Livelihoods Key Program Indicators List
31
2.7. OBJECTIVE 7. Disaster Risk Reduction and Natural Resources Management
“Protection and Strengthening of household/community livelihoods through Disaster Risk Reduction,
Climate Change Adaptation and Natural Resources Management practices.
Includes all kind of activities aimed to strengthen, adapt and protect households/community
livelihoods and/or their productive assets/capitals (such as natural or physical capital) against natural
hazards and damaging production practices.”
INDICATOR. 18 KRI-7-1 Number/percentage of targeted population <households, communities, productive organizations, MSME>
applying key <disaster risk reduction, natural resource management, climate change adaptation> practices
(specify if necessary) to <strengthen, protect> their livelihoods
Description
Change in number of population (households, communities, productive organizations, MSME) applying key
practices in DRR, NRM or CCA to strengthen and/or protect their livelihoods activities
Livelihoods strengthening and protection through DRR and NRM includes:
The application of good productive practices to protect natural productive resources (land conservation,
improvement of green cover, water collection and water use improvement, embankments)
The creation of household or community infrastructures to protect livelihoods assets against natural or
human hazards (e.g. livestock shelters, seeds banks)
The use or adaptation of agriculture production and livestock to climate/weather conditions (drought
adapted seeds, etc.)
Initiatives or projects that reduce or eliminate livelihoods damaging production practices (climate change
mitigation, natural resources over exploitation, etc.)
The use of insurances to cope with primary production/productive assets losses (e.g. drought prone areas)
The use of destocking techniques
Other community/group initiatives to protect their livelihoods assets and production (e.g. distaste risk
reduction actions, surveillance mechanisms)
Definitions:
MSME: micro, small and medium enterprises (formal or informal)
DRR: disaster risk reduction
NRM: Natural Resources Management8 refers to the sustainable utilization of major natural resources, such
as land, water, air, minerals, forests, fisheries, and wild flora and fauna. Together, these resources provide
the ecosystem services that underpin human life.
CCA: Climate Change Adaptation9 refers to the adjustment in natural or human systems in response to actual
or expected climatic stimuli or their effects, which moderates harm or exploits beneficial opportunities.
Detail / Disaggregate by:
Geography/Livelihoods zone;
Gender, age, disabilities, chronic diseases (if individuals, associations members, etc.);
Trend / Change:
Increase
8 Source: “Natural Resources Management”, World Bank 9 Source: Intergovernmental Panel on Climate Change (IPCC)

Livelihoods Key Program Indicators List
32
Head of household gender, age, disabilities, chronic diseases, dependency ratio (if
households), and any other relevant criteria, such as urban/rural, religious, ethnic or
political identities;
Wealth groups; Livelihoods group (e.g. pastoralist, farmers, traders)
Period to achieve the objective;
Data source:
Both secondary and primary data collection can be
used according to context.
Baseline/Endline. If multiyear programme consider
also a mid-term evaluation.
Secondary data. Reliable/relevant sources from
other actors, clusters or government (e.g.
assessment information, reference to a normal
situation).
Unit of Measurement: Population, but can also be
households, communities, productive organizations, or
MSME. If percentage:
Numerator: Number population applying key
DRR/NRM practices.
Denominator: Total number of targeted population
Data Collection methods:
Secondary data analysis;
Household surveys and focus groups;
Key Informant Interviews;
Productive organizations, MSMEs’ survey and records;
Observation.
Measurement Guidance:
Measurement of application of DRR and/or NRM good
practices must be linked with project/program
definition, listing what good practices are being
promoted. Typical approaches look at "X out of Y key
practices" that drive community/household livelihoods
activities protection (or strengthen).
Consider referring to potential DRR/NRM practices or
projects that are setting up by the Government or other
organizations in the area, as a mean to harmonize
ongoing approaches in the same geographical area.
To facilitate the measure process: list the good
practices that are going to be promoted through the
project/program and the expected impact in
livelihoods protection and strengthening, to include
both in the baseline.
Example:
At the end of the project X% of targeted households in the pastoralist area of Finshawa (applying key disaster risk
reduction practices) are able to prevent depletion (protect) of their productive assets
X targeted gardening women associations from Mafateng district applying at least 2 key practices key to
strengthen and protect their livelihoods and natural resources
At the end of the project the 100% of targeted gardening women associations from Mafateng district have their
basins/water tanks built or rehabilitated and with an internal maintenance system
X targeted communities from Mafateng district (applying disaster risk reduction practices) adopting structural
measures (e.g. embankments, flood diversion channels, water-harvesting tanks) in place to protect against major
hazard threats.
Livelihoods Key Program Indicators List
33
INDICATOR. 19 KRI-7-2 Number of targeted natural resources (specify) under improved natural resource management
Description
Change in number of natural resources under improved management
Natural resources management is a basic action to protect and strengthen productive natural resources (natural
capital).
The improvement of natural resources management aims to reduce the impact on the targeted population'
livelihoods of the current and future emergencies (floods, droughts, landslides) as well as to improve primary
production productivity.
Includes land use and land conservation techniques
Includes improvement of green cover (including forest, farm and pasture land)
Includes water collection and use improvement
Includes natural resources protection infrastructures (e.g. embankments, flood diversion channels)
Reduction of natural resources degradation (e.g. wood for charcoal)
Disaster risk reduction activities focused on natural resources protection
Detail / Disaggregate by:
Geography/Livelihoods zone;
Period to achieve the objective;
Trend / Change:
Increase
Data source:
Both secondary and primary data collection can be
used according to context.
Baseline/Endline (related to the specific natural
resource targeted). If multiyear programme
consider also a mid-term evaluation.
Secondary data. Reliable/relevant sources from
other actors, clusters or government (e.g.
assessment information, reference to a normal
situation).
Unit of Measurement: Depending on the Natural
Resource (e.g. forest Ha, coastline meter-kilometer,
number of water sources, etc.)
Data Collection methods:
Secondary data analysis;
Natural resource measure;
Household surveys and focus groups;
Key Informant Interviews.
Measurement Guidance:
Measure of land/forestry hectares, coastline
kilometers, soil conservation infrastructures
units/kilometers, etc.
Depending on the type of intervention, the change
should be measured using technical methods (e.g.,
natural resources showing improved biophysical
conditions).
Consider referring to potential DRR/NRM practices or
projects that are setting up by the Government or other
organizations in the area, as a mean to harmonize
ongoing approaches in the same geographical area.
It is important to define how to measure the
change/improvement before using the indicator. If for
example we want to measure the number of hectares
under soil conservation techniques, it's necessary to
define them before or define how many among all the
possible techniques (e.g. tree reforestation, use of
organic fertilizers, construction of terraces and
embankments)
Livelihoods Key Program Indicators List
34
Example:
X Ha of agricultural land (fields, rangeland, agro-forests) in Simanjiro region under improved biophysical
conditions
X Ha of targeted communities from Simanjiro region with sustainable irrigation and drainage services
INDICATOR. 20 KRI-7-3 Number of targeted <community, household, productive organizations, MSME> livelihoods productive assets
(specify) protected (specify how, if necessary) to future hazards (specify if necessary)
Description
Change in number of productive assets (e.g. lands, livestock, infrastructures, etc.) protected and strengthened
against natural or human threats.
The indicator keeps the attention to protect and strengthen livelihoods assets to improve
communities/households/productive organizations resilience.
Livelihoods strengthening and protection through DRR practices:
The creation of household or community infrastructures to protect livelihoods assets against natural or
human hazards (e.g. livestock shelters, seeds banks)
The use or adaptation of agriculture production and livestock to climate/weather conditions (drought
adapted seeds, etc.)
Initiatives or projects that reduce or eliminate livelihoods damaging production practices (climate change
mitigation, natural resources over exploitation, etc.)
The use of insurances to cope with primary production/productive assets losses (e.g. drought prone areas)
The use of destocking techniques
Other infrastructures (and livelihoods assets) protection and strengthening initiatives (e.g. distaste risk
reduction actions, surveillance mechanisms)
Definitions:
MSME: micro, small and medium enterprises (formal or informal)
DRR: disaster risk reduction
Detail / Disaggregate by:
Geography/Livelihoods zone;
Wealth groups; Livelihoods group (e.g. pastoralist, farmers, traders)
Period to achieve the objective;
Trend / Change:
Increase
Data source:
Both secondary and primary data collection can be
used according to context.
Baseline/Endline (related to the specific natural
resource targeted). If multiyear programme
consider also a mid-term evaluation.
Measurement Guidance:
Depending on the type of productive
infrastructure/asset service, the indicator measure:
the number of infrastructures available;
the change in their coverage (rate de services par
population);

Livelihoods Key Program Indicators List
35
Secondary data. Reliable/relevant sources from
other actors, clusters or government (e.g.
assessment information, reference to a normal
situation).
Unit of Measurement: Depending on the livelihood
infrastructure/asset (e.g. forest Ha, coastline meter-
kilometer, number of water sources/water collectors,
etc.)
Data Collection methods:
Secondary data analysis;
Livelihoods infrastructure recovery measure;
Household surveys and focus groups;
Key Informant Interviews.
Unit of Measurement: Depending on the Natural
Resource (e.g. forest Ha, coastline meter-kilometer,
number of water sources, etc.)
Data Collection methods:
Secondary data analysis;
Natural resource measure;
Household surveys and focus groups;
Key Informant Interviews.
the improvement of the infrastructures (e.g.
formalized, managed/management committee) and
the preparation of protection measures to promote
services' resilience.
Note that this indicator should be measured before
expected hazards happens. In this regards It is
important to define how the action implemented in the
program is going to protect community/ households
livelihoods and their livelihoods assets.
Example:
X community water collectors for livestock in pastoralist area of Mahama protected to future hazards
At the end of the project X Ha of crop land in rural area of Kirehe district protected against floods through the use
of embankments

Livelihoods Key Program Indicators List
36
2.8. OBJECTIVE 8. Livelihoods Rights, Policies and Regulations Improvement
“Strengthen enabling environment for improving livelihoods development. Includes all levels of
advocacy interventions (community, local and national level) to allow equal rights, access and
opportunities in livelihoods; as well as interventions aimed to reinforce local and national structures
and processes to allow the improvement of livelihoods development and protection.”
INDICATOR. 21 KRI-8-1 Number/percentage of targeted population (specify group) with <access to, equal opportunities in> developing
their livelihoods activity (specify if necessary) through program intervention
Description
Change in number of population getting access and equal opportunities in developing their livelihoods activity.
Interventions aimed to change (improve) population access, equal opportunities and rights to develop their
livelihoods activities.
Includes all empowerment initiatives to access equal livelihood opportunities (access to vocational trainings,
access to markets/financial systems, access and land tenancy) and rights (equal wages, decision-making
changes)
Includes formalized access to basic livelihoods assets such as land, electricity, water.
Includes actions to formalize the work permit situation of refugees (or other groups).
It's important to specify the group who it is addressed to (e.g. women, ethnic minorities)
Detail / Disaggregate by:
Geography/Livelihoods zone;
Target group: Gender, age, disabilities, chronic diseases, and any other relevant criteria,
such as urban/rural, wealth group, livelihoods group (pastoralist, farmers, traders),
religious, ethnic or political identities;
Period to achieve the objective;
Trend / Change:
Increase
Data source:
Both secondary and primary data collection can be
used according to context.
Baseline/Endline. If multiyear programme consider
also a mid-term evaluation.
Secondary data. Reliable/relevant sources from
other actors, clusters or government (e.g.
assessment information, reference to a normal
situation).
Unit of Measurement: Population. If percentage:
Numerator: Number population getting access and
equal opportunities to develop their livelihood
activity.
Denominator: Total number of targeted population
Measurement Guidance:
Improvement of access and equal opportunities to
develop livelihoods activities, can be measured
(depending on the program and objectives) through:
- Formal ownership and access records (land tenure,
MSME ownership, credit access, etc.)
- Household surveys with intra-household (checking
who in the household has (a) access to/ use of, (b)
control of, each asset)
- Local/regional employment records
- Training records
- Legislation, policies, strategies changes that
benefit an overall group (e.g. displaced population,
minority, etc.)

Livelihoods Key Program Indicators List
37
Data Collection methods:
Secondary data analysis;
Household surveys and focus groups;
Key Informant Interviews;
Formal ownership records;
Productive organizations, MSMEs’ survey and records;
Trainings records/reports
Employment records.
Examples:
X% of targeted women in rural area of Kayenzi with secure land ownership/tenancy through program intervention.
At the end of the program X% of targeted land users in rural area of Kayenzi (from those Y% are women) with
legally and formally secured use and disposal rights
X% of targeted women refugees in Gambella district with income equal or higher than national standard minimum
wage.
X% of targeted refugees (from those Y% are women) with formalized work permit through program intervention
INDICATOR. 22 KRI-8-2 Number of <policies, laws, contingency plans, strategies, structures> adopted or created to improve the
livelihoods development and protection environment (specify if necessary) for (specify target group)
Description
Change in number of policies, laws, contingency plans, strategies, structures adopted or created to improve the
livelihoods development and protection environment
All advocacy and strengthening interventions to enable an enhanced environment to develop vulnerable
people/groups' livelihoods
Includes the adoption of laws/policies/regulations to allow the access to basic livelihoods assets
Includes the adoption of laws/policies/regulations to allow equal livelihoods opportunities and rights
Includes national or local regulations/strategies or structures to improve market development, access to
credit/financial systems
Includes national or local regulations/strategies or structures to protect natural resources and livelihoods
(e.g. early warning systems, natural resources regulations)
It's important to specify the group who it is addressed to if necessary (e.g. women, ethnic minorities, traders)
Detail / Disaggregate by:
Geography/Livelihoods zone;
Target group: Gender, age, disabilities, chronic diseases, and any other relevant criteria,
such as urban/rural, wealth group, livelihoods group (pastoralist, farmers, traders),
religious, ethnic or political identities;
Period to achieve the objective;
Trend / Change:
Increase

Livelihoods Key Program Indicators List
38
Data source:
Both secondary and primary data collection can be
used according to context.
Baseline/Endline. If multiyear programme consider
also a mid-term evaluation.
Secondary data. Reliable/relevant sources from
other actors, clusters or government (e.g.
assessment information, reference to a normal
situation).
Unit of Measurement: Policies, laws, contingency
plans, strategies, structures, etc.
Data Collection methods:
Secondary data analysis;
Government reports/records/plans of action (regional,
local);
Formal ownership records;
Target group surveys / focus groups;
Key Informant Interviews.
Measurement Guidance:
Measure the number of policies/strategies, etc.,
adopted or created and their application.
Depending on the type of policy/regulation it would be
necessary to link it with the development or
improvement of livelihoods.
Measure advocacy activities: number of events,
documents published and signatories as often this can
be done as a lobby to generate a change in policy, law
regulations (which sometimes might take a long time).
Examples:
X national employment strategies accepted and validated by government to improve the livelihoods development
of minorities groups
X commerce laws and regulations simplified and implemented to improve and develop small-traders activity
X improvements in laws and regulations to improve the registration and operation of micro or small enterprises
X Surveillance, Early Warning Systems methodologies accepted and validated by government and external
stakeholders to protect lives and livelihoods

Livelihoods Key Program Indicators List
39
3. DEFINITIONS AND ACRONYMS
Concept Definition
Survival Threshold The Survival Threshold represents the total income required to cover:
a. 100% of minimum food energy needs (2100 kcals per person), plus
b. The costs associated with food preparation and consumption (i.e. salt, soap,
kerosene and/or firewood for cooking and basic lighting), plus
c. Any expenditure on water for human consumption.
Livelihoods
Protection
Threshold
The Livelihoods Protection Threshold represents the total income required to sustain
local livelihoods.
This means total expenditure to:
a. Ensure basic survival (see column to left), plus
b. Maintain access to basic services (e.g. routine medical and schooling
expenses), plus
c. Sustain livelihoods in the medium to longer term (e.g. regular purchases of
seeds, fertilizer, veterinary drugs, etc.), plus
d. Achieve a minimum locally acceptable standard of living (e.g. purchase of
basic clothing, coffee/tea, etc.)
MSME Micro, small and medium enterprises
IGA Income Generation Activity
DRR Disaster Risk Reduction
NRM Natural Resources Management.
NRM refers to the sustainable utilization of major natural resources, such as land,
water, air, minerals, forests, fisheries, and wild flora and fauna. Together, these
resources provide the ecosystem services that underpin human life.
CCA Climate Change Adaptation.
Climate Change Adaptation refers to the adjustment in natural or human systems in
response to actual or expected climatic stimuli or their effects, which moderates
harm or exploits beneficial opportunities.
HEA Household Economy Approach
HES Household Economic Security
IHEA IHEA (Individual Household Economy Approach

Livelihoods Key Program Indicators List
40
4. ACKNOWLEDGES
The development of the Livelihoods Program Indicators list (presented in this document) has counted
with the invaluable support and contribution of a heterogeneous group of specialized practitioners in
Livelihoods or Monitoring & Evaluation, coming from different Implementing NGOs, UN Agencies or
independent consultants.
List of people/organizations