Embed Size (px)
Citation preview

7/28/2019 LiuZ13_Characterization of Oligopeptide Transporter
http://slidepdf.com/reader/full/liuz13characterization-of-oligopeptide-transporter 1/7
Characterization of oligopeptide transporter (PepT1) in grass carp(Ctenopharyngodon idella)
Zhen Liu, Yi Zhou, Junchang Feng, Shuangqing Lu, Qiong Zhao, Jianshe Zhang ⁎
Department of Biotechnology and Environmental Science, Changsha University, Changsha 410003, China
a b s t r a c ta r t i c l e i n f o
Article history:
Received 7 September 2012
Received in revised form 19 November 2012Accepted 26 November 2012Available online 4 December 2012
Keywords:
Oligopeptide transporterGrass carpDietary proteinSodium butyrateSLC15A1
The oligopeptide transporter (PepT1) is located on the brush-border membrane of the intestinal epithelium,and plays an important role in dipeptide and tripeptide absorptions from protein digestion. In this study, wecloned the PepT1 cDNA from grass carp and characterized its expression profile in response to dietary proteinand feed additives (sodium butyrate) treatments. The PepT1 gene encodes a protein of 714 amino acids withhigh sequence similarity with other vertebrate homologues. Expression analysis revealed highest levels of PepT1 mRNA expression in the foregut of grass carp. In addition, PepT1 mRNA expression exhibited diurnalvariation in all three bowel segments of intestine with lower levels of expression in daytime than nighttime.During embryonic development, PepT1 showed a dynamic pattern of expression reaching maximal levels of expression in the gastrula stage and minimal levels in the organ stage. The PepT1 expression showed con-stant levels from 14 to 34 day post-hatch. To determine whether fish diet of different protein contentsmay have any effect on PepT1 expression, we extended our research to dietary regulation of PepT1 expres-sion. We found that dietary protein levels had a significant effect on PepT1 gene expression. In addition,PepT1 mRNA levels were higher after feeding with fish meal than with soybean meal. Moreover, in vitro
and in vivo sodium butyrate treatments increased PepT1 expression in the intestine of grass carp. The resultsdemonstrate for the first time that PepT1 mRNA expression is regulated in a temporal and spatial patternduring development, and dietary protein and feed additives had a significant effects on PepT1 gene expres-sion in grass carp.
© 2013 Elsevier Inc. All rights reserved.
1. Introduction
Teleosts, unlike other vertebrates, require high protein diets toobtain amino acids for protein synthesis and energy metabolism. Inteleosts, dietary proteins are eventually degraded into a mixture of free amino acids and small peptides in the intestine. A large numberof studies have shown that protein digestion products are mainlypresent in the form of small peptides such as di- and tri-peptidesthat are absorbed by the di- and tri-peptides transporters in intestine(Gatlin et al., 2007). Thus, a better understanding of the regulation of protein absorption by the intestinal transporter is important for im-proving dietary nutrition, and has a potential application in aquacul-ture and fish breeding.
The cell absorption of di- and tri-peptides is mediated by membersof the so-called solute carrier (SLC) family. PepT1 (or SLC15A1), as amember of this family, is responsible for transporting of small peptidesacross the bush-border membrane of the small intestinal epithelium(Daniel, 2004). Several studies have shown that PepT1 plays a criticalrole in small peptides transportation using heterologous expressionsystems. In addition, studies on regulation of PepT1 expression have
shown that intestinal PepT1 is regulated by a variety of hormones(Terada and Ki, 2004), epidermal growth factor (Nielsen et al., 2001),diurnal rhythm (Pan et al., 2004) and dietary protein content (Shiragaet al., 1999). As demonstrated by Erickson et al. (1995), PepT1 mRNAexpression and peptide transport rate in rat intestine could be stimulat-ed by protein diet.
The PepT1 cDNAs have been identified and cloned in fishes, in-cluding zebrafish (Danio rerio) (Verri et al., 2003), Atlantic cod(Gadus morhua) (Rønnestad et al., 2007) and Common carp (Cyprinus
carpio) (Ostaszewska et al., 2009). These sequences give a good basefor evaluation of PepT1 gene expression in these species. As demon-strated by Döring et al. (1998), PepT1 was highly expressed in thesmall intestine, but expression levels were lower in the kidney andbile duct epithelium. Several studies have shown that PepT1 expres-sion was temporally and spatially regulated in fish embryos andadult zebrafish, which reflected the profile of small peptide transportfunction (Verri et al., 2003; Romano et al., 2006). Moreover, it hasbeen reported that PepT1 expression was also modulated by diets inteleosts (Gonçalves et al., 2007; Amberg et al., 2008; Hakim et al.,2009; Terova et al., 2009; Ostaszewska et al., 2010).
As a representative of the freshwater species from the Cyprinidae,the grass carp (Ctenopharyngodon idella) is a native Chinese freshwaterfish witha broad distribution from the catchment area of the Pearl River
Comparative Biochemistry and Physiology, Part B 164 (2013) 194–200
⁎ Corresponding author. Tel./fax: +86 731 84261452.E-mail address: [email protected] (J. Zhang).
1096-4959/$ – see front matter © 2013 Elsevier Inc. All rights reserved.
http://dx.doi.org/10.1016/j.cbpb.2012.11.008
Contents lists available at SciVerse ScienceDirect
Comparative Biochemistry and Physiology, Part B
j o u r n a l h o m e p a g e : w w w . e l s e v i e r . c o m / l o c a t e / c b p b
7/28/2019 LiuZ13_Characterization of Oligopeptide Transporter
http://slidepdf.com/reader/full/liuz13characterization-of-oligopeptide-transporter 2/7
in the southern China to the Heilongjiang River in northern China. Thegrass carp has been introduced to over 40 other countries, and is themost economically relevant cultured freshwater fish in many regionsof the world. The aquaculture of grass carp relies on fish feed. Fishmeal has been traditionally used as the main protein source in the prep-aration of diet for cultured grass carp. However, a limited world supplycombined with the price increase of fish meal has recently led to there-placement of fish meal with alternative protein sources, mainly of veg-
etable origin (Conceição et al., 2012). However, the new formulationshave resulted in enteritis and low growth rate in some aquatic speciessuch as Atlantic salmon (Salmo salar ) and other carnivorous fish(Verri et al., 2010). Thus, studies of small peptide transport offered awindow of opportunity to better understand the mechanisms inthis process and potential improvement of fish diet with differentformulations.
Because PepT1 is a key transporter of di/tripeptides, PepT1 hasbeen recently considered as an important target for formulatingdiets. The studies on PepT1 would help researchers to design noveldiets with more appropriate protein compositions for better absorp-tion. The aim of this study was to clone the PepT1 cDNA from grasscarp and studied its expression in different tissues of the grass carp.In addition, we characterized PepT1 expression in the early develop-ment and diurnal rhythmby realtime RT-PCR. Moreover, we extendedour studies to determine the influence of dietary protein and feedadditives on PepT1 expression. These studies provide valuable knowl-edge on theregulation of PepT1 expression infishand the effect of fishdiet on PepT1 expression, and thus have a potential application in im-proving fish feed formulation in aquaculture.
2. Materials and methods
2.1. Animals and tissue preparation
Grass carp were provided by the Hunan Institute of Aquatic Science.After animals were anesthetized by 2-phenoxyethanol (Sigma-Aldrich,St Louis, MO, USA), tissues samples (foregut, midgut, hindgut, heart,liver, spleen, kidney and muscle) were collected and immediately
frozen in liquid nitrogen and stored at−80 °C until further analysis.
2.2. RNA isolation and cDNA synthesis
Total RNAs were isolated from the foregut, midgut, hindgut, heart,liver, spleen, kidney and muscle tissues by Trizol reagent (Invitrogen,Carlsbad, CA, USA) according to the manufacturer's instructions. Theintegrity of the RNA was assayed by 1.2% agarose gel containing1 pg/mL of ethidium bromide. The quantity of RNA was detected byspectrophotometer (BioPhotometer Eppendorf, Hamburg, Germany)based on A260/A280 ratio. Before the first-strand cDNAs were syn-thesized, genomic DNA contamination was eliminated by incubationwith DNase I for 60 min at 37 °C (Fermentas, Vilnius, Lithuania).The first strand cDNA synthesis was performed using 1 μ g total RNA
and AMV reverse transcriptase (Fermentas) with the oligo (dT)12–18primer.
2.3. Cloning of the full length cDNA of PepT1
The PepT1 cDNA was cloned by PCR using degenerated primersdesigned based on conserved sequences of PepT1 in other teleosts(Table 1). Polymerase chain reaction (PCR) was performed as thefollowing: for 30 cycles with 94 °C for 30 s, 60 °C for 30 s and 72 °Cfor 90 s. The products were separated with 1% agarose gel. The DNAproduct was then cloned into pMD18-T (Takara, Japan)vector and se-quenced. After obtaining the central core sequence of PepT1, the fulllength cDNA was isolated using the SMART RACE cDNA AmplificationKit (Clontech, Palo Alto, CA, USA). Specific nested PCR primers were
designed based on the partial sequences (Table 1). For 3′
RACE, two
amplifications were performed under the same conditions: 94 °C for30 s, 62 °C for 30 s and 72 °C for 2 min with 30 cycles. For 5 ′ RACE,the amplification conditions were: 94 °C for 30 s, 60 °C for 30 s and72 °C for 1 min with 30 cycles.
2.4. Quantitative real-time PCR
The PepT1 mRNA levels were determined by quantitative
real-time PCR in a Prism 7500 Sequence Detection System (AppliedBiosystems, Foster City, CA, USA). The primers were designed usingPrimer Express 3.0 software (Table 1). β-Actin was used as an endog-enous control. Five microliters of first-strand cDNAs (in a dilution of 1:20) as templates was added to 20 μ L PCR solution containing20 nmol/L primers and 10 μ L SYBR Green PCR Master Mix (AppliedBiosystems). For each sample, three repeats were performed withthe following condition: 50 °C 5 min and 95 °C 10 min followed by40 cycles at 95 °C for 15 s and 60 °C for 45 s. The correspondingreal-time PCR ef ficiency was calculated according to the equation:PCR ef ficiency=(10−1/slope
−1)×100%. The values detected fromdifferent amounts of RNA (5 times of series dilution) of the represen-tative samples were parallel with the respective standard curve.Under these conditions, mean PCR ef ficiencies were 101.2% and
98.8%, respectively, for the PepT1 and β-actin. Following the amplifi
-cation, the dissociation curve was done to verify if single productwere generated. Negative RT control and negative NTC control werecarried out to rule out DNA and/or dimer contamination. RelativemRNA expression was assessed using the 2−ΔΔCt method by SDS soft-ware v1.3.1.
2.5. PepT1 expression patterns in grass carp
2.5.1. Determination of PepT1 expression during early development
Embryos and juvenile of grass carp were collected at differentdevelopmental stages (for each stage n= 5). Total RNAs were isolatedwith Trizol reagent and cDNAs were synthesized as describedabove. PepT1 mRNA expression levels were assayed by quantitative
real-time PCR.
2.5.2. Determination of the tissue distribution of PepT1 transcripts
RNAs were isolated from foregut, midgut, hindgut, heart, liver,spleen, kidney and muscle in adult grass carp. After synthesis of cDNAs, PepT1 expression in these tissues was assayed by quantitativereal-time PCR.
2.5.3. Determination of the diurnal rhythm of PepT1 transcripts in grass
carp intestine
The intestine was divided into three sections: the foregut, midgutand hindgut. The RNAs were isolated from intestine tissues in grasscarp (n=5). PepT1 differential expressions of the tissues in grass
carp were determined by quantitative real-time PCR.
Table 1
Primers used for PepT1 cloning and quantitative real-time PCR.
Primer Primer sequence Usage
Degenerate PepT1+ 5′-TCCATTAACGCTGGCAGT-3′ CDSDegenerate PepT1− 5′-GAGAAGTCSAGGCCGGT-3′ CDSGSP1+ 5′-TGCAGCTGGGCTTTGG-3′ 3′ RACEGSP2− 5′-AACATTGGCAGAGGGATA-3′ 5′ RACENGSP1+ 5′-CACATGGCCTGGCAGAT-3′ 3′ RACENGSP2− 5′-AAAGCCAGCGGGAAACAG-3′ 5′ RACE
PepT1 rt+ 5′-TGCTCTTGTTGTGTTCATCG-3′ Real-time PCR PepT1 rt− 5′-CTCTCTCTTGGGGTATTGCTT-3′ Real-time PCR β-actin+ 5′-GAACACTGTGCTGTCTGGAGGTA-3′ Real-time PCR β-actin− 5′-CTTGGGTTGGTCGTTTGAATC-3′ Real-time PCR
195 Z. Liu et al. / Comparative Biochemistry and Physiology, Part B 164 (2013) 194– 200

7/28/2019 LiuZ13_Characterization of Oligopeptide Transporter
http://slidepdf.com/reader/full/liuz13characterization-of-oligopeptide-transporter 3/7
2.6. Dietary protein levels and protein sources regulation on PepT1
To determine the effects of dietary protein levels on PepT1 expres-sion, three isocaloric diets with different protein levels at 22, 32 and42% crude protein (CP) were formulated (Table 2). Juvenile grass carp(0.5 years old) were kept in three fiberglass tanks (1.2 m H×0.8 mD) (n=30 fish in each tank). Before starting the experiment, the fishwere adapted to the experimental diets for 1 week. Fish were then
fed with the three different diets with 22, 32 and 42% CP levels for1 month, respectively. On day 7, day 14, day21 and day 28, five individ-uals were sacrificed andthe foreguts were collected.Thelevelsof PepT1mRNA expression were determined by real-time PCR in foregut.
The effects of dietary protein sources on the grass carp PepT1 ex-pression were analyzed by real-time RT-PCR. Two fish diets with thesame amount of protein were formulated using fish meal or soybeanmeal (Table 3). The fish (0.5 years old) were kept in two fiberglasstanks (1.2 m H×0.8 m D) (n=30 fish/tank) and adapted to the ex-periment diets in the experimental pond for 1 week before startingthe experiment. These two groups of fish were fed with fish meal orsoybean meal diets for 1 month, respectively. Every seven days, fiveindividuals were sacrificed and the foreguts were collected. The tran-scripts of PepT1 mRNAs were assayed by real-time PCR.
All diets were prepared by thoroughly mixing dry ingredientswith oil and then adding water until a stiff dough resulted. Thedough was then passed though a meat-mincer equipped with a2 mm die, and the resulting strands were dried using an electricalfan at 28 °C. After drying, the material was broken up into regularpieces sieved to a convenient pellet size and stored at −20 °C.
2.7. The effect of sodium butyrate on PepT1 gene expression
2.7.1. In vivo study
Thefish were randomly divided into twogroups: control andsodiumbutyrate group (n= 30).The formula of control group contained 32%CP(Table 2) while the sodium butyrate group was added 0.1% sodiumbutyrate in the formula. The feeding conditions were the same as de-scribed above. Seven individuals were collected once a week. The total
RNA of foregut was isolated and the PepT1 expression levels wereassayed by real-time PCR.
2.7.2. In vitro study
Primary cell culture was performed with grass carp intestinal cellsto examine the effect of sodium butyrate on PepT1 expression in vitro.Three grass carp (2-years-old) were killed and the foreguts wereseparated by scissors. After washing three times with PBS, the organs
were incubated with 0.05% (w/v) collagenase (Sigma-Aldrich,
St. Louis, MO, USA) in PBS for 15 min and followed by washing withPBS three times. Cells were cultured in 24-well culture plate with1 mL DMEM containing 10% fetal bovine serum (Gibco BRL, MD,USA), at a density of 800 mg/each well. Cells were incubated in thecell culture incubator at 24 °C with 5% CO2 for 2 days before sodiumbutyrate treatment.
To examine the response to sodium butyrate in vitro, four differentsodium butyrate concentrations (0 mM, 3 mM, 6 mM and 9 mM)were tested. Three replicates were done for each concentration.After a 12 h incubation, cells were harvested forPepT1 mRNA tran-script analysis by RT-PCR.
2.8. Statistical analysis
Data were analyzed by one-way analysis of variance. The normalityand homogeneity of variance were tested by the Levene's test (Weiet al., 2012). If data did not have homogenous variance, they werelog-transformed to meet the necessary assumptions of analysis of vari-ance. Significant differences among treatment means were determinedby the Tukey's multiple range test. All statistical analyses wereperformed by SPSS 13.0 software (Chicago, IL, USA). P valuesb0.05were confirmed as significant.
3. Results
3.1. Isolation and sequence analysis of PepT1cDNA from grass carp
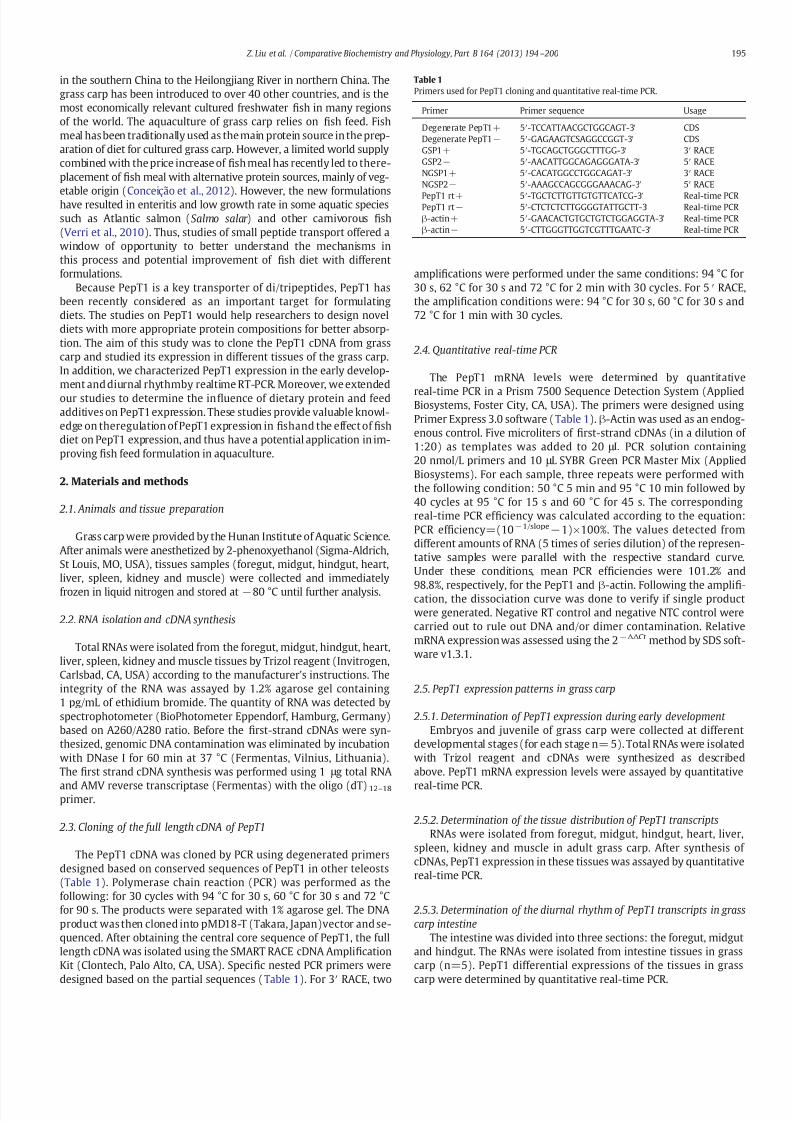
PepT1 cDNAs were isolated from a grass carp intestine cDNA library.The full length cDNA was 2762 bp (GenBank accession no. JN088166),with a 2142 bp open reading frame encoding a peptide of 714 aminoacids. The 5′ untranslated region (UTR) was 141 bp, while the 3′ UTR was 479 bp long and contained a polyA tail. From the deduced proteinsequence, seven putative extracellular N-glycosylation sites (Asn123,Asn449, Asn502, and Asn517) and one putative intracellular cAMP/cGMP dependent protein kinase phosphorylation sites (Thr368,Ser704, and Ser720) were identified. A phylogenetic tree wasconstructed with the Mega 4.0 software using the Neighbor-Joiningmethod (Fig. 1). The clustering pattern provides evidence that grasscarp PepT1 is grouped with high bootstrap support in the lineage of other teleosts. It shares high sequence homology with goldfish(Carassius auratus) and zebrafish (D. rerio) PepT1b. The PepT1 from
mammals are grouped into two other distinct lineages (Fig. 1).
Table 2
Formulation of different dietary protein levels.
CP% 22% 32% 42%
Wheatfl
our 8.00 8.00 8.00Starch 37.00 20.00 3.00Soybean meal 32.00 32.00 32.00Fish meal 12.00 28.00 44.00Soya bean oil 3.00 3.00 3.00Fish oil 2.00 3.00 4.00Choline chloride 0.5 0.5 0.5Calcium hydrogen phosphate 1.0 1.0 1.0Chromium oxide 0.5 0.5 0.5Methyl cellulose 2.00 2.00 2.00Premix 2.00 2.00 2.00
Nutrition indicators
ME (kcal/kg) 3282.40 3192.60 3102.80DE (kcal/kg) 3568.50 3486.90 3405.30EE (%) 6.98 9.53 12.09CF (%) 1.95 2.08 2.21ASH (%) 4.47 7.67 10.87
Table 3
Formulation of different dietary protein sources dietary.
Group Fish meal Soybean meal
Wheat flour 8.00 8.00Starch 32.00 12.00Soybean meal 0.00 68.00Fish meal 47.00 0.00Soy bean oil 3.00 2.00Fish oil 3.00 3.00
Choline chloride 0.5 0.5Calcium hydrogen phosphate 1.0 1.0Chromium oxide 0.5 0.5Methyl cellulose 2.00 2.00Premix 2.00 2.00
Nutrition indicators
CP 30.24 30.28ME (kcal/kg) 3211.00 3102.60DE (kcal/kg) 3421.70 3483.00EE (%) 10.85 6.41CF (%) 0.57 3.73ASH (%) 9.52 4.27
196 Z. Liu et al. / Comparative Biochemistry and Physiology, Part B 164 (2013) 194– 200
7/28/2019 LiuZ13_Characterization of Oligopeptide Transporter
http://slidepdf.com/reader/full/liuz13characterization-of-oligopeptide-transporter 4/7
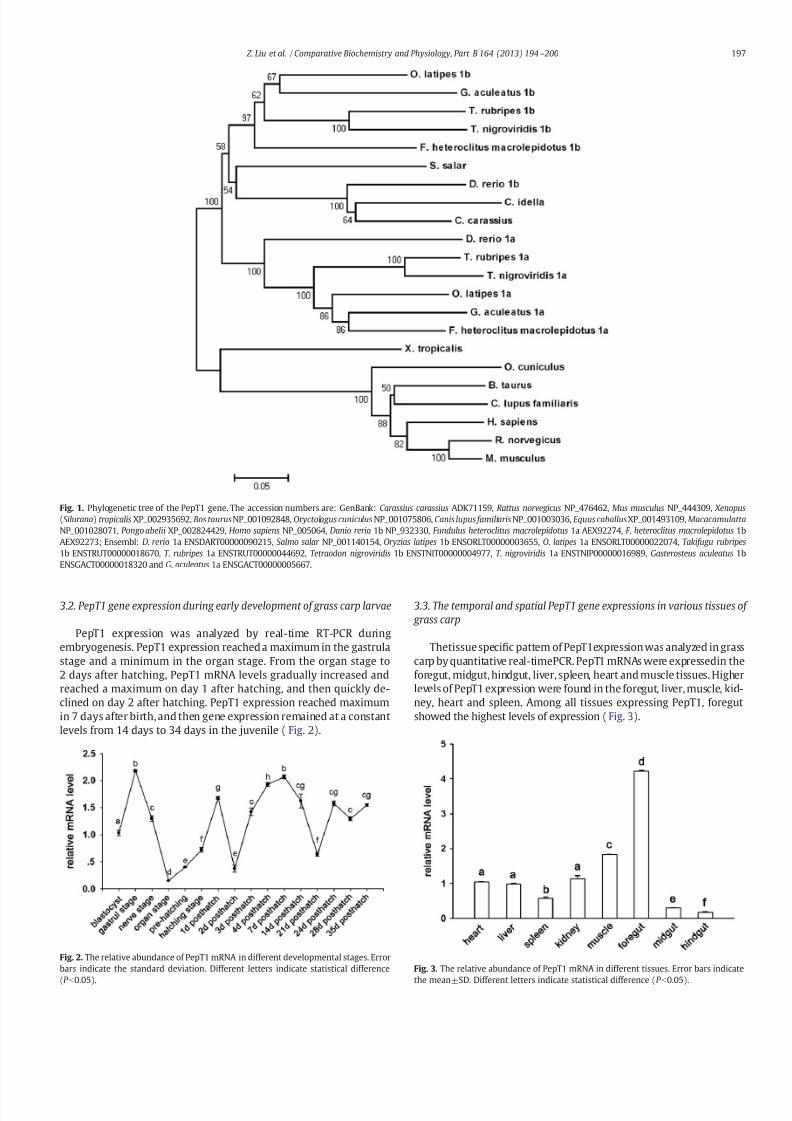
3.2. PepT1 gene expression during early development of grass carp larvae
PepT1 expression was analyzed by real-time RT-PCR duringembryogenesis. PepT1 expression reached a maximum in the gastrulastage and a minimum in the organ stage. From the organ stage to2 days after hatching, PepT1 mRNA levels gradually increased andreached a maximum on day 1 after hatching, and then quickly de-clined on day 2 after hatching. PepT1 expression reached maximumin 7 days after birth, and then gene expression remained at a constantlevels from 14 days to 34 days in the juvenile ( Fig. 2).
3.3. The temporal and spatial PepT1 gene expressions in various tissues of
grass carp
Thetissue specific pattern of PepT1expression was analyzed in grasscarp by quantitative real-timePCR. PepT1 mRNAs were expressedin theforegut, midgut, hindgut, liver, spleen, heart and muscle tissues. Higherlevels of PepT1 expression were found in the foregut, liver, muscle, kid-ney, heart and spleen. Among all tissues expressing PepT1, foregutshowed the highest levels of expression (Fig. 3).
Fig. 1. Phylogenetic tree of the PepT1 gene. The accession numbers are: GenBank: Carassius carassius ADK71159, Rattus norvegicus NP_476462, Mus musculus NP_444309, Xenopus
(Silurana) tropicalis XP_002935692, Bos taurusNP_001092848, Oryctolagus cuniculus NP_001075806, Canis lupus familiaris NP_001003036, Equus caballusXP_001493109, Macacamulatta
NP_001028071, Pongo abelii XP_002824429, Homo sapiens NP_005064, Danio rerio 1b NP_932330, Fundulus heteroclitus macrolepidotus 1a AEX92274, F . heteroclitus macrolepidotus 1bAEX92273; Ensembl: D. rerio 1a ENSDART00000090215, Salmo salar NP_001140154, Oryzias latipes 1b ENSORLT00000003655, O. latipes 1a ENSORLT00000022074, Takifugu rubripes
1b ENSTRUT00000018670, T . rubripes 1a ENSTRUT00000044692, Tetraodon nigroviridis 1b ENSTNIT00000004977, T . nigroviridis 1a ENSTNIP00000016989, Gasterosteus aculeatus 1bENSGACT00000018320 and G. aculeatus 1a ENSGACT00000005667.
Fig. 2. The relative abundance of PepT1 mRNA in different developmental stages. Errorbars indicate the standard deviation. Different letters indicate statistical difference
(P b
0.05).
Fig. 3. The relative abundance of PepT1 mRNA in different tissues. Error bars indicate
the mean±SD. Different letters indicate statistical difference (P b
0.05).
197 Z. Liu et al. / Comparative Biochemistry and Physiology, Part B 164 (2013) 194– 200
7/28/2019 LiuZ13_Characterization of Oligopeptide Transporter
http://slidepdf.com/reader/full/liuz13characterization-of-oligopeptide-transporter 5/7
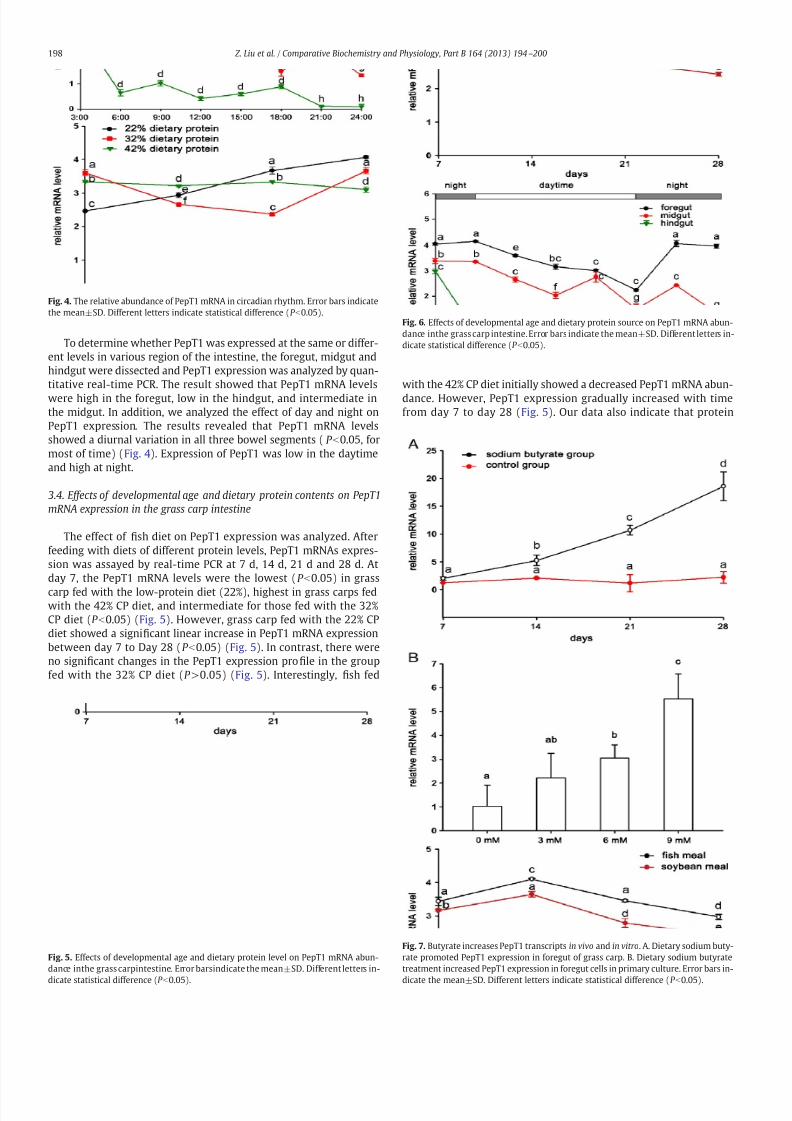
To determine whether PepT1 was expressed at the same or differ-ent levels in various region of the intestine, the foregut, midgut andhindgut were dissected and PepT1 expression was analyzed by quan-titative real-time PCR. The result showed that PepT1 mRNA levelswere high in the foregut, low in the hindgut, and intermediate inthe midgut. In addition, we analyzed the effect of day and night onPepT1 expression. The results revealed that PepT1 mRNA levelsshowed a diurnal variation in all three bowel segments ( P b0.05, formost of time) (Fig. 4). Expression of PepT1 was low in the daytimeand high at night.
3.4. Effects of developmental age and dietary protein contents on PepT1
mRNA expression in the grass carp intestine
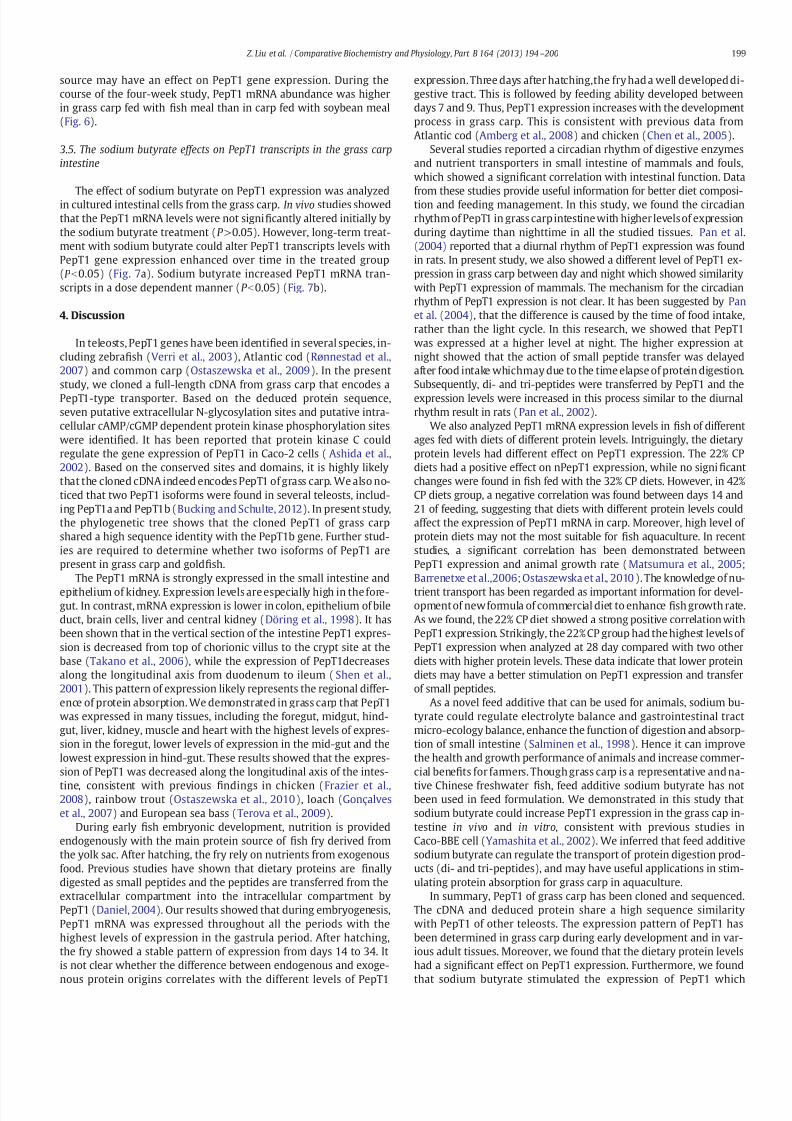
The effect of fish diet on PepT1 expression was analyzed. Afterfeeding with diets of different protein levels, PepT1 mRNAs expres-sion was assayed by real-time PCR at 7 d, 14 d, 21 d and 28 d. Atday 7, the PepT1 mRNA levels were the lowest (P b0.05) in grass
carp fed with the low-protein diet (22%), highest in grass carps fedwith the 42% CP diet, and intermediate for those fed with the 32%CP diet (P b0.05) (Fig. 5). However, grass carp fed with the 22% CPdiet showed a significant linear increase in PepT1 mRNA expressionbetween day 7 to Day 28 (P b0.05) (Fig. 5). In contrast, there wereno significant changes in the PepT1 expression profile in the groupfed with the 32% CP diet (P >0.05) (Fig. 5). Interestingly, fish fed
with the 42% CP diet initially showed a decreased PepT1 mRNA abun-dance. However, PepT1 expression gradually increased with timefrom day 7 to day 28 (Fig. 5). Our data also indicate that protein
Fig. 4. The relative abundance of PepT1 mRNA in circadian rhythm. Error bars indicatethe mean±SD. Different letters indicate statistical difference (P b0.05).
Fig. 5. Effects of developmental age and dietary protein level on PepT1 mRNA abun-dance inthe grass carpintestine. Error barsindicate the mean±SD. Different letters in-
dicate statistical difference (P b
0.05).
Fig. 6. Effects of developmental age and dietary protein source on PepT1 mRNA abun-dance inthe grass carp intestine. Error bars indicate the mean±SD. Different letters in-dicate statistical difference (P b0.05).
Fig. 7. Butyrate increases PepT1 transcripts in vivo and in vitro. A. Dietary sodium buty-rate promoted PepT1 expression in foregut of grass carp. B. Dietary sodium butyratetreatment increased PepT1 expression in foregut cells in primary culture. Error bars in-
dicate the mean±SD. Different letters indicate statistical difference (P b
0.05).
198 Z. Liu et al. / Comparative Biochemistry and Physiology, Part B 164 (2013) 194– 200
7/28/2019 LiuZ13_Characterization of Oligopeptide Transporter
http://slidepdf.com/reader/full/liuz13characterization-of-oligopeptide-transporter 6/7
source may have an effect on PepT1 gene expression. During thecourse of the four-week study, PepT1 mRNA abundance was higherin grass carp fed with fish meal than in carp fed with soybean meal(Fig. 6).
3.5. The sodium butyrate effects on PepT1 transcripts in the grass carp
intestine
The effect of sodium butyrate on PepT1 expression was analyzedin cultured intestinal cells from the grass carp. In vivo studies showedthat the PepT1 mRNA levels were not significantly altered initially bythe sodium butyrate treatment (P >0.05). However, long-term treat-ment with sodium butyrate could alter PepT1 transcripts levels withPepT1 gene expression enhanced over time in the treated group(P b0.05) (Fig. 7a). Sodium butyrate increased PepT1 mRNA tran-scripts in a dose dependent manner (P b0.05) (Fig. 7b).
4. Discussion
In teleosts, PepT1 genes have been identified in several species, in-cluding zebrafish (Verri et al., 2003), Atlantic cod (Rønnestad et al.,2007) and common carp (Ostaszewska et al., 2009). In the presentstudy, we cloned a full-length cDNA from grass carp that encodes aPepT1-type transporter. Based on the deduced protein sequence,seven putative extracellular N-glycosylation sites and putative intra-cellular cAMP/cGMP dependent protein kinase phosphorylation siteswere identified. It has been reported that protein kinase C couldregulate the gene expression of PepT1 in Caco-2 cells (Ashida et al.,2002). Based on the conserved sites and domains, it is highly likelythat the cloned cDNA indeed encodes PepT1 of grass carp. We also no-ticed that two PepT1 isoforms were found in several teleosts, includ-ing PepT1a and PepT1b (Bucking and Schulte, 2012). In present study,the phylogenetic tree shows that the cloned PepT1 of grass carpshared a high sequence identity with the PepT1b gene. Further stud-ies are required to determine whether two isoforms of PepT1 arepresent in grass carp and goldfish.
The PepT1 mRNA is strongly expressed in the small intestine and
epithelium of kidney. Expression levels are especially high in the fore-gut. In contrast, mRNA expression is lower in colon, epithelium of bileduct, brain cells, liver and central kidney (Döring et al., 1998). It hasbeen shown that in the vertical section of the intestine PepT1 expres-sion is decreased from top of chorionic villus to the crypt site at thebase (Takano et al., 2006), while the expression of PepT1decreasesalong the longitudinal axis from duodenum to ileum (Shen et al.,2001). This pattern of expression likely represents the regional differ-ence of protein absorption. We demonstrated in grass carp that PepT1was expressed in many tissues, including the foregut, midgut, hind-gut, liver, kidney, muscle and heart with the highest levels of expres-sion in the foregut, lower levels of expression in the mid-gut and thelowest expression in hind-gut. These results showed that the expres-sion of PepT1 was decreased along the longitudinal axis of the intes-
tine, consistent with previous findings in chicken (Frazier et al.,2008), rainbow trout (Ostaszewska et al., 2010), loach (Gonçalveset al., 2007) and European sea bass (Terova et al., 2009).
During early fish embryonic development, nutrition is providedendogenously with the main protein source of fish fry derived fromthe yolk sac. After hatching, the fry rely on nutrients from exogenousfood. Previous studies have shown that dietary proteins are finallydigested as small peptides and the peptides are transferred from theextracellular compartment into the intracellular compartment byPepT1 (Daniel, 2004). Our results showed that during embryogenesis,PepT1 mRNA was expressed throughout all the periods with thehighest levels of expression in the gastrula period. After hatching,the fry showed a stable pattern of expression from days 14 to 34. Itis not clear whether the difference between endogenous and exoge-
nous protein origins correlates with the different levels of PepT1
expression. Three days after hatching,the fry had a well developed di-gestive tract. This is followed by feeding ability developed betweendays 7 and 9. Thus, PepT1 expression increases with the developmentprocess in grass carp. This is consistent with previous data fromAtlantic cod (Amberg et al., 2008) and chicken (Chen et al., 2005).
Several studies reported a circadian rhythm of digestive enzymesand nutrient transporters in small intestine of mammals and fouls,which showed a significant correlation with intestinal function. Data
from these studies provide useful information for better diet composi-tion and feeding management. In this study, we found the circadianrhythm of PepT1 in grass carpintestine with higher levels of expressionduring daytime than nighttime in all the studied tissues. Pan et al.(2004) reported that a diurnal rhythm of PepT1 expression was foundin rats. In present study, we also showed a different level of PepT1 ex-pression in grass carp between day and night which showed similaritywith PepT1 expression of mammals. The mechanism for the circadianrhythm of PepT1 expression is not clear. It has been suggested by Panet al. (2004), that the difference is caused by the time of food intake,rather than the light cycle. In this research, we showed that PepT1was expressed at a higher level at night. The higher expression atnight showed that the action of small peptide transfer was delayedafter food intake whichmay due to the time elapse of protein digestion.Subsequently, di- and tri-peptides were transferred by PepT1 and theexpression levels were increased in this process similar to the diurnalrhythm result in rats (Pan et al., 2002).
We also analyzed PepT1 mRNA expression levels in fish of differentages fed with diets of different protein levels. Intriguingly, the dietaryprotein levels had different effect on PepT1 expression. The 22% CPdiets had a positive effect on nPepT1 expression, while no significantchanges were found in fish fed with the 32% CP diets. However, in 42%CP diets group, a negative correlation was found between days 14 and21 of feeding, suggesting that diets with different protein levels couldaffect the expression of PepT1 mRNA in carp. Moreover, high level of protein diets may not the most suitable for fish aquaculture. In recentstudies, a significant correlation has been demonstrated betweenPepT1 expression and animal growth rate (Matsumura et al., 2005;Barrenetxe et al.,2006; Ostaszewska et al., 2010). The knowledge of nu-
trient transport has been regarded as important information for devel-opmentof newformula of commercial diet to enhance fish growth rate.As we found, the 22% CP diet showed a strong positive correlation withPepT1 expression. Strikingly, the 22% CP group had the highest levels of PepT1 expression when analyzed at 28 day compared with two otherdiets with higher protein levels. These data indicate that lower proteindiets may have a better stimulation on PepT1 expression and transferof small peptides.
As a novel feed additive that can be used for animals, sodium bu-tyrate could regulate electrolyte balance and gastrointestinal tractmicro-ecology balance, enhance the function of digestion and absorp-tion of small intestine (Salminen et al., 1998). Hence it can improvethe health and growth performance of animals and increase commer-cial benefits for farmers. Though grass carp is a representative and na-
tive Chinese freshwater fish, feed additive sodium butyrate has notbeen used in feed formulation. We demonstrated in this study thatsodium butyrate could increase PepT1 expression in the grass cap in-testine in vivo and in vitro, consistent with previous studies inCaco-BBE cell (Yamashita et al., 2002). We inferred that feed additivesodium butyrate can regulate the transport of protein digestion prod-ucts (di- and tri-peptides), and may have useful applications in stim-ulating protein absorption for grass carp in aquaculture.
In summary, PepT1 of grass carp has been cloned and sequenced.The cDNA and deduced protein share a high sequence similaritywith PepT1 of other teleosts. The expression pattern of PepT1 hasbeen determined in grass carp during early development and in var-ious adult tissues. Moreover, we found that the dietary protein levelshad a significant effect on PepT1 expression. Furthermore, we found
that sodium butyrate stimulated the expression of PepT1 which
199 Z. Liu et al. / Comparative Biochemistry and Physiology, Part B 164 (2013) 194– 200
7/28/2019 LiuZ13_Characterization of Oligopeptide Transporter
http://slidepdf.com/reader/full/liuz13characterization-of-oligopeptide-transporter 7/7
could induce faster growth rate in grass carp. The regulation of PepT1expression by protein levels, sources and sodium butyrate could pro-vide new clues to help us design more suitable formula of fish dietsfor grass carp in aquaculture.
Acknowledgments
This research was supported by the National Natural Science Foun-
dation of China for Young Scholars (Grant No. 31001114) and HunanProvincial Natural Science Foundation of China (Grant No. 12JJ6018).
References
Amberg, J., Myr, C., Kamisaka, Y., Jordal, A.E.O., Rust, M., Hardy, R., Koedijk, R.,Rønnestad, I., 2008. Expression of the oligopeptide transporter, PepT1, in larvalAtlantic cod (Gadus morhua). Comp. Biochem. Physiol. B 150, 177–182.
Ashida, K., Katsura, T., Motohashi, H., Saito, H., Inui, K.I., 2002. Thyroid hormone regu-lates the activity and expression of the peptide transporter PEPT1 in Caco-2 cells.Am. J. Physiol. 282, G617–G623.
Barrenetxe, J., Aranguren, P., Grijalba, A., Martínez-Peñuela, J.M.,Marzo, F., Urdaneta, E.,2006. Effect of dietary quercetin and sphingomyelin on intestinal nutrient absorp-tion and animal growth. Br. J. Nutr. 95, 455–461.
Bucking, C., Schulte, P.M., 2012. Environmental and nutritional regulation of expressionand function of two peptide transporter (PepT1) isoforms in a euryhaline teleost.Comp. Biochem. Physiol. A 161, 379–387.
Chen, H., Pan, Y.X., Wong, E.A., Webb Jr., K.E., 2005. Dietary protein level and stage of
development affect expression of an intestinal peptide transporter (cPepT1) inchickens. J. Nutr. 135, 193–198.Conceição, L.E.C., Aragão, C., Dias, J., Costas, B., Terova, G., Martins, C., Tort, L., 2012.
Dietary nitrogen and fish welfare. Fish Physiol. Biochem. 38, 119–141.Daniel, H., 2004. Molecular and integrative physiology of intestinal peptide transport.
Annu. Rev. Physiol. 66, 361–384.Döring, F., Will, J., Amasheh, S., Clauss, W., Ahlbrecht, H., Daniel, H., 1998. Minimal
molecular determinants of substrates for recognition by the intestinal peptidetransporter. J. Biol. Chem. 273, 23211–23218.
Erickson, R.H., Gum, J., Lindstrom, M.M., McKean, D., Kim, Y.S., 1995. Regional expressionand dietary regulation of rat small intestinal peptide and amino acid transportermRNAs. Biochem. Biophys. Res. Commun. 216, 249–257.
Frazier, S., Ajiboye, K., Olds, A., Wyatt, T., Luetkemeier, E.S., Wong, E.A., 2008. Functionalcharacterization of the chicken peptide transporter 1 (pept1, slc15a1) gene. Anim.Biotechnol. 19, 201–210.
Gatlin III, D.M., Barrows, F.T., Brown, P., Dabrowski, K., Gaylord, T.G., Hardy, R.W.,Herman, E., Hu, G., Krogdahl, Å., Nelson, R., 2007. Expanding the utilization of sustainable plant products in aquafeeds: a review. Aquacult. Res. 38, 551–579.
Gonçalves, A.F., Castro, L.F.C., Pereira-Wilson, C., Coimbra, J., Wilson, J.M., 2007. Is there
a compromise between nutrient uptake and gas exchange in the gut of Misgurnusanguillicaudatus, an intestinal air-breathing fish? Comp. Biochem. Physiol. D 2,345–355.
Hakim, Y., Harpaz, S., Uni, Z., 2009. Expression of brush border enzymes and trans-porters in the intestine of European sea bass (Dicentrarchus labrax) followingfood deprivation. Aquaculture 290, 110–115.
Matsumura, K., Miki, T., Jhomori, T., Gonoi, T., Seino, S., 2005. Possible role of PEPT1 ingastrointestinal hormone secretion. Biochem. Biophys. Res. Commun. 336,1028–1032.
Nielsen, C.U., Amstrup, J., Steffansen, B., Frokjaer, S., Brodin, B., 2001. Epidermal growthfactor inhibits glycylsarcosine transport and hPepT1 expression in a human intes-tinal cell line. Am. J. Physiol. A 281, G191–G199.
Ostaszewska, T., Szatkowska, I., Verri, T., Dabrowski, K., Romano, A., Barca, A., Muszynska,M., Dybus, A., Grochowski, P., Kamaszewski, M., 2009. Cloning two PepT1 cDNA frag-ments of common carp, Cyprinus carpio (Actinopterygii: Cypriniformes: Cyprinidae).Acta Ichthyol Piscat 39, 81–86.
Ostaszewska, T., Kamaszewski, M., Grochowski, P., Dabrowski, K., Verri, T., Aksakal, E.,
Szatkowska, I., Nowak, Z., Dobosz, S., 2010. The effect of peptide absorption on PepT1gene expression and digestive system hormones in rainbow trout (Oncorhynchusmykiss). Comp. Biochem. Physiol. A 155, 107–114.
Pan, X., Terada, T., Irie, M., Saito, H., Inui, K.I., 2002. Diurnal rhythm of H+-peptidecotransporter in rat small intestine. Am. J. Physiol. 283, G57–G64.
Pan, X., Terada, T., Okuda, M., Inui, K.I., 2004. The diurnal rhythm of the intestinal trans-porters SGLT1 and PEPT1 is regulated by the feeding conditions in rats. J. Nutr. 134,2211–2215.
Romano, A., Kottra, G., Barca, A., Tiso, N., Maf fia, M., Argenton, F., Daniel, H., Storelli, C.,Verri, T., 2006. High-af finity peptide transporter PEPT2 (SLC15A2) of the zebrafishDanio rerio: functional properties, genomic organization, and expression analysis.Physiol. Genomics 24, 207–217.
Rønnestad, I., Gavaia, P.J., Viegas, C.S.B., Verri, T., Romano, A., Nilsen, T.O., Jordal, A.E.O.,Kamisaka, Y., Cancela, M.L., 2007. Oligopeptide transporter PepT1 in Atlantic cod(Gadus morhua L.): cloning, tissue expression and comparative aspects. J. Exp.Biol. 210, 3883–3896.
Salminen, S., Bouley, C., Boutron-Ruault, M., Cummings, J., Franck, A., Gibson, G.,Isolauri, E., Moreau, M., Roberfroid, M., Rowland, I., 1998. Functional food scienceand gastrointestinal physiology and function. Br. J. Nutr. 80, 147.
Shen, H., Smith, D.E., Brosius, F.C., 2001. Developmental expression of PEPT1 and PEPT2in rat small intestine, colon, and kidney. Pediatr. Res. 49, 789–795.
Shiraga, T., Miyamoto, K.I., Tanaka, H., Yamamoto, H., Taketani, Y., Morita, K., Tamai, I.,Tsuji, A., Takeda, E., 1999. Cellular and molecular mechanisms of dietary regulationon rat intestinal H/peptide transporter PepT1. Gastroenterology 116, 354–362.
Takano, M., Yumoto, R., Murakami, T., 2006. Expression and function of ef flux drugtransporters in the intestine. Pharmacol. Therapeut. 109, 137–161.
Terada, T., Ki, I., 2004. Peptide transporters: structure, function, regulation and applica-tion for drug delivery. Curr. Drug Metab. 5, 85–94.
Terova, G.,Corà,S., Verri,T., Rimoldi, S.,Bernardini,G., Saroglia, M.,2009.Impact of feedavailability on PepT1 mRNA expression levels in sea bass (Dicentrarchus labrax).Aquaculture 294, 288–299.
Verri, T., Kottra, G., Romano, A., Tiso, N., Peric, M., Maf fia, M., Boll, M., Argenton, F., Daniel,H., Storelli, C.,2003. Molecular andfunctional characterisation of thezebrafish (Daniorerio) PEPT1-type peptide transporter1. FEBS Lett. 549, 115–122.
Verri, T., Romano, A., Barca, A., Kottra, G., Daniel, H., Storelli, C., 2010. Transport of di-and tripeptides in teleost fish intestine. Aquacult. Res. 41, 641–653.
Wei, J., Carroll, R., Harden, K., Wu, G., 2012. Comparisons of treatment means whenfactors do not interact in two-factorial studies. Amino Acids 42, 2031–2035.
Yamashita, S., Konishi, K., Yamazaki, Y., Taki, Y., Sakane, T., Sezaki, H., Furuyama, Y.,2002. New and better protocols for a short‐term Caco‐2 cell culture system.
J. Pharm. Sci. 91, 669–679.
200 Z. Liu et al. / Comparative Biochemistry and Physiology, Part B 164 (2013) 194– 200