Embed Size (px)
Citation preview

www.elsevier.com/locate/tecto
Tectonophysics 386
Lithospheric transition from the Variscan Iberian Massif to the
Jurassic oceanic crust of the Central Atlantic
M. Fernandez*, I. Marzan, M. Torne
Department of Geophysics and Tectonics, Institute of Earth Sciences (J. Almera), CSIC, Sole i Sabaris s/n, E-08028 Barcelona, Spain
Received 21 October 2003; accepted 25 May 2004
Available online 20 July 2004
Abstract
A 1000-km-long lithospheric transect running from the Variscan Iberian Massif (VIM) to the oceanic domain of the
Northwest African margin is investigated. The main goal of the study is to image the lateral changes in crustal and lithospheric
structure from a complete section of an old and stable orogenic belt—the Variscan Iberian Massif—to the adjacent Jurassic
passive margin of SW Iberia, and across the transpressive and seismically active Africa–Eurasia plate boundary. The modelling
approach incorporates available seismic data and integrates elevation, gravity, geoid and heat flow data under the assumptions
of thermal steady state and local isostasy. The results show that the Variscan Iberian crust has a roughly constant thickness of
~30 km, in opposition to previous works that propose a prominent thickening beneath the South Portuguese Zone (SPZ). The
three layers forming the Variscan crust show noticeable thickness variations along the profile. The upper crust thins from central
Iberia (about 20 km thick) to the Ossa Morena Zone (OMZ) and the NE region of the South Portuguese Zone where locally the
thickness of the upper crust is b8 km. Conversely, there is a clear thickening of the middle crust (up to 17 km thick) under the
Ossa Morena Zone, whereas the thickness of the lower crust remains quite constant (~6 km). Under the margin, the thinning of
the continental crust is quite gentle and occurs over distances of ~200 km, resembling the crustal attitude observed further north
along the West Iberian margins. In the oceanic domain, there is a 160-km-wide Ocean Transition Zone located between the
thinned continental crust of the continental shelf and slope and the true oceanic crust of the Seine Abyssal Plain. The total
lithospheric thickness varies from about 120 km at the ends of the model profile to less than 100 km below the Ossa Morena and
the South Portuguese zones. An outstanding result is the mass deficit at deep lithospheric mantle levels required to fit the
observed geoid, gravity and elevation over the Ossa Morena and South Portuguese zones. Such mass deficit can be interpreted
either as a lithospheric thinning of 20–25 km or as an anomalous density reduction of ~25 kg m�3 affecting the lower
lithospheric levels. Whereas the first hypothesis is consistent with a possible thermal anomaly related to recent geodynamics
affecting the nearby Betic–Rif arc, the second is consistent with mantle depletion related to ancient magmatic episodes that
occurred during the Hercynian orogeny.
D 2004 Elsevier B.V. All rights reserved.
Keywords: Geoid; Gravity; Heat flow; Depleted mantle; SW Iberia; Plate boundary
* Corresponding author. Tel.: +34 934095410; fax: +34 934110012.
0040-1951/$ - s
doi:10.1016/j.tec
E-mail addr
(2004) 97–115
ee front matter D 2004 Elsevier B.V. All rights reserved.
to.2004.05.005
ess: [email protected] (M. Fernandez).

M. Fernandez et al. / Tectonophysics 386 (2004) 97–11598
1. Introduction
The southwestern region of the Iberian Peninsula,
which has suffered a long and complex geodynamic
evolution, is characterized by the transition from the
stable Variscan Iberian Massif to the Central Atlantic
oceanic domain. The region encompasses two late
Precambrian–early Paleozoic shear suture zones cor-
responding to continental collision and oceanic sub-
Fig. 1. Map of the study area showing the location of the modelled regiona
from North to South, CZ: Cantabrian Zone; ALZ: Astur-Leonese Zone;
Portuguese Zone. At sea from North to South, TAP: Tagus Abyssal Plain
Patch Seamount; SAP: Seine Abyssal Plain. Inset shows a global view o
(MN3) and magnetic lineations. Dashed region denotes the Africa–Eurasi
duction, respectively; a late Jurassic–early Cretaceous
passive margin; and the east end of the Azores–
Gibraltar Fracture Zone submitted to right-lateral
transpression since late Cretaceous, which limits the
present-day west termination of the Eurasian and
African plates.
The superposition of all these tectonothermal
episodes resulted in a very puzzling present-day
crustal and lithospheric structure. Up to now there
l transect (thick line). Contour bathymetry interval at 400 m. On land
CIZ: Central Iberia Zone; OMZ: Ossa Morena Zone; SPZ: South
; GB: Gorringe Bank; HAP: Horseshoe Abyssal Plain; CPS: Coral
f the Azores–Gibraltar Fracture Zone including epicenter locations
a plate boundary.

M. Fernandez et al. / Tectonophysics 386 (2004) 97–115 99
have been several attempts to study the crustal
architecture of the region although little is known
about the lithospheric mantle structure along the
transition from the Hercynian mainland to the oceanic
domain. The crustal structure of the Variscan Iberian
Massif has been investigated mainly through several
seismic wide-angle and refraction profiles (e.g.,
Mueller et al., 1973; Matias, 1996; Gonzalez et al.,
1996, 1998, among others). Crustal thickness beneath
the Iberian Massif lies around 30 km increasing
slightly towards the center of the Iberian Peninsula
(Banda, 1988; Surinach and Vegas, 1988). Major
discrepancies among authors refer to the Vp depth
distribution at intermediate/deep crustal levels, and to
the existence of noticeable crustal thickening (4–6
km) beneath the South Portuguese Zone (Fig. 1). On
the other hand, the Bouguer anomaly data show a
prominent positive anomaly affecting the South
Portuguese and the Ossa Morena zones (Fig. 1)
indicating an anomalous density distribution inside
the crust. Lateral variations in the nature/composition
of rocks at upper/middle crustal levels have been
envisaged in recent magnetotelluric and deep seismic
experiments showing the presence of high conductiv-
ity and high reflectivity bodies interpreted as sill-like
intrusions with assimilated pyritic graphite-rich rocks
(Almeida et al., 2001; Carbonell et al., 2003;
Simancas et al., 2003). Offshore the transition from
the continental crust of the shelf to the oceanic crust of
the Horseshoe Abyssal Plain have been investigated
by (Gonzalez et al., 1996) using coincident near-
vertical incidence and wide-angle seismic reflection
data. These authors conclude that the crust of the
Southwestern Iberia Margin undergoes a strong but
continuous thinning from 31 km onshore Iberia to less
than 15 km in the Horseshoe Abyssal Plain, and that
thinning occurs over an area which is about 120 km
wide. Two lithospheric transects across the western
Iberian margin were carried out by Torne et al. (1995).
The results show a rather constant lithospheric thick-
ness of about 110 km from mainland to the Iberian
Abyssal Plain, and a more variable thickness ranging
from 100 to 120 km beneath the Tagus Abyssal Plain
and the Madeira-Tore Rise.
Unlike the Variscan Iberian Massif, the southwest-
ern margin of the Iberian Peninsula and the oceanic
domain north and south of the Gorringe Bank region,
east of the Madeira Tore Rise, show active tectonic
activity characterized by a diffuse seismicity with
hypocenters down to 100–120 km (e.g., Grimison and
Chen, 1986; Mezcua and Rueda, 1997). This seis-
micity pattern has been interpreted by many authors as
indicating that the plate boundary is diffuse and that
the deformation spans a broad area (e.g., Sartori et al.,
1994; Jimenez-Munt et al., 2001a,b; Negredo et al.,
2002). Likewise, from structural geology and tomo-
graphic studies several authors have envisaged the
region as an example of westward delamination of the
lithospheric mantle (e.g., Royden, 1993; Seber et al.,
1996; Gutscher et al., 2002). However, neither the
position and dipping direction of the delaminated
mantle nor the origin of intermediate seismicity has
been yet identified.
In this paper, we model a 1000-km-long profile
that runs from central Iberia to the deep waters of the
Seine Abyssal Plain on the African plate (Fig. 1). The
profile crosses almost perpendicularly the three main
units of the Variscan Iberian Massif (Central Iberian
Zone, Ossa Morena Zone, and South Portuguese
Zone), the Southwestern Iberian Margin, and the
Africa–Eurasia plate boundary. The main objective of
this work is to image the lateral changes in crustal and
lithospheric structure when passing from a complete
section of an old and stable orogenic belt—the
Variscan Iberian Massif—to the adjacent Jurassic
passive margin of SW Iberia, and across the trans-
pressive and seismically active eastern segment of the
Azores–Gibraltar plate boundary. The results are
interpreted in terms of possible constraints on the
geodynamic evolution that affected the region. The
lithospheric modelling is based on a forward finite
element code that combines four coupled geophysical
observables: heat flow, gravity, geoid and absolute
elevation (Zeyen and Fernandez, 1994; Fernandez et
al., 2004).
2. Geological and tectonic setting
For simplicity, we can divide the study area into
two main tectonic regions, the Variscan Iberian Massif
and the Southwest Iberian Margin. The Variscan Belt
formed as a consequence of the collision between the
Balto-Laurentia and Gondwana continents, which
occurred during the late Paleozoic and is recognizable
in north and west Europe, northwest Africa and
M. Fernandez et al. / Tectonophysics 386 (2004) 97–115100
eastern North and South America. In the Iberian
Peninsula, the Variscan Belt occupies the western half
of Iberia and in its southwestern region it encom-
passes, from NE to SW, the following tectonic units
(Julivert et al., 1974): the Central Iberian Zone (CIZ),
the Ossa Morena Zone (OMZ), and the South
Portuguese Zone (SPZ). These units together with
the Cantabrian and the Astur-Leonese Zones located
in the northern part of Iberia form the so-called
Variscan Iberian Massif (VIM) (Fig. 1).
The major tectonic episodes that affected the VIM
during the Paleozoic are (e.g., Simancas et al., 2001):
(i) the accretion of the Ossa Morena Zone to the
Centro Iberian Zone along the Badajoz-Cordoba
suture zone due to a continent–continent collision
which occurred during Mid–Late Devonian, (ii) the
accretion of the South Portuguese Zone to the former
terranes along the Beja-Acebuches suture zone as a
consequence of the closure of the Rheic ocean, which
was coeval with the continent–continent collision, (iii)
oblique extension with abundant bimodal magmatism
in the SPZ and intrusion of gabbros and diorites in the
OMZ during the Early Carboniferous, and (iv) oblique
compression that produced the left-lateral shear
deformation in the abovementioned suture zones and
diverse degrees of metamorphism.
As a result of these tectonic episodes, the Central
Iberian Zone represents the most internal part of the
Variscan paleo-cordillera and is made up of Precam-
brian and Paleozoic rocks with a variable degree of
metamorphism and large granitic intrusions. The Ossa
Morena Zone is made up of Precambrian to early
Paleozoic sediments and volcanic and plutonic rocks,
whereas the allochthonous terrane of the South
Portuguese Zone is made up of Carboniferous and
late Devonian folded and thrusted sediments with
almost no metamorphism. The Badajoz-Cordoba
shear suture zone separating the CIZ and the OMZ
is made up of Precambrian and early Paleozoic rocks
with high metamorphic grade and mafic rocks.
Whether this suture zone was created as a conse-
quence of the Variscan orogeny as proposed by
several authors (e.g., Burg et al., 1981; Matte, 1983;
Azor et al., 1994) or is the reactivation of a
Precambrian structure as argued by other authors
(e.g., Ribeiro et al., 1990; Quesada, 1991; Abalos et
al., 1991, 1993) is still a debatable question. The
contact between the OMZ and the SPZ, which is made
through the Beja-Acebuches shear zone, corresponds
to the subduction/obduction of the Rheic oceanic
lithosphere and encompasses three subunits: the Beja-
Acebuches Ophiolitic Complex made up of metaba-
salts, metagabbros and ultrabasic rocks; the Pulo do
Lobo Accretionary Terrane, underthrusting the former
subunit, which is made up of metasediments and has
been interpreted as the accretionary prism; and the
Iberian Pyrite Belt, made up of turbiditic sediments
interbedded with continental volcanic rocks (e.g.,
Moreno-Garrido and Vera, 1985; Mitjavila et al.,
1997).
A regional extensional tectonic episode which was
initiated during the Permian, resulted in the dismem-
berment of Pangea, the opening of the Atlantic Ocean
and the initiation of extension in the Southwest
Iberian Margin. The analysis of seafloor spreading
magnetic anomalies has permitted the kinematics of
the Iberian plate since Mesozoic times to be recon-
structed (e.g., Klitgord and Schouten, 1986; Srivas-
tava et al., 1990; Malod and Mauffret, 1990).
Continental breakup took place firstly along the
Central African margin (Triassic) and propagated to
the north until middle–late Jurassic times producing
seafloor spreading off the North African margin and
forming the dprotoT Azores–Gibraltar plate boundary
between Africa and Iberia/Newfoundland. Magnetic
anomaly M0 (120 Ma, Palmer and Geissman, 1999)
marks the separation between the Iberian and the
North American plates which coincides with the
counterclockwise rotation of Iberia relative to Eurasia
and the initiation of seafloor spreading in the Bay of
Biscay, which continued until chron 33 (80 Ma). After
that, at chron 31 (70 Ma) convergence between
Eurasia and Africa would have started. Iberia moved
together with the African plate from the latest Creta-
ceous until the mid-Eocene (chron 19, 42 Ma) when
they started to move independently each other and the
plate boundary changed from the Bay of Biscay to the
Azores–Gibraltar Fracture Zone. Essentially, the sense
of motion between Africa and Iberia/Eurasia has
remained the same since that time to the present.
Over the Southwest Iberian Margin, Triassic and
Jurassic sediments represent the pre-rift and syn-rift
deposits on top of a Variscan basement of Precam-
brian and Paleozoic age. Continental conditions are
evidenced by lower to middle Triassic sediments that
exhibit a shift towards a marine environment from

M. Fernandez et al. / Tectonophysics 386 (2004) 97–115 101
middle Triassic onwards (Tortella et al., 1997), giving
rise to a well-developed carbonate platform which
was largely fragmented during the mid Jurassic–early
Cretaceous rifting episode. Widespread deformation
associated with tectonic convergence is recorded by
Tertiary and Quaternary sediments over the region.
Major WSW–ENE trending structural highs (Gorringe
Bank and Ampere and Coral Patch seamounts)
separated by basement lows (Tagus, Horseshoe and
Seine abyssal plains) were produced after the early
Eocene (Sartori et al., 1994) (Fig. 1). According to
these authors, deformation is accommodated over a
wide region by discrete thrust faults and buckling of
varying age rather than by a single major plate
boundary. Very large chaotic sedimentary bodies, that
probably formed during the early–middle Miocene,
are recorded over the whole region resulting from
tectonic frontal wedges and/or gravitational sliding
(e.g., Torelli et al., 1997; Tortella et al., 1997).
The possible influence of the evolution of the
Betic–Gibraltar–Rif system on the Southwest Iberian
Margin is poorly known and rather unclear. Several
authors have proposed that the origin of the Betic–
Gibraltar–Rif system is related to the westward roll-
back of an east-dipping mantle slab initiated during
the Miocene (e.g., Royden, 1993; Seber et al., 1996;
Lonergan and White, 1997; Gutscher et al., 2002).
Although most of these authors imply that deforma-
tion in the Alboran and the Gorringe/Coral Patch
regions was not directly linked, major discrepancies
arise between authors suggesting that compressional
structures in the SIM are related to active subduction
(e.g., Purdy, 1975; Royden, 1993) and those who
propose that convergence does not imply subduction
at all (e.g., Sartori et al., 1994; Torelli et al., 1997).
3. Methodology
Commonly, the base of the lithosphere is consid-
ered either as an isotherm (1300–1350 8C) or as a
surface where a fraction (0.85–0.9) of the melting
temperature of dry peridotites is accomplished.
Modelling the present-day lithospheric structure
requires the combination of various independent
observables (seismics, elevation, Bouguer anomaly,
geoid height and surface heat flow) that give
information on the density and temperature distribu-
tion at different depth ranges. Therefore, the integra-
tion of these observables in a unique model reduces
substantially the range of possible solutions. We have
used a finite element code that solves simultaneously
the geopotential, lithostatic, and heat transport equa-
tions (Zeyen and Fernandez, 1994; Fernandez et al.,
2004). The modelled lithospheric section is meshed
with triangular elements and divided into a number of
bodies to which, according to an assumed lithology,
different material properties are assigned: thermal
conductivity, heat production and its variation with
depth, density and its variation with pressure and
temperature. The top of the model section is the
Earth’s surface and the bottom corresponds to the
lithosphere–asthenosphere boundary. The density of
the mantle lithosphere is considered to be temperature
dependent (Parsons and Sclater, 1977) such that
qm=qa(1+a(Ta�T(z)), where qa is the density of the
asthenosphere, a is the thermal expansion coefficient,
and Ta is the temperature of the asthenosphere.
Temperature distribution and surface heat flow are
calculated by solving the steady-state heat transport
equation with the following boundary conditions:
constant temperatures of 15 and 1350 8C at the top
and bottom of the model, respectively, and no
horizontal heat flow across the lateral boundaries.
The Bouguer gravity anomaly is calculated using
Talwani’s 2D algorithm (Talwani et al., 1959) for each
triangular element of the mesh, thus allowing for
density variations depending on pressure, temperature
and lithology. The geoid anomaly is calculated using a
3D algorithm based on the resolution of the gravity
potential for a regular prism and Brun’s formula
(Ayala et al., 2003), modified for a 2D finite element
grid (H. Zeyen, personal communication). Elevation is
calculated for every column of the mesh under the
assumption of local isostasy and following (Lachen-
bruch and Morgan, 1990). The depth to the isostatic
compensation level to calculate elevation and gravity
and geoid anomalies is taken at the maximum depth
reached by the lithospheric mantle, and the space
between this depth and the base of the model is filled
with asthenospheric material with a constant density.
The resulting elevation, Bouguer anomaly, geoid
height variation, and surface heat flow are compared
with the measured values and the crustal and litho-
spheric mantle geometry is modified until the best fit
is obtained.
M. Fernandez et al. / Tectonophysics 386 (2004) 97–115102
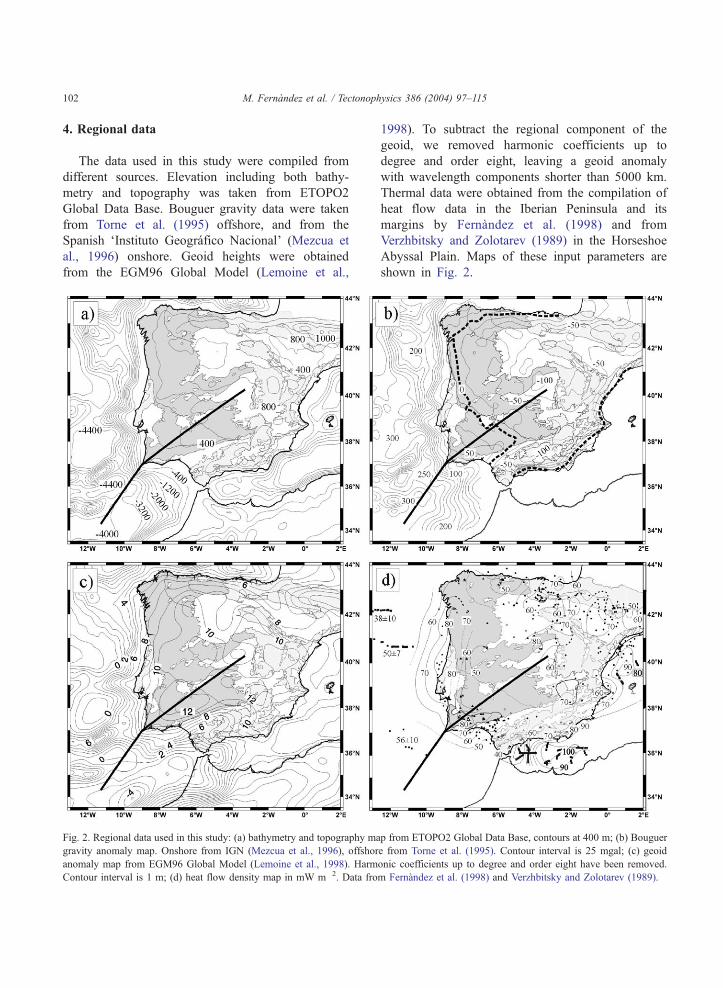
4. Regional data
The data used in this study were compiled from
different sources. Elevation including both bathy-
metry and topography was taken from ETOPO2
Global Data Base. Bouguer gravity data were taken
from Torne et al. (1995) offshore, and from the
Spanish dInstituto Geografico NacionalT (Mezcua et
al., 1996) onshore. Geoid heights were obtained
from the EGM96 Global Model (Lemoine et al.,
Fig. 2. Regional data used in this study: (a) bathymetry and topography ma
gravity anomaly map. Onshore from IGN (Mezcua et al., 1996), offshor
anomaly map from EGM96 Global Model (Lemoine et al., 1998). Harm
Contour interval is 1 m; (d) heat flow density map in mW m�2. Data fro
1998). To subtract the regional component of the
geoid, we removed harmonic coefficients up to
degree and order eight, leaving a geoid anomaly
with wavelength components shorter than 5000 km.
Thermal data were obtained from the compilation of
heat flow data in the Iberian Peninsula and its
margins by Fernandez et al. (1998) and from
Verzhbitsky and Zolotarev (1989) in the Horseshoe
Abyssal Plain. Maps of these input parameters are
shown in Fig. 2.
p from ETOPO2 Global Data Base, contours at 400 m; (b) Bouguer
e from Torne et al. (1995). Contour interval is 25 mgal; (c) geoid
onic coefficients up to degree and order eight have been removed.
m Fernandez et al. (1998) and Verzhbitsky and Zolotarev (1989).

M. Fernandez et al. / Tectonophysics 386 (2004) 97–115 103
4.1. Elevation
Fig. 2a shows the elevation data used in this study.
Onshore, maximum topographic heights of 700 m are
recorded around the northeastern end of the model
profile (Tagus Basin, central Iberia). From there, the
topography smoothly descends throughout the Varis-
can peneplain to reach the coastline at Cape San
Vicente. The transition from the shallow waters of the
continental shelf to the deep waters of the Seine
Abyssal Plain (~4400 m) is marked by a narrow zone
with steep slopes, particularly along the model profile.
To the southeast, in the Gulf of Cadiz area, this
transition is much gentler and occurs along a wider
zone. In contrast, to the northwest of the offshore
section of the profile, the bathymetry is very rough
with a series of deep basins (Tagus, Horseshoe, and
Seine abyssal plains) bounded by structural highs
(Gorringe Bank and Coral Patch Seamount) reaching
depths of few hundred meters.
4.2. Gravity
The Bouguer gravity field over the Variscan Iberian
Massif (Fig. 2b) shows an NW–SE regional trend
parallel to the main geological structures decreasing
very gently from values of ~100 mGal at Cape San
Vicente (shoreline) to about�90mGal at the NE end of
the profile (Tagus basin). The most outstanding feature
is that the 0 mGal isoline roughly follows the suture
between the Central Iberian and Ossa Morena zones
crossing the profile more than 300 km from the coast.
The significant displacement of the 0mGal isoline from
the coast indicates, as will be discussed below, the
presence of a high density crust in the Ossa Morena
Zone. Offshore, the Bouguer anomaly increases from
100mGal on the continental shelf up to 300mGal in the
deep waters of the abyssal plains reflecting the subsea-
floor contributions of the gravity field. The bathymetry
highs of the Gorringe Bank and Coral Patch Seamount
are bounded by relative gravity highs with values of
up to 400mGal, which have been related to lithospheric
mantle uplifting (e.g., Purdy, 1975; Souriau, 1984).
4.3. Geoid
The geoid anomaly map of Fig. 2c shows that
onshore the geoid variations are quite smooth with a
relative NE–SW trending geoid height centered on the
Ossa Morena Zone where the geoid reaches a
maximum value of more than 12 m. Offshore the
map shows that the TAP and SAP are associated with
local blowsQ of about �1 and �4 m, respectively,
whereas the continental shelf is associated with geoid
highs of 8–10 m. The transition from the continental
crust of Iberia to the oceanic domain is characterized
by a decrease of about 10 m in the geoid anomalies.
The two domains are separated by a steep gradient
which correlates with the increase in water depth from
the continental shelf towards the deep waters of both
the TAP and SAP.
4.4. Heat flow
Heat flow measurements in the study area are
irregularly distributed (Fig. 2d). Onshore, measure-
ments are concentrated in the southwestern Ossa
Morena and South Portuguese zones, whereas almost
no heat flow data are available in the Central Iberian
Zone. The available values, which come from oil,
water and mining exploration wells, show average
heat flow values between 60 and 70 mW m�2 with a
well defined thermal anomaly centered in the Pyrite
belt with values up to 80–85 mW m�2. Offshore, the
few available heat flow measurements in the region of
the Horseshoe Abyssal Plain indicate an average value
of 57F15 mW m�2.
5. Crustal structure from seismic data
Refraction/wide-angle seismic data acquired dur-
ing the last decades onshore and offshore have shed
light on the crustal architecture, and on the velocity–
depth distribution at crustal and uppermost mantle
levels, particularly in the SW corner of Iberia and in
the Gulf of Cadiz areas. Fig. 3 shows a compilation of
the seismic data used to constrain the crustal structure
of our lithospheric model.
In the Tajo Basin and the Central Iberian Zone, we
have used the results from Surinach and Vegas (1988)
and ILIHA DSS Group (1993) to which for compar-
ison we have added those from Pulgar et al. (1996)
corresponding to the Duero Basin. For the SW Ossa
Morena Zone and the South Portuguese Zone, we
have mainly used the compilation and reinterpretation

Fig. 3. Top map: location of seismic profiles used to constrain the crustal structure. Dotted line on lithospheric section denotes location of crustal cross section by Matte (1983) (Fig.
5). Bottom panel: geometry of the crustal layers as inferred from seismic data. P-wave velocities are shown in km s�1.
M.Fern
andez
etal./Tecto
nophysics
386(2004)97–115
104
M. Fernandez et al. / Tectonophysics 386 (2004) 97–115 105
of seismic wide-angle and refraction data by Gonzalez
et al. (1998) and the work by Mueller et al. (1973).
The available seismic wide-angle and refraction
results show that the crust underneath the Tertiary
Tajo Basin is about 32 km thick, slightly thinning
towards the OMZ, where the crust is less than 30 km
thick. The results in the SPZ indicate a noticeable
crustal thickening with thickness values around 34
km. Nevertheless, it is worth noting that Matias
(1996), based on a combined velocity–amplitude
analysis of available refraction and wide-angle pro-
files, proposes a nearly flat Moho at the SPZ and
OMZ lying at 31 km depth and rising towards the
continental margin. An outstanding result of the
seismic experiments is that the average velocity of
the mid and lower crust remains almost constant
onshore along the studied profile, whereas significant
lateral changes are observed at upper crustal levels. In
Fig. 3, we observe how upper crust P-wave velocities
vary from minimum values of 5.6–5.7 km s�1 to
maximum values of 6.1 km s�1. These changes can be
even more dramatic near the contact between OMZ
and SPZ with velocities of 6.35 and 6.7 km s�1 at
shallow levels probably related to exhumation of deep
crustal levels and/or basic intrusions (Matias, 1996).
According to Gonzalez et al. (1998) and ILIHA DSS
Group (1993), the middle crust beneath the SPZ and
partly beneath the OMZ is thickened relative to the
CIZ and this thickening is taken up by the upper crust.
The mid and lower crust are characterized by average
P-wave values of 6.4 and 6.8 km s�1, respectively,
whereas the Pn velocity falls within the range of 8.0–
8.1 km s�1 (e.g., Surinach and Vegas, 1988; ILIHA
DSS Group, 1993; and Gonzalez et al., 1998).
Offshore, results of the coincident near-vertical
incidence and wide-angle reflection data along an NE–
SW oriented seismic profile (Gonzalez et al., 1996)
have allowed us to constrain the crustal structure at the
transition from continent to ocean (Fig. 3). These
results show that the crust undergoes a strong but
continuous thinning from less than 30 km under the
continental shelf to less than 15 km at the eastern end
of the Horseshoe Abyssal Plain (see Figs. 1 and 3), and
that thinning is mainly taken up by the lower crust.
Along the transition zone, the crust is characterized by
average velocities that range from 2.2 to 3.7 km s�1 in
the sedimentary layers to 6.0 and 6.4 km s�1 at upper
and mid crustal levels, respectively. The Pn velocity is
poorly constrained, and there is weak evidence under-
neath the continental shelf that it falls within the range
of 7.8–7.9 km s�1. The geometry of the sedimentary
layers and the water depth were taken directly from
IAM-3 MCS profile (Banda et al., 1995; Tortella et al.,
1997). Hence, the thickness of the sedimentary cover
varies from 0.5 s (twtt) on the continental shelf and
slope to about 2 s (twtt) in the central part of the profile
(around �150 km distance in Fig. 3).
The crustal structure of the oceanic domain of the
Seine Abyssal Plain was derived from results of
Profile C of Purdy (1975) and Sartori et al. (1994).
These results show that the crust is anomalously thick
in the vicinity of the Coral Patch Seamount (about 11
km, including the sedimentary column) thinning
towards the central region of the Seine Abyssal Plain
to values of less than 7 km. Results of Purdy (1975)
show that the oceanic crust in the central region of the
Seine Abyssal Plain has P-wave velocities that range
from 4.1 to 5.6 km s�1 at upper crustal levels to 6.3
km s�1 at lower crustal levels, and that the uppermost
mantle is characterized by an anomalous Pn velocity
of 7.6 km s�1 (Fig. 3).
6. Lithospheric modelling
6.1. Modelling inputs
The model transect has been divided into a mesh of
211�59 nodes with a horizontal grid spacing of 5 km
and a variable vertical grid spacing depending on the
geometry of the defined bodies. Initially, we consid-
ered the crustal structure depicted in Fig. 3 and a flat
lithosphere–asthenosphere boundary at 110 km depth.
This initial geometry was successively modified until a
best fitting model was reached (Figs. 4 and 5).
According to the considered petrophysical properties
(density, thermal conductivity and heat production),
the lithospheric section has been divided into 12
different materials (Table 1). Most of the rock
parameters have been taken from direct measurements,
empirical relationships, and from previous modelling.
The density of the sedimentary cover varies from
2400 kg m�3 for the Tagus Basin and deeply buried
marine sediments in the continental margin to 2000 kg
m�3 for upper sediments in deep oceanic basins, in
agreement with gravity studies performed in the

Fig. 4. Results along model transect. (a) Heat flow; (b) geoid anomaly; (c) Bouguer gravity anomaly; (d) elevation. Dots with bars indicate measured data and grey thick lines indicate
calculated values. (e) Model geometry with body numbers as in Table 1. Hypocenters (MN3) have been projected onto the profile from a strip of 40 km half-width. Same legend as in
Fig. 1.
M.Fern
andez
etal./Tecto
nophysics
386(2004)97–115
106
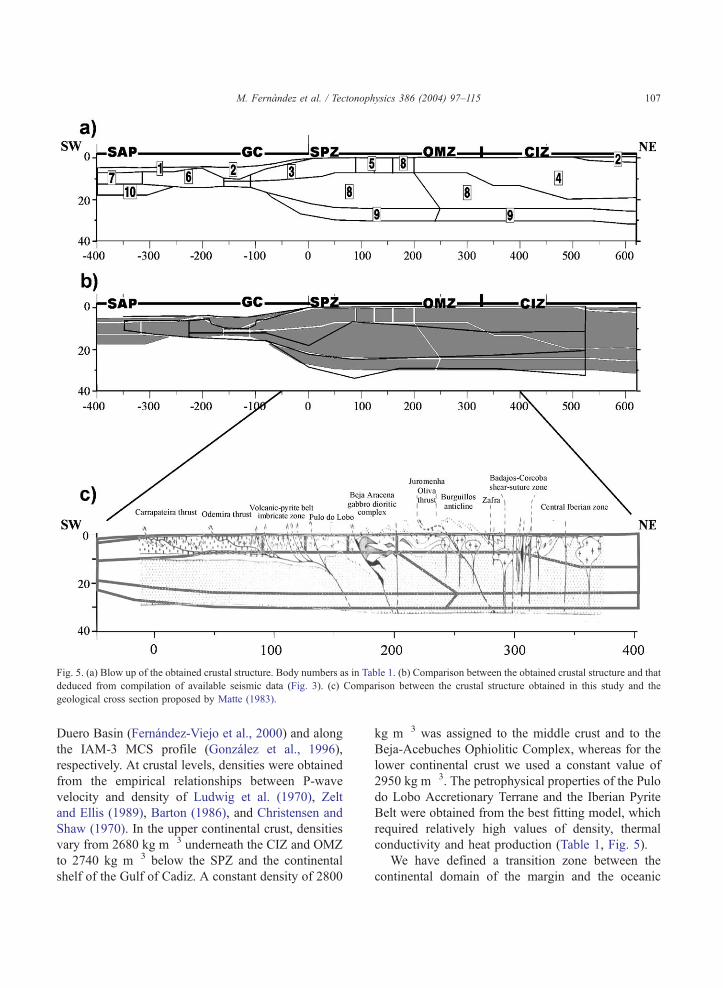
Fig. 5. (a) Blow up of the obtained crustal structure. Body numbers as in Table 1. (b) Comparison between the obtained crustal structure and that
deduced from compilation of available seismic data (Fig. 3). (c) Comparison between the crustal structure obtained in this study and the
geological cross section proposed by Matte (1983).
M. Fernandez et al. / Tectonophysics 386 (2004) 97–115 107
Duero Basin (Fernandez-Viejo et al., 2000) and along
the IAM-3 MCS profile (Gonzalez et al., 1996),
respectively. At crustal levels, densities were obtained
from the empirical relationships between P-wave
velocity and density of Ludwig et al. (1970), Zelt
and Ellis (1989), Barton (1986), and Christensen and
Shaw (1970). In the upper continental crust, densities
vary from 2680 kg m�3 underneath the CIZ and OMZ
to 2740 kg m�3 below the SPZ and the continental
shelf of the Gulf of Cadiz. A constant density of 2800
kg m�3 was assigned to the middle crust and to the
Beja-Acebuches Ophiolitic Complex, whereas for the
lower continental crust we used a constant value of
2950 kg m�3. The petrophysical properties of the Pulo
do Lobo Accretionary Terrane and the Iberian Pyrite
Belt were obtained from the best fitting model, which
required relatively high values of density, thermal
conductivity and heat production (Table 1, Fig. 5).
We have defined a transition zone between the
continental domain of the margin and the oceanic

Table 1
Rock parameters used in the model transect
Body
number
Heat
production
(AW m�3)
Thermal
conductivity
(W m�1 K�1)
Density
(kg m�3)
Neogene marine
sediments
1 1.2 c 2.0 a 2000 d
Paleogene
sediments
2 1.2 b 2.3 a 2400 d
Upper crust SPZ 3 2 a 3 a 2740 d
Upper crust
OMZ–CIZ
4 2.5 a 3 a 2680 d
Pyrite belt and
accretionary
Terrane
5 3.5 e 3.5 e 2770 e
Transitional crust 6 0.3 c 2.1 c 2800 c
Oceanic crust 7 0.3 c 2.1 c 2840 c
Middle crust
and Beja-
Acebuches
8 2 c 2.4 c 2800 d
Lower crust 9 0.3 c 2.1 c 2950 d
Anomalous
upper mantle
10 0 c 3.2 c 3160 d
Lithospheric
mantle
11 0 c 3.2 c T-dependent
Lithospheric mantle density is temperature dependent being:
3200(1+3.5�10�5 8C�1(Ta�T(z))); Ta=1350 8C. Other data come
from: (a) Fernandez et al. (1998); (b) from Rybach and Cermak
(1982); (c) from Torne et al. (1995); (d) densities deduced from the
empirical relationship between P-wave velocities and density of
Ludwig et al. (1970), Zelt and Ellis (1989) and Barton (1986); (e)
from the best fitting model.
M. Fernandez et al. / Tectonophysics 386 (2004) 97–115108
domain of the Seine Abyssal Plain. This transitional
crust has been proposed also by Gonzalez et al. (1996)
along the IAM3 MCS profile and by Torne et al.
(1995) along lithospheric profiles crossing the Atlantic
Iberian margin at the Tagus and the Iberia Abyssal
Plain. Hence, we have considered a density of 2800 kg
m�3 for the transition crust, and a density of 2840 kg
m�3 for the oceanic crust of the SAP, which following
Purdy (1975) is underlain by an anomalous mantle to
which we have assigned a density of 3150 kg m�3
(Fig. 5 and Table 1). For the lithospheric mantle, we
considered a temperature dependent density referred to
the density of the asthenosphere, which is assumed to
be constant (Lachenbruch and Morgan, 1990).
6.2. Modelling results
Figs. 4 and 5 present the results of the lithospheric
modelling along the regional model profile. Panels
(a), (b), (c), and (d) in Fig. 4 show the observed and
calculated heat flow, geoid and Bouguer anomalies,
and elevation, while panel (e) shows the lithospheric
structure. The observed heat flow values correspond
to the isolines depicted in Fig. 2d to which we have
associated an uncertainty of F10% (Fernandez
et al., 1998; Verzhbitsky and Zolotarev, 1989). The
observed Bouguer and geoid anomalies and elevation
data have been projected onto the profile from a strip
of 40 km half-width, the error bars indicating the
standard deviation associated with the lateral varia-
bility of each observable. The model results are in
good agreement with the data observed with the
exception of some local misfits. Short wavelength
misfits between the observed and calculated elevation
and Bouguer anomaly are found along the continental
slope and the structural highs bounding the abyssal
plains (Fig. 5c, d), which are attributed to local
features that are out of the scope of our regional
modelling, e.g., related to the gross geometry adopted
for the sediments and/or the top of the basement. The
geoid anomaly is fitted very well, whereas the surface
heat flow follows the observed general trend although
the large uncertainties of measured data make it more
difficult to evaluate the apparent match. The predicted
values in the vicinity of the Horseshoe Abyssal Plain
are considerably lower than those reported by
Verzhbitsky and Zolotarev (1989). These authors
propose that the Iberian–African plate boundary
behaves as a hot belt due to the active tectonics of
the region although the scarcity and variability of data
makes it difficult to confirm this hypothesis.
Our results (Figs. 4 and 5) show that across the
Variscan Iberian Massif the thickness of the crust
keeps almost constant at about 30 km depth. The
continental crust is characterized by three layers with
noticeable lateral thickness variations. The upper
crust, which is divided into different density
domains roughly coinciding with the main geo-
logical features observed in the area (Matte, 1983),
thins from 20 km below the CIZ to less than 7 km
underneath the OMZ. Towards the continental shelf,
in the South Portuguese Zone, the upper crust
thickens to values of 8–9 km. The upper crustal
thinning occurs at the expense of the middle crust
which below the OMZ and the northern half of the
SPZ reaches maximum thickness values of 18 km.
The thickness of the lower crust remains almost

M. Fernandez et al. / Tectonophysics 386 (2004) 97–115 109
constant (6 km) all along the Iberian Massif,
thinning out towards the Gulf of Cadiz. Our crustal
results confirm some of the gross crustal features
deduced from wide-angle seismic data. Major dis-
crepancies, however, are related to the upper/middle
crustal structure of the OMZ and the CIZ, which
according to seismic data should be much more
homogeneous; and to the total crustal thickness
beneath the SPZ, where Gonzalez et al. (1998) pro-
pose a crustal thickening of 3–4 km (Figs. 3 and 5b).
Across the continental margin, the crust thins from
30 km to less than 10 km (excluding water layer) over
a horizontal distance of 200 km. This crustal attitude
is also observed further north in the Tagus and the
Iberian abyssal plains where Torne et al. (1995) have
modelled two lithospheric profiles showing that the
continental crust thins across the passive margin over
horizontal distances of about 125 km. Similar results
have been obtained more recently from combined
seismic refraction and gravity modelling in the
Iberian Abyssal Plain (Dean et al., 2000). There is
no evidence of a well defined ocean–continent
boundary in the region and therefore we assumed
that the crust occupying the easternmost Horseshoe
Abyssal Plain and Coral Patch Seamount, whose
nature is not well determined (body #6 in Figs. 4 and
5), corresponds to a single transitional layer with an
average density of 2800 kg m�3 and variable thick-
ness. Such transitional crust has also been proposed
by Torne et al. (1995) and Dean et al. (2000) in the
western Iberian Margin. For simplicity, the oceanic
crust (without sediments) was defined as a single
average layer with a thickness of 5–6 km and density
of 2840 kg m�3. Although our results do not differ
very much from those obtained by Gonzalez et al.
(1996) from a combined wide-angle seismic and
gravity study, we find a necking-like structure
beneath the Horseshoe Abyssal Plain where the
minimum continental crustal thickness is attained
(Fig. 5). Differences also extend to the Coral Patch
Seamount that we characterize as a transitional crust,
and where we infer a Moho depth of ~14 km in
agreement with Sartori et al. (1994). At the end of the
profile, in the Seine Abyssal Plain, we have consid-
ered an anomalous mantle about 6 km thick consistent
with measured Vp values of 7.6 km s�1 (Purdy, 1975)
and in a way similar to that proposed by Torne et al.
(1995) beneath the Tagus Abyssal Plain.
The lower panel in Fig. 4 shows a noticeable
lithospheric thinning affecting the central part of the
model profile where the lithosphere–asthenosphere
boundary (LAB) rises from about 120 km depth
beneath central Iberia and its continental margin to
less than 96 km beneath the Ossa Morena and South
Portuguese zones. Lithospheric thicknesses of around
110–120 km have been proposed by Torne et al.
(1995) in two profiles crossing the Iberian Atlantic
margin, and by Fernandez et al. (1998) in the stable
Iberian Peninsula. The lithospheric mantle thinning is
mainly enforced by the simultaneous fitting of gravity,
elevation and geoid signatures. Thereby, the high
Bouguer anomaly values measured at the OMZ and
the SPZ demand a relative high-density crust that
must be compensated by a deeper density deficit to be
compatible with moderate topography and geoid
height values (Fig. 2). Further to the SW and close
to the Seine Abyssal Plain, the lithosphere thickens
again to values of 125 km coinciding with both the
continent–ocean transition and the Iberian–African
plate boundary.
7. Discussion
The most outstanding results obtained from the
present study are: (i) the thickening of the mid-crustal
layer affecting the Ossa Morena and South Portuguese
domains; (ii) the thinning of the mantle lithosphere
beneath these regions; and (iii) the lithospheric
structure across the Iberian–African plate boundary.
In the following, we will discuss the possible origin
and significance of these findings.
7.1. Mid-crust thickening in the Ossa Morena and
South Portuguese zones
Thickening of the mid-crust layer have been
reported by Gonzalez et al. (1998) from wide-angle
seismic data in the SW corner of the Iberian
Peninsula. According to these authors, there is a high
apparent velocity (6.4 km s�1) layer at shallow depths
(7–10 km) affecting the South Portuguese Zone,
which could be related to mafic and ultramafic rocks
of the Beja-Acebuches Ophiolitic Complex. Our
results, however, show that the thick mid-crust layer
extends further landwards into the Ossa Morena Zone

M. Fernandez et al. / Tectonophysics 386 (2004) 97–115110
and reaches a dnormalT thickness beneath the suture
between the OMZ and the CIZ. The coincidence
between the limit of the mid-crustal thickening and
the limit of the regional positive Bouguer anomaly
(Fig. 2b) suggests that thickening and hence mass
excess are related to the lithologies forming the South
Portuguese and Ossa Morena Zones. To test this
hypothesis, we calculated the gravity effect associated
with anomalous bodies representing the mid-crustal
thickening of the SPZ and the OMZ and the high
density rocks of the suture zone. The geometry and
density contrast of these bodies (Fig. 6) have been
estimated from seismic data (Gonzalez et al., 1998)
and from our model results (Fig. 5 and Table 1). Fig.
7 shows that the resulting Bouguer anomaly, after
removing the gravity effect of the abovementioned
bodies, lacks most of the anomalous positive signa-
ture and confirms that both the SPZ and the OMZ
have a distinct nature characterized by a denser upper/
middle crust. At this point, it is worth noting that our
analysis does not allow us to distinguish between an
effective mid-crustal thickening and the presence of a
denser body placed at upper/mid-crustal levels.
Evidence for processes that could have produced a
density increase at upper/mid-crustal levels is pro-
vided by recent magnetotelluric and deep seismic
reflection experiments. Magnetotelluric data show a
highly conductive layer at about 10 km depth
occupying most of the OMZ and part of the SPZ
which is attributed to pyritic graphite-rich lithologies
(Almeida et al., 2001). Similarly, deep seismic
Fig. 6. Sketch showing the 3D geometry used to calculate the gravity con
(light grey), and the Beja-Acebuches Ophiolitic Complex (dark grey). Li
seismic profiles by Gonzalez et al. (1998).
reflection data reveal a 1–2 s twtt thick highly
reflective layer located at 4–6 s twtt depth affecting
the Ossa Morena and part of the Centro Iberian zones
which is interpreted as a sill-like structure generated
by intrusion of mafic and ultramafic magmas
(Simancas et al., 2003). On top of this structure and
between 2 and 4 s twtt depth, a series of high-
amplitude east dipping reflections is observed (Car-
bonell et al., 2003). Nevertheless, the relationship
between high amplitude reflections, high reflectivity,
high conductivity and high density is still unclear.
7.2. The mantle lithosphere in the Variscan domain
As mentioned, to make the high gravity values in
the SPZ and OMZ compatible with a moderate
topography and a relative maximum in geoid height
requires a density excess at mid-crustal levels that
must be compensated by a deep-seated density
deficit. Therefore, the lithospheric mantle has been
thinned by raising the LAB between 20 and 25 km
(Fig. 4e). This result is a direct consequence of the
assumptions made in the numerical modelling. In
particular, we assumed that the lithospheric mantle is
homogeneous and that its density is only temper-
ature-dependent. If this assumption is correct, the
lithospheric mantle thinning is real and must be
interpreted as a transient thermal anomaly related to
a recent, probably post-Mesozoic, tectonothermal
event. However, the Variscan Iberian Massif has
remained stable since late Paleozoic times, which
tributions of the mid-crustal thickening affecting the SPZ and OMZ
ne #1 denotes the modelled lithospheric profile, and #2 and 3, the

Fig. 7. Bouguer gravity anomaly corrected by the 3D gravity contribution of the crustal bodies shown in Fig. 6. Note that the 0 mgal isoline is
now displaced towards the shoreline. Contour interval is 25 mgal.
M. Fernandez et al. / Tectonophysics 386 (2004) 97–115 111
suggest that lithospheric thinning is more likely
related to lateral effects of late Oligocene–middle
Miocene tectonothermal processes that occurred in
the Alboran-Gulf of Cadiz (e.g., Gutscher et al.,
2002; Calvert et al., 2000; Bijwaard and Spakman,
2000). The main problem with this interpretation is
the long distance to which the thermal effects related
to the geodynamics of the Iberian–African plate
boundary must propagate and the apparent correla-
tion with the OMZ–CIZ suture zone. An alternative
explanation is to consider that the lithospheric mantle
can contain lateral heterogeneities capable of pro-
ducing noticeable density variations. Such mantle
heterogeneity must be placed near the base of the
lithosphere to keep the density moment associated
with the geoid anomaly, and must account for a
density contrast of about 25 kg m�3, which is the
density change associated with a temperature varia-
tion of about 200 8C. With these constraints, a
plausible interpretation is to regard the LAB as a
roughly flat surface where the space associated with
the uplifted asthenosphere would now be occupied
by depleted lithospheric mantle with a density
similar to that of the asthenosphere (Fig. 8). The
subduction/obduction of the Rheic oceanic litho-
sphere and the further continental collision that
configured the SPZ and the OMZ could have led
to partial melting of the lithospheric mantle as
evidenced by the presence of mafic Carboniferous
magmatism. Melt extraction produces a long lived
density decrease in the residual mantle due to
depletion in basaltic components, which can amount
40 kg m�3 depending on the melt fraction (e.g.,
White and McKenzie, 1989; Oxburgh and Parment-
ier, 1977; Doin et al., 1996). This alternative
interpretation also supports the mafic/ultramafic
nature of the sill-like structure corresponding to the
observed highly reflective mid-crust band at the
OMZ, as proposed by Simancas et al. (2003).
7.3. Lithospheric structure across the Iberian–African
plate boundary
Plate reconstruction and magnetic anomaly studies
reveal that continental break-up of the African plate
occurred during the Late Jurassic (~156 Ma) whereas

Fig. 8. Comparison between two different lithospheric thermal structures along the modelled profile which assume that the SPZ and OMZ are
affected either by lithospheric thinning (upper panel) or by mantle depletion at the base of the lithosphere with a density contrast of �25 kg m�3
(lower panel).
M. Fernandez et al. / Tectonophysics 386 (2004) 97–115112
in the Iberian plate it occurred in Early Cretaceous
times (~118 Ma) (Srivastava et al., 1990). Today the
contact between the plates changes progressively
from a pure right-lateral strike-slip plate boundary
along the Gloria fault to a diffuse transpressive plate
boundary in the Gorringe Bank–Gibraltar region.
Our profile crosses the continental domain of the
southwestern Iberian margin and enters into the
northern Seine Abyssal Plane, which according to
Purdy (1975) corresponds to the oceanic domain of
the African plate. The obtained crustal structure
shows a major thinning beneath the easternmost
Horseshoe Abyssal Plane, a wide transition zone
around the Coral Patch Seamount, and a dnormalToceanic crust underlain by anomalous mantle in the
Seine Abyssal Plane. At deeper levels, the results
show a noticeable lithospheric thickening when the
profile passes from the complex and diffuse Gorringe
Bank–Gibraltar plate boundary region to the African
plate. A possible explanation for this thickening is
the age difference between the oceanic domains of
the African and the Iberian plates which would result
in a thermally thicker African lithospheric mantle.
This hypothesis implies that deformation associated
with transpression, which is evident at crustal levels
(e.g., Torelli et al., 1997; Sartori et al., 1994), did not
substantially affect deep lithospheric levels. Con-
versely, lithospheric thickening could be entirely
attributed to tectonic deformation if we consider that
oceanic lithosphere older than 120 My is very close
to thermal equilibrium as proposed by lithospheric
plate models (e.g., Parsons and Sclater, 1977). Two
reasons make us give more support to the second
hypothesis. Firstly, the lack of noticeable differences
in bathymetry and geoid height across the Gloria
transform plate boundary, where differences in plate
thickness should be even more conspicuous. Sec-
ondly, the occurrence of intermediate depth seismic-
ity in the transpressive Gorringe Bank–Gibraltar
region (Fig. 4e), which strongly suggests that

M. Fernandez et al. / Tectonophysics 386 (2004) 97–115 113
tectonic deformation is affecting lithospheric levels
to depths of 80–100 km.
Acknowledgements
We are indebted to A. Perez-Estaun and R.
Carbonell for their helpful comments and suggestions
on the structure and geological evolution of the
Iberian Variscan Belt. A. Gonzalez and an anonymous
reviewer are also thanked for their constructive
comments. Data acquisition and processing of the
IAM project were funded by EU project JOU2-CT92-
0177. This work has been supported by Spanish
research agencies through projects PB94-0013,
MAR98-0962, and REN2001-3868-C03-02/MAR,
and NATO Grant EST.CLG.978922.
References
Abalos, B., Gil Ibarguchi, J.I., Eguiluz, L., 1991. Cadomian
subduction/collision and Variscan transpression in the Bada-
joz-Cordoba shear belt, southwest Spain. Tectonophysics 199,
51–72.
Abalos, B., Gil Ibarguchi, J.I., Eguiluz, L., 1993. A reply to
bCadomian subduction/collision and Variscan transpression in
the Badajoz-Cordoba shear belt, southwest SpainQ. A discussion
on the age of the main tectonometamorphic events. Tectono-
physics 217, 347–353.
Almeida, E., Pous, J., Monteiro Santos, F., Fonseca, P., Marcuello,
A., Queralt, P., Nolasco, R., Mendes-Victor, L., 2001. Electro-
magnetic imaging of a transpressional tectonics in SW Iberia.
Geophysical Research Letters 28, 439–442.
Ayala, C., Torne, M., Pous, J., 2003. The lithosphere–asthenosphere
boundary in the western Mediterranean from 3D joint gravity
and geoid modeling: tectonic implications. Earth and Planetary
Science Letters 209, 275–290.
Azor, A., Gonzalez, A., Lodeiro, F., Simancas, J.F., 1994. Tectonic
evolution of the boundary between the Central Iberian and the
Ossa-Morena zones (Variscan belt, southwest Spain). Tectonics
13, 45–61.
Banda, E., 1988. Crustal parameters in the Iberian Peninsula.
Physics of the Earth and Planetary Interiors 51, 222–225.
Banda, E., Torne, M., Iberian Atlantic Margins Group, 1995. Iberian
Atlantic Margins Group investigates deep structure of ocean
margins. Eos Trans. AGU, 25.
Barton, P.J., 1986. The relationship between seismic velocity and
density in the continental crust: a useful constraint? Geophysical
Journal of the Royal Astronomical Society 87, 195–208.
Bijwaard, H., Spakman, W., 2000. Non-linear global P-wave
tomography by iterated linearized inversion. Geophysical
Journal International 141, 71–82.
Burg, J.P., Iglesias, M., Laurent, P., Ribeiro, A., 1981. Variscan
intracontinental deformation: the Coimbra-Cordoba shear zone
(SW Iberian Peninsula). Tectonophysics 78, 161–177.
Calvert, A., Sandvol, E., Seber, D., Barazangi, M., Roecker, S.,
Mourabit, T., Vidal, F., Alguacil, G., Jabour, N., 2000.
Geodynamic evolution of the lithosphere and upper mantle
beneath the Alboran region of the Western Mediterranean:
constraints from travel time tomography. Journal of Geophysical
Research 105, 10871–10898.
Carbonell, R., Simancas, F., Pous, J., Juhlin, C., Kashubin, A.,
Ayarza, P., Gonzalez-Lodeiro, F., the IBERSEIS Working group,
2003. Coincident magnetotelluric and deep seismic reflection
sounding of a transpressive orogen: SW-Iberia. Deep Seismic
Profiling of the Continents and their Margins, SEISMIX-2003.
Institute of Geological & Nuclear Sciences Ltd., Taupo, New
Zealand, p. 52.
Christensen, N.I., Shaw, G.H., 1970. Elasticity of mafic rocks from
the Mid Atlantic Ridge. Geophysical Journal of the Royal
Astronomical Society 20, 271–285.
Dean, S.M., Minshull, T.A., Whitmarsh, R.B., Louden, K.E., 2000.
Deep structure of the ocean–continent transition in the southern
Iberia Abyssal Plain from seismic refraction profiles: the IAM-9
transect at 40820VN. Journal of Geophysical Research 105,
5859–5886.
Doin, M.P., Fleitout, L., McKenzie, D., 1996. Geoid anomalies and
the structure of continental and oceanic lithospheres. Journal of
Geophysical Research 101, 16119–16135.
Fernandez, M., Marzan, I., Correia, A., Ramalho, E., 1998. Heat
flow, heat production, and lithospheric thermal regime in the
Iberian Peninsula. Tectonophysics 291, 29–53.
Fernandez, M., Torne, M., Garcia-Castellanos, D., Verges, J.,
Wheeler, W., Karpuz, R., 2004. Deep structure of the Voring
margin: the transition from a continental shield to a young
oceanic lithosphere. Earth and Planetary Science Letters 221,
131–144.
Fernandez-Viejo, G., Gallart, J., Pulgar, J.A., Cordoba, D.,
Danobeitia, J.J., 2000. Seismic signature of Variscan and Alpine
tectonics in NW Iberia: crustal structure of the Cantabrian
Mountains and Duero basin. Journal of Geophysical Research
105 (B2), 3001–3018.
Gonzalez, A., Torne, M., Cordoba, D., Vidal, N., Matias, L.M.,
Diaz, J., 1996. Crustal thinning in the southwestern Iberia
margin. Geophysical Research Letters 23, 2477–2480.
Gonzalez, A., Cordoba, D., Vegas, R., Matias, L.M., 1998. Seismic
crustal structure in the southwest of the Iberian Peninsula and
the Gulf of Cadiz. Tectonophysics 296, 317–331.
Grimison, N., Chen, W., 1986. The Azores–Gibraltar plate
boundary: focal mechanisms, depths of earthquakes, and their
tectonic implications. Journal of Geophysical Research 91,
2029–2047.
Gutscher, M.-A., Malod, J., Rehault, J.P., Contrucci, I.,
Klingelhoefer, F., Mendes-Victor, L., Spakman, W., 2002.
Evidence for active subduction beneath Gibraltar. Geology 30,
1071–1074.
ILIHA DSS Group, 1993. A deep seismic sounding investigation of
lithospheric heterogeneity and anisotropy beneath the Iberian
Peninsula. Tectonophysics 221, 35–51.

M. Fernandez et al. / Tectonophysics 386 (2004) 97–115114
Jimenez-Munt, I., Bird, P., Fernandez, M., 2001. Thin-shell
modeling of neotectonics in the Azores–Gibraltar region.
Geophysical Research Letters 28, 1083–1086.
Jimenez-Munt, I., Fernandez, M., Torne, M., Bird, P., 2001. The
transition from linear to diffuse plate boundary in the Azores–
Gibraltar region: results from a thin sheet model. Earth and
Planetary Science Letters 192, 175–189.
Julivert, M., Fontbote, J.M., Ribeiro, A., Conde, L., 1974. Mapa
tectonico de la Penınsula Iberica y Baleares. Instituto Geologico
y Minero de Espana, Madrid. 113 pp.
Klitgord, K.D., Schouten, H., 1986. Plate kinematics of the central
Atlantic. In: Vogt, P.R., Tucholke, B.E. (Eds.), The Geology of
North America. The Western North Atlantic Region. Geological
Society of America Bulletin. Geological Society of America,
Boulder, CO, pp. 351–378.
Lachenbruch, A.H., Morgan, P., 1990. Continental extension,
magmatism and elevation; formal relations and rules of thumb.
Tectonophysics 174, 39–62.
Lemoine, F.G., Kenyon, S.C., Factor, J.K., Trimmer, R.G., Pavlis,
N.K., Chinn, D.S., Cox, C.M., Klosko, S.M., Luthcke, S.B.,
Torrence, M.H., Wang, Y.M., Williamson, R.G., Pavlis, E.C.,
Rapp, R.H., Olson, T.R., 1998. The Development of the Joint
NASA GSFC and NIMA Geopotential Model EGM96. NASA/
TP-1998-206861. NASA Goddard Space Flight Center, Green-
belt, Maryland.
Lonergan, L., White, N., 1997. Origin of the Betic–Rif mountain
belt. Tectonics 16, 504–522.
Ludwig, J.W., Nafe, J.E., Drake, C.L., 1970. Seismic refraction. In:
Maxwell, A.E. (Ed.), The Sea. Wiley-Intersciences, New York,
pp. 53–84.
Malod, J.A., Mauffret, A., 1990. Iberian plate motion during the
Mesozoic. Tectonophysics 184, 261–278.
Matias, L., 1996. A Sismologia Experimental na Modelacao da
Estrutura da Crusta em Portugal Continental. Universidade de
Lisboa, Lisboa. 397 pp.
Matte, P., 1983. Two geotraverses across the Ibero-Armorican
Variscan arc of western Europe. In: Rast, N., Delany, F. (Eds.),
Profiles of Orogenic Belts, Geodynamic Series. American
Geophysical Union, Boulder, pp. 53–81.
Mezcua, J., Rueda, J., 1997. Seismological evidence for a
delamination process in the lithosphere under the Alboran
Sea. Geophysical Journal International 129, F1–F8.
Mezcua, J., Gil, A., Benarroch, R., 1996. Estudio Gravimetrico de la
Penınsula Iberica y Baleares. Instituto Geografico Nacional,
Madrid. 14 pp.
Mitjavila, J., Martı, J., Soriano, C., 1997. Magmatic evolution and
tectonic setting of the Pyrite Belt Volcanism. Journal of
Petrology 38, 727–755.
Moreno-Garrido, M.C., Vera, J.A., 1985. El Culm al sur del
anticlinorio de Puebla de Guzman (Huelva Espana). Boletin
Geologico y Minero de Espana XCVI-II, 141–151.
Mueller, S., Prodehl, C., Mendes, A.S., Sousa-Moreira, V., 1973.
Crustal structure in the southern part of the Iberian Peninsula.
Tectonophysics 20, 307–318.
Negredo, A.M., Bird, P., Sanz de Galdeano, C., Buforn, E., 2002.
Neotectonic modeling of the Ibero-Maghrebian region. Journal
of Geophysical Research 107, 2292.
Oxburgh, E.R., Parmentier, E.M., 1977. Compositional and density
stratification in oceanic lithosphere—causes and consequences.
Journal of the Geological Society (London) 133, 343–355.
Palmer, A.R., Geissman, J., 1999. GSA Geologic Time Scale.
The Geological Society of America, Boulder, CO. http://
www.geosociety.org/science/timescale/timescl.htm.
Parsons, B., Sclater, J.G., 1977. An analysis of the variations of
ocean floor bathymetry and heat flow with age. Journal of
Geophysical Research 82, 803–827.
Pulgar, J.A., Gallart, J., Fernandez-Viejo, G., Perez-Estaun, A.,
ESCIN Group, 1996. Seismic image of the Cantabrian
Mountains in the western extension of the Pyrenees from
integrated ESCIN reflection and refraction data. Tectonophysics
264, 1–19.
Purdy, G.M., 1975. The eastern end of the Azores–Gibraltar plate
boundary. Geophysical Journal of the Royal Astronomical
Society 43, 973–1000.
Quesada, C., 1991. Geological constraints on the Paleozoic tectonic
evolution of tectonostratigraphic terranes in the Iberian Massif.
Tectonophysics 185, 225–245.
Ribeiro, A., Quesada, C., Dallmeyer, R.D., 1990. Geodynamic
evolution of the Iberian Massif. In: Dallmeyer, R.D., Martinez
Garcia, E. (Eds.), Pre-Mesozoic Geology of the Iberian
Peninsula. Springer-Verlag, Berlin, pp. 399–409.
Royden, L., 1993. Evolution of retreating subduction boundaries
formed during continental collision. Tectonics 12, 629–638.
Rybach, L., Cermak, V., 1982. Radioactive heat generation in rocks.
In: Angenheistes, G. (Ed.), Numerical Data and Functional
Relationships in Science and Technology, New Ser., Group V.
Springer-Verlag, Berlin, pp. 353–371.
Sartori, R., Torelli, L., Zitellini, N., Peis, D., Lodolo, E., 1994.
Eastern segment of the Azores–Gibraltar line (central–eastern
Atlantic): an oceanic plate boundary with diffuse compressional
deformation. Geology 22, 555–558.
Seber, D., Barazangi, M., Ibenbrahim, A., Demnati, A., 1996.
Geophysical evidence for lithospheric delamination beneath the
Alboran Sea and Rif–Betic mountains. Nature 379, 785–790.
Simancas, J.F., Martınez Poyatos, D., Exposito, I., Azor, A.,
Gonzalez Lodeiro, F., 2001. The structure of a major suture
zone in the SW Iberian Massif: the Ossa-Morena/Central Iberian
contact. Tectonophysics 332, 295–308.
Simancas, J.F., Carbonell, R., Gonzalez-Lodeiro, F., Perez-Estaun,
A., Juhlin, C., Ayarza, P., Kashubin, A., Azor, A., Martınez
Poyatos, D., Almodovar, G.R., Pascual, E., Saez, R., Exposito,
I., 2003. Crustal structure of the transpressional Variscan orogen
of SW Iberia: SW Iberia deep seismic reflection profile
(IBERSEIS). Tectonics 22, 1062.
Souriau, A., 1984. Geoid anomalies over Gorringe Ridge,
North Atlantic Ocean. Earth and Planetary Science Letters 68,
101–114.
Srivastava, S.P., Roest, W.R., Kovacs, L.C., Oakey, G., Levesque,
S., Verhoef, J., Macnab, R., 1990. Motion of Iberia since the
Late Jurassic: results from detailed aeromagnetic measurements
in the Newfoundland Basin. Tectonophysics 184, 229–260.
Surinach, E., Vegas, R., 1988. Lateral inhomogeneities of the
Hercynian crust in central Spain. Physics of the Earth and
Planetary Interiors 51, 226–234.

M. Fernandez et al. / Tectonophysics 386 (2004) 97–115 115
Talwani, M., Worzel, J.L., Landisman, L., 1959. Rapid computa-
tions for two-dimensional bodies with application to the
Mendocino submarine fracture zone. Journal of Geophysical
Research 64, 49–59.
Torelli, L., Sartori, R., Zitellini, N., 1997. The giant chaotic body in
the Atlantic Ocean off Gibraltar: new results from a deep seismic
reflection survey. Marine and Petroleum Geology 14, 125–138.
Torne, M., Fernandez, M., Carbonell, J., Banda, E., 1995. Litho-
spheric transition from continental to oceanic in the West Iberia
Atlantic Margin. In: Banda, E., Torne, M., Talwani, M. (Eds.),
Rifted Ocean–Continent Boundaries. Kluwer Academic Pub-
lishing, Dordrecht, pp. 247–263.
Tortella, D., Torne, M., Perez-Estaun, A., 1997. Geodynamic
evolution of the Eastern segment of the Azores–Gibraltar Zone:
the Gorringe Bank and the Gulf of Cadiz Region. Marine
Geophysical Researches 19, 211–230.
Verzhbitsky, E.V., Zolotarev, V.G., 1989. Heat flow and the
Eurasian–African plate boundary in the eastern part of the
Azores–Gibraltar fracture zone. Journal of Geodynamics 11,
267–273.
White, R.S., McKenzie, D., 1989. Magmatism at rift zones: the
generation of volcanic continental margins and flood basalts.
Journal of Geophysical Research 94, 7685–7729.
Zelt, C.A., Ellis, R.M., 1989. Seismic structure of the crust and
upper mantle in the Peace River Arch Region, Canada. Journal
of Geophysical Research 94, 5729–5744.
Zeyen, H., Fernandez, M., 1994. Integrated lithospheric modeling
combining thermal, gravity, and local isostasy analysis: appli-
cation to the NE Spanish Geotransect. Journal of Geophysical
Research 99, 18089–18102.