Embed Size (px)
Citation preview
www.elsevier.com/locate/jafrearsci
Journal of African Earth Sciences 44 (2006) 196–202
Lithological mapping in the Eastern Desert of Egypt, theBarramiya area, using Landsat thematic mapper (TM)
Sabreen Gad *, Timothy Kusky
Department of Earth and Atmospheric Sciences, Saint Louis University, 3507 Laclede Ave., Saint Louis, MO 63103, United States
Received 1 October 2004; received in revised form 29 June 2005; accepted 7 October 2005Available online 3 January 2006
Abstract
The Barramiya area, Central Eastern Desert, Egypt, comprises a variety of Late Proterozoic rocks including serpentinites, island-arcassemblage of metasediments and metavolcanics, and syntectonic granitoids. Lithological mapping in the Barramiya area is carried outby using Landsat thematic mapper (TM) image enhancement techniques, including RGB band ratio and supervised classification images.The significant spectral characteristics of serpentinites have been used previously by other authors to map these rocks using differentband ratio images. In the current study, band ratio images (5/3, 5/1, 7/5), and (7/5, 5/4, 3/1) together with supervised classification tech-niques are used and proved effective for lithological mapping of the serpentinite rocks. Integrating previous knowledge lithological map-ping studies of the study area and our visual interpretations of the different enhanced Landsat images, we mapped, in detail, thedistribution of the Pan-African serpentinites in the Barramiya area.� 2005 Elsevier Ltd. All rights reserved.
Keywords: Landsat TM; Band ratio images; Supervised classification; Egypt; Late Proterozoic
1. Introduction
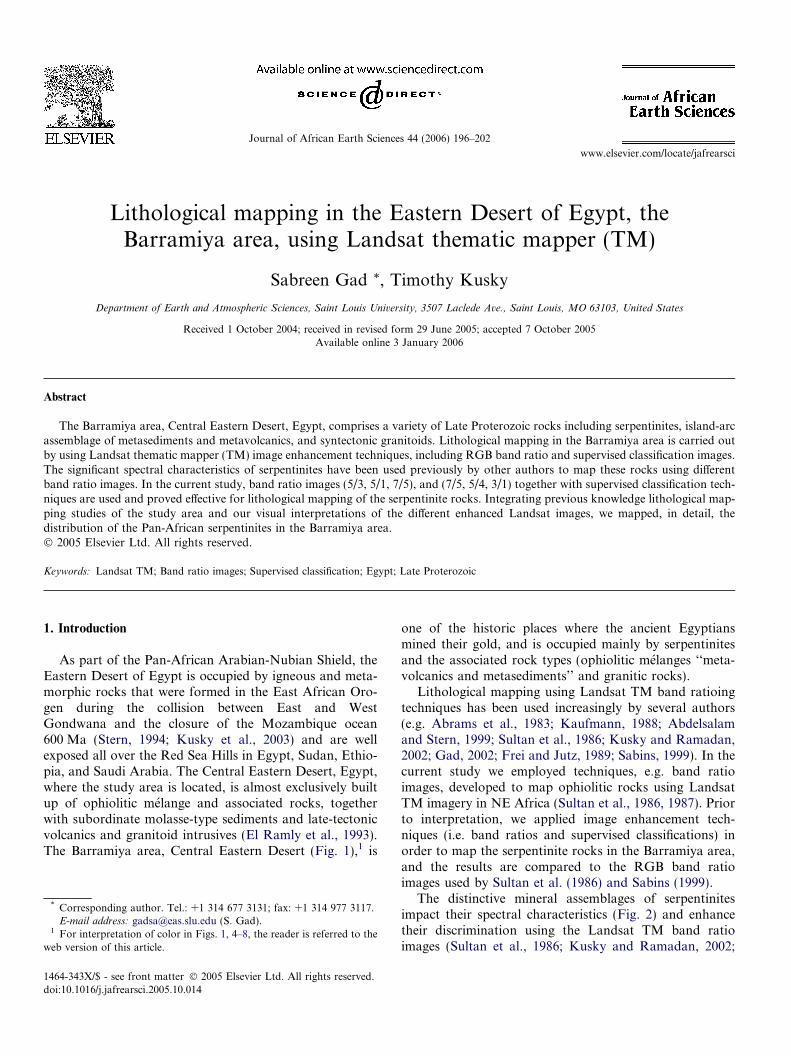
As part of the Pan-African Arabian-Nubian Shield, theEastern Desert of Egypt is occupied by igneous and meta-morphic rocks that were formed in the East African Oro-gen during the collision between East and WestGondwana and the closure of the Mozambique ocean600 Ma (Stern, 1994; Kusky et al., 2003) and are wellexposed all over the Red Sea Hills in Egypt, Sudan, Ethio-pia, and Saudi Arabia. The Central Eastern Desert, Egypt,where the study area is located, is almost exclusively builtup of ophiolitic melange and associated rocks, togetherwith subordinate molasse-type sediments and late-tectonicvolcanics and granitoid intrusives (El Ramly et al., 1993).The Barramiya area, Central Eastern Desert (Fig. 1),1 is
1464-343X/$ - see front matter � 2005 Elsevier Ltd. All rights reserved.
doi:10.1016/j.jafrearsci.2005.10.014
* Corresponding author. Tel.: +1 314 677 3131; fax: +1 314 977 3117.E-mail address: [email protected] (S. Gad).
1 For interpretation of color in Figs. 1, 4–8, the reader is referred to theweb version of this article.
one of the historic places where the ancient Egyptiansmined their gold, and is occupied mainly by serpentinitesand the associated rock types (ophiolitic melanges ‘‘meta-volcanics and metasediments’’ and granitic rocks).
Lithological mapping using Landsat TM band ratioingtechniques has been used increasingly by several authors(e.g. Abrams et al., 1983; Kaufmann, 1988; Abdelsalamand Stern, 1999; Sultan et al., 1986; Kusky and Ramadan,2002; Gad, 2002; Frei and Jutz, 1989; Sabins, 1999). In thecurrent study we employed techniques, e.g. band ratioimages, developed to map ophiolitic rocks using LandsatTM imagery in NE Africa (Sultan et al., 1986, 1987). Priorto interpretation, we applied image enhancement tech-niques (i.e. band ratios and supervised classifications) inorder to map the serpentinite rocks in the Barramiya area,and the results are compared to the RGB band ratioimages used by Sultan et al. (1986) and Sabins (1999).
The distinctive mineral assemblages of serpentinitesimpact their spectral characteristics (Fig. 2) and enhancetheir discrimination using the Landsat TM band ratioimages (Sultan et al., 1986; Kusky and Ramadan, 2002;
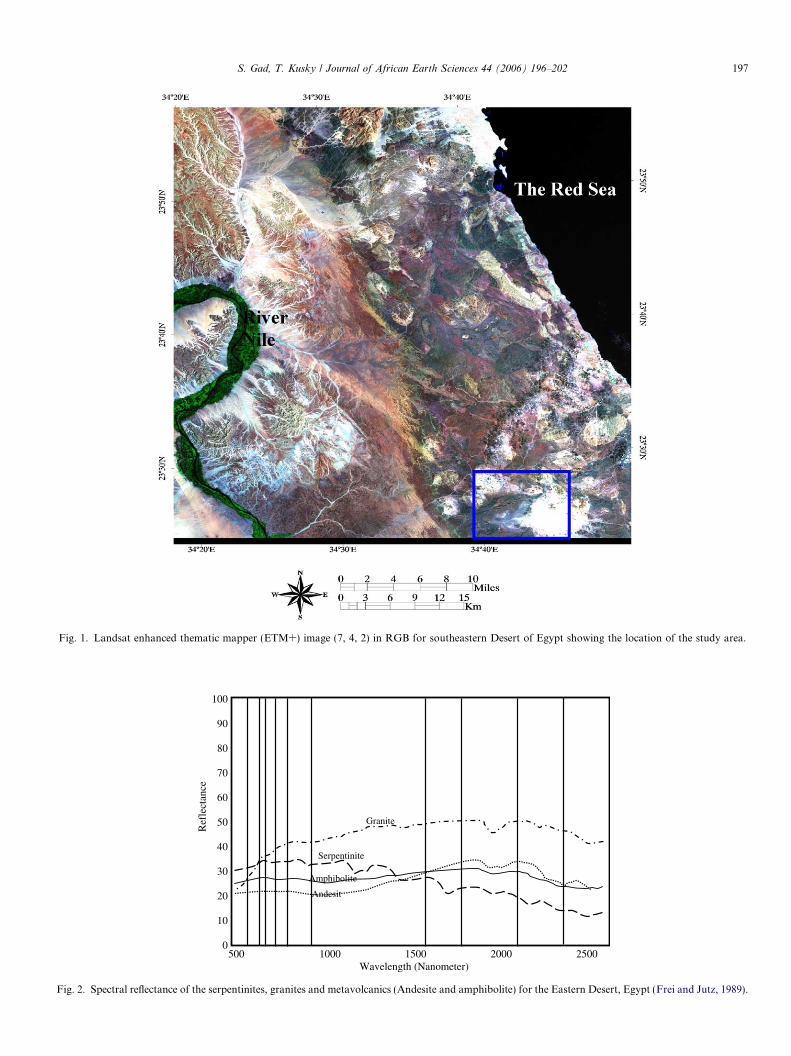
Fig. 1. Landsat enhanced thematic mapper (ETM+) image (7, 4, 2) in RGB for southeastern Desert of Egypt showing the location of the study area.
Granite
Serpentinite
Andesit
Amphibolite
100
90
80
70
60
50
40
30
20
10
0500 1000 1500 2000 2500
Wavelength (Nanometer)
Ref
lect
ance
Fig. 2. Spectral reflectance of the serpentinites, granites and metavolcanics (Andesite and amphibolite) for the Eastern Desert, Egypt (Frei and Jutz, 1989).
S. Gad, T. Kusky / Journal of African Earth Sciences 44 (2006) 196–202 197
198 S. Gad, T. Kusky / Journal of African Earth Sciences 44 (2006) 196–202
Frei and Jutz, 1989). This situation has also been illustratedby the case study of mapping Oman Ophiolites (Abramset al., 1988).
2. Geologic setting
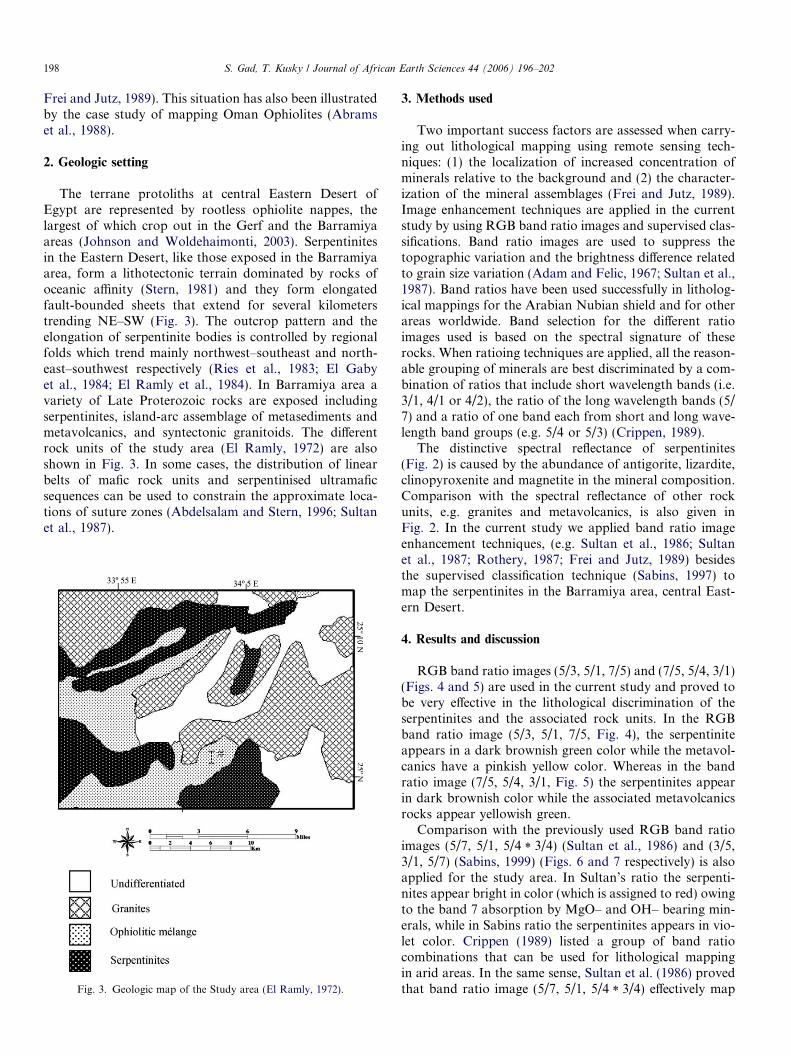
The terrane protoliths at central Eastern Desert ofEgypt are represented by rootless ophiolite nappes, thelargest of which crop out in the Gerf and the Barramiyaareas (Johnson and Woldehaimonti, 2003). Serpentinitesin the Eastern Desert, like those exposed in the Barramiyaarea, form a lithotectonic terrain dominated by rocks ofoceanic affinity (Stern, 1981) and they form elongatedfault-bounded sheets that extend for several kilometerstrending NE–SW (Fig. 3). The outcrop pattern and theelongation of serpentinite bodies is controlled by regionalfolds which trend mainly northwest–southeast and north-east–southwest respectively (Ries et al., 1983; El Gabyet al., 1984; El Ramly et al., 1984). In Barramiya area avariety of Late Proterozoic rocks are exposed includingserpentinites, island-arc assemblage of metasediments andmetavolcanics, and syntectonic granitoids. The differentrock units of the study area (El Ramly, 1972) are alsoshown in Fig. 3. In some cases, the distribution of linearbelts of mafic rock units and serpentinised ultramaficsequences can be used to constrain the approximate loca-tions of suture zones (Abdelsalam and Stern, 1996; Sultanet al., 1987).
Fig. 3. Geologic map of the Study area (El Ramly, 1972).
3. Methods used
Two important success factors are assessed when carry-ing out lithological mapping using remote sensing tech-niques: (1) the localization of increased concentration ofminerals relative to the background and (2) the character-ization of the mineral assemblages (Frei and Jutz, 1989).Image enhancement techniques are applied in the currentstudy by using RGB band ratio images and supervised clas-sifications. Band ratio images are used to suppress thetopographic variation and the brightness difference relatedto grain size variation (Adam and Felic, 1967; Sultan et al.,1987). Band ratios have been used successfully in litholog-ical mappings for the Arabian Nubian shield and for otherareas worldwide. Band selection for the different ratioimages used is based on the spectral signature of theserocks. When ratioing techniques are applied, all the reason-able grouping of minerals are best discriminated by a com-bination of ratios that include short wavelength bands (i.e.3/1, 4/1 or 4/2), the ratio of the long wavelength bands (5/7) and a ratio of one band each from short and long wave-length band groups (e.g. 5/4 or 5/3) (Crippen, 1989).
The distinctive spectral reflectance of serpentinites(Fig. 2) is caused by the abundance of antigorite, lizardite,clinopyroxenite and magnetite in the mineral composition.Comparison with the spectral reflectance of other rockunits, e.g. granites and metavolcanics, is also given inFig. 2. In the current study we applied band ratio imageenhancement techniques, (e.g. Sultan et al., 1986; Sultanet al., 1987; Rothery, 1987; Frei and Jutz, 1989) besidesthe supervised classification technique (Sabins, 1997) tomap the serpentinites in the Barramiya area, central East-ern Desert.
4. Results and discussion
RGB band ratio images (5/3, 5/1, 7/5) and (7/5, 5/4, 3/1)(Figs. 4 and 5) are used in the current study and proved tobe very effective in the lithological discrimination of theserpentinites and the associated rock units. In the RGBband ratio image (5/3, 5/1, 7/5, Fig. 4), the serpentiniteappears in a dark brownish green color while the metavol-canics have a pinkish yellow color. Whereas in the bandratio image (7/5, 5/4, 3/1, Fig. 5) the serpentinites appearin dark brownish color while the associated metavolcanicsrocks appear yellowish green.
Comparison with the previously used RGB band ratioimages (5/7, 5/1, 5/4 * 3/4) (Sultan et al., 1986) and (3/5,3/1, 5/7) (Sabins, 1999) (Figs. 6 and 7 respectively) is alsoapplied for the study area. In Sultan’s ratio the serpenti-nites appear bright in color (which is assigned to red) owingto the band 7 absorption by MgO– and OH– bearing min-erals, while in Sabins ratio the serpentinites appears in vio-let color. Crippen (1989) listed a group of band ratiocombinations that can be used for lithological mappingin arid areas. In the same sense, Sultan et al. (1986) provedthat band ratio image (5/7, 5/1, 5/4 * 3/4) effectively map

Fig. 4. Landsat TM RGB band ratio color image (5/3, 5/1, 7/5) for the study area. Serp: serpentinites and MV: metavolcanics.
Fig. 5. Landsat TM RGB band ratio image (7/5, 5/4, 3/1) for the study area.
S. Gad, T. Kusky / Journal of African Earth Sciences 44 (2006) 196–202 199

Fig. 6. Landsat TM RGB band ratio image (5/7, 5/1, 5/4 * 4/3, Sultan et al., 1986) for the study area. The serpentinite rocks (red color) are distinguishedfrom metavolcanic rocks (pale green). For interpretation of color, the reader is referred to the web version of this figure.
Fig. 7. Landsat TM RGB band ratio image (3/5, 3/1, 5/7, Sabins, 1999).
200 S. Gad, T. Kusky / Journal of African Earth Sciences 44 (2006) 196–202
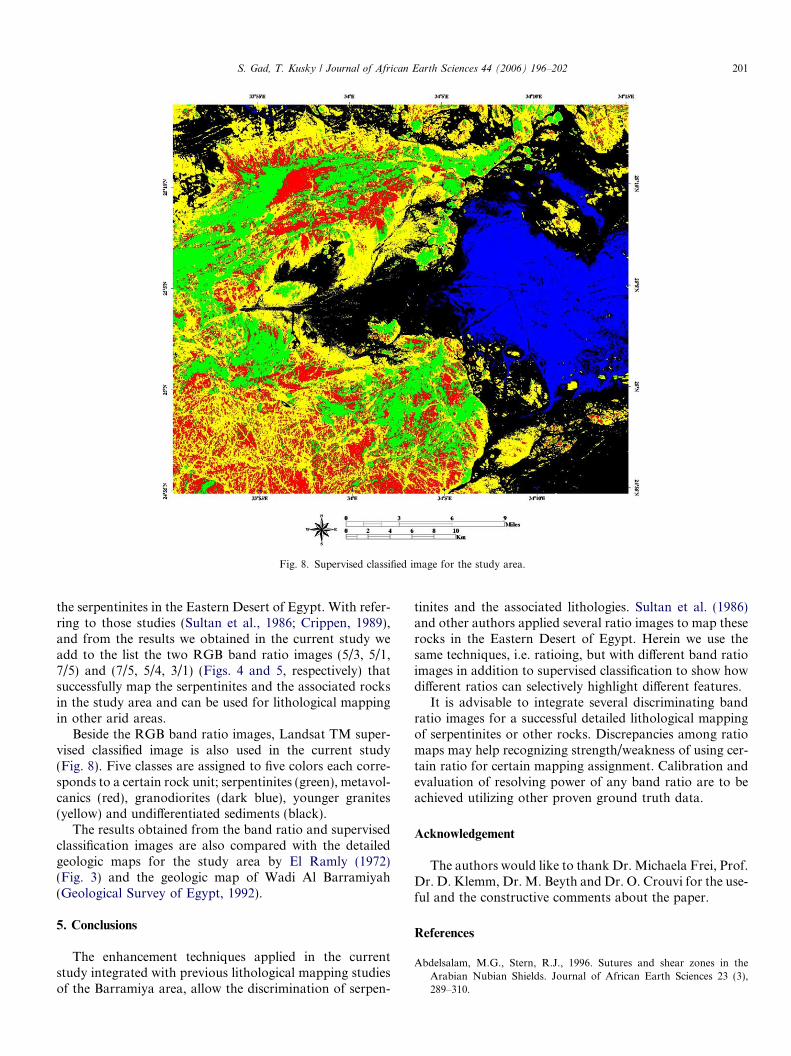
Fig. 8. Supervised classified image for the study area.
S. Gad, T. Kusky / Journal of African Earth Sciences 44 (2006) 196–202 201
the serpentinites in the Eastern Desert of Egypt. With refer-ring to those studies (Sultan et al., 1986; Crippen, 1989),and from the results we obtained in the current study weadd to the list the two RGB band ratio images (5/3, 5/1,7/5) and (7/5, 5/4, 3/1) (Figs. 4 and 5, respectively) thatsuccessfully map the serpentinites and the associated rocksin the study area and can be used for lithological mappingin other arid areas.
Beside the RGB band ratio images, Landsat TM super-vised classified image is also used in the current study(Fig. 8). Five classes are assigned to five colors each corre-sponds to a certain rock unit; serpentinites (green), metavol-canics (red), granodiorites (dark blue), younger granites(yellow) and undifferentiated sediments (black).
The results obtained from the band ratio and supervisedclassification images are also compared with the detailedgeologic maps for the study area by El Ramly (1972)(Fig. 3) and the geologic map of Wadi Al Barramiyah(Geological Survey of Egypt, 1992).
5. Conclusions
The enhancement techniques applied in the currentstudy integrated with previous lithological mapping studiesof the Barramiya area, allow the discrimination of serpen-
tinites and the associated lithologies. Sultan et al. (1986)and other authors applied several ratio images to map theserocks in the Eastern Desert of Egypt. Herein we use thesame techniques, i.e. ratioing, but with different band ratioimages in addition to supervised classification to show howdifferent ratios can selectively highlight different features.
It is advisable to integrate several discriminating bandratio images for a successful detailed lithological mappingof serpentinites or other rocks. Discrepancies among ratiomaps may help recognizing strength/weakness of using cer-tain ratio for certain mapping assignment. Calibration andevaluation of resolving power of any band ratio are to beachieved utilizing other proven ground truth data.
Acknowledgement
The authors would like to thank Dr. Michaela Frei, Prof.Dr. D. Klemm, Dr. M. Beyth and Dr. O. Crouvi for the use-ful and the constructive comments about the paper.
References
Abdelsalam, M.G., Stern, R.J., 1996. Sutures and shear zones in theArabian Nubian Shields. Journal of African Earth Sciences 23 (3),289–310.
202 S. Gad, T. Kusky / Journal of African Earth Sciences 44 (2006) 196–202
Abdelsalam, M.G., Stern, R.J., 1999. Mineral exploration with satelliteremote sensing imagery: examples from Neoproterozoic Arabianshield. Journal of African Earth Sciences 28, 4a.
Abrams, M.J., Brown, D., Lepley, L., Sadowski, R., 1983. Remote sensingfor porphyry copper deposits in southern Arizona. Economic Geology78, 591–604.
Abrams, M.J., Rothery, D.A., Pontual, A., 1988. Mapping in the OmanOphiolite using enhanced Landsat Thematic Mapper images. Tec-tonophysics 151, 387–401.
Adam, J.B., Felic, A.L., 1967. Spectral reflectance 0.4–2.0 micron ofsilicate rock powders. Journal of Geophysical Research 72, 5705–5715.
Crippen, R.E., 1989. Selection of Landsat TM band and band-ratiocombinations to maximize lithologic information in color compositedisplays. In: Proceedings of the Seventh Thematic Conference onRemote Sensing for Exploration Geology II, pp. 912–921.
El Gaby, S., El Nady, O., Khudeir, A., 1984. Tectonic evolution of thebasement complex in the Central Eastern Desert of Egypt. GeologischeRundschau 73, 1019–1036.
El Ramly, M.F., 1972. A new geologic map of the Eastern and South-Western Deserts of Egypt. Scale 1:1000.000. Annals Geological Surveyof Egypt 12, 1–18.
El Ramly, M.F., Greiling, R.O., Rashwan, A.A., Rasmy, A.H., 1993.Geologic map of Wadi Hafifit area. Scale 1:100.000. EgyptianGeological Survey, 68.
El Ramly, M.F., Greiling, R., Kroner, A., Rashwan, A.A., 1984. On thetectonic evolution of the Wadi Hafafit area and environs, EasternDesert of Egypt. Bulletin of King Abdelaziz University 6, 113–126.
Frei, M., Jutz, S.L., 1989. Use of Thematic Mapper data for the detectionof gold bearing formations in the eastern Desert of Egypt. In:Proceedings of the 7th thematic conference on remote sensing for oreexploration geology II, pp. 1157–1172.
Gad, S., 2002. Exploration for mineralized granites in Central EasternDesert, Egypt, M.Sc. Thesis, Faculty of Science, Aswan, South ValleyUniversity, Egypt, 118pp.
Geological Survey of Egypt, 1992. Geological map of Wadi Al Barram-iyah Quadrangle, Egypt, Scale 1:250.000.
Johnson, P., Woldehaimonti, B., 2003. Development of the Arabianshield: perspective on accretion and deformation in the northern East
African Orogen and the assembly of Gondwana. In: Yoshida, M.,Windely, B.F., Dasgupta, S. (Eds.), Proterozoic East Gondwana,supercontinent assembly and breakup, 206. Geological Soc., London,pp. 289–325 (Special publication).
Kaufmann, H., 1988. Mineral exploration along the Aqaba—Leventstructure by use of Landsat TM data; concepts, processing, and results.International Journal of Remote Sensing 9, 1639–1658.
Kusky, T.M., Ramadan, T.M, 2002. Structural controls in the Neopro-terozoic Allaqi suture: an integrated field, Landsat TM, and radar C/XSIR SAR images. Journal of African Earth Sciences 35, 107–121.
Kusky, T.M., Abdelsalam, M.G., Tucker, R.D., Stern, R.J., 2003.Evolution of the East African and related Orogens, and the assemblyof Gondwana. Precambrian Research 123 (2–4), 81–337.
Ries, A.C., Shackleton, R.M., Graham, R.H., Fitches, W.R., 1983. Pan-African structures, ophiolites and melanges in the Eastern Desert ofEgypt: a traverse at 26�N. Geological Society of London journal 140,75–95.
Rothery, D.A., 1987. Improved discrimination of rock units using LandsatThematic mapper imagery of the Oman Ophiolite. Journal of theGeological Society, London 144, 587–597.
Sabins, F., 1997. Remote Sensing: Principles and Interpretation, third ed.,494pp.
Sabins, F.F., 1999. Remote sensing for mineral exploration. Ore GeologyReviews 14, 157–183.
Stern, R.J., 1981. Petrogenesis and tectonic setting of Late Precambrianensimatic volcanic rocks, Eastern Desert of Egypt. PrecambrianResearch 16, 195–230.
Stern, R.J., 1994. Arc Assembly and continental collision in theNeoproterozoic East African Orogen: implications for consolidationof Gondwanaland. Annual Review Earth Planetary Science 22, 319–351.
Sultan, M., Arvidson, R.E., Sturchio, N.C., 1986. Mapping of serpenti-nites in the Eastern Desert of Egypt using Landsat Thematic Mapperdata. Geology 14, 995–999.
Sultan, M., Arvidson, R.E., Sturchio, N.C., Guinnes, E.A., 1987.Lithologic mapping in arid regions with Landsat TM data: Meatiqdome, Egypt. Geological Society of America Bulletin 99, 748–762.