Embed Size (px)
Citation preview

LITERATURE REVIEW OF EMPLOYMENT IMPACT STUDIES OF POWER GENERATION TECHNOLOGIES
September 14, 2009
DOE/NETL-2009/1381

Disclaimer
This report was prepared as an account of work sponsored by an agency of the United States Government. Neither the United States Government nor any agency thereof, nor any of their employees, makes any warranty, express or implied, or assumes any legal liability or responsibility for the accuracy, completeness, or usefulness of any information, apparatus, product, or process disclosed, or represents that its use would not infringe privately owned rights. Reference therein to any specific commercial product, process, or service by trade name, trademark, manufacturer, or otherwise does not necessarily constitute or imply its endorsement, recommendation, or favoring by the United States Government or any agency thereof. The views and opinions of authors expressed therein do not necessarily state or reflect those of the United States Government or any agency thereof.
LITERATURE REVIEW OF EMPLOYMENT IMPACT STUDIES
OF POWER GENERATION TECHNOLOGIES
DOE/NETL-2009/1381
September 14, 2009
NETL Contact:
Lisa Phares Economist
Office of Systems, Analyses and Planning
Prepared By:
Management Information Services, Inc. 703-620-4120
www.misi-net.com
National Energy Technology Laboratory www.netl.doe.gov

ii
This page intentionally left blank

iii
TABLE OF CONTENTS
LIST OF TABLES v
LIST OF FIGURES vi EXECUTIVE SUMMARY vii I. INTRODUCTION 1 II. REVIEW AND ANALYSIS OF THE FIVE STUDIES SELECTED 7
II.A. The BBC 2009 Study 7 II.B. The Noblis 2007 Study 18 II.C. The Wyoming 2007 Study 28 II.D. The Penn State 2006 Study 40 II.E. The MISI/SAIC 2006 Study 49
III. SUMMARIES OF SELECTED STUDIES OF EXISTING COAL POWER
GENERATION, ADVANCED COAL POWER OPTIONS AND TECHNOLOGIES, AND OIL AND GAS PROGRAMS 60
III.A. Studies of Existing Coal Power Generation 60
III.B. Advanced Coal Power Technologies 66 III.C. Coal-to-Liquids Operations 73 III.D. Coal Gasification and Enhanced Oil Recovery 78
III.E. Carbon Capture and Sequestration Operations 83 III.F. Oil and Gas Programs 86
IV. STUDIES OF FEDERAL GOVERNMENT PROGRAMS, DOE AND
FEDERAL LABORATORY PROGRAMS AND INITIATIVES, AND EMPLOYMENT IMPACT STUDIES IDENTIFIED FOR OTHER ENERGY AREAS 93
IV.A. Federal Government Programs 93
IV.A.1. Economic and Job Impacts of Federally-mandated Vehicle Fuel Efficiency Standards 93
iv
TABLE OF CONTENTS
(Continued)
IV.A.2. Other Federal Government Programs 98 IV.B. DOE and Federal Laboratory Programs and Initiatives 102 IV.C. Employment Impact Studies For Other Energy Areas 110
IV.C.1. Green Energy and Clean Energy 110 IV.C.2. Renewable Energy 117
V. FINDINGS AND IMPLICATIONS 125 V.A. Implications Derived From the Five Down-Selected Studies 125 V.B. Implications Derived From All Studies Reviewed 130 REFERENCES 132

v
LIST OF TABLES I-1 Summary of the Studies Reviewed 2
II.A.1 Cumulative Economic and Job Benefits During Construction 9 II.A.2 Annual Economic and Job Benefits During Operations 9 II.A.3 Nationwide Expenditures for Construction of 20-100 GW of
Advanced Coal Facilities with CCS 9 II.A.4 Nationwide Expenditures for Annual O&M for 20-100 GW of
Advanced Coal Facilities with CCS 10 II.B.1 Summary Requirements -- Labor, Cases 1 and 2 23 II.B.2 Design Labor, Cases 1 and 2 23 II.B.3 Construction Labor, Cases 1 and 2 24 II.B.4 Operation and Maintenance Personnel, Cases 1 and 2 24 II.B.5 Mine Employment, Cases 1 and 2 24 II.C.1 Construction Impacts – Southwest Wyoming 31 II.C.2 Incremental Economic Impact of IGCC in Southwest Wyoming
Over Coal Exportation 32 II.C.3 Construction Impacts – Northeast Wyoming 32 II.C.4 Incremental Economic Impact of IGCC in Northeast Wyoming
Over Coal Exportation 33 II.D.1 Summary of Penn State Study Regional Results Based on Averages
of the Study’s Low and High Energy Price Projections 44 II.D.2 Economic Benefits Due to Coal-Based Generation,
2015 -- Mid-range Estimates 45 III.B.1 CCTDP Sales and Pending Sales as of June 30, 2006 69 IV.B.1 Direct Economic Impact of NETL on the Pennsylvania-West
Virginia Region, 2006 104

vi
LIST OF FIGURES II.A.1 Distribution of Jobs by Sector Due to Construction of 100 GW
of Advanced Coal Facilities with CCS 12 II.A.2 Distribution of Jobs by Sector due to Annual O&M for 100 GW of
Advanced Coal Facilities with CCS 13 II.E.1 Total Liquid Fuel Impacts 50 II.E.2 Liquid Fuels Saved and Produced in Year t0+20 51 II.E.3 Jobs Created in Year t0+20 52
II.E.4 Selected Occupational Requirements for the Four Mitigation Options
in Year t0+20 53 II.E.5 Total Employment Impact per $1 Million of Direct Costs 54 III.F.1 Comparative Economic and Jobs Impact in Colorado of the RE&EE
Sector and the O&G Sector 86 III.F.2 Comparative Economic and Jobs Impact in Colorado of RE, EE,
O&G Extraction, and O&G Drilling, Completion and Recompletion 87 II.F.3 Employment in Selected Colorado Industries 88

vii
EXECUTIVE SUMMARY Goal and Structure of the Report
This study identifies and reviews relevant reports and articles in the existing body of literature on employment impacts and job creation statistics relating to power generation technologies. Specifically, this study covers a:
1. Search of the existing body of literature for job creation related articles and reports. Reports were identified and characterized in the following categories: Existing coal power generation, advanced coal power technologies, coal-to-liquids (CTL) operations, coal gasification, enhanced oil recovery (EOR), carbon capture and sequestration operations, federal government programs, and DOE laboratory programs and initiatives. Employment impact studies identified for other areas were categorized, as appropriate. The identified literature went through a screening process and the top five significant reports were selected for further review.
2. Review of the five down-selected studies and development of a literature review report. The findings of each of the five studies assessed are summarized in a comparative manner to effectively identify best practices that can be discerned from the studies and potentially applied to future employment impact activities. For each of the five studies down-selected, this study:
• Summarizes the study • Describes why the study was down-selected • Assessed the methodology, data, and assumptions used • Determines the accuracy of the data and modeling assumptions
employed • Identified calculations based on data and those based on
assumptions • Differentiates between assumptions that are supportable based on
known facts (with reasonable extrapolation) and those that are unverified
• Documents the conclusions of each review by including a summary of the approach used by the authors and strengths and weakness of the approach
• Identifies methodologies that could be used to increase the quality of job creation estimates related to NETL technologies and general analyses
Over 50 studies were reviewed – these are listed in Table I-1; the five down-selected studies are, in chronological order:

viii
• Employment and Other Economic Benefits from Advanced Coal Electric Generation with Carbon Capture and Storage. Report prepared for the Industrial Union Council, AFL-CIO; the International Brotherhood of Boilermakers, Iron Ship Builders, Blacksmiths, Forgers, and Helpers; the International Brotherhood of Electrical Workers; the United Mine Workers of America; and the American Coalition for Clean Coal Electricity, by BBC Research and Consulting, Denver, Colorado, February 2009.
• Building a U.S. Coal-to-Liquids (CTL) Industry: Requirements and Implications. Report prepared for DOE under the technical direction of the National Energy Technology Laboratory by Noblis, October 2007.
• An Economic Impact Analysis of Proposed Tax Incentives to Attract Integrated Gasification Combined Cycle Power Generation Facilities to Wyoming. Report prepared for the Wyoming Infrastructure Authority by Roger Coupal, Robert Godby, David Bell, David Taylor, Jamison Pike, and Thomas Foulke, University of Wyoming, School of Energy Resources and Office of Research, January 9, 2007.
• The Economic Impacts of Coal Utilization and Displacement in the Continental United States, 2015. Report prepared for the Center for Energy and Economic Development, Inc., Alexandria, Virginia, by Adam Rose and Dan Wei, the Pennsylvania State University, July 2006.
• Economic Impacts of U.S. Liquid Fuel Mitigation Options. Report prepared for the National Energy Technology Laboratory by Management Information Services, Inc. and SAIC, July 2006.
The BBC study was down-selected for special analysis because it:
• Is the most recent, comprehensive analysis of the economic and job impacts of advanced coal generation with CCS
• Was sponsored by a coalition of industry and labor groups, thus giving it substantial credibility
• Examined three scenarios of advanced coal development with CCS • Provided some disaggregation of plant costs, industry, and job
effects • Assessed the potential impacts of HR 6258, the "Early Carbon
Capture and Storage Commercial Demonstration Act of 2008“ The Noblis study was down-selected because:
• Noblis estimated the major labor and capital equipment that would

ix
be required for the U.S. to significantly ramp up CTL production
• Noblis also estimated the CO2 that would be generated by such an effort
• The study compared and contrasted this effort with the EIA reference case CTL forecast
• Noblis identified the specific capital equipment, such as gasifiers, air separation units, and F-T reactors, that would be required
• The study disaggregated labor requirements into generic types such as engineering, construction, O&M, miners, etc.
• Noblis assessed potential supply side constraints in both the capital and labor markets
The Wyoming study was down-selected because:
• It is a sophisticated example of a state-sponsored study of the costs and benefits of an advanced coal plant
• In its analysis, Wyoming used actual, proposed state incentive legislation as the potential IGCC subsidy
• It is significant that Wyoming recognized that it may be more beneficial for the state to process and utilize its coal resources in-state rather than to simply export coal
• The study analyzed an IGCC plant located in two different parts of the state
• The study represented about as good a state-level cost-benefit analysis, including realistic incentives, of an IGCC plant as is feasible
The Penn State study was down-selected because:
• This study is one of the few to estimate the overall value to the U.S. of coal-fired electricity
• It emphasized coal’s value as the low-cost electricity generation option
• It provided economic output, income, and jobs impacts for each state under different scenarios
• It estimated the value to the U.S. of the increased economic output, earnings, and employment associated with projected coal utilization, and the losses to the U.S. if coal use is curtailed
The MISI/SAIC study was down-selected because:
• It assessed the impacts of programs to increase the use of three major U.S. fossil fuel resources: CTL, EOR, and oil shale
• It analyzed the impacts of these programs and others, such as

x
vehicle fuel efficiency mandates, instituted simultaneously • It estimated the annual and cumulative economic and employment
benefits to the U.S. of these crash programs over two decades • It derived economic and employment estimates at a level of detail
not available elsewhere, including the 70-order NAICS industries and the 600-order level of occupations and skills
• It demonstrated that even simultaneous crash programs will take decades to significantly lessen the U.S. liquid fuels problem
Implications Derived From the Five Down-Selected Studies
Conducting a rigorous analysis of the down-selected studies helped identify best practices from the studies that can potentially be applied to the activities of special interest to NETL. Specifically, the strengths and innovations of each of these studies can be utilized and integrated to develop a comprehensive analytical approach that can serve the laboratory’s needs. A review of the potential contributions of each of the five studies for increasing the quality of job creation estimates related to NETL technologies and general analyses indicates this. Thus, these studies indicate the following capabilities necessary for a comprehensive data base and modeling system to increase the quality of job creation estimates related to NETL technologies and general analyses:
• The best detailed, credible technical specifications and parameters
available from DOE, NETL, EPRI and other organizations for IGCC, PC, CTL, EOR, CCS, etc. should be utilized at the front end of the modeling effort. While these data are available, their appropriate use is often inconsistent among studies.
• Realistic implementation schedules for the technologies should be utilized. Thus, for example, aggressive initiatives beginning in 2010 for technologies such as CTL, IGCC, and EOR can be realistically modeled. However, it would be unrealistic to assume such an early start date for zero emission coal plants or many of the advanced CCS technologies.
• The implementation schedules should be realistic and recognize that for any energy technology there will inevitably be a substantial time lag before significant impacts are felt. Constructing major energy plants takes at least four years, and most energy saving initiatives take at least as long to implement, and this implies that significant energy impacts at the national level will not be realized for at least a decade. Thus, objectives such as “energy independence by 2020” or “decarbonization of U.S. electricity production within 10 years” are not realistic.
• As much detail for plant capital equipment and components should be included – detail on capital such as air separation units, gasifiers, reactors, controls, etc. This is especially important if aggressive, simultaneous energy initiatives are being modeled.

xi
This information will permit identification of the potential suppliers of the equipment (domestic or foreign) and determination if there may be supply-side capital constraints.
• A high level of industrial detail is also required, and this should be at least the 70-order NAICS level. This detail is required for several reasons. First, it will permit further identification of industrial, capital, component, and system requirements. Second, this detail is required if input-output techniques are to be used to estimate total economic and industrial requirements. Third, such detail is required to develop gross employment requirements.
• Input-output methodology is required to estimate the total (direct plus indirect) output required throughout the economy. This methodology is standard and widely applied, and was utilized in many of the 50 studies reviewed here.
• It is essential that as much detail as possible be included on jobs, occupations, and skills. Jobs, skills, occupational requirements, education and training requirements, and related concerns are always critical issues and must be incorporated into the modeling effort.
• Similarly, state-level and regional economic and jobs estimates are required. Benefits estimates are especially relevant at the state and local level and are required by policy-makers and decision-makers at this level of detail. These estimates can be derived using regional econometric forecasting models and variations of the regional input-output modeling system (RIMS).
• The modeling system developed should have the capability to estimate, not only proposed new coal initiatives, but also the current value of coal to the economy and the cost to the economy of reducing coal utilization. Coal is currently the nation’s most abundant, cheapest, secure, and valuable energy resource. However, this value is not widely recognized and needs to be quantified and emphasized.
• Actual, proposed incentives and policy initiatives must be simulated and analyzed to add relevance and credibility to the results. Two good examples in the studies down-selected are the BBC modeling of the effects of HR 6258 and the University of Wyoming modeling of proposed state tax incentives for IGCC.
• Supply side capital and labor constraints must be considered in the analysis – especially for aggressive programs that assume simultaneous implementation of numerous energy initiatives. It should be determined whether adequate supplies of specific capital equipment and labor with the necessary skills are likely to be available in the quantities required.
• Supply side capital and labor constraints must also be considered even for single plant initiatives. For example, while the

xii
development of a large advanced coal plant in a state such as Ohio or Michigan is not likely to strain available labor resources, development of such a plant in a state such as Wyoming may result in local labor and skill shortages
• The model should have the capability to simulate the widespread implementation of numerous ambitious energy programs. Indeed, many problems and concerns could arise from the attempt to address U.S. energy problems with multiple energy demand side and supply side initiatives, which may encounter serious capital and labor constraints – especially in the near term.
• The model should have the capability of estimating all of the benefits of coal utilization, in terms of environment, national security, tax revenues, balance of payments, regional development, energy prices, etc.
• The modeling effort should recognize that for future advanced coal development, some type of CCS will likely be required and must be included and appropriately priced.
• Estimates should be developed of the net economic and jobs impacts of the programs and initiatives simulated – net of the effects of utilizing alternate electricity generation or energy production technologies.
Development of a modeling capability with the characteristics listed above could be used to analyze many of the issues that are of interest to NETL and that are germane to the current project. For example, NETL has analyzed the CO2 mitigation potential of increasing the efficiency of existing coal-fired power plants and is interested in expanding this analysis to estimate the potential economic and employment impacts of engaging in a U.S.-wide efficiency improvement program. The impacts of such a program could range from employment and economic activity related to installing new equipment to impacts associated with marginal operation cost declines which could lead to lower end-user prices or increased profits. The down-selected studies offer important guidelines as to how this analysis could be conducted and how a range of potential economic and employment impacts associated with a U.S.-wide efficiency coal-fired power plant efficiency improvement program could be estimated. For example, for specific plants, careful consideration of specific technical capital equipment and components will be required, as will detailed industrial economic effects and impacts on jobs, occupational, and skill requirements – as demonstrated in the Noblis, BBC, and MISI/SAIC studies. Direct and indirect economic and employment effects can be estimated at the national, state, and regional levels – as demonstrated in the BBC, Wyoming, and MISI/SAIC studies. The effects of marginal cost declines could be estimated using the type of techniques utilized in the Penn State study.
As another example, significant changes in energy costs could have a

xiii
measurable impact on GDP, and NETL seeks to better understand the relationship between energy intensity and GDP and the impacts of changing energy prices on GDP. Specifically, NETL is interested in analyzing the relationship between energy costs and GDP in both the short- and long-runs, differentiating between efficiency improvements and industrial restructuring and dislocation. The studies reviewed here can provide important input to this assessment:
• The Noblis and Wyoming studies indicate how the micro-level plant and regional estimates of the effects of energy costs can be derived.
• The BBC, Penn State, and MISI/SAIC studies indicate how the macro-level and industrial economic and employment effects can be estimated.
• Some of the other studies reviewed here offer insight into the long term industrial dislocation effects of changes in energy costs.
Implications for Modeling CCS Three of the down-selected studies – BBC, Noblis, and Wyoming – provided useful guidance on reflecting CCS in the analyses: All three of these studies explicitly assumed that CCS would be required in any future facilities and included CCS technologies and costs in their analyses.
The BBC study:
• Simulated the construction of equal numbers of Supercritical PC plants and IGCC plants at the 20 GW, 65 GW, and 100 GW levels
• Estimated the incremental costs of required CCS transportation and storage infrastructure
• Illustrated the potential job and other economic benefits from the deployment of advanced coal electric generation using “CCS-only benefits”
• Estimated the employment and economic benefits resulting from deployment of advanced coal-based power plants equipped with CCS
• Demonstrated that CCS has the potential to create thousands of good paying jobs, and recommended that policymakers recognize these findings and take appropriate steps to encourage CCS commercialization
• Illustrated the importance of deploying CCS technologies, not only because of their potential to reduce GHG emissions, but also because of their substantial economic and job benefits
• Found that initiatives to reduce GHG emissions are likely to stimulate the deployment of new, advanced coal generation facilities with CCS

xiv
• Concluded that the development and deployment of CCS
technologies can serve as an economic stimulus The Noblis Study: • Recognized that, while the law at the time the study was
conducted, 2007, did not require CCS, it was reasonable to assume that a future U.S. CTL industry would require CCS
• Developed three detailed CTL plant configurations designed to capture CO2 produced in the CTL process
• Found that the technology exists to capture most of the CO2 produced in the CTL plants
• Estimated the major labor and capital equipment that would be required for the U.S. to significantly ramp up CTL production, and estimated the CO2 that would be generated by such an effort
• Determined that one of the most desirable sequestration opportunities is EOR, where the sequestered CO2 can produce oil to offset sequestration costs
• Estimated that the total EOR storage capacity is roughly equivalent to what would be required to sequester the lifetime CO2 produced by a1.620 MMbpd CTL industry
The Wyoming study:
• Recognized that GHG control concerns require technologies that
allow CCS, such as IGCC, if new coal plants are to be built in Wyoming, and that this would ensure that Wyoming coal has access to jurisdictions that may limit their markets to non-GHG producing sources (particularly California)
• Emphasized that development of CCS could protect Wyoming’s future competitive position in national coal markets
• Noted that IGCC technology could threaten demand for Wyoming coal, since the emissions regulation cost savings Wyoming coal offers could be eliminated if IGCC is widely adopted elsewhere
• Determined that, although IGCC facilities are significantly more expensive than PC plants, IGCC incentives may be justified to create permanent demand for Wyoming coal
• Estimated that construction of a 500 MW IGCC plant would require a capital investment of $1.75 billion dollars -- 35 percent more than the cost of an equivalent PC plant lacking CCS
• Recognized that access to CO2 pipelines for EOR or sale is required and that CO2 captured in Wyoming could be sequestered, used for enhanced coalbed methane recovery, or for EOR

xv
• Estimated that plant capital costs would increase by about $200
million with the addition of CCS capability and that annual O&M costs would increase by nearly $20 million – about 65 percent for a 500 MW plant
• Concluded that IGCC is more cost-effective than traditional PC technologies if CCS is required
Implications Derived From All Studies Reviewed The most striking impression that emerges from the overall literature review is that many more studies of the economic and jobs impacts of green energy, clean energy, and renewable energy programs have been conducted in recent years than similar studies relating to fossil fuels or advanced coal programs. The difference is an order of magnitude of 10 or 20 to one. Further, many of these studies contend that green energy or renewable energy programs are preferable to fossil or nuclear energy programs on economic, employment, environmental, and other grounds. For example, a recent study reviewed here – Green Recovery – contended that, per dollar of expenditure, green energy programs create both more jobs and higher paying jobs than other types of energy investments.
Focusing on the reports dealing with government programs and advanced coal
and fossil energy programs, a great diversity of studies are available with respect to level of effort, quality, coverage, and credibility. Several of the studies reviewed were extremely well done and were candidates for down-selection. For example, the Southern Illinois University study of the economic impact of Futuregen, the Northern Illinois University study of the economic impact of the Taylorville Energy Complex, the Penn State University study of the economic benefits of coal conversion investments, the SSEB study of energy scenarios, and the NETL studies of the Lab’s regional impacts were comprehensive, rigorous, and credible.
Most of the other studies were of decidedly mixed quality: Some were relatively
well done and credible, others were of questionable quality; for example:
• The studies of the impact of the NASA Glenn facility in Ohio and of Brookhaven National Lab in New York were rigorous and credible.
• Many of the studies of the impacts of specific proposed new coal plants were poorly documented, lacked analytical rigor, and were sometimes funded by vested interests.
• Further, individual plant siting studies often had significantly different estimates of the normalized economic and jobs impacts of plant construction and operation, which resulted from different definitions, assumptions, and modeling techniques. It is thus difficult to compare them.
xvi
One major failing that virtually every study reviewed here shared is the failure to distinguish between gross economic and job impacts and net economic and job impacts. Nearly every study estimated gross impacts, without estimating – or usually even discussing – alternative uses of expenditures or program funds or discussing the concept of opportunity costs. Resources are not finite, and funds expended on one program or set of priorities are not available for other uses. One notable exception to this was the MISI study of the economic and jobs impact of federally mandated vehicle fuel efficiency standards. This study estimated that, while enhanced CAFE standards would increase overall employment and most industries and occupations would gain jobs, some industries and occupations will lose jobs. Further, it also estimated that while most states would gain substantial numbers of jobs, job increases and decreases would be spread unevenly among different sectors and industries within each state, and there would thus be job shifts within and among states. This type of net job loss and displacement analysis is necessary to establish the credibility of any major energy program impact study. Many of the studies reviewed here aimed to compare the relative job creating potential of different types of energy programs and initiatives. For example, the green energy studies usually found that green energy, energy efficiency, and renewable energy programs created far more jobs (and usually “better” jobs) than equivalent investments in other types of energy programs, such as coal, oil, nuclear, etc. However, what is lacking is an objective and rigorous analysis of this critical issue. How can equivalent expenditures always create more and “better” jobs if devoted to one type of energy program as opposed to another? What are the guidelines for comparison? Are more labor intensive programs always to be preferred simply because they create more jobs? If the latter is the case, then perhaps we should be constructing highways with shovels, picks, and wheel barrels rather than using bulldozers and large earth moving equipment. The relative job creation issue is important and requires rigorous analysis.
Finally, a critical issue that few of the studies adequately address is that of net energy productivity and cost. The progress of the world energy economy over the past several centuries has been one of increasingly intense, efficient use of relatively low-cost, available, and abundant energy resources. If this begins to change in the future – for environmental, economic, or other reasons, and we must rely on more scare, diverse, difficult to develop, and relatively costly energy sources, the long-term impacts on economic and job development may be unfavorable. This is an important issue addressed in few of the studies reviewed here.
1
I. INTRODUCTION
This study identifies and reviews relevant reports and articles in the existing body of literature on employment impacts and job creation statistics relating to power generation technologies. Specifically, this study covers a:
1. Search of the existing body of literature for job creation related articles and reports. Reports were identified and characterized in the following categories: Existing coal power generation, advanced coal power technologies, coal-to-liquids (CTL) operations, coal gasification, enhanced oil recovery (EOR), carbon capture and sequestration operations, federal government programs, and DOE laboratory programs and initiatives. Employment impact studies identified for other areas were categorized, as appropriate. The identified literature went through a screening process and the top five significant reports were selected for further review.
2. Review of the five down-selected studies and development of a literature review report for NETL. The findings of each of the five studies assessed are summarized in a comparative manner to effectively identify best practices that can be discerned from the studies and potentially applied to future employment impact activities. For each of the five studies down-selected, this study:
• Summarizes the study • Describes why the study was down-selected • Assesses the methodology, data, and assumptions used • Determines the accuracy of the data and modeling assumptions
employed • Identifies calculations based on data and those based on
assumptions • Differentiates between assumptions that are supportable based on
known facts (with reasonable extrapolation) and those that are unverified
• Documents the conclusions of each review by including a summary of the approach used by the authors and strengths and weakness of the approach
• Identifies methodologies that could be used to increase the quality of job creation estimates related to NETL technologies and general analyses
This report is organized as follows: • Section II reviews the five studies selected for analysis.

2
• Section III summarizes selected studies of existing coal power generation, advanced coal power options and technologies, and oil and gas programs.
• Section IV summarizes selected studies of federal government programs, DOE and federal laboratory programs and initiatives, and employment impact studies identified for other energy areas
• Section V provides findings and conclusions.
Table I-1 lists the studies reviewed, in the order they are reviewed here.
Table I-1 Summary of the Studies Reviewed
Study Publica-
tion Date
Author Brief Description
Employment and Other Economic Benefits from Advanced Coal Electric Generation with Carbon Capture and Storage
2009 BBC Research and Consulting
Estimated the employment and economic benefits resulting from deployment of advanced coal-based power plants equipped with CCS
Building a U.S. Coal-to-Liquids (CTL) Industry: Requirements and Implications
2007 Noblis Quantified the key equipment, manpower, and natural resources required, and the CO2 that would be produced, in the course of ramping up CTL production
An Economic Impact Analysis of Proposed Tax Incentives to Attract Integrated Gasification Combined Cycle Power Generation Facilities to Wyoming
2007 University of Wyoming
Estimated the economic and employment benefits of locating a 500 MW IGCC generating facility in Wyoming
The Economic Impacts of Coal Utilization and Displacement in the Continental United States, 2015
2006 Penn State University
Projected the likely economic and job impacts of coal utilization for electricity generation on the economies of the 48 contiguous states in 2015
Economic Impacts of U.S. Liquid Fuel Mitigation Options
2006 MISI & SAIC Assessed the economic and jobs impacts of four options that the U.S. could implement for the massive physical mitigation of its dependence on imported oil
The Economic Contributions of U.S. Mining in 2007
2009 Moore Economics
Examined the economic contributions of U.S. mining in terms of output, employment, payroll, personal income, and payroll taxes
The Cost of Not Building Transmission: Economic Impact of Proposed Transmission Line Projects for the Pacific Northwest Economic Region
2008 Idaho National Laboratory
Impact study to evaluate the cost of not building transmission lines in the Pacific Northwest
Economic Impact Study of Consumers Energy’s Planned Expansion of the
2007 Consumers Energy
Assessed the potential economic impacts of Consumers Energy’s plan to expand its Karn/Weadock Generating Complex near Bay

3
Karn/Weadock Generating Complex in Michigan
City, Mich., by building a new 800 MW advanced supercritical pulverized clean coal power plant
Study Publica-tion Date
Author Brief Description
Coal: America’s Energy Future, Volume II, “Appendix: Economic Benefits of Coal Conversion Investments”
2006 Penn State University
Estimated the economic impacts from coal Btu energy conversion
“Gross Employment Flows in U.S. Coal Mining”
2001 Timothy Dunne and David R. Merrell
Examined patterns of job creation and destruction in U.S. coal mining and compared those patterns to known regularities in U.S. manufacturing
“Governor Paterson Announces Support For New Advanced Coal Power Plant For Jamestown”
2008 Ecology & Environment
Forecast economic impacts of a demonstration facility for a new technology that captures CO2 and sequesters it underground for permanent storage
Commercializing Carbon Capture and Storage
2008 Coolimba Power
Assessed the economic impact of the Coolimba Power Station, a 450 MW coal fired power station in Western Australia
The Economic Impacts of an Electric Power Generation Facility in Illinois
2007 Northern Illinois University
Estimated the likely economic impact of the Taylorville Energy Center, a 630 MW IGCC clean coal power generation facility proposed to be built in Illinois
Sales and Benefits of Technology from Clean Coal Demonstration Projects
2006 NETL Summarized sales data and projections that resulted from the Clean Coal Technology Demonstration Program
Mesaba Energy Project: Report to the Minnesota Public Utilities Commission
2005 Excelsior Energy
Estimated the economic and jobs impacts of the Mesaba Project – a proposed 606 MW IGCC plant in Minnesota
Comparing Statewide Economic Impacts of New Generation from Wind, Coal, and Natural Gas in Arizona, Colorado, and Michigan
2005 National Renewable Energy Laboratory
Compared the economic impacts in three states of equivalent new electrical generation from wind, natural gas, and coal
“Department of Energy Selects OUC, Southern Company to Build Clean Coal Technology Plant”
2004 DOE Estimated the jobs impact of building a $557 million, advanced coal gasification facility in Central Florida as part of the DOE Clean Coal Power Initiative
Producing Liquid Fuels from Coal: Prospects and Policy Issues
2008 RAND Corporation
Analyzed the costs, benefits, and risks of developing a U.S. CTL industry capable of producing liquid fuels on a strategically significant scale
Intelligent Energy Choices for Kentucky’s Future: Kentucky’s 7-Point Strategy for Energy Independence
2008 Kentucky Governor’s Office
Estimated the benefits to Kentucky of the state energy plan, including CTL and coal gasification
Underground Coal Gasification: Industry Review and an Assessment of the Potential of UCG and UCG Value Added Products.
2008 Pricewater-house-Coopers
Estimated the potential economic benefits from underground coal gasification development in Queensland, Australia
FutureGen: The Economic 2007 Southern Estimated that the economic impact on Illinois

4
Impacts of Clean Coal for Illinois
Illinois University
and the local economy of a coal gasification and carbon sequestration project in several locations
Study Publica-tion Date
Author Brief Description
“NRG Energy, Inc. Receives Conditional Award to Build Advanced Coal-Gasification Power Plant in Western New York”
2006 NRG Energy, Inc.
Estimated the jobs impact of an innovative, 680 MW IGCC plant in Tonawanda, New York.
Recovering “Stranded Oil” Can Substantially Add to U.S. Oil Supplies
2006 Advanced Resources International
Reports estimated the potential and benefits of using CO2-EOR to recover 89 billion barrels of “stranded” oil in ten U.S. regions
CO2-Enhanced Oil Recovery Resource Potential in Texas: Potential Positive Economic Impacts
2004 Texas Bureau of Economic Geology
Estimated the oil recovery potential and economic benefits from applying CO2-EOR to 3,000 oil reservoirs in Texas
Clean Energy, a Strong Economy, and a Healthy Environment
2006 Western Governors Association
Presents the recommendations of the Clean and Diversified Energy Advisory Committee to the WGA
Western Coal at the Crossroads
2006 Western Resource Advocates
Estimated the effects of requiring that new coal-fired baseload capacity in the West be IGCC instead of pulverized coal
“RE&EE in Colorado Compared to the Oil and Gas Sector”
2008 MISI/ASES Compared the economic impact of the Colorado RE&EE sector to that of the Colorado oil and gas sector
Project Methodology & Model Implementation Plan EPAct Project: Valuing Domestically Produced Natural Gas and Oil
2008 NETL Described a project to develop a model to facilitate national and regional economic analysis of the impacts of offsetting imports by increasing domestic natural gas and oil production in areas likely to be impacted by EPAct 2005 R&D
Oil and Gas Impact Analysis 2007 Booz Allen Hamilton
Evaluated the economic contribution of the oil and gas industry to the state of Colorado
“Potential Long-term Impacts of Changes in U.S. Vehicle Fuel Efficiency Standards,”
2005 MISI Forecast the economic and employment effects of increasing U.S. federal CAFE standards
Drilling in Detroit: Tapping Automaker Ingenuity to Build Safe and Efficient Automobiles
2004 Union of Concerned Scientists
Analyzed the macroeconomic implications of increasing CAFE standards to 55 mpg by 2020
Short-and Long-Range Impacts of Increase in the Corporate Average Fuel Economy Standard
2002 Andrew Kleit Estimated supply and demand functions for the motor vehicle industry to calculate before and after effects of imposition of new CAFE standards
“CAFE compliance by Light Trucks: Economic Impacts of Clean Diesel Engines”
1999 Arvind Teotia, et. al.
Estimated the macroeconomic impacts of the use of clean diesel engine technology in light trucks to comply with CAFE standards
The Economic Benefits of the U.S. Department of Energy for the State of Tennessee
2005 University of Tennessee
Analyzed the economic benefits of DOE payroll and non-payroll spending for the state of Tennessee
The Economic Contribution of Military and Coast Guard Installations to the State of
2004 Rutgers University
Examined the economic contributions of military facilities to New Jersey

5
New Jersey The Economic Impact of Defense Spending on Huntsville/Madison County
2003 University of Alabama
Estimated the economic impact of DOD spending on local counties in Alabama
Study Publica-tion Date
Author Brief Description
Impacts of the Acid Rain Program on Coal Industry Employment
2001 U.S. EPA Assessed the impacts of the Acid Rain program on coal mining employment
The Impact of Federally Funded Laboratories in Colorado
2008 University of Colorado
Estimated the economic impact of several federally-funded laboratories in Colorado
National, State, and Regional Economic and Environmental Impacts of NETL: Pennsylvania-West Virginia Region
2007 NETL Developed a model to quantify NETL’s economic and environmental impacts on the Pennsylvania-West Virginia region
National, State, and Regional Economic and Environmental Impacts of NETL
2007 NETL Documented models developed to assess the economic and environmental impacts of expenditures and employment at NETL and R&D awards originating from the NETL sites in Pittsburgh, PA and Morgantown, WV
The NASA Glenn Research Center: An Economic Impact Study, Fiscal Year 2004
2005 NASA Estimated the economic impact of NASA Glenn on the Northeast Ohio region and the state
The Economic Impact of Brookhaven National Laboratory on the New York State Economy
2005 Brookhaven National Laboratory
Estimated the state and local economic impacts of BNL on New York
Green Recovery: A Program to Create Good Jobs and Start Building a Low-Carbon Economy
2008 University of Massa-chusetts
Analyzed a “green economic recovery program” designed to increase jobs, stimulate economic growth, and build a low-carbon economy
Energy Efficiency and Renewable Energy: A Growing Opportunity for Massachusetts
2005 Massachu-setts Technology Renewable Energy Trust
Analyzed the high-tech energy efficiency and renewable energy technologies sectors in Massachusetts
The Apollo Jobs Report: For Good Jobs and Energy Independence
2004 Apollo Alliance
Estimated the economic and jobs impact of implementing ambitious EE&RE initiatives for the U.S. over the next decade
Clean Energy: Jobs for America’s Future
2001 World Wildlife Fund,
Analyzed the economic and jobs impacts of implementing the Climate Protection Scenario designed to reduce U.S. GHG emissions
Energy Efficiency and Economic Development in New York, New Jersey, and Pennsylvania
1997 ACEEE Estimated how EE investments could decrease energy expenditures and create jobs in New York, New Jersey, and Pennsylvania
Putting Renewables to Work: How Many Jobs Can the Clean Energy Industry Generate?
2006 University of California, Berkeley
Reviewed the findings of 13 reports that analyzed the economic and employment impacts of the clean energy industry in the U.S. and Europe
Component Manufacturing: Ohio’s Future in the
2005 Renewable Energy Policy
Analyzed the potential economic and employment benefits to Ohio of investments in

6
Renewable Energy Industry Project wind, solar, biomass, and geothermal Solar PV Development: Location of Economic Activity
2005 Renewable Energy Policy Project
Analyzed the effects of accelerating PV development in the U.S. to 30% per year over the next 20 years
Study Publica-tion Date
Author Brief Description
Renewing America’s Economy: A 10% National Renewable Electricity Standard Will Save Consumers Money and Create Jobs
2005 Union of Concerned Scientists
Examined the costs and benefits of a U.S. federal 10% renewable electricity standard
Wind Turbine Development: Location of Manufacturing Activity
2004 Renewable Energy Policy Project
Disaggregated wind turbine production to 20 separate component parts and identified companies already active in this field and those that may become active
Job Jolt: The Economic Impacts of Repowering the Midwest
2002 University of Illinois
Analyzed the economic and job impacts of the Midwest Clean Energy Development Plan
The Work That Goes Into Renewable Energy
2001 Renewable Energy Policy Project,
Estimated the total hours required to manufacture, install, and service wind power and PV
Source: Management Information Services, Inc., 2009.

7
II. REVIEW AND ANALYSIS OF THE FIVE STUDIES SELECTED The five studies selected are discussed below in chronological order, not necessarily in order of significance. The five studies are:
• Employment and Other Economic Benefits from Advanced Coal Electric Generation with Carbon Capture and Storage. Report prepared for the Industrial Union Council, AFL-CIO; the International Brotherhood of Boilermakers, Iron Ship Builders, Blacksmiths, Forgers, and Helpers; the International Brotherhood of Electrical Workers; the United Mine Workers of America; and the American Coalition for Clean Coal Electricity, by BBC Research and Consulting, Denver, Colorado, February 2009.
• Building a U.S. Coal-to-Liquids (CTL) Industry: Requirements and Implications. Report prepared for DOE under the technical direction of the National Energy Technology Laboratory by Noblis, October 2007.
• An Economic Impact Analysis of Proposed Tax Incentives to Attract Integrated Gasification Combined Cycle Power Generation Facilities to Wyoming. Report prepared for the Wyoming Infrastructure Authority by Roger Coupal, Robert Godby, David Bell, David Taylor, Jamison Pike, and Thomas Foulke, University of Wyoming, School of Energy Resources and Office of Research, January 9, 2007.
• The Economic Impacts of Coal Utilization and Displacement in the Continental United States, 2015. Report prepared for the Center for Energy and Economic Development, Inc., Alexandria, Virginia, by Adam Rose and Dan Wei, the Pennsylvania State University, July 2006.
• Economic Impacts of U.S. Liquid Fuel Mitigation Options. Report prepared for the National Energy Technology Laboratory by Management Information Services, Inc. and SAIC, July 2006.
II.A. The BBC 2009 Study Study: Employment and Other Economic Benefits from Advanced Coal Electric Generation with Carbon Capture and Storage. Report prepared for the Industrial Union Council, AFL-CIO; the International Brotherhood of Boilermakers, Iron Ship Builders, Blacksmiths, Forgers, and Helpers; the International Brotherhood of Electrical Workers; the United Mine Workers of America; and the American Coalition for Clean Coal Electricity, by BBC Research and Consulting, Denver, Colorado, February 2009.

8
Summary
This study, conducted for a coalition of labor and energy industry groups, estimated that the next generation of advanced clean coal technologies – those utilizing CCS -- will create millions of high-skilled, high-wage jobs for American workers. The purpose of this study was to illustrate the potential job and other economic benefits from the deployment of advanced coal-fueled electric generation using carbon capture and storage technologies (“CCS-only benefits”).
BBC estimated the employment and economic benefits resulting from deployment of advanced coal-based electricity generation facilities (power plants) equipped with CCS technologies that reduce carbon dioxide emissions. Depending on how many CCS-equipped plants are deployed, the report estimated that five to seven million man-years of employment could be created during construction and a quarter of a million permanent jobs added during operations.
The study assumed that 20, 65, and 100 GW of advanced coal-based electricity generation equipped with CCS are added to the nation’s generation mix. In addition, the study estimated the benefits of HR 6258, introduced by Representative Boucher in 2008, that provides independent funding for the early commercial demonstration of CCS technologies. It estimated the capital, operating, and maintenance costs (O&M), jobs and other economic benefits associated with the deployment of advanced coal generation with CCS.
The results of the study are summarized in the tables and figures below:
• Table II.A.1 summarizes the cumulative economic and job benefits during construction
• Table II.A.2 summarizes the annual economic and job benefits during operations
• Table II.A.3 shows the nationwide expenditures for construction of 20-100 GW of advanced coal facilities with CCS
• Table II.A.4 shows the nationwide expenditures for annual O&M for 20-100 GW of advanced coal facilities with CCS
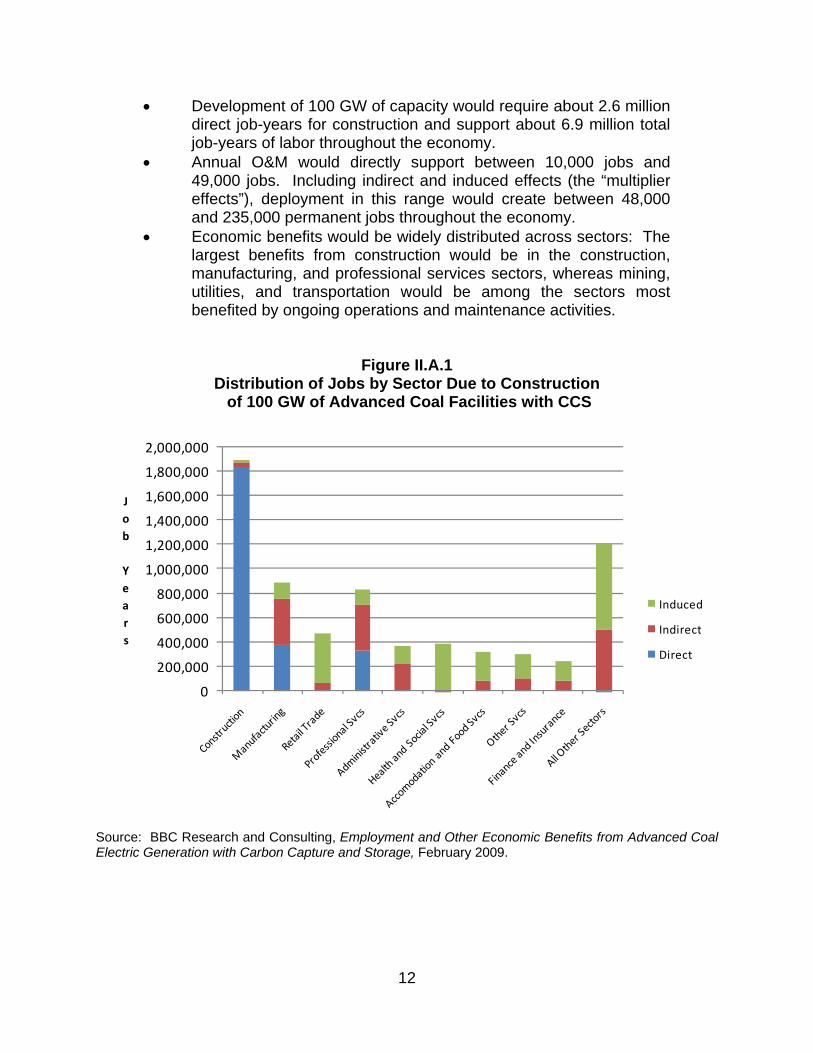
• Figure II.A.1 illustrates the distribution of jobs by sector due to construction of 100 GW of advanced coal facilities with CCS
• Figure II.A.2 illustrates the distribution of jobs by sector due to annual O&M for 100 GW of advanced coal facilities with CCS

9
Table II.A.1 Cumulative Economic and Job Benefits During Construction
Benefits 100 GW 65 GW 20 GW Boucher
Jobs (million job years)
6.9 4.5 1.4 0.2
Output (trillions)
$1.1 $0.7 $0.2 $0.03
Labor Income (billions)
$368 $240 $75 $12
Source: BBC Research and Consulting, Employment and Other Economic Benefits from Advanced Coal Electric Generation with Carbon Capture and Storage, February 2009.
Table II.A.2 Annual Economic and Job Benefits During Operations
Benefits 100 GW 65 GW 20 GW Boucher
Jobs (thousands)
251 153 48 2.5
Output (billions)
$58 $36 $11 $2
Labor Income (billions)
$17 $10 $3.2 $0.5
Source: BBC Research and Consulting, Employment and Other Economic Benefits from Advanced Coal Electric Generation with Carbon Capture and Storage, February 2009.
Table II.A.3 Nationwide Expenditures for Construction of
20-100 GW of Advanced Coal Facilities with CCS
New Supercritical PC Plants (540 MW) 19 plants 61 plants 94 plantsNew IGCC Plants (520 MW) 19 plants 61 plants 94 plants
Total Capital Cost for New Plants $78.5 Billion $251.9 Billion $388.2 Billion
Total Capital Cost for Transportation & Storage Infrastructure $0.9 Billion $2.8 Billion $4.4 Billion
Total Overall Capital Investment $79.4 Billion $254.8 Billion $392.6 Billion
20 GW 65 GW 100 GW
Source: BBC Research and Consulting, Employment and Other Economic Benefits from Advanced Coal Electric Generation with Carbon Capture and Storage, February 2009.

10
Table II.A.4 Nationwide Expenditures for Annual O&M for
20-100 GW of Advanced Coal Facilities with CCS
New Supercritical PC Plants (540 MW) 19 plants 61 plants 94 plantsNew IGCC Plants (520 MW) 19 plants 61 plants 94 plants
Plant Fixed and Variable O&M $2.1 Billion $6.8 Billion $10.5 Billion
Coal Costs (minemouth) $1.6 Billion $5.1 Billion $7.9 BillionCoal Transportation Costs $1.0 Billion $3.2 Billion $4.9 BillionTotal Fuel Costs $2.6 Billion $8.3 Billion $12.8 Billion
Power and O&M for Transportation & Storage $0.3 Billion $1.0 Billion $1.5 Billion
Total Annual Costs $5.0 Billion $16.0 Billion $24.7 Billion
20 GW 100 GW65 GW
Source: BBC Research and Consulting, Employment and Other Economic Benefits from Advanced Coal Electric Generation with Carbon Capture and Storage, February 2009.
The study emphasized that, while development of wind and solar power are important, the only realistic course for the U.S. is to minimize carbon emissions from coal generation, which, along with nuclear power, will continue to be a vital part of the U.S. energy mix for the foreseeable future. It found that CCS technology is essential for enabling the responsible use of U.S. strategic coal reserves -- a resource essential if the nation is to make energy independence a reality. It demonstrated that CCS also has the potential to create thousands of good paying jobs for many union building trades. The authors recommended that policymakers recognize these findings as they move forward in regulating greenhouse gas emissions, and take appropriate steps to encourage the commercialization of CCS technology.
The results of this study illustrated the importance of deploying CCS technologies, not only because of their potential to reduce GHG emissions, but also because of their substantial economic and job benefits. BBC also emphasized that it must be ensured that these technologies are developed and commercialized as rapidly as possible to achieve the estimated benefits.
The analysis found that development and broad deployment of CCS technologies can be a key part of a national strategy to reduce CO2 emissions and address climate change concerns. It also found that initiatives to reduce GHG emissions are likely to stimulate the deployment of new, advanced coal generation facilities with carbon capture and storage, provided CCS technology development is successful and timely.
In addition to environmental benefits, this study also showed that the development and deployment of CCS technologies can serve as an economic stimulus. Study results were developed at the national level to illustrate the potential magnitude of

11
job, GDP, and income benefits associated with the construction and operation of these new advanced coal-fueled electric generation technologies.
The study also analyzed HR 6258, the "Early Carbon Capture and Storage Commercial Demonstration Act of 2008,“ which is designed to advance the commercial deployment of advanced coal CCS facilities. It estimated that, assuming that the proposed $10 billion in funding under HR 6258 for early commercial deployment of CCS technology leads to development and operation of six plants:
• Including multiplier effects, construction would stimulate between $33 billion and $36 billion in total economic output, about 225,000 total job-years of employment, and about $12 billon in labor income.
• Ongoing operations and maintenance would support about 7,500 permanent jobs throughout the economy and about $500 million in annual labor income.
• Economic benefits would occur in virtually all sectors of the economy, but the largest number of jobs from new facility development would be in the construction, manufacturing, and professional services sectors.
• The largest number of jobs supported by ongoing operations would be in mining, transportation, and utilities.
The study illustrated the potential magnitude of CCS-only benefits under three
alternative levels of deployment: 20 GW, 65 GW, and 100 GW, and assumed an equal mix of PC plants with CCS and IGCC plants with CCS. It estimated that:
• 20 GW of advanced capacity would require deployment of about 38 plants, based on the generating capacities for typical plants (540 MW for PC and 520 MW for IGCC).
• 65 GW of advanced capacity would require development of approximately 122 plants.
• 100 GW of advanced capacity would require approximately 188 plants.
Summarizing the national economic benefits from 20-100 GW of advanced coal
facilities with CCS, BBC found that:
• Construction expenditures for this range of capacity of advanced coal facilities with CCS are projected at $79 billion to $393 billion.
• Annual O&M expenditures, including coal purchase and transportation, are projected at $5 billion to $25 billion for this range of future advanced coal facilities with CCS capacity.
• Construction of 20 GW of capacity would require about 0.5 million direct job-years of labor and support about 1.4 million job-years of labor throughout the economy.
12
• Development of 100 GW of capacity would require about 2.6 million direct job-years for construction and support about 6.9 million total job-years of labor throughout the economy.
• Annual O&M would directly support between 10,000 jobs and 49,000 jobs. Including indirect and induced effects (the “multiplier effects”), deployment in this range would create between 48,000 and 235,000 permanent jobs throughout the economy.
• Economic benefits would be widely distributed across sectors: The largest benefits from construction would be in the construction, manufacturing, and professional services sectors, whereas mining, utilities, and transportation would be among the sectors most benefited by ongoing operations and maintenance activities.
Figure II.A.1 Distribution of Jobs by Sector Due to Construction of 100 GW of Advanced Coal Facilities with CCS
0
200,000
400,000
600,000
800,000
1,000,000
1,200,000
1,400,000
1,600,000
1,800,000
2,000,000
Job
Years
Induced
Indirect
Direct
Source: BBC Research and Consulting, Employment and Other Economic Benefits from Advanced Coal Electric Generation with Carbon Capture and Storage, February 2009.

13
Figure II.A.2 Distribution of Jobs by Sector due to Annual O&M for 100 GW of Advanced Coal Facilities with CCS
‐
5,000
10,000
15,000
20,000
25,000
30,000
35,000
40,000
45,000
Annual
Jobs
Induced
Indirect
Direct
Source: BBC Research and Consulting, Employment and Other Economic Benefits from Advanced Coal Electric Generation with Carbon Capture and Storage, February 2009. Why the study was down-selected This study was down-selected for special analysis because it:
• Is the most recent, comprehensive analysis of the economic and job impacts of advanced coal generation with CCS
• Examined three scenarios of advanced coal development with CCS • Provided some disaggregation of plant costs, industry, and job
effects • Assessed the potential impacts of HR 6258, the "Early Carbon
Capture and Storage Commercial Demonstration Act of 2008“
14
Assessment of the methodology, data, and assumptions used
The study:
• Analyzed recent studies from NETL and EPRI to estimate the costs and operating characteristics of typical advanced coal CCS facilities
• Estimated the infrastructure and operating requirements for CCS by examining regional projections of future advanced coal CCS capacity from EPA analyses of climate change proposals to determine possible plant locations relative to potential CO2 storage locations
• Estimated the coal mining and fuel transportation requirements, and likely sources, for new advanced coal CCS facilities based on the potential regional distribution of advanced coal CCS facilities from the EPA analyses
• Incorporated construction and operating expenditures into the IMPLAN input-output model to estimate the national effects of construction and ongoing operations on economic output, value added, jobs, and labor earnings
All of these appear to be reasonable assumptions using credible state-of-the art
data sources and methodologies.
BBC stated that the study was not intended to imply support for any policy position regarding climate change legislation, or to endorse assumptions regarding the level of future deployment of advanced coal facilities with CCS. Further, the study was not intended to imply any policy endorsement of these levels of deployment; rather, BBC simply assumed these levels for purposes of analysis. Moreover, the analysis did not consider any potential economic impacts of emission reduction requirements. Determination of the accuracy of the data and modeling assumptions employed
The IMPLAN economic model was used to calculate the resulting benefits in terms of jobs, output, value-added (GDP), and labor income associated with both the construction and operation of advanced coal-based facilities equipped with CCS. The IMPLAN and related models are widely used in these types of analyses, so use of these I-O techniques here by BBC was appropriate and defensible.
Numerous analyses by EIA, DOE, and NGO’s have shown that complying with emission reduction targets is likely to have adverse economic impacts on the coal and electric generation sectors, along with other industries and sectors. Nevertheless, the study did not take into account adverse economic impacts that may result from proposals to reduce greenhouse gas emissions. While analysis of these impacts may have been outside of the scope of this study, some discussion of these issues have been beneficial.

15
Identification of calculations based on data and those based on assumptions The analysis assumed that:
• Advanced coal units with CCS have net generating capacities of 520 MW for IGCC and 540 MW for PC.
• Construction expenditures for either a Supercritical PC unit with CCS or an IGCC unit with CCS would total approximately $2.0 to $2.1 billion.
• Annual O&M expenditures would total $137 million for an IGCC unit with CCS and $127 million for a Supercritical PC unit.
• Construction of either type of facility would generate about 13,000 to 14,000 direct job-years and about 36,000 to 38,000 total job-years (including indirect and induced effects throughout the economy).
Ongoing annual employment from O&M activity at an individual unit, including coal purchases and transportation, is projected at between 250 and 270 direct jobs. Including multiplier effects, between 1,200 and 1,300 total jobs would be supported throughout the economy. Differentiation between assumptions that are supportable based on known facts (with reasonable extrapolation) and those that are unverified
Based on recent NETL and EPRI research, this study focused on two technologies, Advanced Supercritical Pulverized Coal (PC) with CCS and Integrated Gasification Combined Cycle (IGCC) with CCS:
• Pulverized coal is used in a boiler designed to deliver "supercritical" steam conditions, generating power with high plant generating efficiency. Combustion products, after removal of nitrogen oxides, particulate matter, mercury, and sulfur dioxide, are processed in a post-combustion scrubber to remove approximately 90% of the CO2.
• IGCC: Coal is partially oxidized in oxygen, generating a synthetic gas (syngas). Steam is injected into the syngas to "shift" most of the chemical energy in the CO to H2, producing mostly CO2 and H2. After cooling, the CO2, mercury, and SO2 are removed, leaving H2 to fuel a combined cycle generating plant, and the byproducts include sulfur compounds and highly concentrated CO2. BBC assumed that IGCC designs remove approximately 90% of the CO2.
16
BBC used the following concepts:
• Direct economic effects refer to output, jobs, and other economic measures at electric generating plants, sites manufacturing the equipment used in the plants, coal mines, carbon transportation and storage facilities, and firms transporting coal to plants.
• Indirect economic effects include output, jobs, and other economic activity stimulated by purchases of goods and services by directly affected industries from other firms -- purchases of equipment or consulting services by coal mines are examples of indirect effects.
• Induced economic effects include output, jobs and other economic activity stimulated by purchases by employees of directly and indirectly affected businesses -- purchases of groceries and home rental expenditures would be examples of induced effects.
• Multiplier effects are the sum of indirect and induced economic effects.
• Output -- generally equivalent to sales. • Value-added refers to sales net of the costs of inputs -- when
summed across all industries, it is generally equivalent to gross domestic product (GDP).
These assumptions and concepts are standard, are based on established
methodology and practices, and are verified and supportable. Further, in the study:
• Monetary economic effects (e.g., output, value-added, and labor income) were reported in year 2007 dollars.
• Expenditures for plant construction, operations, and maintenance were estimated and reported in year 2007 dollars.
• All other capital and operating expenditures (e.g., coal costs, pipeline construction costs) were estimated and reported in year 2006 dollars. The IMPLAN model was used to update these costs to year 2007 dollars prior to estimating economic effects.
It is not clear why other capital and operating expenditures (e.g., coal costs,
pipeline construction costs) were estimated and reported in year 2006 dollars and then updated to 2007 dollars using the IMPLAN model. The usual and preferred technique would have been to estimate these capital and operating expenditures in 2007 dollars and then use these estimates in the IMPLAN model.
17
Documentation of the conclusions, including a summary of the approach used by the authors and strengths and weakness of the approach
The report’s major conclusions included the following:
• The only realistic course for the U.S. is to minimize the carbon emissions from coal generation, which will continue to be a vital part of the U.S. energy mix for the foreseeable future.
• CCS technology is essential for enabling the responsible use of U.S. strategic coal reserves.
• CCS has the potential to create thousands of good paying jobs. • Deploying CCS technologies is important , not only because of their
potential to reduce GHG emissions, but also because of their substantial economic and job benefits.
• It must be ensured that these technologies are developed and commercialized as rapidly as possible to achieve the estimated benefits.
• Development and broad deployment of CCS technologies can be a key part of a national strategy to reduce CO2 emissions and address climate change concerns.
• Initiatives to reduce GHG emissions are likely to stimulate the deployment of new, advanced coal generation facilities with CCS.
The strengths of the authors’ approach include: • Realistic consideration of the viable advanced coal technologies • Development of realistic scenarios for advanced coal technology
deployment • Assessment of the potential impact of a specific legislative proposal
-- HR 6258 • Use of state-of-the-art economic input-output techniques • Appropriate use of economic concepts and methodologies • Strong focus on the jobs issue • Disaggregation of job impacts into direct and indirect job creation
among 12 industries
The weaknesses of the authors’ approach include:
• Potentially confusing disaggregation of job impacts among “direct,” “indirect,” and “induced” – this is not standard I-O methodology
• Insufficient discussion of the time paths and potential constraints associated with advanced coal technologies development
• Lack of adequate industry detail for job estimates • No disaggregation of jobs created among occupations or skills

18
• No discussion of the potential adequacy of capital and labor resources to develop advanced coal technologies – especially for the aggressive scenarios
• No regional or state detail for any of the estimates – this is a serious omission, since these are key parameters
• No consideration of the broader range of benefits of widespread advanced coal technologies deployment, e.g., environmental, national security, etc.
Identification of the methodologies that could be applied to increase the quality of job creation estimates related to NETL technologies and general analyses The BBC study offers the following potential contributions for increasing the quality of job creation estimates related to NETL technologies and general analyses:
• Utilization of NETL and EPRI technical studies of advanced coal PC and IGCC plants for estimating relevant plant modeling parameters
• Emphasis on the “good, union” jobs that will be created by advanced coal initiatives and the involvement of major labor unions as stakeholders. However, to accomplish this will require disaggregation of the jobs created; e.g. boilermakers, machinists, tool and die makers, sheet metal workers, etc.
• Recognition that advanced coal with CCS is necessary for energy, environmental, and economic reasons
• Consideration of realistic, alternate scenarios for advanced coal with CCS
• Focus on actual proposed legislation, e.g., HR 6258, gives the analysis special relevance
• Use of state-of-the-art, noncontroversial economic and statistical techniques provides credibility and estimates of direct plus indirect job creation
II.B. The Noblis 2007 Study Study: Building a U.S. Coal-to-Liquids (CTL) Industry: Requirements and Implications. Report prepared for DOE under the technical direction of the National Energy Technology Laboratory by Noblis, October 2007.
Summary
This study quantified the key equipment, manpower, and natural resources required, and the carbon dioxide that would be produced, in the course of ramping up CTL production to analyze the equipment, manpower, or natural resource constraints

19
that might challenge achievement of these levels of CTL production. It assessed two cases:
• Case 1 was based on the Annual Energy Outlook 2006 CTL production projections under the reference oil price case – 760K bpd.
• Case 2 was based on the high oil price case – approximately 1.620 MMbpd.
The objectives of the study were to:
• Estimate the quantities of key manpower, equipment, and
resources required to develop a substantial CTL production capacity in the U.S. by 2030
• Estimate the amount of carbon dioxide that would be produced in the conversion of coal to liquid fuels
• Derive initial conclusions about the prospects and potential constraints of achieving a substantial CTL production capability over this time period, given the very tight construction, environment, and capital constraints faced by intensive energy projects in 2007
Noblis found that the demand for skilled labor increases with time as more plants
are built and come online, and that annual labor demand peaks approximately two decades from the start of the ramp-up, in the 2025-2030 period. In each year in Case 2 in which annual demand is at its maximum, 1,200 non-engineering designers, 640 engineers, 23,000 construction laborers, 18,000 operations and maintenance employees, and nearly 15,000 coal mine employees will be needed.
The analysis found that, while there is time for labor markets to respond to this level of demand, it may take a decade or more for the supply of engineers to expand significantly. It takes 4-5 years of training and another four years of experience to produce a seasoned engineer, and a surge in enrollments in engineering schools will not be felt in the supply of qualified engineers for 10 years. By that time, it is likely that the supply of qualified engineers will be further depleted by a wave of retirements of engineers currently in their fifties. Accordingly, the benefit of newly minted engineers entering the work force a decade hence may largely be offset by the retirement of engineers currently in their fifties.
By 2030, the CTL build-up in Case 2 alone will require the equivalent of 20 percent of total 2005 U.S. coal mine employment. This will be in addition to the number of new mine employees the industry will need to attract to meet added coal demand from other sectors, particularly electric power.

20
The study also found that:
• A 1.620 MMbpd CTL industry will require more than 300 gasifiers, with 37 needed in 2026-2028 when demand is at its peak. In the peak years, the U.S. CTL industry alone will demand roughly twice the number of gasifiers supplied worldwide in 2006. Given the lead times available, supplying this number of gasifiers should not be a problem. However, conditions in the gasifier industry at the time will be critical, for the global demand for gasifiers to meet any CTL ramp-up will be in addition to the growth in gasifier demand for power, chemicals, and substitute natural gas (SNG) production that could be occurring simultaneously.
• Approximately 218 air separation units will be required to build a Case 2 CTL production capacity, with 24 ASUs required in 2026-2028 -- the years of maximum demand. Analysts believe that with sufficient lead time and industry confidence in the strength of the underlying demand, the required engineering/design, manufac-turing, and sub-supplier resources could be developed to support the projected demand for ASUs to meet the CTL ramp-ups assessed in this study.
• The Case 2 CTL ramp-up will require more than 330 Fischer Tropsch reactors with as many as 37 required annually in the 2026-2028 period. There are only three suppliers worldwide of the very large FT reactors – Hyundai in Korea, and Hitachi and Japan Steel in Japan. However, there are more suppliers globally (including suppliers in the U.S.) of the smaller, 2,500 bpd, reactors specified in the Noblis study.
• Depending on the technologies used, CTL plants require between 1.5 and 6 barrels of water per barrel of product produced. When all plants are online in 2030, a 1.620 MMbpd CTL industry will require 224 thousand acre-feet per year (afpy), and 146K afpy will be from bituminous coal CTL plants. CTL plants in western states using subbituminous coal and lignite and producing a total of 1.1 MMbpd of coal liquids would require approximately 78K afpy.
• Technology exists to capture most of the CO2 produced in the CTL plants, and with CCS, nearly 17.5 Gt of CO2 will be captured and sequestered in Case 2 over the life of the plants. Among the most desirable sequestration opportunities is EOR, where the sequestered CO2 can produce oil to offset sequestration costs. The total EOR storage capacity is roughly equivalent to what would be required to sequester the lifetime CO2 produced by the 1.620 MMbpd CTL industry in Case 2.
Noblis concluded that the degree to which the added demand for labor and
equipment estimated constitutes a strain on the capacity of labor and equipment suppliers will depend primarily on: 1) how quickly the ramp-up occurs, 2) how confident

21
supplier industries are that the ramp-up will occur, and 3) what else is happening in the world at the time the ramp up is to occur.
First, the more aggressive the ramp-up schedule, the greater the strain on labor and equipment markets and the more costly it will be. However, it is the nature of a market economy that, over time, supply will respond to the increased demand. Noblis expected high oil prices to continue and felt that engineering careers in the energy industry were more attractive than they have been for many years. Similarly, on the equipment side, it will take time for the equipment manufactures to build the fabrication capacity needed to meet a sudden increase in demand, as has been seen in recent years. A more protracted ramp-up period will place less strain on these industries. Second, supply industries will be slow to build capacity if they not convinced that the demand will, in fact, occur. In this respect, supply industries convinced that oil prices will not drop below the level required to attract investment capital are more likely to build the capacity needed to meet the anticipated demand without undue delays or sharply inflating costs.
To the extent that the financial viability of a CTL ramp-up depends on government subsidies, then the confidence of the supply industries in the durability of the political commitment to these projects will be critical. Because government subsidy programs exist at the pleasure of the Congress, there is no guarantee that such programs will be sustained. The experience of the early 1980s was instructive: Government-led efforts to develop a synthetic fuel capability were abruptly ended within five years of enactment. Third, the CTL ramp-up will be achieved with lower cost and fewer delays if there are fewer projects competing for the same labor and equipment at the same time. As of 2007, in response to high world oil prices, substantial capital was being invested in energy projects throughout the world that were simultaneously competing for resources. These projects were taxing available manpower, EPC contractors, and equipment suppliers worldwide.
The CTL ramp-up considered in the study occurs over a 22 year period from 2008 through 2030. It is reasonable to assume that conditions in the supply industries will ease over this timeframe as these industries adjust to the sudden demand brought about by the recent rapid increase in oil prices and production capacity expands.
Nobils found that building a 1.620 MMbpd CTL industry in the U.S. by 2030 will
require substantial amounts of labor in the design, construction, and operation of the plants, and many more miners to supply the required coal, in addition to labor required to support the employees directly involved in plant operations. In addition to labor, large numbers of key pieces of equipment will be required to construct the plants and significant quantities of coal will be needed to be mined, water consumed, and carbon dioxide produced.

22
The more aggressive the ramp-up schedule, the greater the strain on labor and equipment markets and the more costly it will be. Supply curves tend to be inelastic in the short run, for it takes time to train critical skilled labor and to build fabrication facilities. With respect to labor, it takes approximately four years to develop skilled crafts workers (e.g., welders, pipe fitters), since there is usually an apprentice period of two years followed by an additional two years during which needed experience is acquired.
Noblis noted that the pool of experienced engineers can be expanded by increasing the supply of new engineers, delaying the retirement of existing engineers, and through increased supply of engineers from abroad. It takes five to six years of formal education followed by another four years of experience to produce a seasoned engineer. It will take nearly a decade to increase the pool of experienced engineers through expansion of enrollment in engineering schools. In addition, the U.S. engineering workforce will experience a wave of retirements beginning later in the decade that will further strain its ability to respond to added demand in the near term.
Noblis thus concluded that the engineering labor market will remain tight for the next decade or more. However, over time, supply will respond to the increased demand. With high oil prices expected to continue, Noblis felt that engineering careers in the energy industry are more attractive than they have been for many years. The study’s results are summarized in Tables II.B1 through II.B.4:
• Table II.B.1. summarizes the estimated labor requirements for cases 1 and 2
• Table II.B.2 shows the design labor requirements for cases 1 and 2 • Table II.B.3 shows the construction labor requirements for cases 1
and 2 • Table II.B.4 estimates the operations and maintenance personnel
required for cases 1 and 2 • Table II.B.5 shows the mine employment requirements for cases 1
and 2

23
Table II.B.1
Summary Requirements -- Labor, Cases 1 and 2 Case 1 Case 2 Summary Requirements
Units Total Over Ramp Period
Max in Any Year
Over Life of Plants
Total Over Ramp Period
Max in Any Year
Over Life of Plants
Non-Engineer Designers
M-Y 6,254 578 12,095 1,238
Engineers M-Y 3,222 298 6,231 638 Construction Personnel
M-Y 102,969 10,336 212,031 22,969
O&M Personnel
M-Y 83,910 8,840 353,600 130,620 17,950 718,000
Mine Employees
M-Y 62,091 6,945 277,806 101,013 14,884 595,358
Source: Building a U.S. Coal-to-Liquids (CTL) Industry: Requirements and Implications, Noblis, October 2007.
Table II.B.2 Design Labor, Cases 1 and 2
Case 1 Case 2 760K bpd -- 2030 1.620 MMbpd -- 2030 Man-Years TOTAL MAX AVG TOTAL MAX AVG All Design 9,475 875 447 18,325 1,875 797 Non-Engineering 6,254 578 295 12,095 1,238 526 Engineering 3,222 298 152 6,231 638 271 Chemical 805 74 38 1,558 159 74 Mechanical 805 74 38 1,558 159 74 Electrical/Control 805 74 38 1,558 159 74 All other Engineering
805 74 38 1,558 159 74
Source: Building a U.S. Coal-to-Liquids (CTL) Industry: Requirements and Implications, Noblis, October 2007.

24
Table II.B.3 Construction Labor, Cases 1 and 2
Case 1 Case 2 TOTAL MAX AVG TOTAL MAX AVG Man-Years 102,969 10,336 4,903 212,031 22,969 9,219 Source: Building a U.S. Coal-to-Liquids (CTL) Industry: Requirements and Implications, Noblis, October 2007.
Table II.B.4 Operation and Maintenance Personnel, Cases 1 and 2
Case 1 Case 2 760K bpd – 2030 1.620 MMbpd -- 2030 Man-Years TOTAL MAX AVG TOTAL MAX AVG O&M 83,910 8,840 3,575 130,620 17,950 5,679 Source: Building a U.S. Coal-to-Liquids (CTL) Industry: Requirements and Implications, Noblis, October 2007.
Table II.B.5 Mine Employment, Cases 1 and 2*
Case 1 Case 2 2030 LOP 2030 LOP Man-Years 6,945 277,800 14,884 595,358 *Includes all employees engaged in production, preparation, processing, development, maintenance, repair shop, or yard work at mining operations, including office workers. Source: Building a U.S. Coal-to-Liquids (CTL) Industry: Requirements and Implications, Noblis, October 2007. Why the Study was Down-Selected This study was down-selected for special analysis because:
• Noblis estimated the major labor and capital equipment that would be required for the U.S. to significantly ramp up CTL production
• Noblis also estimated the CO2 that would be generated by such an effort
• The study compared and contrasted this effort with the EIA reference case CTL forecast
• Noblis identified the specific capital equipment, such as gasifiers, air separation units, and F-T reactors that would be required
• The study disaggregated labor requirements into generic types such as engineering, construction, O&M, miners, etc.
25
• Noblis assessed potential supply side constraints in both the capital and labor markets
Assessment of the methodology, data, and assumptions used
Two CTL plant construction ramp-up cases were considered: Case 1 achieves a CTL production capacity of 760K bpd by 2030, while Case 2 achieves a production capacity of 1.620 MMbpd by 2030. The ramp-up schedules include a mix of three plant sizes -- 10K bpd, 30K bpd, and 60K bpd -- and three coal types -- lignite, bituminous, and subbituminous.
Based on input received from industry sources, Noblis developed assumptions for the amount of design, construction, and operating manpower required in the construction of each reference plant and the number of mine employees needed to supply the required feed coal. Quantities of key equipment, coal, and water were specified for each of the nine plant/coal combinations. Ramp-up construction schedules were created that would achieve the production targets in Case 1 and Case 2, using a mix of U.S. coal types and plant sizes.
The input assumptions were applied to the ramp-up schedules to determine the amounts of key equipment, natural resources, and manpower required in each year of the ramp-up period, and, where appropriate, for the assumed 40 year life of the plants. In addition, the quantity of carbon dioxide produced, captured, and sequestered was determined by year and for the life of the plants.
Based on input from experts in key supply industries, initial conclusions were drawn about the ability of the global support industries to meet the requirements of a substantial CTL construction program over the ramp up period.
Noblis made the following simplifying assumptions:
• Standard, commercially available equipment is employed for gasification, air separation, acid gas removal, F-T synthesis, and other processes.
• CTL plants will use iron-based F-T catalysis, and the technology chosen was based on low temperature F-T synthesis.
• Plants are designed to capture CO2 produced in the CTL process. • There are no regulatory restrictions preventing overseas companies
from supplying equipment to the plants. • No regulatory or permitting hurdles inhibit constructing and
operating CTL plants as needed to achieve the ramp-up schedules. • Four years will be required to design and construct each plant. • The ramp-up ends when the 2030 production goals are met in
Cases 1 and 2, and no further CTL construction occurs.

26
As noted, Noblis assumed an aggressive four year design and construction schedule. While the authors realized that the first plants may take somewhat longer, with similar plants being built at the same sites the design-construction schedule will tighten. Design was assumed to take place during years 1-3 and construction in years 2-4. Design labor is spread 20%-60%-20% over the design period, and construction labor is spread 10%-45%-45% over years 2-4.
The design labor was assumed to be two-thirds non-engineers (e.g., piping designers and computer aided design operators) and one-third engineers split evenly (25 percent each) across chemical, mechanical, electrical, and “all other” engineering disciplines. Most of these assumptions appear reasonable, although the assumed four-year construction schedule may be somewhat optimistic. Determination of the accuracy of the data and modeling assumptions employed
While the law at the time the study was conducted, 2007, did not require CCS, it was reasonable for Noblis to assume that the government would not encourage development of a CTL industry in the U.S. that does not address the issue of carbon capture and sequestration. Thus, its assumption of CTL with CCS was appropriate.
Three CTL plant configurations and three coal types were assumed. The plant configurations were based on those specified in Noblis research conducted for the Southern States Energy Board. Simplifying assumptions were made regarding the design, construction, and operations labor requirement for each reference plant and the number of mine employees needed to supply the required feed coal. In addition, key equipment and natural resource requirements were specified for each of the nine plant/coal combinations, as well as the amounts of carbon dioxide that would be produced, sequestered, and emitted in the CTL process.
Construction ramp-up schedules were specified for Case 1 and Case 2, and reference plant assumptions were applied to determine annual and overall requirements for the suite of plants in each Case. Identification of calculations based on data and those based on assumptions
Noblis assumed that approximately 7,600 construction man-years are needed to build a 60K bpd CTL plant and that a total of 250, 400, and 640 full-time operators, respectively, will be required for each of the 10K bpd, 30K bpd and 60K bpd plants in each of the 40 years they are assumed to be in operation. These estimates are consistent with those in other, independent studies.

27
Differentiation between assumptions that are supportable based on known facts (with reasonable extrapolation) and those that are unverified The technical assumptions about plant configurations and generic labor requirements were based on best available data and are supportable. While the assumption that CTL plants would require CCS in the future was reasonable, this was not current law in 2007 when the study was conducted. Documentation of the conclusions, including a summary of the approach used by the authors and strengths and weakness of the approach
The report’s major conclusions included the following:
• The demand for skilled labor increases with time as more plants are built and come online, and annual labor demand peaks approximately two decades from the start of the ramp-up.
• It may take a decade or more for the supply of engineers to expand significantly.
• Demand for air separation units, gasifiers, and F-T reactors may cause serious supply bottlenecks, at least in the near term.
• The degree to which the added demand for labor and equipment estimated will strain capacity depends primarily on how quickly the ramp-up occurs, how confident supplier industries are that the ramp-up will occur, and what else is happening in the world.
• The U.S. engineering workforce will experience a wave of retirements that will further strain its ability to respond to added demand in the near term.
• The engineering labor market will remain tight for the next decade or more.
The strengths of the authors’ approach include:
• Detailed analysis of technical and engineering requirements for
state-of-the-art CTL plants • Recognition that numerous entire plant systems will have to be
developed simultaneously • Estimating the increasing labor and capital requirements involved in
rapid ramp-up • Provided detailed disaggregation of system capital requirements
and components • Discussion of potential supply side labor constraints • Identification of potential component supply bottlenecks

28
The weaknesses of the authors’ approach include:
• Failure to sufficiently disaggregate labor categories. This is
serious. In a study that purports to identify and discuss coming shortfalls in the U.S. science and engineering workforce that could retard CTL development, disaggregation of labor resources into “engineering” and “nonengineering” is not sufficient. What kinds of technical specialties should we be worried about?
• Failure to appreciate the potential gravity of the situation they are assessing. In the CTL development scenario, it is likely that in the U.S. and other nations all types of energy programs will be aggressively developed, and this will exacerbate the labor and capital problems Noblis discusses. However, they do not address this.
• Inadequate discussion of the scientist and engineer production process. The authors treat this critical issue very summarily.
Identification of the methodologies that could be applied to increase the quality of job creation estimates related to NETL technologies and general analyses The Noblis study offers the following potential contributions for increasing the quality of job creation estimates related to NETL technologies and general analyses:
• Rigorous specifications of the detailed technical components of CTL plants
• Identification of potential worldwide manufacturing and supply of the major CTL capital components
• Recognition that aggressive ramp-up may strain available labor supply
• Realization that labor supply will have to be increased to permit desired ramp-up
• Some (but insufficient) labor category disaggregation II.C. The Wyoming 2007 Study Study: An Economic Impact Analysis of Proposed Tax Incentives to Attract Integrated Gasification Combined Cycle Power Generation Facilities to Wyoming. Report prepared for the Wyoming Infrastructure Authority by Roger Coupal, Robert Godby, David Bell, David Taylor, Jamison Pike, and Thomas Foulke, University of Wyoming, School of Energy Resources and Office of Research, January 9, 2007.
29
Summary
This study was conducted to provide the Wyoming Infrastructure Authority (WIA)
with estimates of the economic benefits of locating a 500 MW IGCC generating facility in either southwest Wyoming (Sweetwater County) or northeast Wyoming (Campbell County in the Powder River Basin). Wyoming is currently considering two tax holidays to attract such a project to the state:
• A tax holiday on the state share of sales taxes generated from the construction of such a plant was enacted by the legislature in 2005.
• A 15-20 year holiday on the severance tax charged on the coal used by such a plant is under consideration.
While Wyoming has benefited greatly from the upsurge in revenues caused by
high energy prices, there is concern that the state does not benefit as much as it could from exports of coal, natural gas, and oil because it exports mostly unprocessed energy commodities. State officials believe that if Wyoming were to facilitate the use of coal to produce electricity or other value-added commodities, and exported these products to market, it could reap additional benefits from its resources by creating jobs, tax base, and other value-adding activity within the state. This report was commissioned to determine whether such benefits could be expected to outweigh the costs of incentives the state could provide that might attract such potential.
The authors noted that there are other reasons to consider development of new energy technologies in the state. Concerns regarding greenhouse gases suggest it may be prudent to consider newer technologies that allow carbon capture if new generation facilities are to be built in Wyoming. IGCC generation is one such technology. Such a plant would not only qualify for potential aid under Section 413 of the Energy Policy Act of 2005, but would also ensure that Wyoming energy will have access to jurisdictions currently considering limiting their markets to non-greenhouse gas producing sources (particularly California). Promotion and development of new energy technologies in the state could also protect Wyoming’s competitive position in national coal markets in the future.
The authors also noted that IGCC technology could threaten demand for Wyoming coal. The emissions regulation cost savings Wyoming coal currently offers users could be eliminated if IGCC is widely adopted elsewhere because this technology allows much lower-cost separation of sulfur from the exhaust stream. Further, due to the lower energy and higher moisture content of Wyoming coal, if IGCC were to become a major part of generation infrastructure elsewhere in the U.S., demand for Wyoming coal could be further reduced due to the higher costs these characteristics create in energy production.
Thus, new regulations and new technologies may threaten Wyoming’s current advantages in the coal market, and construction of coal gasification and power

30
generation facilities in Wyoming could partially offset these potential threats by demonstrating the commercial feasibility of the technology and creating permanent demand for Wyoming coal. Since IGCC facilities are significantly more expensive to build than traditional plants, this may be another justification to offer incentives for such plants to locate in Wyoming.
Given that IGCC technology is new, there were few operating plants or plants under construction that the authors could use as prototypes to create the modeling estimates needed to determine the costs and benefits of using tax incentives to attract such facilities. A significant effort was thus required to define the potential construction cost of such a plant to estimate the total cost of any tax subsidies provided. The 500 MW prototype plant assumed here is consistent with the specifications necessary to be eligible for Federal assistance as a commercial western IGCC demonstration project under EPAct 2005, and includes the ability to capture most of the carbon dioxide produced.
Such a plant would require a significant capital investment, and the authors estimated that construction of such a plant would require a capital investment of $1.75 billion dollars -- approximately 35 percent more than the cost of an equivalent generating facility using traditional pulverized coal technology and lacking CCS. Under current incentive proposals, such an IGCC facility would require an annual subsidy in lost severance taxes (assuming the coal used to fuel the plant was instead exported) of between approximately $560,000/year and $1.25 million/year, depending on the location. The sales-tax holiday on plant construction would cost the state between about $22.5 million.
While these are large losses in state revenues, the report found that the estimated benefits of the new economic activity created by the construction and operation of such a plant are significant. As a baseline of comparison, results reported are in excess of the jobs that would be created if the amount of coal assumed to fuel the plant were instead exported out of the state. Specifically, while the results are dependent on where the plant is located, the construction of such a plant is estimated to create in excess of 2,300 jobs in either region in the four years it would take to construct it (this includes both jobs directly and indirectly related to construction), and at least 295 new jobs in the years afterward when the plant was in operation, including 160 high-paying technical jobs at the plant itself.
These new jobs would create between $90 and over $100 million annually in
additional labor income during the first four years of construction, and an additional $13 million to $18 million annually in state labor income over the following 20 years after the plant began operation. The total statewide job impact would be even larger due to the multiplier effect, creating in excess of 2,500 jobs during the construction phase (an minimum of at least 200 more jobs outside the region the plant was located in) and then over 800 new jobs (over 500 more jobs outside the region) in the first year after the plant began operation, declining to just over 400 new jobs persisting as much as 20 years later.
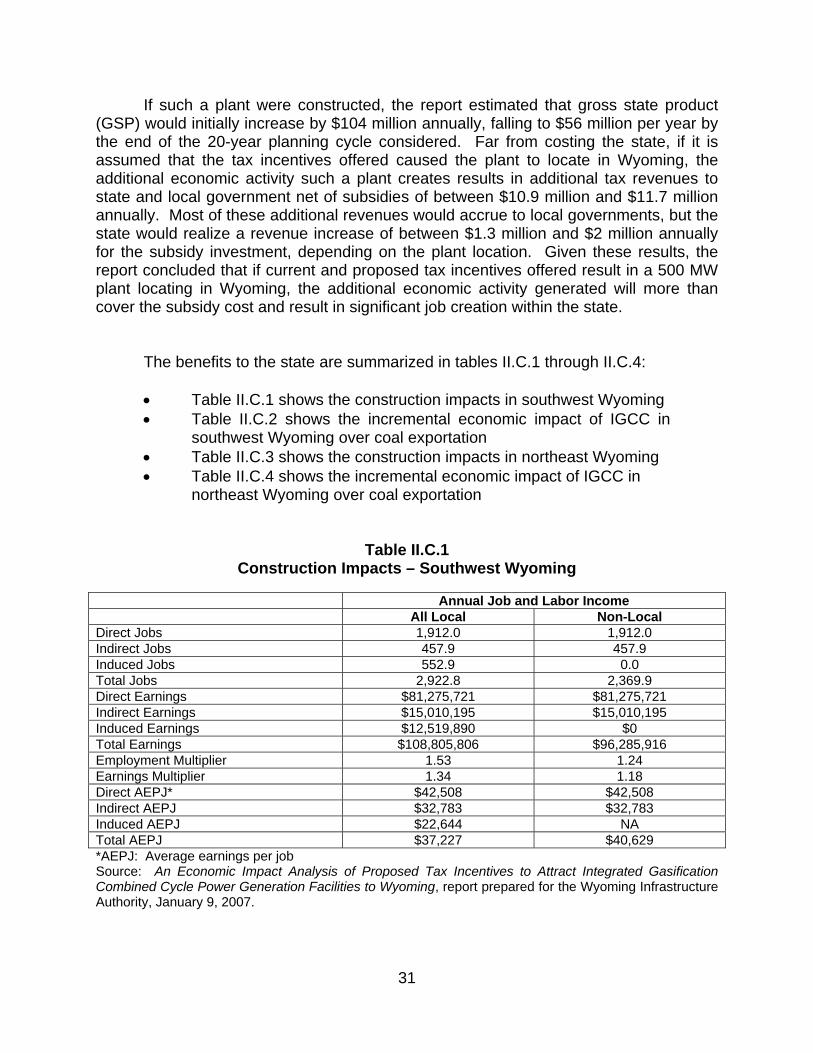
31
If such a plant were constructed, the report estimated that gross state product (GSP) would initially increase by $104 million annually, falling to $56 million per year by the end of the 20-year planning cycle considered. Far from costing the state, if it is assumed that the tax incentives offered caused the plant to locate in Wyoming, the additional economic activity such a plant creates results in additional tax revenues to state and local government net of subsidies of between $10.9 million and $11.7 million annually. Most of these additional revenues would accrue to local governments, but the state would realize a revenue increase of between $1.3 million and $2 million annually for the subsidy investment, depending on the plant location. Given these results, the report concluded that if current and proposed tax incentives offered result in a 500 MW plant locating in Wyoming, the additional economic activity generated will more than cover the subsidy cost and result in significant job creation within the state. The benefits to the state are summarized in tables II.C.1 through II.C.4:
• Table II.C.1 shows the construction impacts in southwest Wyoming • Table II.C.2 shows the incremental economic impact of IGCC in
southwest Wyoming over coal exportation • Table II.C.3 shows the construction impacts in northeast Wyoming • Table II.C.4 shows the incremental economic impact of IGCC in
northeast Wyoming over coal exportation
Table II.C.1 Construction Impacts – Southwest Wyoming
Annual Job and Labor Income
All Local Non-Local Direct Jobs 1,912.0 1,912.0 Indirect Jobs 457.9 457.9 Induced Jobs 552.9 0.0 Total Jobs 2,922.8 2,369.9 Direct Earnings $81,275,721 $81,275,721 Indirect Earnings $15,010,195 $15,010,195 Induced Earnings $12,519,890 $0 Total Earnings $108,805,806 $96,285,916 Employment Multiplier 1.53 1.24 Earnings Multiplier 1.34 1.18 Direct AEPJ* $42,508 $42,508 Indirect AEPJ $32,783 $32,783 Induced AEPJ $22,644 NA Total AEPJ $37,227 $40,629 *AEPJ: Average earnings per job Source: An Economic Impact Analysis of Proposed Tax Incentives to Attract Integrated Gasification Combined Cycle Power Generation Facilities to Wyoming, report prepared for the Wyoming Infrastructure Authority, January 9, 2007.

32
Table II.C.2 Incremental Economic Impact of IGCC in
Southwest Wyoming Over Coal Exportation Generation Coal Export Net Increase Percent
Increase Direct Jobs 159.9 65.5 94.4 144.2% Indirect Jobs 75.9 42.6 33.3 78.1% Induced Jobs 101.3 41.9 59.4 141.7% Total Jobs 337.1 150.0 187.1 124.7% Direct Earnings $14,968,450 $5,697,210 $9,271,240 162.7% Indirect Earnings $3,976,991 $1,648,774 $2,328,217 141.2% Induced Earnings $2,434,489 $949,241 $1,485,248 156.5% Total Earnings $21,379,930 $8,295,225 $13,084,705 157.7% Employment Multiplier 2.11 2.29 Earnings Multiplier 1.43 1.46 Direct AEPJ* $93,586 $86,980 Indirect AEPJ $52,405 $38,704 Induced AEPJ $24,042 $22,655 Total AEPJ $63,425 $55,302 *AEPJ: Average earnings per job Source: An Economic Impact Analysis of Proposed Tax Incentives to Attract Integrated Gasification Combined Cycle Power Generation Facilities to Wyoming, report prepared for the Wyoming Infrastructure Authority, January 9, 2007.
Table II.C.3 Construction Impacts – Northeast Wyoming
Annual Job and Labor Income Effects of an IGCC Plant in
the Powder River Basin All Local Non-Local Direct Jobs 1,912.0 1,912.0 Indirect Jobs 405.8 405.8 Induced Jobs 485.9 0.0 Total Jobs 2,803.6 2,317.8 Direct Earnings $75,967,277 $75,967,277 Indirect Earnings $13,306,182 $13,306,182 Induced Earnings $11,924,498 $0 Total Earnings $101,197,957 $89,273,459 Employment Multiplier 1.47 1.21 Earnings Multiplier 1.33 1.18 Direct AEPJ* $39,732 $39,732 Indirect AEPJ $32,792 $32,792 Induced AEPJ $24,542 NA Total AEPJ $36,095 $38,517 *AEPJ: Average earnings per job Source: An Economic Impact Analysis of Proposed Tax Incentives to Attract Integrated Gasification Combined Cycle Power Generation Facilities to Wyoming, report prepared for the Wyoming Infrastructure Authority, January 9, 2007.

33
Table II.C.4
Economic Impact of IGCC in Northeast Wyoming over Coal Exportation IGCC
Generation Export Coal Net Change Percent
Change Direct Jobs 160.1 13.5 146.6 1086.2% Indirect Jobs 45.2 9.8 35.4 361.2% Induced Jobs 90.4 9.0 81.4 904.4% Total Jobs 295.7 32.3 263.4 815.6% Direct Earnings $14,982,252 $1,176,000 $13,806,252 1174.0% Indirect Earnings $2,884,551 $500,553 $2,383,998 476.3% Induced Earnings $2,354,650 $222,012 $2,132,638 960.6% Total Earnings $20,221,453 $1,898,565 $18,322,888 965.1% Employment Multiplier 1.85 2.39 Earnings Multiplier 1.35 1.61 Direct AEP* $93,559 $87,111 Indirect AEPJ $63,820 $51,077 Induced AEPJ $26,048 $24,668 Total AEPJ $68,378 $58,779 *AEPJ: Average earnings per job Source: An Economic Impact Analysis of Proposed Tax Incentives to Attract Integrated Gasification Combined Cycle Power Generation Facilities to Wyoming, report prepared for the Wyoming Infrastructure Authority, January 9, 2007. Why the Study was Down-Selected This study was down-selected for special analysis because:
• This is a sophisticated example of a state-sponsored study of the costs and benefits of an advanced coal plant
• In its analysis, Wyoming used actual, proposed state incentive legislation as the potential IGCC subsidy
• It is significant that Wyoming recognized that it may be more beneficial for the state to process and utilize its coal resources in-state rather than to simply export coal
• The study analyzed an IGCC plant located in two different parts of the state
• The study represented about as good a state-level cost-benefit analysis, including realistic incentives, of an IGCC plant as is feasible

34
Assessment of the methodology, data, and assumptions used
Modeling Assumptions
Several assumptions were made to estimate the economic impact of the construction of a 500 MW IGCC generating station in Wyoming. While the plant considered in this study would be a candidate for the western demonstration plant funding under EPAct 2005, no comparable plant has thus far been built. Lack of detail regarding actual plants in operation was addressed through the use of recent engineering studies considering the potential construction of IGCC plants elsewhere in the U.S. While the authors did not have access to proprietary proposals under consideration by the WIA for the proposed Western Demonstration project, final plant specifications assumed here were deemed indicative of those proposals by the WIA. Plant construction and operating assumptions were derived using a 2005 Nexant engineering study. This study, conducted for DOE, described a lignite-fueled IGCC generating facility in North Dakota that exports 251 MW of electrical power. Operating assumptions and plant design were scaled-up to derive the operating and facility assumptions for the 500 MW plant considered in the Wyoming study. The size of the plant, fuel type used, and use of CO2 handling assumptions made in this report are all consistent with the conditions set forth under EPAct 2005, Section 413.
Technical Assumptions
Two location scenarios were used to estimate regional and statewide economic impacts:
• Northeast Wyoming -- specifically the Powder River Basin (PRB), represented by Campbell County
• Southwest Wyoming, represented by Sweetwater County Both locations have ready access to coal and existing power transmission lines.
The primary difference between the two locations is the cost of coal; however, an additional consideration is the source of water for plant operations. Expansion of the existing transmission system will be required to support an IGCC facility in Wyoming, regardless of where it is located. This study assumed that similar expansion costs would be required for both IGCC locations that were modeled, and that these costs would be supported in the commercial development of the facility.
The analysis assumed a plant that begins operation in 2012 and operates for at
least 20 years. Construction was assumed to begin in 2008 and finish in 2012 when the plant begins a first year of limited operation. The major modeling assumptions for prototype IGCC facility included:

35
• Construction to begin in 2008 with operations commencing in 2012
for 20 years • Plant availability of at least 87 percent (output generated 319 days
per year) • Mine mouth facility with minimal coal handling required • Adequate water resources available to operate plant • Access available to existing transmission, with equivalent
expansion requirements • Access to CO2 pipelines for EOR or sale • Sufficient labor pool for construction and operation of the facility. • All permits granted without undue delay • Technology and equipment exist and are readily available. • Ash disposal available onsite • Sulfur does not have a ready market in Wyoming (no sulfur sales
revenue considered)
Water is an important consideration in locating the facility, since the IGCC plant proposed here will require approximately five million gallons per day when fully operational. However, sourcing water for the facility was beyond the scope of this study.
Carbon Dioxide Considerations
This study did not consider the cost of CO2 capture and, when the study was
conducted, there was no mandate on limiting CO2 emissions. Nevertheless, some form of CO2 emissions regulation is likely in the future, and to qualify as a commercial demonstration IGCC plant under EPAct 2005, carbon sequestration must be possible. Accordingly, some estimate was required of the additional cost of carbon sequestration. Given that such technologies are not well developed, this study relied on the most recent cost estimates in the literature to identify the potential costs of incorporating CO2 capture into the prototype plant.
The literature indicates significant cost disadvantages of carbon capture when
added to an IGCC plant: For a 500 MW IGCC plant, capital costs could increase by about 30 percent and O&M costs (which include transportation and storage costs) could increase by about 65 percent. Using the hypothetical Wyoming prototype IGCC plant, capital costs would increase by about $200 million with the addition of carbon capture capability in the plant and annual O&M costs would increase by nearly $20 million. It should be noted that from a cost perspective, IGCC technology becomes much more attractive than traditional PC technologies if it is assumed that carbon capture is required. All cost categories for a 500 MW PC plant are higher than a comparable capacity IGCC plant when carbon capture is included. Thus, if carbon capture becomes mandated in the future, it seems reasonable to assume that IGCC plants will become the preferred plant design.

36
CO2 captured in Wyoming could be sequestered, used for enhanced coalbed methane recovery, or for EOR. The authors did not estimate the economic value of captured CO2, although they noted that it could be significant -- carbon emission trading prices for sequestered carbon in 2006 ranged from $3.10/ton and $4.60/ton using Carbon Financial Instrument contracts reported on the Chicago Climate Exchange. Overall, the types of carbon reductions possible using IGCC technology could result in savings of millions of dollars if these emissions become regulated. Used to enhance production of oil or methane, the value of captured CO2 could be even greater, and as of November 2006, CO2 was being purchased at $2/mcf or $35.60/ton for such uses. Determination of the accuracy of the data and modeling assumptions employed
Several areas of consideration were outside the scope of this report and could impact the results reported. The considerations omitted from the report include the following:
• The IGCC plant will require significant amounts of water, but the study did not attempt to determine whether such water sources were available in the locations considered, nor were the potential implications that water could have on operating costs included in the report.
• The ability to sequester carbon is required for a plant to be eligible for EPAct support as a western demonstration project, and additional economic benefits from carbon sequestration could be derived if future GHG regulations include carbon taxes or carbon trading programs. However, the study did not estimate the potential economic benefits that the ability to sequester carbon would have under these circumstances, it did not estimate the potential benefit of CO2 sales for EOR or methane recovery, and it did not consider any CO2 pipeline costs.
• The study did not assess any additional technological benefits locating this new technology in Wyoming could have, particularly in the area of synthetic fuel production, nor did it consider the potential that gasification has in developing hydrogen capture technologies. Nevertheless, such spin-off impacts could be significant and could create an additional use for Wyoming coal reserves and economic and job values for the state.
• The study did not consider how altitude could impact the productivity of the plant, although available data indicate that altitude should not be a major factor in the operation of an IGCC facility.
• The impact on construction jobs in Wyoming could be significant, and the study’s job estimates in the construction phase would amount to almost an eight percent increase in total construction jobs in the State. While such demand could have an impact on

37
construction labor markets – which were tight in Wyoming in 2006, this analysis was outside the scope of the report.
• The report did not develop estimates the costs of additional transmission capacity in the state, although it assumed that additional capacity would be financed commercially as part of the overall project. Nevertheless, additional transmission capacity would be required.
Identification of calculations based on data and those based on assumptions
There are several issues that would have to be considered in locating a plant in Wyoming:
• First, there are the economics of locating closer to markets versus
closer to resources. If the marginal benefits of locating closer to markets outweigh the benefits of locating closer to resources, then plant location may not actually occur in the state.
• Second, if carbon sequestration is an important factor in the economics of the operation as well as penetrating certain markets, then the market for CO2 and its associated transportation costs will, at least in part, drive location decisions.
• Finally, other factors such as the labor pool or federal and other state subsidies may drive location as much as any resource-based factor. Firms may choose locations where state assistance is higher and where the labor they need is readily available. Given the operational complexity of the operation, specialized labor and financing will be critical for this industry.
In southwestern Wyoming, the only likely source water in the quantity required is
the Green River. The researchers were unable to ascertain whether or not it would be possible to use water from this source in sufficient quantity and if so, what the cost would be. Water sources in Northeastern Wyoming also potentially exist: Surplus water coming from coalbed methane production may be suitable if properly treated, but whether there is water in sufficient quantity and quality to supply an IGCC plant was not considered. It might also be the case that sufficient ground water in the region may be available to supply such a plant, but assessing this and identifying specific water sources in either location was beyond the scope of the project. The research simply assumed that sufficient water of suitable quality is available. Thus, while the authors assumed that the plant would address this issue as part of its operation, the cost of water procurement was not considered.
38
Differentiation between assumptions that are supportable based on known facts (with reasonable extrapolation) and those that are unverified
Economic Assumptions
The report assumed that two tax incentives are allowed for the plant under consideration, but did not attempt to define an optimal tax or subsidy level necessary to attract an IGCC facility; rather, it assumed the tax incentives currently proposed. The first incentive is the tax holiday on the state portion of the sales tax on the capital cost of the plant and equipment installed that was adopted by the Legislature in 2005 (HB-0272). The second incentive is a proposed tax holiday on the 5.5 percent severance tax on the coal used at the plant. While severance taxes are charged to coal producers and not coal customers, the study assumed that under the proposed legislation a means would be defined by which the tax benefit is passed on to the IGCC customer.
The report estimated that, to construct the prototype plant assumed in this report a peak employment of about 1,600 construction jobs would be required, and that construction would require approximately four years. Construction labor costs were included in the EPC estimate, and financing, start-up, and other associated costs were scaled appropriately from the Nexant study. Financing costs were significant: Total project costs were estimated at $873 million for an operational facility, and interest payments for borrowed capital would continue on for another 14 years. Debt and equity ratios found in the Nexant study were also used; however, a proposed project of this type may have a different debt structure in Wyoming.
Costs were based on scaling up the Nexant estimates from a single train facility
to a dual train facility. Total EPC costs in the Nexant study were estimated to be $411 million (2004 dollars) to build a facility that generates 301MW of electricity and exports 251 MW, resulting in a design cost of $1,658/kW. Scaling such a plant to a target 500 MW output allows some economies of scale to be realized, since not all components need to be duplicated for a dual train facility. Some components would have to be increased in size to handle larger flows from a second train, however, and costs for enlarging component capacity were not calculated due to insufficient data. Thus, the estimates used in this study may be lower than true costs. Nevertheless, absent a full engineering and cost study, the estimates used in this study likely provide a “best-guess” of relevant costs for a 500MW plant.
The economic impacts of construction were estimated for both regions assuming local and non-local labor would be available. Impacts of non-local labor imply that household respending does not contribute to the regional multiplier. Operating impacts were estimated in both regions assuming EIA Form 861 average power prices to value production, and 160 plant-production jobs. These jobs were all assumed to be local, and thus household respending contributed to the economic multiplier. The economic impacts of operation were compared with exporting coal out of the region, and the report assumed that, without the IGCC plant, coal would be exported. It is important to

39
note that this report did not compare the IGCC plant with a traditional pulverized coal-fired power plant, only coal exportation. Comparison to a PC plant was outside the scope of the study, but could be the basis for a more in-depth analysis. Documentation of the conclusions, including a summary of the approach used by the authors and strengths and weakness of the approach
The report’s major conclusions included the following:
• Construction of a 500 MW IGCC plant would cost just over $1.75 billion dollars, which is approximately 2.5 times more than an equivalent generating facility using traditional pulverized coal technology and lacking CCS.
• The facility would require an implied annual subsidy from the state in lost severance taxes of between approximately $560,000 and $1.25 million/year.
• The cost of the sales-tax holiday to the state is between $22.2 and $22.6 million.
• The estimated benefits of such a plant relative to the export of the coal assumed to be used to power the plant are significant.
• Construction of the plant was estimated to create in excess of 2,300 jobs in the four years it would take to construct the plant, and at least 295 new jobs annually when the plant is in operation. The total statewide job impact would be larger due to the multiplier effect, creating in excess of 2,500 jobs during the construction phase and then over 800 new jobs annually.
The strengths of the authors’ approach include:
• Recognition of the need for Wyoming to increase the value added contributions of its coal resources
• Estimates of the net economic and job benefits of an IGCC coal plant compared to coal exports
• Specification of two regional sites for the new coal plant • Assessment of a coal plant designed and sited for Wyoming • Estimation of the regional and local economic and labor impacts • Cost-benefit analysis using actual, proposed state incentives
The weaknesses of the authors’ approach include:
• Insufficient consideration of CO2 transportation issues • Failure to adequately assess the available local qualified labor pool • Incomplete consideration of other possible state incentives • Little consideration of the adequacy of local water resources • Failure to consider plant modifications that may be required due to
lack of sufficient water resources

40
• Failure to compare the IGCC plant to other types of coal plants Identification of the methodologies that could be applied to the analytical activities in this subtask to increase the quality of job creation estimates related to NETL technologies and general analyses The University of Wyoming study offers the following potential contributions for increasing the quality of job creation estimates related to NETL technologies and general analyses:
• Excellent example of a relevant cost-benefit analysis for a specific state using actual, proposed state IGCC incentives
• Consideration of alternate regional locations within the state • Keen awareness of state policies and decision-making processes • Emphasis of the critically important point that coal states – such as
Wyoming – can realize much greater value from their coal resources by utilizing them in-state, rather than simply exporting coal
• Recognition that future advanced coal plants will likely require CCS, and that this will be expensive
II.D. The Penn State 2006 Study Study: The Economic Impacts of Coal Utilization and Displacement in the Continental United States, 2015. Report prepared for the Center for Energy and Economic Development, Inc., Alexandria, Virginia, by Adam Rose and Dan Wei, the Pennsylvania State University, July 2006.
Summary
This study projects the extent of the likely impacts of coal utilization for electricity generation on the economies of the 48 contiguous states in the year 2015. The projection period covers both current coal-related economic benefits and those that may result from the construction of new coal-fueled electric generating capacity.
The authors first estimated the overall economic benefits associated with the availability of coal as a relatively low-cost fuel resource. This “existence” value reflects the increased economic output, earnings, and employment associated with projected coal utilization for electricity generation in 2015. They also estimated the net economic impacts of displacing 33 percent and 66 percent of projected coal generation by alternative energy resources, taking into account the positive economic effects associated with alternative investments in oil/gas, nuclear, and renewable energy supplies.

41
The analysis estimated that, in 2015, U.S. coal production, transportation, and consumption for electric power generation will contribute more than $1 trillion (2005$) of gross output directly and indirectly to the economy of the lower-48 United States. Based on the average of the two energy price scenarios utilized, the study estimated that $362 billion of household income and 6.8 million U.S. jobs would be attributable to the production, transportation, and use of domestic coal to meet the nation’s electric generation needs.
The study first developed estimates of the positive economic output, household income, and jobs attributable to projected levels of coal production and utilization in 2015. The authors used a 2015 base case because electric generation and other projections for this year were readily available from DOE and EPA. These estimates measure the “existence” value of coal as the key fuel input into U.S. electricity generation. The analysis developed estimates of the impact of higher electricity rates on individual state economies if utilities were required to utilize fuel sources and generating technologies more costly than coal-based electricity.
Two basic scenarios were utilized. The first scenario included backward linkage, or demand-side multiplier, effects for coal-fueled electricity generation. Tax payments from coal production, utilization, and transportation subsequently result in government expenditures, which also generate multiplier effects. The analysis also included the impacts of the favorable price differential attributable to coal-based electricity. This estimated the economic activity attributable to relatively cheaper coal in contrast to more expensive alternatives at upper-range (“high”) prices for alternative generation sources.
The second scenario was the same as the first in terms of backward linkages, but estimated the price differential effects on the basis of lower-range estimates of the prices of alternative fuels and technologies.
Assigning equal weight to each of the two energy price scenarios, the authors estimated that U.S. coal-fueled electric generation in 2015 will contribute:
• $1.05 trillion (2005$) in gross economic output • $362 billion in annual household incomes • 6.8 million jobs
The study also estimated the prospective net economic impacts of the
“displacement” of coal-fueled electricity generation at assumed levels of 66 percent and 33 percent from a projected 2015 base. These levels of displacement are consistent with some of the potential impacts of major environmental policy initiatives in climate change and other areas. In these cases, the authors again estimated backward linkage and price differential effects to determine potential negative impacts on each state’s economy. In addition, they estimated potential positive economic benefits due to the operation of replacement electricity generation of various types. In all states, the net
42
effect of displacing coal-based electricity was negative for the “high-price” scenarios, and in nearly all states, the net effect was negative for the “low-price” scenarios.
Assigning equal weight to the high- and low-price scenarios, the study estimated the average impacts of displacing 66 percent of coal-fueled generation in 2015 at:
• $371 billion (2005$) reduction in gross economic output • $142 billion reduction of annual household incomes • 2.7 million job losses.
Assigning equal weight to the high- and low-price scenarios, the study estimated
the average impacts of displacing 33 percent of coal-based generation in 2015 at:
• $166 billion (2005$) reduction in gross economic output • $64 billion reduction of annual household incomes • 1.2 million job losses
The authors simulated cases where coal-based electricity generation is displaced
at levels of 66 percent and 33 percent by alternative energy supplies, including natural gas, nuclear, and a 10 percent mix of renewables, reflecting potential Renewable Portfolio Standards (RPS) that could be in place by 2015. The results indicated that for the nation, and for nearly every state individually, this displacement – even factoring in positive offsetting multiplier impacts of replacement fuels and technologies – would have a significant net negative economic impact. The study estimated that national gross output would decline by $371 billion for the 66 percent case, and by $166 billion for the 33 percent case. The results of the study are summarized in Tables II.D.1 and II.D.2:
• Table II.D.1 summarizes the regional results based on averages of the study’s low and high energy price projections
• Table II.D.2 shows the economic benefits by state due to coal-based generation, 2015 -- mid-range estimates
Why the Study was Down-Selected This study was down-selected for special analysis because:
• This study is one of the few to estimate the overall value to the U.S. of coal-fired electricity
• It emphasized coal’s value as the low-cost electricity generation option
• It provided economic output, income, and jobs impacts for each state under different scenarios

43
• It estimated the value to the U.S. of the increased economic output, earnings, and employment associated with projected coal utilization, and the losses to the U.S. if coal use is curtailed
Assessment of the methodology, data, and assumptions used
This analysis used state-specific IMPLAN input-output tables -- a widely utilized source of data on the composition of state economic activity -- to estimate the basic direct and indirect multiplier effects of coal utilization for electric generation. These multiplier effects include the economic impacts of coal mining and of government spending of taxes paid by coal mining for electricity generation, by companies that transport coal, and by coal-fueled electricity generation companies. The authors estimated results at the state level and compiled regional summaries by dividing the nation into five geographic regions.

44
Table II.D.1
Summary of Penn State Study Regional Results Based on Averages of the Study’s Low and High Energy Price Projections*
(Billions of 2005 Dollars and Millions of jobs)
Region Overall Coal Generation
Benefits
Net Costs of 33% Coal
Displacement
Net Costs of 66% Coal
DisplacementNortheast Economic Output $105 -$18 -$39 Household Income $40 -$7 -$16 Jobs 0.6 -0.1 -0.3 Southeast Economic Output $238 -$30 -$68 Household Income $80 -$12 -$27 Jobs 1.6 -0.3 -0.6 Midwest Economic Output $304 -$54 -$120 Household Income $101 -$19 -$43 Jobs 1.8 -0.3 -0.7 Central Economic Output $227 -$39 -$85 Household Income $78 -$15 -$32 Jobs 1.5 -0.3 -0.6 West Economic Output $174 -$25 -$59 Household Income $63 -$10 -$24 Jobs 1.2 -0.2 -0.5 48 States Economic Output $1,047 -$166 -$371 Household Income $362 -$64 -$142 Jobs 6.8 -1.2 -2.8 *Estimates show the overall benefits of the availability of coal as a low cost electric energy resource along with the potential net costs of displacing coal-based power with higher-cost energy sources. Source: The Economic Impacts of Coal Utilization and Displacement in the Continental United States, 2015, report prepared for the Center for Energy and Economic Development, Inc., July 2006.

45
Table II.D.2. Economic Benefits Due to Coal-Based Generation, 2015 -- Mid-range Estimates
State
Economic Output (Billions)
Household Income (Billions)
Jobs (Thousands)
Alabama $16.3 $5.2 101.2 Arizona $12.8 $4.4 86.0 Arkansas $5.2 $1.6 35.6 California $58.4 $21.9 338.8 Colorado $19.0 $6.9 109.4 Connecticut $2.8 $1.1 15.2 Delaware $4.6 $1.5 27.9 Florida $26.6 $9.8 218.7 Georgia $38.9 $13.6 242.6 Illinois $66.5 $25.4 328.5 Indiana $66.3 $20.0 410.3 Iowa $21.7 $6.6 157.4 Kansas $26.3 $8.6 194.0 Kentucky $49.3 $16.2 340.3 Louisiana $11.3 $4.4 99.2 Maine $0.4 $0.1 3.4 Maryland $18.9 $8.4 132.1 Massachusetts $8.7 $3.4 47.2 Michigan $54.8 $17.6 292.9 Minnesota $32.6 $11.4 201.0 Mississippi $5.5 $1.9 45.7 Missouri $47.0 $16.6 317.1 Montana $4.5 $1.5 44.1 Nebraska $19.6 $6.9 95.0 Nevada $7.7 $3.0 69.2 New Hampshire $1.3 $0.4 8.3 New Jersey $10.1 $3.9 53.0 New Mexico $14.4 $5.5 131.6 New York $16.3 $6.4 81.6 North Carolina $30.8 $10.0 217.4 North Dakota $8.5 $2.7 64.2 Ohio $83.7 $27.1 528.0 Oklahoma $16.9 $5.8 132.4 Oregon $1.5 $0.5 11.7 Pennsylvania $42.0 $14.3 263.9 South Carolina $7.2 $2.3 49.1 South Dakota $2.6 $0.8 18.5 Tennessee $27.7 $9.2 172.7 Texas $46.4 $16.4 289.5 Utah $32.4 $11.8 245.6 Virginia $14.3 $5.6 90.3 Washington $4.8 $1.8 28.9 West Virginia $20.9 $6.8 160.6 Wisconsin $32.6 $10.6 216.8 Wyoming $7.1 $2.5 55.5 Total $1,047 $362 6,800 Source: The Economic Impacts of Coal Utilization and Displacement in the Continental United States, 2015, report prepared for the Center for Energy and Economic Development, Inc., July 2006.

46
Determination of the accuracy of the data and modeling assumptions employed
The study relied on EIA and other projections of electric generation and delivered coal prices to estimate the impact on energy prices of replacing 100 percent of projected coal-fueled electricity generation.
This was a valid approach utilizing the best available data and appropriate
modeling assumptions. It estimated the impact of higher energy prices on state economies using a price
elasticity estimate of 0.10, meaning that a 10 percent change in energy costs would induce a 1.0 percent change in state economic output. This is an accurate price elasticity estimate, based on available data. Identification of calculations based on data and those based on assumptions
The authors emphasized that the U.S. relies heavily on coal to produce electric power: Domestic coal production has expanded from 560 million tons in 1950 to 1.13 billion tons in 2005, while coal consumption for electric generation has increased from 92 million tons to 1.04 billion tons over this period. Historically, coal has provided the lowest cost source of fossil energy in the U.S., and electricity is one of the most prominent commodities traded in the United States, second only to food in annual sales volume. These are important statistics and real data that are too-often ignored in the debates over energy and environmental policy and coal utilization. The authors deserve credit for bringing this to the forefront.
This study was not intended to measure the impacts of any specific policy that could result in decreased coal production or utilization. Rather, the impacts of specific policy proposals on coal production and related electric generation would have to be determined on a case-by-case basis. Nevertheless, the findings of this study’s coal displacement scenarios provided preliminary insights into the potential magnitude of state, regional, and national economic impacts of policy initiatives that could result in significant decreases in coal production and utilization.
The study did not address several important externalities associated with coal
used in electricity generation. Negative effects include various types of environmental pollution and the emissions of greenhouse gases, whereas positive effects include the creation of saleable by-products of combustion and coal’s major contribution to lowering U.S. dependence on foreign oil. All of these external impacts were beyond the scope of the study, but may, nevertheless, be significant.
47
Differentiation between assumptions that are supportable based on known facts (with reasonable extrapolation) and those that are unverified
The study used an interindustry, input-output, model. Specifically, it analyzed how coal-based electric generation affects production (output), household income, and employment in other sectors of each state and the continental U.S. as a whole under three alternative displacement scenarios. The findings indicated that the combination “multiplier” and “price-differential” effects are sizeable, amounting to $1.05 trillion ($2005) in total 48-state economic output for the “existence” of coal as a relatively inexpensive fuel for electricity generation. The findings illustrated that government policies and private industry decisions affecting coal-based electric generation potentially can affect every major aspect of the U.S. economy. The methodology is supportable, and I-O techniques are widely utilized in the type of analysis conducted here. The methodology used to further disaggregate impacts among production, household income, and employment is also well known, standard, and verified. The disaggregation of economic and employment effects by state and region is a major contribution of this study and was conducted using appropriate techniques. The I-O multipliers used are verifiable and are based on known data. Documentation of the conclusions, including a summary of the approach used by the authors and strengths and weakness of the approach
The report’s major conclusions included the following:
• In 2015, U.S. coal production, transportation, and consumption for electric power generation will contribute more than $1 trillion (2005$) of gross output directly and indirectly to the economy of the lower-48 United States.
• The impact of higher electricity rates if utilities were required to utilize fuel sources and generating technologies more costly than coal-based electricity would be severe.
• Impacts are significant due to the favorable price differential attributable to coal-based electricity.
• Average impacts of displacing 66 percent of coal-fueled generation in 2015 would be $371 billion (2005$) reduction in GDP, $142 billion reduction of annual household incomes, 2.7 million job losses.
• For the nation, and for nearly every state individually, this displacement – even factoring in positive offsetting multiplier impacts of replacement fuels and technologies – would have a significant net negative economic impact.

48
The strengths of the authors’ approach include:
• Emphasized and demonstrated the economic and employment value of coal as the low-cost electricity generation option
• Developed economic and jobs impact estimates at the regional and state levels
• Relied on EIA and other projections of electric generation and delivered coal prices to estimate the impact on energy prices of replacing 100 percent of projected coal-fueled electricity generation.
• Demonstrated that displacing coal would have severe net negative economic and jobs impacts.
• Estimated total net economic and jobs impacts – net of the positive effects of utilizing alternate electricity generation technologies.
The weaknesses of the authors’ approach include:
• Did not measure the impacts of any specific policy that could result
in decreased coal production or utilization. • Did not address several important externalities associated with coal
used in electricity generation, such as various types of environmental pollution and GHG emissions
• Did not assess positive effects, such as the creation of saleable by-products of combustion and coal’s major contribution to lowering U.S. dependence on foreign oil
• Lack of disaggregation of economic or employment effects at the industrial or occupational levels.
Identification of the methodologies that could be applied to the analytical activities in this subtask to increase the quality of job creation estimates related to NETL technologies and general analyses The Penn State study offers the following potential contributions for increasing the quality of job creation estimates related to NETL technologies and general analyses:
• Emphasis on the economic and employment value of coal as the low-cost electricity generation option and the severe economic and jobs consequences that result from displacing it
• Development of economic and jobs impact estimates at the regional and state levels
• Development of economic output, income, and jobs impacts for each state under different scenarios
• Estimation of the total net economic and jobs impacts – net of the positive effects of utilizing alternate electricity generation technologies.

49
• Estimation of the value to the U.S. of the increased economic output, earnings, and employment associated with projected coal utilization, and the losses to the U.S. if coal use is curtailed
II.E. The MISI/SAIC 2006 Study Study: Economic Impacts of U.S. Liquid Fuel Mitigation Options. Report prepared for the National Energy Technology Laboratory by Management Information Services, Inc. and SAIC, July 2006.
Summary This study assessed the economic and jobs impacts of four options that the U.S. could implement for the massive physical mitigation of its dependence on imported oil:
• Vehicle fuel efficiency (VFE) • Coal liquefaction (CTL) • Oil shale • Enhanced oil recovery (EOR)
The major study objective was to assess the implications of the mitigation programs, e.g., the time required to save and produce significant quantities of liquid fuel, related costs, and economic, fiscal, and jobs impacts, and crash program implementation of all options simultaneously was simulated because the results provide an upper limit on what might be accomplished under the best of circumstances. Since it was not known if and when such a program might be undertaken, the study estimates were based on an unspecified starting date, designated as t0.
The analysis showed that the mitigation options considered can contribute
significantly to the saving and production of U.S. liquid fuels, although decades will be needed for significant impact (Figure II.E.1), and related costs will be in the trillions of dollars range. The cumulative 20 year impacts of such a massive crash program would include:
• Savings and production of 44 billion barrels of liquid fuels • Requirement for over $2.6 trillion of investment • Over 10 million employment years of jobs created • Total industry sales of over $3 trillion • Over $125 billion of industry profits • Over $500 billion in federal government tax revenues • Nearly $300 billion in state and local government tax revenues

50
Figure II.E.1 Total Liquid Fuel Impacts
0
2
4
6
8
10
12
14
16
t0 1 2 3 4 5 6 7 8 9 10 11 12 13 14 15 16 17 18 19 20
Mill
ions
of B
arre
ls P
er D
ay
Vehicle Fuel Efficiency
Coal Liquefaction
Oil Shale
EOR
Source: Economic Impacts of U.S. Liquid Fuel Mitigation Options. Report prepared for the National Energy Technology Laboratory by MISI and SAIC, July 2006.
The authors noted that the estimates derived in the study should be considered
as minimum, “best case” estimates, because the final numbers may turn out to be much higher. For example, the $2.6 trillion investment figure does not include cost escalations during the early years of such a program. Related costs could easily double. Further, as all four options are initiated simultaneously, inflationary pressures in specific industries and labor markets could increase costs considerably.
The analysis found that the mitigation options simulated would have widely
differing annual impacts, as illustrated in Figure II.E.2 for year t0+20. Impacts would increase continuously over the 20-year scenario period. Relatively small fuel savings and production, sales, jobs, profits, and tax revenues would be generated in the early years, and the impacts will increase every year through year t0+20. For all of the mitigation options combined the maximum annual impacts occur in t0+20, although all of the options considered would continue to have large impacts beyond year t0+20.

51
Figure II.E.2 Liquid Fuels Saved and Produced in Year t0+20
0
2
4
6
8
10
12
14
16
CTL Oil Shale EOR VFE All 4 Options
Mill
ions
of B
arrle
s Pe
r Day
Source: Economic Impacts of U.S. Liquid Fuel Mitigation Options. Report prepared for the National Energy Technology Laboratory by MISI and SAIC, July 2006.
In terms of employment, the study found that jobs are created throughout the
period, but the character and timing of those jobs are very much a function of time. For example, design and construction of substitute fuels plants requires related personnel until a plant is completed, but since new plants are being continuously started, the requirements for these jobs and skills will be continuous over the period. O&M employment begins only after substitute fuel plants are completed and come into operation, but as more plants begin to operate related O&M employment increases continually. Thus, in the early years of the mitigation programs, most of the jobs created will be in the design and construction industries and related occupations, but, over time, more and more jobs will be created in operations, maintenance, support, and related fields. The total number of jobs will increase over the 20 years, and the maximum number of jobs will be created in year t0+20. As illustrated in Figure II.E.3, in that year:
• CTL creates the most jobs – about 500,000 • Oil shale creates 350,000 jobs • VFE creates 310,000 jobs • EOR creates the least number of jobs – about 230,000 • In total, the four options create 1.4 million jobs
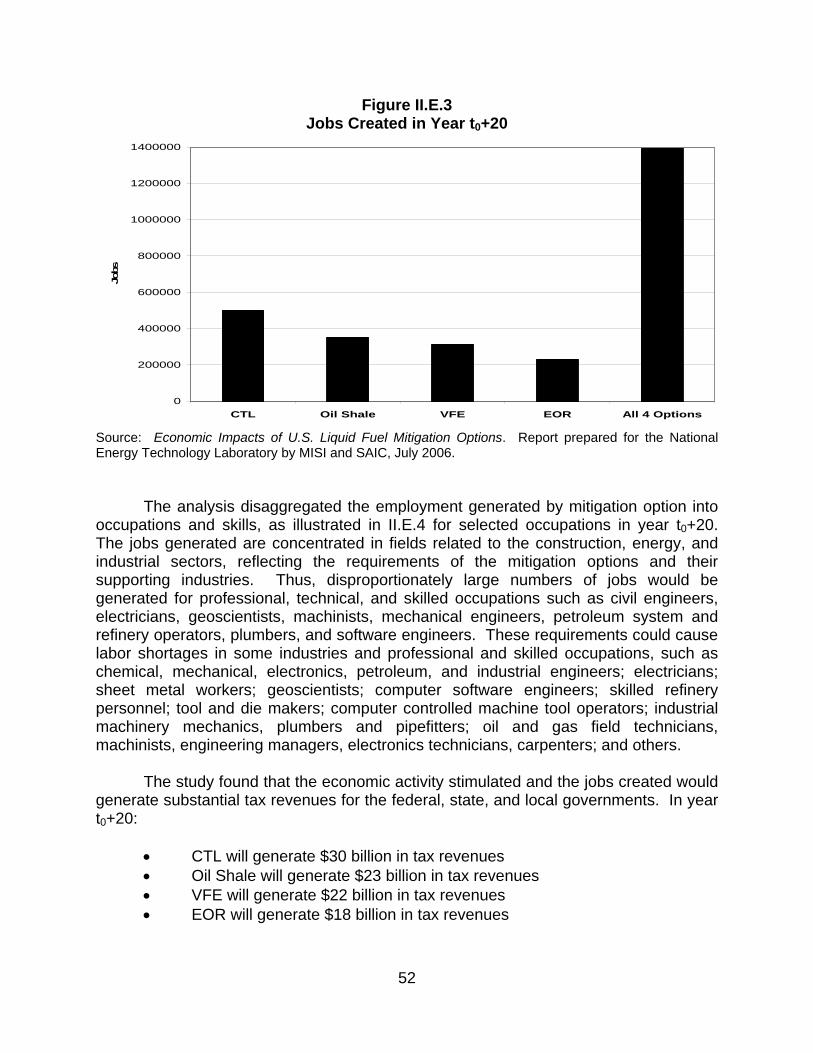
52
Figure II.E.3 Jobs Created in Year t0+20
0
200000
400000
600000
800000
1000000
1200000
1400000
CTL Oil Shale VFE EOR All 4 Options
Jobs
Source: Economic Impacts of U.S. Liquid Fuel Mitigation Options. Report prepared for the National Energy Technology Laboratory by MISI and SAIC, July 2006.
The analysis disaggregated the employment generated by mitigation option into occupations and skills, as illustrated in II.E.4 for selected occupations in year t0+20. The jobs generated are concentrated in fields related to the construction, energy, and industrial sectors, reflecting the requirements of the mitigation options and their supporting industries. Thus, disproportionately large numbers of jobs would be generated for professional, technical, and skilled occupations such as civil engineers, electricians, geoscientists, machinists, mechanical engineers, petroleum system and refinery operators, plumbers, and software engineers. These requirements could cause labor shortages in some industries and professional and skilled occupations, such as chemical, mechanical, electronics, petroleum, and industrial engineers; electricians; sheet metal workers; geoscientists; computer software engineers; skilled refinery personnel; tool and die makers; computer controlled machine tool operators; industrial machinery mechanics, plumbers and pipefitters; oil and gas field technicians, machinists, engineering managers, electronics technicians, carpenters; and others.
The study found that the economic activity stimulated and the jobs created would generate substantial tax revenues for the federal, state, and local governments. In year t0+20:
• CTL will generate $30 billion in tax revenues • Oil Shale will generate $23 billion in tax revenues • VFE will generate $22 billion in tax revenues • EOR will generate $18 billion in tax revenues

53
• The four mitigation options combined will generate $93 billion in tax revenues
Figure II.E.4 Selected Occupational Requirements for the Four Mitigation Options in Year t0+20
Percentages Represent Demands Compared to 2004 Employment
2%
3%
3%
10%
18%2%
2%
8%
3%
3%
2%
3%
2%
0
5,000
10,000
15,000
20,000
Carpen
ters
Chemica
l engine
ers
Civil e
ngineers
Electrici
ans
Electrica
l & el
ectro
nics en
gineers
Geoscie
ntists
Machinist
s
Mechan
ical e
nginee
rs
Petroleu
m engine
ers
Petroleu
m & re
finery
operato
rs
Plumbers
Sheet m
eal w
orkers
Software
enginee
rs
Welders
jobs
3%
Source: Economic Impacts of U.S. Liquid Fuel Mitigation Options. Report prepared for the National Energy Technology Laboratory by MISI and SAIC, July 2006.
The authors noted that the scale of U.S. oil consumption is enormous and that making massive changes quickly will require a gigantic, expensive crash program effort and at least two decades. Nevertheless, the U.S. is endowed with sufficient geological resources, capital, labor, and management to undertake such an effort and, further, there are very significant economic benefits that will result from the mitigation programs. For example, in year t0+20 the study estimated that the combined mitigation options considered would generate:
• Investments of $175 billion • A total fuel savings and production contribution of 14 MMbpd • 1.4 million jobs

54
• $315 billion in industry sales • $15 billion in industry profits • $60 billion in federal government tax revenues • $30 billion in state and local government tax revenues
The study emphasized that future impacts will depend critically on the date that
such a national effort is initiated. For example, it noted that if the crash program was initiated in 2006, the cumulative U.S. impact in 2026 would be roughly 14 MMbpd. However, if program initiation was delayed a decade to 2016, the 2026 impact would be only about 5 MMbpd.
The study estimated that, cumulatively, over the entire 20-year period through
year t0+20, the average cost of a barrel of fuel saved or produced for all of the options is about $60. However, the cost effectiveness of each option differs considerably
The authors found that mitigation options can be evaluated on the basis of
various criteria. As illustrated in Figure II.E.5, in terms of jobs created per dollar of direct investment, the impacts of the mitigation options differ relatively little: The average is about eight jobs per $1 million invested, with CTL creating the most jobs per dollar of expenditure and EOR the least.
Figure II.E.5 Total Employment Impact per $1 Million of Direct Costs
0
2
4
6
8
10
CTL Oil Shale VFE EOR Average
jobs
Source: Economic Impacts of U.S. Liquid Fuel Mitigation Options. Report prepared for the National Energy Technology Laboratory by MISI and SAIC, July 2006.

55
The study found that the results pertaining to the impact on the U.S. economy and employment were particularly interesting. Large investments and efforts need to be undertaken to produce domestic replacements for imported oil, and mitigation initiatives to lower demand for imports, involving massive spending, will lead to large numbers of domestic U.S. jobs and large profits for producers. The creation of new employment opportunities in technical and manufacturing areas was a key finding derived in the analysis. This move of “manufacturing” into the U.S. instead of importing a non-manufactured “mined” imported hydrocarbon will result in many new jobs and other positive consequences. Such a transition also leverages U.S. natural resources and will substantially improve the U.S. balance of payments.
Why the Study was Down-Selected This study was down-selected for special analysis because:
• It assessed the impacts of programs to increase the use of three major U.S. fossil fuel resources: CTL, EOR, and oil shale.
• It analyzed the impacts of these programs and others, such as vehicle fuel efficiency mandates, instituted simultaneously.
• It estimated the annual and cumulative economic and employment benefits to the U.S. of these crash programs over two decades.
• It derived economic and employment estimates at a level of detail not available elsewhere, including the 70-order NAICS industries and the 600-order level of occupations and skills.
• It demonstrated that even simultaneous crash programs will take decades to significantly lessen the U.S. liquid fuels problem.
Assessment of the methodology, data, and assumptions used Although other options are possible, such as biofuels, electric cars, hydrogen cars, fuel switching, and unconventional oil, the study estimated that these would have minimal impacts in the 20-year time horizon, which is the period of the crash activity.
The authors made the study assumptions as simple, transparent, and robust as possible. Thus, for example, the extensive use of future energy supply-demand forecasts was minimized in order to avoid related uncertainties and criticisms. The major assumptions made in the study include:
• No specific date for world oil peaking was assumed, so the analysis was not contingent on that date.
• No specific date was assumed for the initiation of the programs; rather that date was left indeterminate.
• All calculations were based on actual 2004 data, the last full year for which comprehensive data were available at the time of the analysis.

56
• The analysis was based on crash program implementation, the maximum rate believed to be humanly possible.
• Coal processing plants were considered for either 100 percent liquid fuels production or 100 percent electricity, depending on the circumstances and requirements.
• The U.S. electric power sector and its needs were not addressed, because they represent separable problems and uncertainties that are not easily forecast.
• A 20 year time horizon after the beginning of crash program implementation was considered.
• The initiation of new substitute fuel projects was assumed to be constant, e.g. three new CTL plants each year for the 20 year period studied.
• Capital funding and financing were assumed to be readily available. • All options were assumed to be pursued in parallel. • All necessary personnel qualified to perform the tasks required for
design, construction, and operation of each facility were assumed to be available.
• All equipment for the various projects was assumed to be procured in the U.S., meaning that existing factories would have to be appropriately expanded and/or new factories built on an urgent basis to meet requirements.
• Permitting and site approvals for new plants were assumed to be rapid and not to be a time constraint.
• Locations of CTL plants were not specified, although the siting of some plants was assumed to be close to oil fields to facilitate CO2 delivery for EOR.
• Costs for nth plants were adopted, so that initial cost spikes associated with rapid scale up were not considered.
To develop estimates of the economic requirements and impacts of the mitigation
program, the study adopted reasonable project and process cost estimates, utilized established cost and other parameters associated with actual or similar activities, and then utilized such estimates in an established econometric input-output model.
The economic and employment effects of the mitigation options were estimated using the MISI input-output model and related databases, built upon and derived from a variety of sources. The model includes elements from the following sources:
• The U.S. Commerce Department's national input-output model • A modified version of the Commerce Department's regional
econometric forecasting model
57
• A modified version of the Regional Input-Output Modeling System (RIMS) supplemented with the Census Bureau/BLS industry-occupation matrix -- adapted to state and sub-state economies
Determination of the accuracy of the data and modeling assumptions employed Many of the assumptions utilized in the study were clearly optimistic and open to more detailed consideration. Among the most sensitive are the following:
1. The extremely rapid rate of site approvals and permitting 2. The absence of large cost escalations certain to occur in the early years of a
major crash program 3. Procurement of most materials in the U.S. 4. The overnight availability of qualified personnel 5. The constant annual rate of new substitute fuel plant initiation assumed
throughout the study period
It must be recognized that new options and forces will come into play over time, as the U.S. phases towards a more sustainable long-term energy future. This study did not deal with such matters, as they are uncertain and open to question. However, the goal of the analysis was to generate a series of estimates aimed at assessing the major dimensions of what might be required to decrease U.S. imported oil dependence as rapidly as humanly possible and estimating the likely economic and job impacts. Identification of calculations based on data and those based on assumptions
In this study, the 70-order NAICS industry array was used. The databases used in the analysis were derived from a variety of sources, including the following:
• The Bureau of Economic Analysis of the U.S. Commerce Department
• The Bureau of the Census of the U.S. Commerce Department • The Bureau of Labor Statistics of the U.S. Labor Department • The Energy Information Administration of the U.S. Energy
Department • The U.S. Department of the Treasury
These data sources represent the best available.

58
Differentiation between assumptions that are supportable based on known facts (with reasonable extrapolation) and those that are unverified
Economic forecasting databases for the U.S. and for most states were utilized. Using these databases and related experience, the direct and indirect effects of mitigation options on the national and state economies can be disaggregated into the impacts on:
• Industry sales (490 4-digit NAICS industries) • Jobs (800 occupations and skills) • Corporate profits • Federal, state, and local government tax revenues • Employment and unemployment (by industry and occupation) • Net growth or displacement of new businesses • Major economic, technological, social, and environmental
parameters and externalities These data and assumptions are supported by the available sources and are
readily verifiable. Documentation of the conclusions, including a summary of the approach used by the authors and strengths and weakness of the approach
The report’s major conclusions included the following:
• The economic and jobs impacts are significant for all four options that the U.S. could implement for the massive physical mitigation of its dependence on imported oil: Vehicle fuel efficiency, CTL, oil shale, and EOR.
• All four options would produce or save significant quantities of liquid fuel.
• The mitigation options considered can contribute significantly to the saving and production of U.S. liquid fuels, although decades will be needed for significant impact and related costs will be in the trillions of dollars range.
• Jobs are created throughout the period, but the character and timing of those jobs are very much a function of time.
• The total number of jobs will increase over the 20 years, and the maximum number of jobs will be created in year t0+20.
• In year t0+20: CTL creates the most jobs – about 500,000, oil shale creates 350,000 jobs, VFE creates 310,000 jobs, EOR creates the least number of jobs – about 230,000. In total, the four options create 1.4 million jobs

59
The strengths of the authors’ approach include:
• Consideration of simultaneous deployment of several mitigation
options • Disaggregation of economic and employment impacts by 70-order
NAICS industries • Disaggregation of the employment generated by into 600 detailed
occupations and skills • Modeling of the impact of both supply side and demand side
mitigation options • Emphasis on the potential benefits to the U.S. of addressing oil
contingency problems
The weaknesses of the authors’ approach include:
• Other options, such as biofuels, electric cars, hydrogen cars, fuel switching, and unconventional oil were not modeled
• The U.S. electric power sector and its needs were not addressed • The adequacy of supply side capital and labor resources was not
assessed • Assumed all capital equipment would be procured in the U.S. • Assumed nth plant costs for all plants
Identification of the methodologies that could be applied to the analytical activities in this subtask to increase the quality of job creation estimates related to NETL technologies and general analyses The MISI/SAIC study offers the following potential contributions for increasing the quality of job creation estimates related to NETL technologies and general analyses:
• Emphasized that simultaneous implementation of mitigation options must be analyzed
• Contained the highest level of economic, industry, employment, jobs, and occupational detail
• Emphasized importance of simultaneously modeling demand side and supply side options
• Estimated important supplemental economic benefits, such as corporate sales and profits, government tax revenues, and oil import reduction
• Emphasized that long lead times were inevitable for any of the mitigation options

60
III. SUMMARIES OF SELECTED STUDIES OF EXISTING COAL POWER GENERATION, ADVANCED COAL POWER OPTIONS
AND TECHNOLOGIES, AND OIL AND GAS PROGRAMS III.A. Studies of Existing Coal Power Generation The Economic Contributions of U.S. Mining in 2007: Providing Vital Resources for America. Report prepared by Moore Economics for the National Mining Association, February 2009.
This report notes that, while the societal value of the products generated by mining is almost immeasurable, U.S. mining also provides tangible economic contributions through its business activity. These contributions include wages paid to employees, taxes paid by industry, and charitable contributions. Mining also generates economic activity in other industries through the purchases it makes and the wages those vendors and suppliers pay their employees. Combined, the total value of U.S. mining from its business activity alone is more than $240 billion.
The analysis used input-output analysis to examine the economic contributions of U.S. mining in terms of output, employment, payroll, personal income, and payroll taxes. For the purpose of this analysis, the U.S. mining industry includes the mining of coal, uranium, metal ores, stone quarrying, sand and gravel, and other nonmetallic minerals. It excludes oil and natural gas extraction. This analysis also presents data on the value of the products of mining to other selected U.S. industries. These are examples of industries whose output is dependent on the products of mining and for which substitute materials are not readily available or economically viable. Mining also provides value to the economy through use of its products, and this part of the analysis estimated that value. The gross domestic product of selected industries dependent on the products of mining represented 13.4 percent of total U.S. GDP in 2007. The report found that, in 2007 in the U.S.:
• Mining transformed raw earth into $98.4 billion of finished mineral, metal, and fuel products.
• These building block materials were further transformed by consuming industries into consumer and industrial goods creating an additional $1.8 trillion in value added by other mineral, metal, and coal consuming industries.
• 376,310 workers were employed at mines in the 50 states. • The top ten states in terms of mining employment were West
Virginia, Kentucky, Texas, Pennsylvania, Arizona, California, Virginia, Wyoming, Nevada, and Colorado.
• A total of 1.5 million jobs were generated by mining. • For each of the 376,310 jobs in mining, the mining industry requires
the output equivalent of a total of 3.9 workers. Thus, each mining job creates an additional 2.9 jobs in other sectors of the economy.

61
• The average annual wage in U.S. mining was nearly $59,000, 33 percent higher than the combined average annual wage for all industrial categories, and mining wages totaled $22.1 billion.
• Each dollar of the $98.4 billion in mining revenue required $2.45 of output from the economy, including the mining industry -- a direct and indirect total of $240.5 billion from all sectors of the economy.
• The total mining payroll of $22.1 billion generated $64.6 billion in payroll throughout the economy.
• Payroll by the mining industry generated $21.6 billion in personal income and payroll taxes throughout the economy.
• Taxes on production and imports, which includes severance taxes, royalties, fees, property taxes, and gross receipts taxes, etc., totaled $4.4 billion.
• The mining industry paid $1.2 billion in federal royalties and other mineral revenues and contributed $304.9 million and $643.4 million to the Abandoned Mine Lands and Black Lung funds, respectively. An additional $1.2 billion was paid in federal corporate income taxes.
The Cost of Not Building Transmission: Economic Impact of Proposed Transmission Line Projects for the Pacific Northwest Economic Region. Report prepared by Idaho National Laboratory, July 2008.
The Pacific Northwest Economic Region (PNWER) promotes transboundary policy and planning in the Pacific Northwest. As one of the fastest growing regions in North America, the eight member political jurisdictions (the states of Washington, Oregon, Idaho, Montana, and Alaska; the provinces of Alberta and British Columbia; and the Yukon Territory) are dedicated to maintaining the $700B (US) regional economy and promoting additional economic growth through regional and bi-national cooperation.
To attract new industries and keep pace with rapid growth, world-class
communities require a reliable infrastructure of water, energy, transportation, law enforcement, and health-care services. In addition, communities must have access to these resources and services at an affordable cost. PNWER currently has adequate infrastructure and power, but capacity reserves are slim. Operating on this edge of reserves, some PNWER communities and businesses have not been able to capitalize on opportunities for economic growth and higher paying, value-added jobs simply due to the lack of electrical power capacity.
In response, PNWER and the Idaho National Laboratory (INL) conducted an impact study to evaluate the cost of not building transmission lines. In this study, probable economic impacts were forecast from a list of proposed electricity generation and transmission projects within and around the PNWER region.
62
This report highlighted the scenarios where economic opportunities are lost if key transmission projects identified within PNWER's integrated resource plans are not carried out. INL’s study included the development of an economic model to evaluate the potential loss of economic activities, as well as the development of a web-based Geographic Information System that integrates the proposed project’s information and the results of the economic study. These efforts will enable policy-makers, utility planners, and the media to track the status of these critical transmission line projects.
Model results are related to the quantities of power delivered and are also functionally related to the many economic factors of any community, including average local power use, the economic productivity of a community, and other economic variables that are necessary to promote and maintain business enterprise. These relationships suggest that the transmission of efficiently produced and available energy is crucial to maintaining an economic base as well as promoting economic growth.
The study estimated that the PNWER region has a potential economic loss of $15B to $25B annually and 300,000 to 450,000 jobs over 30 years if just the one infrastructure transmission line project with the greatest economic impact is not built (BC to NorCal), and upwards of $55B to $85B annually and 1,750,000 jobs over 30 years if the five transmission line projects of greatest economic impact are not built (Alberta to PacNW Project, BC to NorCal, Gateway West, Southern Xing & I-5 Corridor Projects, and Mountain States Intertie). These transmission line projects transport bulk power and are considered critical for access to preferred electrical generation by areas with high economic development and growth. However, the report noted that even if these five projects come to fruition, the added power will not adequately serve the projected PNWER population increase, assuming consumption habits remain unchanged. Economic Impact Study of Consumers Energy’s Planned Expansion of the Karn/Weadock Generating Complex in Michigan. Consumers Energy, 2007.
Consumers Energy plans to expand its Karn/Weadock Generating Complex near
Bay City, Michigan, by building a new 800 MW advanced supercritical pulverized clean coal power plant -- equipped with the latest technology to control emissions – and originally planned to have it in operation in 2015. CE expects to use 500 MW of electricity from the plant to serve its customers and other parties, which will be part owners of the new facility, will own 300 MW of the output.
The plant is expected to cost in excess of $2 billion, and CE’s share of that cost will be in proportion to its ownership interest in the new facility. The proposed facility will make a significant contribution to meeting Michigan’s future needs for electric power, as outlined in Michigan’s 21st Century Energy Plan and in the company’s Balanced Energy Initiative developed in response to the state’s study.

63
Consumers Energy commissioned a detailed economic impact study for this project, which found that:
• The new clean coal plant expansion will provide significant economic development benefits for Michigan and the region.
• The new plant represents an investment in excess of $2 billion in the state’s infrastructure.
• The expansion will create more than 1,800 jobs during peak construction and at least 80 permanent jobs when the plant is operational -- the Karn/Weadock Generating Complex currently employs 370 people
• The new facility will create millions of dollars in new tax revenue for the local area and will provide other positive economic impacts.
• The Karn/Weadock Generating Complex already pays about $10 million per year in property taxes to local government.
• The proposed new plant is expected to more than double property tax revenues.
In February 2009, CE announced that it is delaying by two years the estimated
start date of operations of the new plant. The timeline was pushed from 2015 to 2017, due to a recent directive by Governor Jennifer Granholm to re-evaluate five pending air permits for new coal plants in Michigan. Coal: America’s Energy Future, Volume II, “Appendix: Economic Benefits of Coal Conversion Investments.” National Coal Council, prepared by Professor Tim Considine, Pennsylvania State University, March 2006. This study for the NCC estimated the economic impacts from coal Btu energy conversion, which affect all segments of the energy industry, including natural gas, crude oil and petroleum, and electricity. An aggregate energy supply and demand framework was adopted which greatly simplified the analysis, distilling the effects down to several key parameters, such as:
• The price elasticity of aggregate energy demand • The elasticity of gross domestic product to energy price changes • The output multipliers associated with energy output and plant
construction
The scenarios analyzed were aggregated into one key variable: The quantity of Btus delivered to energy consumers. The first step in the analysis was to establish the goal for the production of Btus from the coal conversion technologies. The first four scenarios analyzed were driven by an assumed, targeted amount of coal production to the year 2025 and assumed that the additional units of energy supply from these coal technologies will be consumed by the energy consumers.

64
The next step was to determine a path for annual production of Btus from coal to reach these targets and, given this target number of plants, a plant construction schedule was then developed. For this, the author assumed construction of two plants beginning in the year 2007. In subsequent years, an additional 1.5 plants on average are started. The next key assumption was that it takes four years to build these plants. Coal consumption in each year is simply computed by multiplying the number of plants by the 6 million ton per year average coal use per plant.
The study estimated that total energy output from coal conversion in 2025 would
amount to 12.7 Quads. This energy production is achieved by the gradual ramping up of the number of operating coal conversion plants that results from the construction of these plants over time and the assumed four-year construction period. These plants include electric power generation facilities, coal methane production plants, coal-to-liquids plants, and plants that produce hydrogen.
Significant capital expenditures will be required to build these plants, and construction and operation also will generate employment gains. Annual capital expenditures were estimated by multiplying the stock of plants under construction by an average annual capital outlay, which was computed as a weighted average of capital costs for the four technologies. Coal-to-gas and coal-to-hydrogen plants were assumed to cost $1 billion, again assuming 6 million tons per year of coal consumption. The coal-to-liquids plant cost was assumed to be $3.6 billion for this plant size, and coal-to-electricity plants were assumed to cost $2.25 billion. Given a four-year plant life, the average annual capital outlay per plant is $590 million.
Construction jobs were estimated by assuming 976 jobs per plant year, based on
a study of the economic impact analysis of the Peabody Energy Park in Illinois. The operation of the mines and plants generates 414 jobs per plant per year. Total direct employment was determined by multiplying each of these estimates by the number of plants under construction and operating, respectively.
The additional energy production from coal conversion will lower equilibrium energy prices, and energy price reductions result from coal conversion. By the end of the forecast horizon, aggregate energy prices would be more than 30 percent lower than the EIA base case forecast. This implies lower prices for electricity, natural gas, petroleum products, and many other energy products. This is significant, given that coal conversion augments the nation’s energy supply by more than 10 percent in 2025.
These energy price reductions act like a tax cut for the economy, reducing the outflows of funds from energy consumers to foreign energy producers. In addition, the supply-side push from additional domestic energy production will directly increase U.S. economic output. Finally, the plant construction will stimulate the economy at local, regional, and national levels.

65
The employment impacts of the coal energy conversion scenario considered here are significant. By the end of the forecast period, employment is more than 1.4 million higher than the base case, and employment gains arise primarily from the impacts of lower energy prices. In this case, service sector employment is stimulated by the higher level of discretionary income available to consumers made possible by the lower energy prices from the additional production from the coal energy conversion complex. Specifically:
• By 2015 more than 365,000 jobs are created • By 2020 more than 900,000 jobs are created • By 2025 more than 1.4 million jobs are created
The adoption of large-scale coal conversion would generate significant amounts
of CO2 that could be used to enhance oil production. Given the large pipeline network that overlays oil- and coal-producing regions, there is considerable potential to find low cost methods to deliver this CO2 to enhance oil production. This analysis indicated that coal energy conversion coupled with CO2 recovery and enhanced oil recovery could yield very substantial economic benefits, and could result in additional oil production of nearly 3 million bpd. As a result, energy prices are nearly 50 percent lower than in the EIA base case, and the present value of cumulative GDP gains is more than $4 trillion.
The report concluded that development of coal-based energy conversion plants at the scale envisioned would increase U.S. domestic energy supply by more than 10 percent and lower domestic energy prices by more than 33 percent from where they would be without coal conversion. Higher domestic energy production, lower energy prices, and the economic stimulus from coal Btu energy conversion plant construction contribute to cumulative gains in real GDP of more than $3 trillion in discounted present value terms. Further, if some of the CO2 from these plants is used to enhance oil recovery, domestic oil production could increase more than 3 million bpd. This additional energy production would expand the cumulative discounted GDP gains to over $4 trillion. “Gross Employment Flows in U.S. Coal Mining.” Timothy Dunne and David R. Merrell, Economics Letters, May 2001, v. 71, issue 2, pp. 217-24, May 2001.
This paper examined patterns of job creation and destruction in U.S. coal mining and compared those patterns to known regularities in U.S. manufacturing. Using a unique panel data set of coal mines from 1973 to 1996, this paper found that:
• Annual employment flows in coal mining are substantially higher than in manufacturing.
• High job creation, destruction, and reallocation rates are attributable in part to mine openings and closings.
• A significant amount of job destruction and creation is attributable to temporary shutdowns and re-openings.
66
• Job destruction is counter-cyclical and more volatile than job creation.
III.B. Advanced Coal Power Technologies Commercializing Carbon Capture and Storage. Coolimba Power, 2008. This report assessed the impact of the Coolimba Power Station, a $1billion investment based on a 400 - 450 MW coal fired power station, located in the Mid West region of Western Australia, 270 km north of Perth. Aviva and AES will jointly develop the Coolimba Power project and the Central West Coal mine. The power station will provide up to eight percent of the power for the SWIS network and is designed for future adoption of CCS.
This study found that, as well as reliable and low cost power, the Coolimba Power Station will facilitate economic development in the region, and the report estimated that Coolimba will:
• Contribute at least 600 jobs during construction • In the long term, host 100 permanent jobs for locally housed
employees when commercial operation commences in 2013 • Be a reliable, secure, and competitive power supply for the Mid
West and the SWIS • Inject $1 billion in the region, with indirect and flow-on benefits from
the project creating as many as three times more jobs within the local communities in the longer term
• Encourage the expansion of local commerce for retail, services, and light industrial activities, all of which will provide multiple benefits to the local community
• Unlock the vast potential of the Mid West region • Lead the way in technological innovation and a clean energy future
“Governor Paterson Announces Support For New Advanced Coal Power Plant For Jamestown – First of its Kind in the World.” June 10, 2008.
The New York Oxy-Coal Alliance (“Oxy-Coal Alliance”), a partnership between the Jamestown Board of Public Utilities, New York companies Praxair, Dresser Rand, and Ecology and Environment, Inc., and AES Corporation, Foster Wheeler, Battelle, and SUNY Buffalo, has proposed a demonstration-scale 50 MW oxy-fuel coal plant with CCS. The Oxy-Coal Alliance also provides the opportunity to explore geologic carbon sequestration and a new carbon capture technology (“oxy-fuel,” developed by New York-based Praxair) and create hundreds of construction jobs in the Southern Tier and Western New York.
67
The plant – which would be the first of its kind in the world – will serve as a demonstration facility for a promising new technology that captures CO2 and sequesters it underground for permanent storage. This research holds the potential to give New York firms the ability to launch exports of advanced coal technology to the rest of the world.
The estimated economic impact is approximately 28 new permanent jobs and the retention of 33 permanent jobs at the existing Jamestown plant. In addition to the permanent jobs, the project promises approximately 525 construction jobs.
An initial study conducted by Ecology & Environment (E&E), a Buffalo-based
environmental consulting firm, projects that the Jamestown oxy-coal initiative could have the potential to grow into one of the most significant economic development opportunities in upstate New York. E&E noted that New York State already hosts leading globally-integrated companies that for many years have supplied industrial technologies, power-generation equipment, and components to European, South American, and Asian markets impacted by the Kyoto protocol and carbon-management initiatives. By leveraging their well established business relationships in the power sector, several local western New York companies are well positioned to benefit from the developing oxy-coal global market and the carbon sequestration initiatives that would be showcased in the Jamestown demonstration project.
According to E&E, if local western New York companies begin supplying the Oxy-Coal global market, CCS initiatives are likely to generate $900 Million in annual economic impact and 3,500 new jobs in future years to New York State. Direct annual spending from the global demand for oxygen supply systems, compressors, and carbon dioxide capture systems could potentially total $573 million annually. Initially, the project will create 525 construction jobs over a four to five year period, generate a $50 million regional payroll direct impact, and more than $15 million in regional economic impact. The Economic Impacts of an Electric Power Generation Facility in Illinois. Report prepared by John Lewis and Lisa Bergeron, Regional Development Institute, Northern Illinois University, May 2007.
This report estimated the likely economic impact of the construction and operation of the Taylorville Energy Center (TEC), a 630 MW IGCC clean coal power generation facility proposed to be built by Christian County Generation, LLC. TEC would be the first clean-coal power plant built in Illinois, and would be among the most environmentally-friendly, commercially-sized coal plants in the world. It could make high-sulfur Illinois coal an environmentally viable fuel source.
The NIU report estimated that TEC would generate the following economic impacts. In terms of construction, it would:

68
• Create 1,500 full-time and part-time jobs, with 793 additional jobs created in industries like manufacturing, healthcare, retail, and professional services
• Generate $1.1 billion in direct and indirect economic activity • Provide total employee compensation of $334 million • Generate $9.9 million in total state and local tax revenues In terms of ongoing operations, it would:
• Create 663 direct and indirect jobs in Christian County • Generate $355.9 million in annual economic activity • Provide average annual gross savings to Illinois customers of $190
million during the first eight full years of operation • Provide total annual employee compensation of $24.3 million, with
average power generation facility employee compensation of $57,059 plus benefits -- more than twice the county average of $26,415
• Generate $4.47 million in annual state and local tax revenues
In terms of coal mining, it would: • Create 416 direct and indirect jobs • Generate $78.5 million in annual economic activity • Provide total annual employee compensation of $20.1 million, with
average mining industry employee compensation of $67,650 including benefits -- more than two and a half times the county average of $26,415
• Require more than 1.5 million tons of Illinois coal annually • Generate $9.2 million in annual state and local tax revenues
The report concluded that TEC would be an economic boon to the region, would
help revitalize state's coal industry, and would provide thousands of jobs and hundreds of millions of dollars in investment for central Illinois. It also found that central Illinois would benefit from a regional ripple effect that will create hundreds of new positions in industries such as retail, hospitality, and healthcare. Further, the addition of 630 MW of baseload power would also help stabilize electric rates and provide significant benefit for consumers.

69
Sales and Benefits of Technology from Clean Coal Demonstration Projects. National Energy Technology Laboratory, 2006.
This report presented a summary of sales data and projections that resulted from the Clean Coal Technology Demonstration Program (CCTDP). The data were collected over the years from industry newsletters, journals, websites, and contacts with technology owners, users, and trade associations. Sales were included only for the demonstration technologies and those derived from those technologies.
The technologies that were demonstrated under the CCTDP were established in several broad categories:
• Environmental Control Technologies • Advanced Power Generation • Industrial Technologies • Coal Processing for Clean Fuels
The study found that, in addition to maintaining an adequate supply of affordable
electricity, the CCTDP resulted in several types of benefits to industry participants and the general public. These include technology sales, employment, improved health, and cleaner air.
The CCTDP resulted in substantial sales for the private sector participants, and estimates of past and pending sales are given in Table II.B.1. If no reliable sales prices or estimates could be obtained, the value of the sales was not included in the table.
Table III.B.1
CCTDP Sales and Pending Sales as of June 30, 2006
Technology Type Estimated Sales, $ Pending Sales, $
Environmental Technologies 11,936,955,110 56,940,000,000 Advanced Power Generation 15,306,954,000 6,482,400,000 Other Technologies 526,000 --
Total 27,244,435,110 63,422,400,000 Source: Sales and Benefits of Technology from Clean Coal Demonstration Projects. National Energy Technology Laboratory, 2006.
The report found that the CCTDP resulted in creation of many jobs: Temporary jobs were created during the construction phase of the demonstration projects and permanent jobs were created for those projects that continue to operate as commercial facilities. If actual data were not available, the number was estimated using a method suggested in a personal communication with a participant: The authors assumed that

70
half of the plant cost is due to labor and that one man-year equals $200,000. Jobs resulting directly from the projects also resulted in indirectly induced jobs, which the Bureau of Labor Statistics Estimate Calculation Factors sets at 1.2 induced jobs for each direct job. In addition, a large number of jobs have been created and will continue to be created as the result of sales of the technologies. Specifically:
• Project construction created 1,871 direct jobs and 2,245 induced jobs
• Continued operations created 439 direct jobs and 526 induced jobs • Technology sales created 66,799 man-years of employment • Pending sales created 400,281 man-years of employment
Monetized health benefits due to improved air quality have been estimated in a
number of reports including, “Estimating the Public Health Benefits of Proposed Air Pollution Regulations,” by the Board on Environmental Studies and Toxicology in 2002. It was estimated that by 2010, compliance with the 1990 Clean Air Act Amendments (CAAA) will account for $107.9 billion in annual medical cost savings. The CCTDP has been instrumental in gaining compliance with many of the 1990 CAAA requirements with regard to NOx, SO2, and ozone. The monetized health benefits from reductions in those pollutants alone will amount to $1.96 billion annually. Applying this figure to the nine-year period from 1995 (Phase I compliance under the CAAA of 1990) to 2004 yielded a monetized health benefit of $17.6 billion. Mesaba Energy Project: Report to the Minnesota Public Utilities Commission. Report by Excelsior Energy, Inc., December 2005.
Minnesota law states that an innovative energy project is entitled to a power purchase agreement with a public utility that owns a nuclear generating facility, subject to a finding by the Commission that the PPA is in the public interest. The Mesaba Project – a proposed 606 MW IGCC plant -- is an IEP, and Northern States Power (NSP) is a public utility that owns a nuclear generation facility in the State. The Mesaba Project is thus entitled to sell 450 MW to NSP under a long-term contract, subject to a public interest determination by the Commission. The IEP Statute instructs the Commission to take five specific statutory criteria into consideration in making its public interest finding. The enumerated criteria are a project’s:
• Economic development benefits to the state • Use of abundant domestic fuel sources • Stability of the price of the output • Potential to contribute to a transition to hydrogen as a fuel resource • Emission reductions achieved compared to other solid fuel
baseload technologies
This report evaluated the Mesaba Project in accordance with these criteria and demonstrated that the PPA is in the public interest.

71
The IEP Statute directs the Commission to consider and confirm that the Mesaba
Project will provide economic development benefits to the state. This report found that the economic development benefits of the Mesaba Project will include the creation of
• New jobs • Economic stimulus • Syngas feedstock that can retain and attract other industries to the
state • Stable energy prices that will preserve existing industry and jobs
and create a strong business and investment environment • A cleaner natural environment that will attract and retain human
capital and promote tourism.
The study noted that the Mesaba Project represents one of the largest investments and construction projects in Minnesota history and will be located in an economically depressed region. During its three and one-half year construction period and 30 to 40 years of operation, the Mesaba Project Unit One will provide the Iron Range with needed, skilled jobs and a base for future expansion. In September of 2005, the Bureau of Business and Economic Research at the University of Minnesota, Duluth (UMD) conducted an analysis of Mesaba One. UMD’s economic modeling system estimated that Mesaba One would directly create a total of nearly 3,000 construction jobs on the Iron Range in the peak year of construction, and more than 100 jobs on the Iron Range in a typical year of operation. UMD estimated that Mesaba One would also create jobs indirectly, by inducing the commercial, government, service, and residential industries to create an additional 2,200 jobs statewide related to construction of the facility, and another 360 permanent jobs statewide related to the operation of the facility.
The report also found that Mesaba One will provide significant economic stimulus to the Iron Range and to the state. UMD estimated that the facility’s construction and operations expenditures will both directly and indirectly generate spending on the Iron Range. Excelsior provided UMD with inputs of $1.04 billion in direct spending on construction over a 42 month period to reflect the earliest general estimates of Mesaba One’s capital costs from its contractors and vendors. Based on those inputs, UMD estimated that Mesaba One would also generate economic activity indirectly, by inducing secondary spending across the State of $760 million related to expenditures on construction, and another $90 million annually related to operations.
Since providing those figures to UMD, Excelsior revised several of the
parameters which led it to arrive at those inputs. The net output of Mesaba One was changed from 530 MW to 603 MW, which increased estimates of the overall capital cost. In addition, other increases in capital costs resulted from the decision to allow design flexibility for the plant to use 100 percent PRB coal. More significantly, the prices for commodities and labor have risen for projects across all sectors. Those

72
events led Excelsior’s engineering, procurement, and construction consortium and project engineers to revise their estimates of total project costs upward. These changes indicate that the economic benefits of Mesaba One to the Iron Range and the State will be significantly greater than forecast by UMD. Comparing Statewide Economic Impacts of New Generation from Wind, Coal, and Natural Gas in Arizona, Colorado, and Michigan. Report by S. Tegen, National Renewable Energy Laboratory, NREL/CP-500-38154, August 2005.
This report compared the economic impacts in three states from equivalent new electrical generation from wind, natural gas, and coal. Economic impacts include materials and labor for construction, operations, maintenance, fuel extraction, and fuel transport, as well as project financing, property taxes, and landowner revenues. It examined spending on plant construction during construction years, in addition to all other operational expenditures over a 20-year span.
Specifically, the report compared direct spending in Arizona, Colorado, and Michigan on the new construction and operation of wind power, a natural gas combined-cycle baseload plant, and a coal-fired power plant. For example, it traced the money flow for each new plant and measured which dollars would be spent in Colorado (for example, dollars paid to a Colorado company to purchase concrete for a plant foundation or dollars spent on Colorado concrete workers’ salaries). To facilitate an accurate comparison, spending was calculated based on the same amount of energy generated by each plant -- approximately 2,000,000 MWh per year. This amount of electricity would be generated by a 270 MW natural gas plant with an 87 percent capacity factor. Rate capacities of the coal and wind plants were adjusted so that they would generate the energy equivalent to the gas plant, and coal, gas, and wind comparisons were based on an equivalent amount of energy produced. Factors considered included construction, operations and maintenance, fuel extraction, fuel transport, land leases, financing, and property taxes. The author interviewed industry representatives and energy experts, in addition to consulting government documents, models, and existing literature, and determined that the methodology utilized could be adapted to other contexts for determining the economic effects of new power generation in other states and regions.
The report found that, of the various impacts on state economies involved in power generation over 20 years, in each state equivalent generation of wind power would result in the largest direct economic benefit to the state. Tax revenues – especially for wind plants – play a significant role in the benefits to the states’ economies because a larger tax base makes it possible to provide more funding for public goods, such as parks, roads, and schools. If power plant owners negotiate a deal with localities in which they build so that they are exempt from property and sales taxes, the local economy may benefit from some job creation or fuel sales, but it will not receive potential significant property tax benefits over the life of the plant.

73
The report also found that much of the labor force for plant construction, as well as some for operations, is often brought in from outside each state. When the labor forces for construction or fuel transport come from within the state’s borders, economic impacts can be considerable, regardless of where the fuel is initially extracted. If coal or gas comes from the same state where the power plant is located, the economy is more likely to benefit from the sale of the fuel.
The report concluded that adding new wind power can be more economically
effective than adding new gas or coal power, and that a higher percentage of dollars spent on coal and gas will leave the state. “Department of Energy Selects OUC, Southern Company to Build Clean Coal Technology Plant.” U.S. Department of Energy, 2004.
On October 21, 2004 DOE announced that it had selected the Orlando Utilities Commission and the Southern Company to build a $557 million, advanced coal gasification facility in Central Florida as part of the department’s Clean Coal Power Initiative. The 285 MW plant will be built at OUC’s Stanton Energy Center near Orlando and will gasify coal using state-of-the-art emissions controls. DOE will contribute $235 million and OUC and Southern Company will contribute $322 million. The expected date for commercial operation is early 2010 and groundbreaking sometime in 2007, and OUC and Southern Company will co-own the project. The project was one of two selected to demonstrate advanced power generation systems using IGCC technology, The announcement emphasized that clean energy technologies like those pioneered here mean jobs for this region, including high tech, highly skilled jobs. DOE estimated that this project will account for more than 1,800 jobs, which will help continue the expansion of Orlando’s economy. III.C. Coal-to-Liquids Operations Producing Liquid Fuels from Coal: Prospects and Policy Issues. Report prepared for the United States Air Force and the National Energy Technology Laboratory by James T. Bartis, Frank Camm, and David S. Ortiz of the RAND Corporation, 2008.
This study analyzed the costs, benefits, and risks of developing a U.S. CTL industry that is capable of producing liquid fuels on a strategically significant scale. The RAND research approach consisted of the following basic steps:
• To understand commercial development prospects, the study examined what is known and not known regarding the economic and technical viability and the environmental performance of commercial-scale CTL production plants.

74
• To quantify benefits and understand how the large-scale introduction of unconventional fuel sources might affect both the world price of oil and the well-being of oil consumers and producers, it developed a model of the global oil market designed to allow comparisons of policy alternatives in the face of inherent uncertainties about how various aspects of the market might behave in the future.
• To investigate how integrated packages of public policy instruments could encourage investment in unconventional-fuel production plants, RAND reviewed fundamental aspects of contract design and developed a financial model to determine how those incentive packages might affect the rate of return to investors and the net present value of cash flows between such plants and the government.
• The study took into account two overarching policy goals: Reducing dependence on imported oil and decreasing greenhouse-gas emissions.
The study had relatively little to say about economic or jobs implications of CTL
development; specifically:
“The development of a domestic CTL industry will cause new jobs to be created, especially in those states in which CTL plants would be built. These are likely to be the states holding the largest fraction of U.S. coal reserves. Employment opportunities are currently limited in several of these states, and many members of their governments view CTL development as supportive of state and regional economic development. The broader effect of CTL development on national employment is less clear. If macroeconomic factors are such that the nation is near full employment, which has been the case for most of the last two decades, the labor demands associated with CTL development will be met either by declining employment in other sectors of the economy or by additional immigrant labor.”
Intelligent Energy Choices for Kentucky’s Future: Kentucky’s 7-Point Strategy for Energy Independence. Report prepared for Governor Steven L. Beshear, November 2008.
This state energy plan is designed to improve the quality of life for Kentucky residents by creating efficient, sustainable energy solutions and strategies, protecting the environment, and creating a base for strong economic growth. Kentucky’s plan:
• Incorporates recommendations to improve energy efficiency for Kentucky’s homes, businesses, and transportation fleet

75
• Provides a framework from which the state can increase its use of renewable energy sources
• Discusses the potential for biofuels, coal-to-liquids, and coal-to-gas technologies
• Recommends the initiation of an aggressive carbon capture/ sequestration program for coal-generated electricity.
• Provides a discussion of how Kentucky could initiate and grow safe and reliable nuclear power for electricity generation
The plan estimated that by 2025 Kentucky could accomplish the following:
• Provide 30,000-40,000 new Kentucky jobs as a result of a booming
diversified energy sector -- at least 12,000 directly in the new energy producing sector (3,500 from coal-to-liquids production; 1,800 producing fuels from biomass; 1,700 at coal-to-gas facilities; 4,400 at nuclear plants; and 1,000 at other “green collar,” or renewable energy, industries), and 20,000-25,000 induced jobs -- jobs which provide indirect support to the new energy industry. The increase assumes sustaining current employment and maintaining annual coal production in Kentucky at current levels, with coal mining employment at 17,000.
• Achieve energy independence for Kentucky from imported oil • Produce annually four billion gallons of liquid fuels from coal
(utilizing about 50 million tons of coal annually) • Produce annually 135 billion cubic feet of synthetic gas from coal
(utilizing about nine million tons of coal annually) to augment Kentucky’s natural gas supply
• Reduce the net per capita carbon emissions into the atmosphere by 50 percent, while ensuring Kentucky’s economic viability by protecting the state’s coal industry against negative impacts of federally mandated carbon management legislation. This will be accomplished by the combination of implementing CCS and building nuclear and renewable generating capacities.
American Energy Security: Building a Bridge to Energy Independence and to a Sustainable Energy Future. Southern States Energy Board, Norcross, Georgia, July 2006.
This report presented the American Energy Security study, a national initiative led by the Southern States Energy Board (SSEB). It developed a plan for the U.S. to establish energy security and independence through the production of alternative oil and liquid fuels from its domestic resources that include coal, biomass, and oil shale. The plan also emphasizes the need for improved domestic enhanced oil recovery programs using carbon dioxide, increased voluntary transportation fuel efficiency, and

76
sensible energy conservation. The study found that the U.S. faces four serious oil-related risks:
• Excessive dependence on the OPEC cartel and on other unstable foreign oil suppliers
• Conventional oil supplies are not meeting dramatic increases in world demand
• Rapidly increasing global competition for oil from China, India, and other nations
• Supply disruptions from natural disasters, political causes, and potential terrorism
The study showed that the U.S. can become energy secure and independent by
2030, and a major goal of the analysis was to show how the U.S. can replace approximately five percent of imported oil each year for 20 years, beginning in 2010. A key to this plan will entail building multiple alternative liquid fuel plants each year, and this will require an enormous effort and commitments from industry, government, and the American people.
The study demonstrated that embarking on a national mission to achieve energy
security and move toward liquid fuels independence will not only reduce risk and lower oil prices and oil price volatility, it will also facilitate an industrial boom, create millions of jobs, foster new technology, enhance economic growth, help to eliminate the trade and budget deficits, insure affordable energy for citizens and strategic fuels for the military, and establish a reliable domestic energy base on which to rebuild U.S. industries to be globally competitive. The study demonstrated that by 2030, the SSEB initiatives would generate annually (2005 dollars):
• New investments of nearly $200 billion • One-third of a trillion dollars in increased industry sales • More than 1.4 million new jobs • $14 billion in profits • Nearly $100 billion in increased federal, state, and local
government tax revenues • A reduction of over $600 billion in the U.S. trade deficit
The report estimated the impacts of the SSEB initiatives on economic output and
employment within detailed sectors and industries. In general, in terms of industry sales and jobs it found that throughout the forecast period the construction, petroleum and coal products, mining, professional, scientific, and technical services, oil and gas, motor vehicles, forestry, farming, and related industries would be major beneficiaries. For example, in terms of total industry sales:

77
• In 2020, sales in the construction industry increase by $25 billion
and in 2030 sales increase by $30 billion. • In year 2020, sales in the petroleum and coal products industry
increase by $10 billion and in 2030 sales increase by $30 billion. • In 2020, mining industry sales increase by $7 billion and in 2030
sales increase by $12 billion. • In 2020, sales in the professional, scientific, and technical services
industry increase by $9 billion and in 2030 sales in this industry increase by $13 billion.
• In 2020, sales in the farming industry increase by $5 billion and in 2030 sales increase by $36 billion.
• In 2020, sales in the oil and gas industry increase by $7 billion and in 2030 sales increase by $30 billion.
• In 2020, sales in the motor vehicles industry increase by $14illion and in 2030 sales increase by $17 million.
The increases in industry employment in each year are analogous to the
increases in industry sales, although there are some differences due to the different productivity and labor intensity structures among industries. For example, in terms of jobs:
• In 2020, 190,000 jobs are created in the construction industry and
in 2030 207,000 jobs are created in this industry. • In 2020, 48,000 jobs are created in the professional, scientific and
technical services industry and in 2030 63,000 jobs are created in this industry.
• In 2020, 41,000 jobs are created in the fabricated metal products industry and in 2030 44,000 jobs are created in this industry.
• In 2020, 47,000 jobs are created in the wholesale trade industry and in 2030 56,000 jobs are created in this industry.
• In 2020, 27,000 jobs are created in the mining industry and in 2030 48,000 jobs are created in this industry.
• In 2020, 24,000 jobs are created in the farming industry and in 2030 158,000 jobs are created in this industry.
• In 2020, 15,000 jobs are created in the forestry industry and in 2030 75,000 jobs are created in this industry.
• In 2020, 12,000 jobs are created in the oil and gas industry and in 2030 65,000 jobs are created in this industry.
The report disaggregated the employment generated by the recommended
initiatives into occupations and skills. It found that the jobs generated are concentrated in fields related to the construction, energy, and industrial sectors, reflecting the requirements of the SSEB initiatives and their supporting technologies and industries. Thus, the SSEB initiatives will revitalize large sections of U.S. industry and create disproportionately large numbers of jobs for professional, technical, and skilled

78
occupations such as civil engineers, electricians, geoscientists, machinists, mechanical engineers, petroleum system and refinery operators, welders, and software engineers.
These requirements will create an especially robust labor market and greatly
enhanced employment opportunities in many industries and in professional and skilled occupations such as chemical, mechanical, electronics, petroleum, and industrial engineers; electricians; sheet metal workers; geoscientists; computer software engineers; skilled refinery personnel; tool and die makers; computer controlled machine tool operators; industrial machinery mechanics, electricians; oil and gas field technicians, machinists, engineering managers, electronics technicians, carpenters; welders; and others. However, it is also important to note that millions of jobs will be created at all skill levels for occupations such as laborers, farm workers, truck drivers, security guards, managers and administrators, secretaries, clerks, service workers, and so forth. Thus, workers at all levels in all sectors will greatly benefit from the SSEB initiatives. III.D. Coal Gasification and Enhanced Oil Recovery Underground Coal Gasification: Industry Review and an Assessment of the Potential of UCG and UCG Value Added Products. Report prepared by PricewaterhouseCoopers, May 2008.
This report estimated the potential economic benefits arising from underground coal gasification (UCG) development within Queensland, Australia and the potential royalty payments which may be associated with UCG production. The economic analysis only considered the production of useable syngas from the UCG process and did not consider the benefits or impacts of further processing or value added to produce, for example, FT liquid fuels, SNG, or chemicals.
PricewaterhouseCoopers used an input-output framework to estimate the economic impact of UCG development within Queensland to determine the significance of this industry’s development to the state economy. An illustrative assessment of potential UCG production was calculated as a proportion of raw coal production (by energy) in 2006/07. Four scenarios were considered:
• Scenario 1: In 10 years UCG production will represent 10% of current coal production
• Scenario 2: In 10 years UCG production will represent 7.5% of current coal production
• Scenario 3: In 10 years UCG production will represent 5% of current coal production
• Scenario 4: In 10 years UCG production will represent 2.5% of current coal production.

79
For each scenario, a ramp-up period was assumed, increasing from 2% in 2009 (year 1) to 50% in 2015 (year 7) and 100% in 2018 (year 10). The price of UCG was based on the estimated sales price of gas, which was estimated at $4/GJ, and the cost incurred by the industry in the production of UCG was based on the major costs faced by the coal sector. It was also assumed that 75% of total spending in the UCG industry would stay in Queensland, and thus that the remaining 25% would be spent outside of Queensland and therefore would not contribute to the Queensland economy.
The estimated gross impact on the Queensland economy of the activities associated with UCG production under each scenario was estimated. The results showed that the gross economic benefit is estimated to increase from $12 million in 2009 to around $592 million in the 20 year period to 2028 under Scenario 1. Further, a UCG industry was estimated to generate around 16 full time equivalent positions within Queensland in the 2009 period under Scenario 1. This number was estimated to increase to about 820 full time equivalent positions by 2028. FutureGen: The Economic Impacts of Clean Coal for Illinois. Report prepared by Ira Altman, Department of Agribusiness Economics, College of Agricultural Sciences, Southern Illinois University-Carbondale, June 2007.
This study estimated that the economic impact of locating a coal gasification and carbon sequestration project in either Coles County or Douglas County would result in significant positive economic activity for the state of Illinois and the local economy. Impact results were estimated using IMPLAN Professional Version 2.0® for two models: A state level model and a two county model.
The report concluded that FutureGen would have a much larger impact than the
1,300 construction jobs and 150 permanent jobs that DOE estimates will be created. The study showed that during the four-year construction period, there would be more than $1 billion in economic impact statewide and 1,225 indirect and induced spin-off jobs created as a result of the economic ripple effect generated by FutureGen. Once the facility is operational, the study estimated that FutureGen would generate $135 million annually in total statewide economic output, with an $85 million annual increase in Coles County alone.
Report highlights included the following impacts from the operation of a coal gasification facility:
• $135 million increase in statewide economic output from facility operation
• $34 million increase in statewide labor income from facility operation
• $91 million increase in statewide value added from facility operation • $11 million increase in tax revenues from facility operation • An increase of 510 jobs in Illinois from facility operation

80
• $258 million increase in statewide economic output from construction
• $116 million increase in statewide labor income from construction • An increase of 2,525 jobs in Illinois from construction • $85 million increase in local economic output • $20 million increase in income for local labor • $59 million increase in local value added • $8.1 million increase in taxes • An increase of 360 new jobs to the local area
“NRG Energy, Inc. Receives Conditional Award to Build Advanced Coal-Gasification Power Plant in Western New York: Will Enter into a Strategic Alliance with NYPA.” Company Release, 12/19/2006.
In December 2006, NRG Energy, Inc. received a conditional award of a contract from the New York Power Authority to build an innovative, 680 MW IGCC plant at its Huntley facility in Tonawanda, New York. The project, which represents a total project cost of approximately $1.5 billion, was scheduled to go into commercial operation in 2013. Unlike other clean coal technologies, this plant can be designed to capture and sequester carbon from the first day of operation. Construction was planned to begin by 2008.
While NRG's proposal was selected, the award was "conditional" in that the cost of the IGCC technology was above current market pricing for new coal plants using more traditional technology that does not have the CCS option. NRG and NYPA are establishing a strategic alliance to pursue tax credits or other federal and/or state funding sources to bridge this economic gap.
The proposed IGCC facility would have been located adjacent to the existing Huntley Generating Station and would have utilized existing plant infrastructure such as rail, coal handling, and water and transmission facilities. The project was to utilize NRG's experienced skilled workforce and would have added an additional 100 full time jobs and over 1,000 new jobs during construction.
In February 2009, state officials cancelled the plant, stating that it would cost taxpayers too much and relied on technology that remains unproven. State Power Authority officials said that, even after intense efforts over 18 months, the proposed 680 MW power plant at the Huntley Station would have required annual subsidies of $175 million to $250 million.

81
Recovering “Stranded Oil” Can Substantially Add to U.S. Oil Supplies. A series of reports prepared for the U.S. Department of Energy, Office of Fossil Energy, by Advanced Resources International, 2006.
This series of reports prepared for the DOE Office of Fossil Energy indicated significant potential for increasing domestic oil supplies. This could result from applying carbon dioxide enhanced oil recovery (CO2-EOR) technology to recover nearly 89 billion barrels of additional oil from currently “stranded” oil resources in ten regions of the U.S. The reports summarized the results of basin-oriented CO2-EOR assessments prepared by ARI for DOE’s Fossil Energy Office of Oil and Natural Gas.
The reports revealed the potential for expanding the contribution of this technology for recovering crude oil from mature domestic oil fields. In addition, the reports assessed the performance of CO2-EOR projects conducted in the U.S over the past 30 years, reviewing both successful and unsuccessful efforts. The ten assessments evaluated 1,581 large oil reservoirs to identify those that screen favorably for CO2-EOR, and extrapolating this sample to all reservoirs in the ten regions demonstrated that nearly 89 billion barrels of additional oil are technically recoverable with current state-of-the art CO2-EOR technology. Advanced EOR technologies could significantly increase this oil recovery potential.
The reports determined that overcoming the barriers to the wider use of CO2-
EOR technologies may entail:
• Bringing state-of-the-art CO2-EOR technology to oil fields in regions where it is currently not yet applied
• Lowering the risks inherent in applying new technology to complex oil reservoirs by conducting research, pilot tests, and field demonstrations of CO2-EOR in geologically challenging oil fields
• Providing a package of “risk mitigating” actions, such as state production tax incentives, federal investment tax credits, and royalty relief, to reduce potential oil price and market risks and to improve the economic competitiveness of pursuing this domestic oil resource
• Establishing low-cost, reliable “EOR-ready” CO2 supplies from both
natural and industrial sources The studies concluded that these “basin-oriented strategies” could help revitalize
state economies, increase federal and state revenues, and enable additional domestic oil to be recovered. They estimated that the potential benefits are substantial, and that 89 billion barrels of additional domestic oil recovery, at $40 per barrel, could yield:

82
• A reduction in the U.S trade deficit of over $3.6 trillion through
reduced oil imports • Enhanced national energy security from an additional 2 to 3 million
barrels per day of domestic oil production by 2020 • Over 200,000 high-paying domestic jobs from the direct and
indirect economic effects of increased domestic oil production • Over $800 billion of additional federal, state and local revenues
from royalties, production, and corporate income taxes
However, the jobs estimate is open to question. In a 2005 presentation based on these studies David Beecy, Director of DOE’s Future Oil and Gas Resources Office of Oil and Natural Gas/Office of Fossil Energy, stated that, if 43 billion barrels of additional domestic production substituted for oil imports at $40/bbl the following would result:1
• Over $1.7 trillion reduction of U.S. wealth transfer to oil exporters, through trade deficit reduction would be avoided
• Over 500,000 high-paying domestic jobs from direct and indirect economic effects of increased oil production would be created
• Over $400 billion of state and local revenues would be generated in lieu of other revenue sources
• Broad-based state oil development investments would occur • The robust domestic oil production sector could be producing more
oil (and public revenues) in 2025 than at present
Clearly, the estimate of 200,000 jobs being created by 89 billion barrels of additional domestic oil recovery at $40 per barrel is inconsistent with an estimate (from the same source) of 500,000 jobs being created by 43 billion barrels of additional domestic oil recovery at $40 per barrel. Inquiries to ARI and DOE failed to resolve this serious discrepancy. ARI deferred to DOE on the jobs estimates. Conversations with DOE indicated that documentation of the jobs estimates was not available, the staff responsible for the jobs estimates had retired, and that DOE was unsure how these estimates had been derived.
1David Beecy, “Opportunities for Increasing Revenues from State and Federal Lands: Pursuing the ‘Stranded Oil’ Prize,” presented at the Eastern Lands And Resources Council and Western States Land Commissions Association Joint Spring Conference, Washington, D.C., April 17-20, 2005.
83
CO2-Enhanced Oil Recovery Resource Potential in Texas: Potential Positive Economic Impacts. Texas Bureau of Economic Geology, April 2004.
This report noted that Texas is currently the leader in CO2-EOR, producing 3 to 4 times the volume of the rest of the states combined, and that there is potential for significant growth in CO2-EOR in Texas. Conservative estimates predict an economic value of over $200 billion and the creation of 1.5 million jobs.
To assess the CO2-EOR resource base, additional incremental oil recovery potential, and reduction of greenhouse gas emissions through geologic sequestration, the report examined the geologic and engineering characteristics for all 3,000 significant oil reservoirs in Texas. Screening criteria were used to identify 1,730 reservoirs as candidates for this technology. These candidate reservoirs represent 80 billion bbls of original oil in place, of which 31 billion bbls is residual oil. The residual oil is the target for CO2-EOR.
Estimates of the value of CO2-EOR to the State of Texas were based on the Texas Railroad Commission's "General Model of Oil and Gas Impact on the Texas Economy" derived from the Texas Comptroller's input-output model of the Texas economy. The report estimated that:
• Assuming that 10 percent of the CO2-EOR target is converted into
production in the future, the wellhead value is $78 billion, the economic value is $226 billion, and about 1.5 million jobs will be created for the citizens of Texas.
• Assuming that 50 percent of the CO2-EOR target is converted into production in the future, the wellhead value is $388 billion, the economic value is $1,128 billion, and about 7.4 million jobs will be created for the citizens of Texas.
• Assuming that 100 percent of the CO2-EOR target is converted into production in the future, the wellhead value is $775 billion, the economic value is $2,255 billion, and about 15 million jobs will be created for the citizens of Texas.
III.E. Carbon Capture and Sequestration Operations Clean Energy, a Strong Economy, and a Healthy Environment. report of the Clean and Diversified Energy Advisory Committee to the Western Governors, Western Governors Association, June 2006.
This report presents the recommendations of the Clean and Diversified Energy Advisory Committee (CDEAC) to the Western Governors Association. In April 2004 the Western Governors’ Association held the North American Energy Summit, which brought together more than 700 participants to discuss a broad range of energy issues.

84
Two months later, the Governors launched the Clean and Diversified Energy Initiative with the adoption of a resolution that established three important goals for the West: 1) Develop an additional 30,000 megawatts of clean energy by 2015 from both traditional and renewable sources; 2) Achieve a 20 percent increase in energy efficiency by 2020; and 3) Ensure a reliable and secure transmission grid for the next 25 years.
CDEAC was commissioned by the Western Governors to identify technically and financially viable policy mechanisms, stressing non-mandatory, incentive-based approaches, to meet the goals established in the Governors’ resolution. CDEAC was to be guided by the Western Governors’ Enlibra principles, a doctrine created to guide natural resource and environmental policy development and decision-making in the West. In developing these recommendations, CDEAC was required to examine the deliverability and adequacy of energy resources, including an assessment of promising new resources and technologies; examine the obstacles to both intrastate and interstate transmission siting and construction in order to access clean energy resources; consider price, reliability, and the mitigation of environmental impacts of all recommendations; develop energy efficiency and conservation recommendations that take into account all types of energy used in facilities, not just electricity; and address both technical and policy issues.
CDEAC established task forces to assess resource potential and costs and to develop policy recommendations to meet the Governors’ goals. The task forces that submitted reports were Advanced Coal, Biomass, Energy Efficiency, Geothermal, Solar, Transmission, and Wind. These task forces worked in cooperation with a quantitative working group to provide consistent economic data across the reports and developed their reports through a series of meetings and conference calls. CDEAC held meetings throughout the drafting of the task force reports, providing guidance when necessary. Final reports from each of the task forces were published throughout the early months of 2006 and presented to CDEAC.
Additional proposals were submitted to CDEAC as white papers in order to identify clean energy resources that went beyond the scope of the task forces chartered by the CDEAC. Combined heat and power was considered as a potential attribute in a number of areas, and the CDEAC reviewed a white paper on this subject. Additionally, the CDEAC reviewed a white paper on ocean- and hydro-power. A report on advanced natural gas was received too late for the CDEAC to formally consider.
Based on the reports and white papers it reviewed, CDEAC produced a
consolidated suite of recommendations for Western Governors to consider at their 2006 Annual Meeting in Sedona, Arizona. A strong, overarching theme of all the reports is the need for stable, long-term policies at both the federal and state levels to achieve the stated objectives. This report represents the work of the CDEAC and more than 250 stakeholders from an encompassing array of interests.

85
Western Coal at the Crossroads. Report prepared by Western Resource Advocates, April 2006. This report recommended that the West focus on energy efficiency, renewable resources, and combined heat and power to meet increasing electricity requirements. However, if policymakers decide that new coal-fired baseload capacity is needed, it recommended that western coal be used in IGCC plants instead of a new round of pulverized coal power plants, and assessed the risks of lost western coal sales and associated tax and royalty revenues accruing to western governments if the West fails to take steps to demonstrate IGCC using western coal. It developed a series of recommendations that western state governors and other western energy decision makers could take to jump-start IGCC with western coal.
The study assessed a portion of the impact of coal production on the economy of western states and tribes on whose lands coal production occurs. The impacts included annual taxes, royalties, and other payments made by coal producers to western states, local governments, and tribal treasuries. It compiled specific information on severance taxes, federal royalties remitted to the states, local property taxes paid, and other payments made by coal producers in the eight western states analyzed. It also included information on employment in coal production, payroll and benefits, tonnage shipped, FOB value of the coal, and “delivered value” of the coal.
The authors noted that the contribution to “public revenues” by coal producers in
the West falls short of a complete picture of the economic impact of western coal production. It does not include taxes paid by the employees of coal producers, the economic multiplier effect of expenditures made by coal producers, the indirect economic activity of businesses that are closely related to coal production, or state taxes on the activity of closely related businesses, for this information is practically impossible to obtain.
The report found that the total direct annual contribution by coal producers to
“public revenues” was $868.5 million in 2004. However, the authors felt that this estimate is conservative, since in most states they did not have complete data, such as state income taxes paid by coal producers. The report also estimated direct employment, indirect employment, and payrolls for eight of the jurisdictions. However, these data were also incomplete.

86
III.F. Oil and Gas Programs “RE&EE in Colorado Compared to the Oil and Gas Sector,” Chapter IX in Defining, Estimating, and Forecasting the Renewable Energy and Energy Efficiency Industries in the U.S and in Colorado. American Solar Energy Society and Management Information Services, Inc., December 2008.
At the request of the Governor’s Energy Office, the economic impact of the
RE&EE sector was compared to that of the Colorado oil and gas sector, as estimated by the Colorado Energy Research Institute at the Colorado School of Mines. The CERI study estimated the economic and employment impacts on Colorado of the oil and natural gas (O&G) industries in the state, as directed by the Colorado Legislature. Comparison of the CERI estimates with those derived for RE&EE provided perspective on the relative impacts of these energy sectors on the state economy and labor market. The comparative impacts of the sectors are illustrated in Figures III.F.1 and III.F.2:
• Figure III.F.1 shows the economic and jobs impact on Colorado of the aggregate EE&RE sector and the aggregate O&G sector
• Figure III.F.2 illustrates the same information for RE, EE, O&G extraction, and O&G drilling, completion and recompletion
Figure III.F.1 Comparative Economic and Jobs Impact in Colorado
of the RE&EE Sector and the O&G Sector
0
2
4
6
8
0
2
4
6
8
0
2
4
6
8
1
Revenues (lef t axis) Jobs (right axis)
Source: Management Information Services, Inc., 2008.

87
Figure III.F.1 shows that, in terms of revenues, the O&G sector in Colorado is
more that 50 percent larger ($5.7 billion) than the EE&RE sector. However, the RE&EE sector generates about 70 percent more jobs (39,000) than the O&G sector. Thus, the RE&EE sector in Colorado generates (directly and indirectly) more than 2.5 times as many jobs per dollar of revenues as does the O&G sector in the state. Figure III.F.2 disaggregates these data into the two component parts of each sector and illustrates that jobs generation per dollar of revenues differs dramatically among the four industries:
• RE generates about 9,300 jobs per billion dollars of revenues • EE generates about 8,900 jobs per billion dollars of revenues • O&G drilling, completion, and recompletion generates about 16,000
jobs per billion dollars of revenues • O&G extraction generates about 2,200 jobs per billion dollars of
revenues
Figure III.F.2 Comparative Economic and Jobs Impact in Colorado of
RE, EE, O&G Extraction, and O&G Drilling, Completion and Recompletion
0
2
4
6
8
0
2
4
6
0
2
4
6
8
1
Revenues (left axis) Jobs (right axis)
Source: Management Information Services, Inc., 2008.
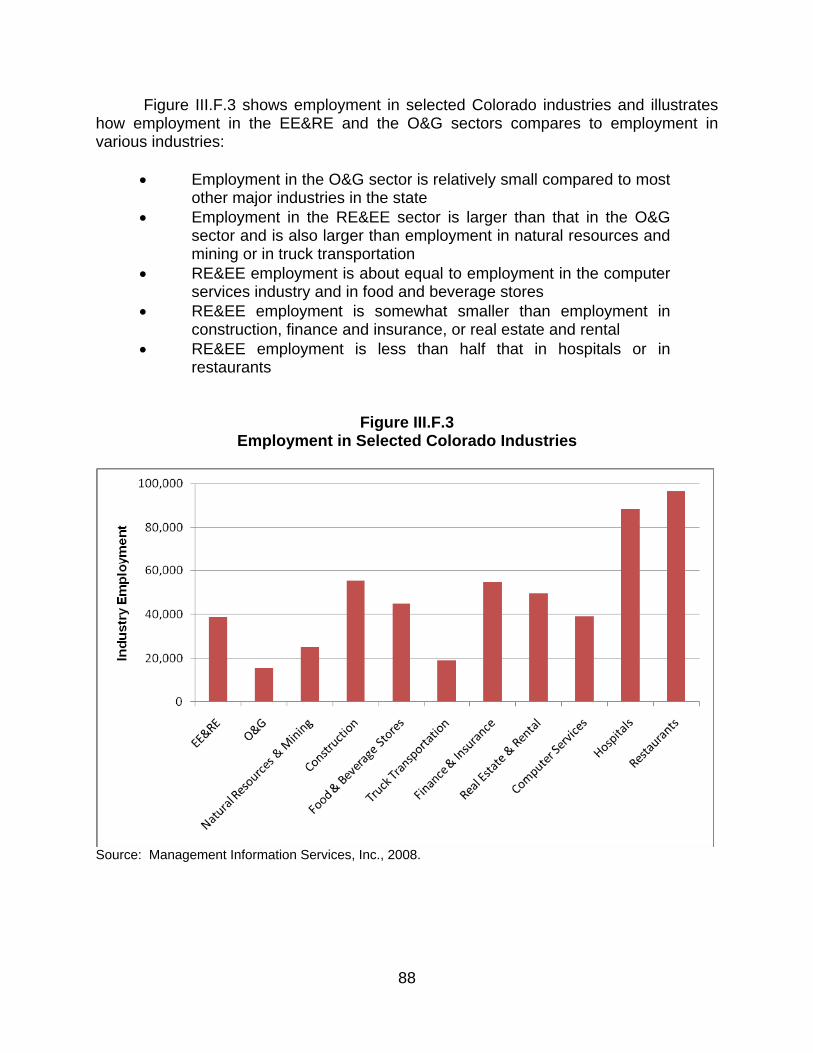
88
Figure III.F.3 shows employment in selected Colorado industries and illustrates how employment in the EE&RE and the O&G sectors compares to employment in various industries:
• Employment in the O&G sector is relatively small compared to most other major industries in the state
• Employment in the RE&EE sector is larger than that in the O&G sector and is also larger than employment in natural resources and mining or in truck transportation
• RE&EE employment is about equal to employment in the computer services industry and in food and beverage stores
• RE&EE employment is somewhat smaller than employment in construction, finance and insurance, or real estate and rental
• RE&EE employment is less than half that in hospitals or in restaurants
Figure III.F.3 Employment in Selected Colorado Industries
Source: Management Information Services, Inc., 2008.
89
Project Methodology & Model Implementation Plan EPAct Project: Valuing Domestically Produced Natural Gas and Oil. Report prepared by Randall Jackson, West Virginia University, Lisa Phares, National Energy Technology Laboratory, and Christa Jensen, West Virginia University, DOE/NETL-404.03.02/100608, October 6, 2008.
In August 2005, President Bush signed the Energy Policy Act of 2005 (EPAct) into law, and technologies supported by EPAct funding are expected to increase U.S. natural gas and oil production while lowering production costs. This report described a project designed to develop a model that will facilitate a national and regional economic analysis of the potential impacts of offsetting imports by increasing domestic natural gas and oil production in areas likely to be impacted by this R&D program. Because this project is being conducted prior to the development of EPAct-related technologies, it does not intend to capture the impact of deploying new, potentially game-changing technologies into the market. Rather, this analysis intends to serve as a baseline of potential impacts that could be derived using present-day technologies.
The project is designed to estimate the economic impacts of industry-based activity associated with converting new and existing reserves into production and moving this product to the point of refinement or processing. In the case of natural gas, processing is included within the scope of this project. The incremental value of these activities is defined as the net value of the new domestic production activities less the value of imported supply activities within the U.S.
This research is distinguished from other research efforts in three major dimensions:
• First, this project rests on a foundation of comprehensive oil and gas production and demand data specific to five primary production basins. Model data are drawn from a wide range of sources and compiled under a comprehensive framework.
• Second, this project conjoins the foundation data above with a macroeconomic modeling framework at both national and sub-national regional scales.
• Third, the method of modeling import substitution developed and implemented in this project differs from previous approaches, both by design and of necessity given the focus on sub-national regional economic impacts.
The scope of the project is the economic analysis of regional and national direct,
indirect, and induced impacts of the substitution of domestic oil and natural gas production for imports on a variety of economic factors, including output, jobs, income and Federal and state taxes. Further, if possible, the model will estimate level changes to total governmental spending (due to increased tax and/or royalties revenue) and consumer expenditures. This analysis will be conducted for five state or multi-state sub-national regions and for the U.S. as a whole.
90
The project focused on capturing the incremental, comparative value of replacing
imports with domestically sourced on-shore oil and natural gas in various regions of the U.S. as well as in the national context. Because the goal of this project is specific, the project must employ scope boundaries. Therefore, a critical decision point in this project is the determination of what will and will not be included in the model and the resulting analysis.
For both natural gas and oil, the project boundary encompasses raw material extraction and transmission of this raw material to a processing facility. Since new pipelines will likely be required, the analysis will incorporate pipeline construction costs on a per well and average distance basis.
A primary assumption of this project is that additional domestic production is displacing current dry natural gas and crude oil production in a 1:1 ratio. Therefore, new transportation infrastructure is not expected to be required to move processed natural gas or processed crude oil out of a refinery. Should such infrastructure be required by the region, this impact is not captured within the boundary of this project.
The scope of this project is also bounded by assumptions on supply displacement. In the model constructed and the subsequent analysis, it is assumed that domestic production will only displace natural gas imported via pipelines or as LNG and crude oil and will not impact refined oil product imports.
The project will also incorporate an element of time. EPAct activities begin in 2007, although many of the technologies aimed at increasing domestic production are not expected to become commercially available until after 2008. However, this project is focused on impacts of increasing production in regions that are home to resources targeted by EPAct, such as unconventional natural gas and oil reserves, and does not attempt to estimate the impacts derived from EPAct technologies, per se.
Effects on prices and behavioral responses to relative price changes lie outside the project system boundary. It is reasonable to assume that changes in fuel prices due to increased domestic fuel production would lead to shifts in electric generation shares from one fuel to another, potentially leading to impacts on end-user average electricity prices. However, given the level of industry aggregation, the shift in generation shares would occur within the same aggregate sector, and no impact could be thus detected. Impacts on end-user average electricity prices therefore will not be captured.
The project incorporates several assumptions into the study design, and to isolate the value of increasing domestically produced natural gas and oil, a primary assumption is that increased domestic production replaces imported supplies in a volumetrically one-to-one relationship, therefore leaving the total supply of energy resources within a region and/or the U.S. unaffected by increased domestic production. Specifically, the modeling approach assumes that:
91
• Domestic crude displaces imported crude only • Domestic crude is materially equivalent to imported crude in terms
of processing requirements • Domestic natural gas displaces imported LNG and pipeline imports • New regional production will be used within the region to the extent
that the region is under-supplied; beyond this point new production will be exported beyond the region’s borders in proportion to the existing export destination distribution
Average transportation distances will be applied to the analysis to facilitate the
calculation of required pipeline distances for new and displaced oil and natural gas supplies. Further, the project’s researchers recognize that oil and natural gas supplies are often purchased from suppliers through long-term contracts. Therefore, to accommodate the injection of new domestic supply and the displacement of imports, it is assumed that a significant portion of imported supply is held under short- to medium-range contracts such that new domestic supply can displace imports without causing implied contractual infractions.
It is assumed that resources exist to meet employment, material, and service demand of increased domestic production. Other assumptions consistent with the economic input-output modeling framework will be adopted for this analysis.
The output of the model will be in monetary terms, and all output will be in 2006 constant dollars, which is consistent with the model’s input data. If, and as needed, deflators will be based on IMPLAN. As part of the modeling and results analysis process, the project team will compare the inputs and model results from this project to those in other comparable studies. Oil and Gas Impact Analysis. Report prepared by Booz Allen Hamilton for the Colorado Energy Research Institute, June 2007. This project, guided by Colorado legislative directive, was designed to evaluate the economic contribution of the oil and gas industry to the State of Colorado in terms of employment, income, industry output, and taxes. Booz Allen Hamilton (BAH) used a regional economic modeling approach to evaluate the contribution of the industry to different regions (for example, multi-county basins and the state as a whole). The approach included an extensive effort to gather site specific information needed to complete the analysis, such as capital investments, average cost to drill and complete a well, average production costs, private royalty and lease payments, and service company costs.
Secondary source data were also obtained, including number of wells drilled and completed for each basin, oil and gas prices, oil and gas production, employment, etc. The primary and secondary data were then used in combination with a regional economic model, IMPLAN, to estimate economic contributions. In addition, fiscal
92
models were developed to estimate state and local business and income tax revenues from oil and gas activities in Colorado.
The study findings indicated that there were approximately $21.0 billion in total economic contribution for drilling, completion, recompletion, and extraction activities in 2005, 90 percent of which is attributed to extraction activities. Including private mineral royalty and lease payments and extraction tax impacts, total economic contribution for all oil and gas related activities within Colorado was estimated to total $22.9 billion. This did not include large development expenditures such as new regional pipeline development or building new facilitates, nor did it include gathering and in-basin transportation investments and expenses associated with the extraction industry.
Oil and gas activity within the state employs approximately 71,000 people. The employment multiplier measures the amount of additional employment generated as a result of direct employment associated with oil and gas activities. For example, for every one direct job generated as a result of oil and gas activities, there is an additional 1.67 indirect and induced jobs generated by this activity.
BAH estimated that oil and gas activities contribute to the economic well-being of many other industries within the Colorado as well. From all of the oil and gas activities in the State (including extraction taxes and mineral royalty payments), approximately 22 percent of the employment is specific to the oil and gas industries, followed by 14 percent in government, nine percent in professional services, eight percent in retailing, and seven percent in health care and social services. These are the major industries impacted by oil and gas activities within the state in terms of employment. Labor earnings within the oil and gas sectors comprise 41 percent of total labor earnings from all oil and gas activities within Colorado. Other industries that benefit in terms of the total amounts paid to workers from oil and gas activities include government (11 percent), professional services (nine percent), finance and insurance (five percent), and health care and social services (five percent). The industries that benefit most in employment and labor earnings as indirect economic effects of the oil and gas industry are state and local governments and professional services.
The study found that oil and gas activities within Colorado account for approximately 6.1 percent of the state’s total industry revenues, 2.2 percent of employment, and 3.2 percent of total earnings. In general, the oil and gas activities, including private mineral royalty payments and extraction taxes, generate average earnings of approximately $61,000 -- 32 percent higher than the state average.
93
IV. STUDIES OF FEDERAL GOVERNMENT PROGRAMS, DOE AND FEDERAL LABORATORY PROGRAMS AND INITIATIVES, AND EMPLOYMENT IMPACT
STUDIES IDENTIFIED FOR OTHER ENERGY AREAS IV.A. Federal Government Programs
IV.A.1. Economic and Job Impacts of Federally-mandated Vehicle Fuel Efficiency Standards
The policy of promoting motor vehicle fuel efficiency by establishing mandated fuel standards has been debated for more than thirty years. Over the past three decades, hundreds of articles and reports have been released on different aspects of the subject. While these studies have analyzed numerous aspects of vehicle fuel efficiency standards, most have focused on:
• The technological potential and cost effectiveness of increasing motor vehicle fuel efficiency
• The theoretical justification of the policy of mandated fuel efficiency standards and comparisons to other policy options
• The effectiveness of the 1975 Corporate Average Fuel Economy (CAFE) standards in increasing fuel efficiency
• Tradeoffs between increased fuel efficiency and other motor vehicle attributes, particularly motor vehicle safety
• The environmental benefits of increased fuel efficiency • The macroeconomic impacts of CAFE standards
Macroeconomic Impact Studies
There have been only a relatively few studies of the macroeconomic and employment impacts of CAFE standards. In general, the results of these studies indicate that CAFE standards tend to increase employment, output, and income. MISI Studies, 2001 – 2005
In a series of studies conducted between 2001 and 2005, MISI found that increasing the CAFE standards for automobiles, light trucks, minivans, and SUVs could result in the creation of more than 300,000 jobs distributed widely through the U.S. economy across states, industries, skills, and occupations.2 In addition, enhanced CAFE standards could reduce U.S. oil consumption by more than 30 billion gallons
2Management Information Services, Inc. and 20/20 Vision, Fuel Standards and Jobs: Economic, Employment, Energy, and Environmental Impacts of Increased CAFE Standards Through 2020, report prepared for the Energy Foundation, San Francisco, California, July 2002; Roger Bezdek and Robert Wendling, “Fuel Efficiency and the Economy,” American Scientist, Volume 93 (March-April 2005), pp. 132-139; Roger Bezdek and Robert Wendling, “Potential Long-term Impacts of Changes in U.S. Vehicle Fuel Efficiency Standards,” Energy Policy, Vol. 33, No. 3 (February 2005), pp. 407-419.
94
annually, save drivers $40 billion per year, and reduce U.S. greenhouse gas emissions by 100 million tons annually.
A number of major conclusions were derived. First, enhanced CAFE standards
would increase employment: 70,000 - 335,000 net new jobs by 2010 and 30,000 - 350,000 by 2020, with the largest number of jobs in the Motor Vehicles industry. While most industries and occupations gain jobs, some industries and occupations will lose jobs. Second, there are regional implications. Most states will gain substantial numbers of jobs -- for example, under the 2020 advanced scenario Michigan gains 54,500 jobs, Ohio gains 29,300 jobs, California 28,400 jobs, and Indiana 22,300 jobs. However, job increases and decreases will be spread unevenly among different sectors and industries within each state, and there will thus be job shifts within states. Third, union jobs will be affected, although specific impacts depend on the distribution of production between domestic plants and import/transplants, and any shift among competitors will also affect the domestic vehicle manufacturing industries. Finally, enhanced CAFE standards would: i) reduce U.S. annual oil consumption by 20 - 40 billion gallons by 2020 and 25 - 60 billion gallons by 2030; ii) save drivers $30 - $70 billion annually by 2020 and $40 - $100 billion annually by 2030, at increases of between $16 and $55 billion in annual vehicle costs; and iii) reduce annual U.S. GHG emissions by 60 - 130 million tons by 2020 and 90 - 180 million tons by 2030. In sum, the research indicates that strengthened CAFE standards would have positive energy, environmental, economic, and job benefits.
The study used technology and cost data for increased vehicle fuel efficiency developed by the National Research Council of the National Academy of Sciences in its January 2002 study Effectiveness and Impact of Corporate Average Fuel Economy (CAFE) Standards to estimate the requirements and costs for specified increases in miles per gallon. Three hypothetical scenarios were developed and assessed: A “business as usual” scenario that assumed no increase in CAFE standards, a “moderate” scenario that assumed a 20 percent increase in CAFE standards in 2010, and an “advanced” scenario that assumed a 30 percent increase in CAFE standards in 2010 and a 50 percent increase in 2015.
MISI found that U.S. GDP and employment would increase under each of the two
enhanced CAFE scenarios; for example: Under the moderate scenario, total employment would increase by about 70,000 in 2010, 30,000 in 2020, and 50,000 in 2030, while under the advanced scenario, total employment would increase by about 335,000 in 2010, 345,000 in 2020, and 320,000 in 2030. These represent net job increases, and in each year under each scenario substantial job shifts would occur among economic sectors and industries. The impacts on employment in different industries would vary substantially. The motor vehicle and related industries would be major winners, whereas employment in petroleum products and related industries would decrease.

95
The study found that jobs in all occupations would be affected, but to a very different degree and, while most occupations would gain jobs, in some occupations jobs would decrease. Finally, most states will gain substantial numbers of jobs, but the gains will be distributed unevenly among the states. Creating Jobs, Saving Energy and Protecting the Environment: An Analysis of the Potential Benefits of Investing in Efficient Cars and Trucks. Union of Concerned Scientists, Cambridge, Massachusetts, July 2004.
The 2001 UCS study, Drilling in Detroit: Tapping Automaker Ingenuity to Build Safe and Efficient Automobiles, analyzed the implications of increasing CAFE standards to 40 mpg by 2012 and to 55 mpg by 2020 and examined the macroeconomic impacts of increasing fuel standards. Using the IMPLAN input-output model of the economy, the authors estimated that employment, wages, and national output (income) would increase over the 10- to 20-year horizon of the study.
UCS found that the transportation sector and the motor vehicles and equipment
industry, as well as some service industries, would gain output and employment, while energy-related industries would experience job losses. By 2010, the analysis projected a net increase of over 40,000 jobs and a $5.5 billion increase in GDP ($2000 dollars); by 2020, the study projected an increase of 103,700 jobs and an increase of $5.7 billion in GDP. Most of the income and employment gains are derived from the assumption that fuel savings will offset the added costs of automobile production. No losses in auto sales were assumed, and consumers were assumed to use their fuel savings for purchases of other goods and services. The improvements in fuel economy were assumed to result from increases in fuel efficiency of conventional passenger car and light truck engines as well from an increase to 50 percent of market share in hybrid gasoline-electric vehicles.
The study noted that the benefits estimated do not include potential added
benefits from reduced dependency on oil imports or reductions in GHG emissions. In a 2002 update of the 2001 study, UCS prepared a report that highlighted potential job gains by industry and state resulting from increased CAFE standards. The report argued that job increases will result from increases in spending for two reasons. First, consumer savings from better gas mileage will generate an average of $2,400 in savings per driver over the life of the vehicle (over and above the added costs of the new vehicle), and this money will be spent on various goods and services and will generate jobs throughout the economy. Second, to implement new fuel economy standards the industry will invest in new automotive technology, and this added investment will also generate jobs. The largest job gains will be in the services sector and in the motor vehicles sector, while job losses will be concentrated in the mineral and resources mining, extraction, and refining sectors, although wholesale trade will also experience some job losses. A total of 182,700 new jobs would be generated.

96
In the analysis, all states and the District of Columbia are expected to see net increases in jobs, ranging from a low of 100 new jobs in Wyoming to an increase of 23,600 net new jobs in California. The analysis was based on new CAFE standards of 40 mpg that would go into effect by 2012, with the full impact of the changes being felt by 2015. The results were generated using the IMPLAN model that was originally developed by the U.S. Department of Agriculture. In 2004, UCS updated the findings of the earlier studies and estimated the effect of moving existing technologies into cars and trucks over the next 10 years to reach an average of 40 miles per gallon (mpg) by 2015. UCS found that:
• In 2015, the benefits resulting from investments in fuel economy would lead to 161,000 more jobs throughout the country, with California, Michigan, New York, Florida, Ohio, and Illinois topping the list.
• In the automotive sector, projected jobs would grow by 40,800 in 2015.
• For consumers, the cost of the new technology would more than pay for itself, saving a net $23 billion dollars in 2015 alone.
• In 2015, the U.S. would reduce oil use by 2.3 million barrels per day -- nearly as much as it imports from the Persian Gulf -- and would reduce GHG emissions from cars and trucks by 106 million metric tons of carbon.
Short-and Long-Range Impacts of Increase in the Corporate Average Fuel Economy (CAFE) Standard. Andrew N. Kleit, 2002. Most CAFE studies approached the issue of impact estimation from what could be described as a “top down” approach, where estimates of the costs of fuel efficiency improvements are used to forecast changes in sales, fuel use, jobs, materials consumed, and other variables. These estimates are then used in economic models of the economy, generally of the input-output type, to estimate industry specific and economy-wide impacts. A 2002 study by Andrew Kleit, sponsored by General Motors, used a methodology that might best be described as a “bottom up” approach. Kleit estimated supply and demand functions for the motor vehicle industry and used these to calculate before and after effects following the imposition of new CAFE standards. He examined four scenarios: Two short-term and two long-term. In the short-term cases, he assumed that manufacturers are not given sufficient time to incorporate new fuel efficiency technologies into their fleets, and CAFE standards are met by adjusting the mix of vehicles sold. In the long-term cases, technology adjustments are assumed. He also analyzed two additional cases (one in the short-term, one in the long-term). In one, he considers the impact of new CAFE standards if they are assumed to be “binding” on domestic manufacturers, and in a second scenario he analyzes the case in which existing CAFE standards are not binding. The

97
assumption of whether or not current standards are “binding” or not refers to whether or not a firm’s current sales are close to existing CAFE limits. When a firm is at the limit, attaining new, higher CAFE standards would be more difficult and costly. Kliet’s model disaggregated the industry into four companies, the big three domestic firms and a catchall “foreign” firm, and each firm in the industry sells 11 categories of vehicles ranging from small cars to full-sized pick-ups. The imposition of new CAFE standards would result in total costs to society that are estimated to range from $2.2 billion (raising fuel efficiency by three mpg in the long-term, non-binding case) to $33.9 billion (raising fuel standards by one mpg in the short-term, binding case.) The study further estimated that new standards would increase pollution because increased fuel efficiency would lead to more driving (the so-called “rebound effect”) and that older, less fuel efficient vehicles would be driven longer because they would be relatively less expensive. The study also estimated that gasoline tax increases of from 11 cents per gallon to 23 cents per gallon would accomplish the same fuel saving as the new CAFE standards analyzed. The report did not estimate potential employment changes, although the negative impact on auto sales, a decrease of 57,000 units in the long-run scenario, indicates negative employment effects in the automobile manufacturing industry. No analysis of the wider economic impacts from additional auto industry investment to meet new standards or from additional consumer spending from fuel savings was included. “CAFE Compliance by Light Trucks: Economic Impacts of Clean Diesel Engines.” Arvind Teotia, et al, Energy Policy, v. 27, 1999, pp. 889-900. Arvind Teotia and his associates estimated the macroeconomic impacts of the use of clean diesel engine technology in light trucks to comply with CAFE standards. Their study employed the DRI Macro model of the economy to estimate GDP, employment, energy use, trade, and other macro effects of the adoption of new highly efficient clean diesel engine technology currently being developed for use in light trucks. The research assumed that the new engines would capture about 15 percent of the light truck market (excluding minivans) by 2010. The direct impact of the adoption of this new technology includes the capital expenditures for engine manufacturing plants, consumer and business spending for the vehicles, fuel savings, and import and export effects. Indirect effects include a reduction in crude oil imports and other effects generated by the model. Two scenarios were considered: First, that all the new engines are manufactured in the U.S., and second, that all the new engines are imported. In either case the results are modest. Less than 16 percent of light trucks are assumed to switch to the new engines, and the cumulative increase in GDP (1992 dollars) is forecast to be between $33 billion and $38 billion dollars by 2022. Employment gains are expected to total between 70,000 and 110,000 jobs, cumulative, over the period. Most of the income (and job) gains result from increased spending on the new vehicles, increased exports of vehicles and parts (in the domestic manufacture

98
case), and reduced imports of petroleum. On a cumulative basis, imports of petroleum are expected to be $6.5 billion less over the period compared to the base case. In the domestic production scenario, the U.S. balance of payments improves, while in the imported engines case it deteriorates. No estimates of the costs and benefits of emissions reductions associated with the clean diesel engines were developed.
IV.A.2. Other Federal Government Programs The Economic Benefits of the U.S. Department of Energy for the State of Tennessee. Report prepared by the Center for Business and Economic Research, College of Business Administration, University of Tennessee, Knoxville, for the U.S. Department of Energy, Oak Ridge Office, June 2005.
This report noted that DOE operations provide a major source of economic benefits for the state of Tennessee and its residents through the creation of jobs and income as well as expansions in state and local tax bases and that DOE has a unique opportunity to help influence the economic success of the region. To detail and verify the benefits attributed to DOE operations, the Center for Business and Economic Research at the University of Tennessee began conducting in-depth analyses of the economic impacts of DOE payroll and non-payroll spending on the state of Tennessee in 1999 for the 1998 Fiscal Year. Subsequent analyses were conducted for Fiscal Years 1999, 2000, 2001 and 2003. This study analyzed the economic benefits for FY 2004, and the results provided evidence of DOE’s role as a major contributor to the Tennessee economy.
Key findings estimated for FY 2004 include the following (FY 2003 results shown in parentheses):
• Spending by DOE and its contractors led to an increase of nearly $3.7 ($3.2) billion in Tennessee’s gross state product in 2004.
• Total personal income generated in Tennessee by DOE-related activities was roughly $1.9 ($1.7) billion in 2004. Each dollar of income directly paid by DOE in the state translated into a total of $2.26 ($2.26) in personal income for Tennessee residents.
• DOE spending supported 62,032 (54,555) full-time jobs in the state in 2004, meaning that for every one DOE job, 4.2 (3.8) additional jobs were supported in other sectors of the state economy.
• DOE-related spending generated $74.7 ($66.7) million in state and local sales tax revenue in Tennessee in 2004.
• DOE operations continue to rely on a highly trained and educated workforce. In 2004, 956 (956) employees held Ph.D. degrees, 1,704 (1,668) held a Master’s degree and 2,896 (3,461) held a Bachelor’s degree.
99
The study also found that other DOE activities serve to improve the quality of life for Tennesseans and, while some enhance the productivity of Tennessee industries and workers, others contribute to the well-being of residents in a more personal manner. For example, in 2004 DOE, its contractors and their employees donated over $11.1 ($15.6) million. The Economic Contribution of Military and Coast Guard Installations to the State of New Jersey. Report prepared for the Office of the Governor of New Jersey by Michael L. Lahr, Center For Urban Policy Research, Edward J. Bloustein, School Of Planning & Public Policy, Rutgers, the State University of New Jersey, April 29, 2004.
This study examined the economic contributions of military facilities to New Jersey in 2002 and represents one of the more detailed statewide analyses of the economic impacts of military facilities. It found that the military’s presence in New Jersey is substantial:
• There was over $5 billion in state-based military spending in 2002. • $1.6 billion of this spending was allocated to military payrolls. • $3.4 billion of the spending was dedicated to military contracts. • The military payroll supported 43,000 jobs on military bases. • Over half of the jobs were those of reservists or members of the
National Guard, and these are jobs that are generally used to supplement incomes of area households.
• Civilians comprised about a third of all jobs on military bases and 55 percent of the total military payroll.
• In 2002, civilian jobs on the bases paid salaries 30 percent above the statewide average ($61,371 compared to the statewide average of $47,420), since the missions of several facilities are “high tech” in nature.
With respect to off-base spending, multiplier effects, and total military-only
Impacts, the study found that:
• Off-base military spending directly contributed to slightly more than 21,000 jobs and $1.3 billion to payrolls of firms operating in the state (a payroll of $61,905 per job). These were largely construction jobs, but also included over 4,000 jobs at Lockheed Martin’s facilities in southern New Jersey.
• Multiplier effects of the military spending bring the total number of jobs contributed by the military’s presence in the state to over 90,000 jobs. This is about the number of jobs maintained by the state’s well-known and robust chemical industry, which includes both pharmaceuticals and oil refineries.
• The 90,000 jobs supported by military spending in New Jersey are supported by over $3.6 billion in payroll.

100
In assessing the effects of military spouses and military retirees, the report found that:
• Should the military decide to pull out of New Jersey, the state would also lose the services of many spouses of civilian and military personnel at the bases. These losses should be measured not only in terms of jobs and earnings, but also in terms of volunteer time provided to schools, hospitals, and other social service organizations.
• If the bases were closed, many retirees would migrate to take advantage of free or less expensive services provided to veterans at bases. Many of these retirees contribute to the state’s economy to supplement their military retirement incomes.
• A conservative estimate is that due to the out-migration of military spouses and retirees, 8,000 full-time-equivalent jobs with salaries totaling $370 million would be lost to the economy if all military facilities stopped operating within the state.
In terms of total economic and tax Impacts, the report estimated that:
• Military spending in New Jersey contributes over 98,000 jobs and
$4 billion in income to state residents. • It annually contributes $4.7 billion in total wealth (GDP) and more
than $8.5 billion in business revenues. • Military spending in New Jersey also contributes at least $193
million in local government tax revenues and $192 million in state government tax revenues to the state -- these estimates do not include federal government impact aid to New Jersey schools.
The Economic Impact of Defense Spending on Huntsville/Madison County. Report prepared by Niles C. Schoening and Mary S. Spann, Office of Economic Development, University of Alabama in Huntsville, for the Huntsville/Madison County Chamber of Commerce, Huntsville, Alabama, December 2003. This economic impact report found that:
• The defense sector directly employed 25,619 persons in Madison County during 2002 -- 13,049 were federal DOD employees and 12,570 were private employees who worked on DOD contracts during the year.
• Defense related employment represented 14.9 percent of all wage and salary employment in the County in 2002.
• The indirect impact of defense spending was responsible for an additional 25,075 jobs in other sectors of Madison County’s economy. Adding these jobs to the number of persons who were

101
directly employed in the defense sector in 2002 gives a grand total of 50,694 jobs dependent on defense spending -- 29.4 percent of all wage and salary jobs in the county.
• The defense sector generated 26.8 percent of total personal income in Madison County -- nearly $2.3 billion in 2002.
• Adding the indirect income impact to the direct impact gives a total of $3.4 billion in personal income that defense spending generated in Madison County in 2002. This represented 40.4 percent of the County’s total personal income in that year.
• Employees in the defense sector earned an average of $61,907 compared to an estimated average of $51,115 for all wage and salary workers in Madison County in 2002.
• Personal taxes paid to Huntsville, Madison County, and the state of Alabama by defense sector workers were estimated to total $165.5 million in 2002.
• DOD contracts supported 53.3 percent of Madison County’s aerospace industry employees in 2002.
• Forty-six percent of aerospace firms in Madison County had 90 percent to 100 percent of their workforce on DOD contracts during 2002. Most of these firms had total employment of less than 200.
• Sixty-one percent of major sub-contractors or suppliers to DOD prime contractors are located in Madison County. These sub-contractors primarily supply parts and accessories or technical services to prime contractors located in the County.
• Fifty-eight percent of DOD contract employees in Madison County work in engineering, science, or mathematics disciplines. This represented an increase from 47.1 percent recorded in 1993.
Impacts of the Acid Rain Program on Coal Industry Employment. U.S. Environmental Protection Agency, EPA 430-R-01-002, March 2001.
This report addressed the impacts of the Acid Rain Program (created under Title IV of the Clean Air Act Amendments of 1990) on coal mining employment. It revisited the results of a study that was originally conducted in 1990, which compared the economic impacts of the acid rain provisions of several legislative scenarios being considered at the time. The earlier study projected that Title IV could have a substantial effect on coal mining employment and predicted a gross loss of 13,000-16,000 coal miner job slots by the year 2001 as a result of Title IV.
This study revisited the original 1990 analysis and the differences in the results were substantial. The 2000 report projected that by the year 2010, Title IV of the Clean Air Act could result in a gross loss of approximately 7,700 job slots, or about half the loss projected by the 1990 study. The net loss would be only 4,100 coal miner job slots because 3,600 new job slots would be created. The extent to which Title IV affects coal mining employment, specifically job slots, was the focus of this paper.

102
The results of this 2000 report show that the Acid Rain Program has had a limited impact on coal employment and that the program’s future impacts on coal mining employment will be considerably lower than originally predicted. IV.B. DOE and Federal Laboratory Programs and Initiatives The Impact of Federally Funded Laboratories in Colorado. University of Colorado, Leeds Business Research Division, May 2008.
This report assessed the economic impact in 2007 of several federally-funded laboratories in Colorado, including the Centers for Disease Control and Prevention, Division of Vector‐Borne Infectious Diseases, the Cooperative Institute for Research in the Atmosphere, and the Cooperative Institute for Research in Environmental Sciences.
Centers for Disease Control and Prevention (CDC), Division of Vector‐Borne Infectious Diseases:
• The CDC employed an estimated 84 full‐time workers, 15 part‐time workers, and 140 contractors in FY 2007. Applying weighted average earnings from all responding research facilities for each type of worker yielded average earnings of $84,099 per CDC FTE.
• The economic impact of the CDC in Larimer County and the state of Colorado was measured by examining various expenditure data on operations, employees, and visitors, as well as their multiplier effects. Total economic benefits in FY 2007 totaled $30.6 million for Larimer County and $49.4 million for the state. Facility operations and employee expenditures led to $287,000 in county tax revenues and $613,000 in state tax revenues.
Cooperative Institute for Research in the Atmosphere (CIRA):
• CIRA employed 101 full‐time workers in FY 2007, and average
salary and benefits paid to these workers totaled $89,101. CIRA had 38 part‐time workers, averaging $36,153 in compensation, and two contract workers.
• Approximately one‐third of the CIRA workforce is comprised of employees with a doctorate, and 23 percent have a master’s degree. Roughly another third have earned a four‐year degree, while the remaining 13 percent do not have a four‐year degree.
• The economic impact of CIRA in Larimer County and the state of Colorado was measured by examining various expenditure data on operations, employees, and visitors, as well as their multiplier effects. Total economic benefits in FY 2007 totaled $9.5 million for Larimer County and nearly $14.8 million for the state. Facility

103
operations and employee expenditures led to $136,000 in county tax revenues and $337,000 in state tax revenues in FY 2007.
Cooperative Institute for Research in Environmental Sciences (CIRES)
• CIRES employed 400 full‐time workers in FY 2007, with the
expectation that this number will rise by three percent in both 2008 and 2009. Average salary and benefits paid to these workers totaled $83,011 in FY 2007.
• There were 196 CIRES part‐time workers in FY 2007, earning an average compensation of $12,286.
• Nearly half (49 percent) of the CIRES workforce has a doctorate, and roughly another quarter (23 percent) has a master’s degree. Just over one‐quarter (27 percent) has a four‐year degree. A very small percentage of employees, one percent, has less than a four‐year degree.
National, State, and Regional Economic and Environmental Impacts of NETL: Pennsylvania-West Virginia Region. U.S. Department of Energy, National Energy Technology Laboratory, September 2007.
This report noted that throughout Pennsylvania, West Virginia, and the U.S,
NETL provides support for scientific R&D and for science education. Through these actions, and participation in the two-state economy from employment and operational activities, NETL serves as an important economic catalyst for the region. To quantify the laboratory’s economic and environmental impacts on the combined Pennsylvania-West Virginia region, NETL developed a regional-level environmental input-output (IO) model.
NETL estimated its direct impact on Pennsylvania and West Virginia’s economy
during 2006, including employment, wages, and salaries of Pennsylvania and West Virginia residents employed at NETL’s sites in Morgantown, West Virginia and Pittsburgh, Pennsylvania. It also included NETL’s direct operational expenditures and R&D award and grant monies spent within the region.
The analysis determined that NETL directly supported the employment of 1,166
Pennsylvanians and West Virginians in 2006 and injected $192 million into the state economy, as illustrated in table IV.B.1.
Because the Pennsylvania and West Virginia economies supply a portion of NETL’s total employment and operational demand, NETL activities produce extended (indirect) impacts on the region’s economy.

104
NETL estimated that the economic output multiplier for the Pennsylvania-West Virginia region is 1.47. Therefore, for every $1 million of NETL final demand that remains within the states of Pennsylvania and West Virginia, the regional economy grows by $1.47 million. The employment multiplier of 2.73 indicates that for every one employee at NETL, an additional 1.73 employees are needed throughout the region to fulfill the regional demands of NETL’s supply-chain. This yields a total employment impact of 3,180 jobs. On an employment-per-dollar basis, the analysis showed that employment increases by approximately 20 persons for each $1 million that remains in the region.
NETL’s analysis excluded induced income impacts -- those resulting from households spending their salaries in the regional economy and also excluded impacts stemming from the deployment of NETL-sponsored technologies. Therefore, NETL’s impact on the Pennsylvania-West Virginia region, as estimated in this study, is a conservative estimate.
Table IV.B.1 Direct Economic Impact of NETL on the
Pennsylvania-West Virginia Region, 2006
Input Category Pennsylvania-West Virginia
Federal Employment (jobs) 506 Site-Support Contractor Employment (jobs)
660
Federal + Site-Support Contractor Employment (jobs)
1,166
Federal Wages and Salaries $55.9 Site-Support Contractor Wages and Salaries
$39.8
Federal + Site-Support Contractor Wages & Salaries
$95.7
Federal Operational Expenditures $15.2 Site-Support Contractor Operational Expenditures
$6.2
Federal + Site-Support Contractor Operational Expenditures
$21.4
Federal R&D Awards/Grants, Costs $75.3 Total Direct Impact on Pennsylvania and West Virginia
$192.4
Source: National, State, and Regional Economic and Environmental Impacts of NETL: Pennsylvania-West Virginia Region. U.S. Department of Energy, National Energy Technology Laboratory, September 2007.

105
National, State, and Regional Economic and Environmental Impacts of NETL. Report prepared by Lisa Phares, National Energy Technology Laboratory, Deborah Lange and Christopher Hendrickson, Carnegie Mellon University, and Randall Jackson and David Martinelli, West Virginia University, DOE/NETL-404.02.01, June 30, 2007.
NETL collaborated with Carnegie Mellon University (CMU) and West Virginia University (WVU) to conduct this report as part of the University Partnership program. This report documented the development of state-level input-output (IO) models for Pennsylvania and West Virginia, a regional Pennsylvania/West Virginia (PA/WV) model, and the augmentation of the national IO model with employment data. The models were developed to assess the economic and environmental impacts of expenditures and employment at NETL and R&D awards originating from the NETL sites located in Pittsburgh and Morgantown. The scope of the analysis did not extend to the impacts related to the market adoption of NETL-sponsored technologies, nor did it include induced impacts, and the estimates of NETL’s impacts derived in this study were considered to be conservative.
The primary goal was to develop a defensible and transparent means for
routinely estimating national, state, and regional economic and environmental impacts derived from NETL employment and activity. The development of this methodology and these models allows NETL to assess its influence with respect to the various economic regions and to evaluate scenarios that represent alternative activity levels and expenditure allocations.
This analysis expanded NETL’s analytical capabilities by producing economic models that allow the calculation of direct and indirect impacts of NETL’s final demand on economic and environmental factors, as well as employment levels. In addition, the work conducted through this collaborative effort prepared the groundwork for future analyses to be completed using a consistent methodology.
The report noted that NETL is an important component of the PA/WV economy, and the models developed help to assess the regional impact of NETL activity as an economic catalyst. These models also provide the platform from which NETL could develop future model versions that could be used to evaluate the impact of technology developed by NETL.
The study noted that constructing new models for an economic and environmental analysis presented four primary challenges which led to the identification of several key decision points. The four primary challenges were:
• Identifying quality data sets for economic and environmental parameters
• Selecting a methodology for regionalizing the national model • Identifying and collecting NETL data sets • Defining sensible approaches to implementing the model

106
This project used IO models to derive the economy-wide impacts of NETL’s activity. The IO construct used for these models is CMU’s National Economic Input-Output (EIO) model, which allows for the estimation of both economic and environmental impacts of a supply-side change in the economy. To generate the regional tables for Pennsylvania, West Virginia, and the combined (Pennsylvania and West Virginia) region, the established location quotient (LQ) method was used in conjunction with the employment vectors
The data used to represent NETL’s 2006 activity at the Pittsburgh, PA and
Morgantown, WV sites included:
• Federal employment: 510 employees • Federal wages and salaries: $56.4 million • Federal operational expenditures: $80.8 million. • Federal R&D award obligations: $752.4 million (all NETL sites) • Federal R&D award costs: $535.0 million (all NETL sites) • Site Support Contractor employment: 668 employees • Site Support Contractor wages and salaries: $40.2 million • Site Support Contractor expenditures: $13.6 million
The results derived showed that the economic output multiplier for the two-state
regional model is 1.47. Thus, for every $1 million of NETL final demand that remains within Pennsylvania and West Virginia, the regional economy grows by $1.47 million. The regional employment multiplier of 2.7 indicates that for every employee at NETL, an additional 1.7 employees are needed throughout the two-state economy. Similarly, employment increases by about 20 persons for each $1 million that remains in the region.
Economic output multipliers reflect the region’s ability to fulfill the requirements of
an industry’s supply chain. The study found that the output multiplier for the state of West Virginia is lower than those for the other regions, and this implies that the state economy of West Virginia is less able than the state of Pennsylvania to supply the direct and indirect inputs required by the Scientific Research and Development Services sector. The economic output multipliers generated in this study suggest opportunities for the region to expand through backward linkages so that the region may be more able to provide a greater proportion of regional industries’ input needs in the future.
Alternative scenarios were also developed to determine potential impacts under
a “buy-local” strategy. The buy-local strategy assumed that NETL will increase its share of Federal operational expenditures and/or allotment of R&D awards and grants that are spent in or granted to establishments in Pennsylvania and West Virginia. Nine alternative scenarios were defined and represented increasing the local shares of expenditures and/or awards by 50 percent, 100 percent, or 150 percent over their current share of total expenditures and awards. The impacts of the alternative scenarios were calculated only for the combined Pennsylvania and West Virginia region so as to limit the number of scenarios to a reasonable level.
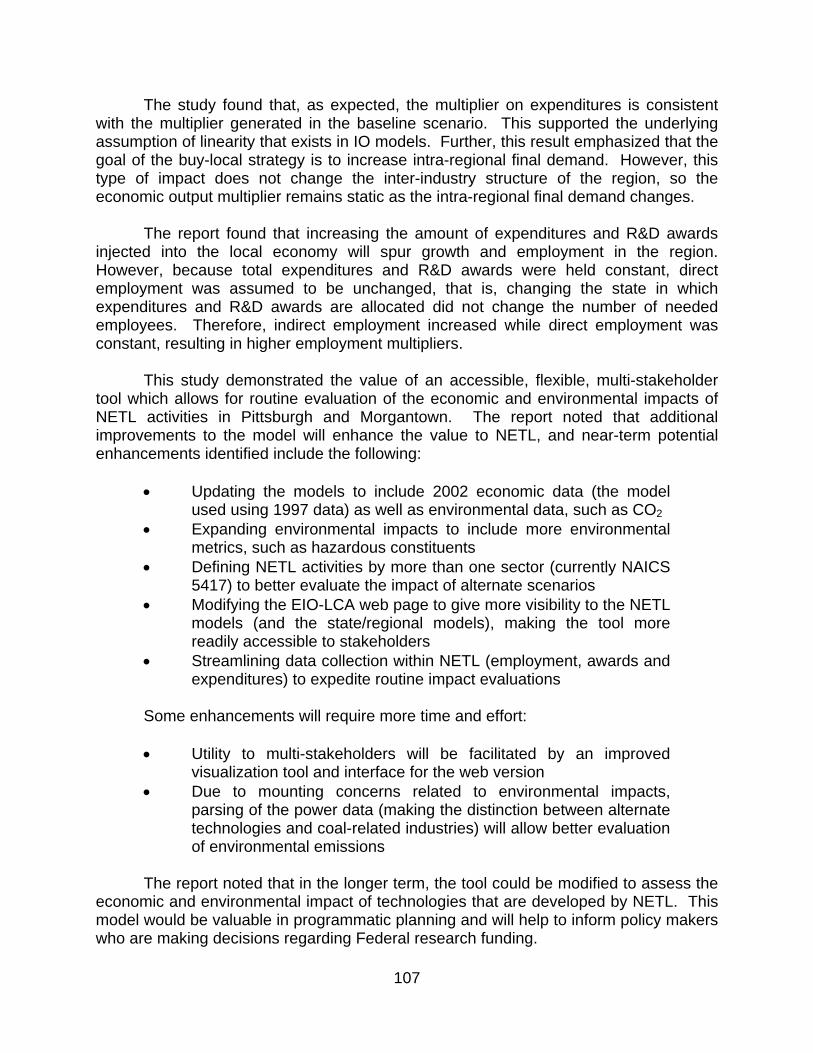
107
The study found that, as expected, the multiplier on expenditures is consistent with the multiplier generated in the baseline scenario. This supported the underlying assumption of linearity that exists in IO models. Further, this result emphasized that the goal of the buy-local strategy is to increase intra-regional final demand. However, this type of impact does not change the inter-industry structure of the region, so the economic output multiplier remains static as the intra-regional final demand changes.
The report found that increasing the amount of expenditures and R&D awards injected into the local economy will spur growth and employment in the region. However, because total expenditures and R&D awards were held constant, direct employment was assumed to be unchanged, that is, changing the state in which expenditures and R&D awards are allocated did not change the number of needed employees. Therefore, indirect employment increased while direct employment was constant, resulting in higher employment multipliers.
This study demonstrated the value of an accessible, flexible, multi-stakeholder tool which allows for routine evaluation of the economic and environmental impacts of NETL activities in Pittsburgh and Morgantown. The report noted that additional improvements to the model will enhance the value to NETL, and near-term potential enhancements identified include the following:
• Updating the models to include 2002 economic data (the model used using 1997 data) as well as environmental data, such as CO2
• Expanding environmental impacts to include more environmental metrics, such as hazardous constituents
• Defining NETL activities by more than one sector (currently NAICS 5417) to better evaluate the impact of alternate scenarios
• Modifying the EIO-LCA web page to give more visibility to the NETL models (and the state/regional models), making the tool more readily accessible to stakeholders
• Streamlining data collection within NETL (employment, awards and expenditures) to expedite routine impact evaluations
Some enhancements will require more time and effort:
• Utility to multi-stakeholders will be facilitated by an improved
visualization tool and interface for the web version • Due to mounting concerns related to environmental impacts,
parsing of the power data (making the distinction between alternate technologies and coal-related industries) will allow better evaluation of environmental emissions
The report noted that in the longer term, the tool could be modified to assess the
economic and environmental impact of technologies that are developed by NETL. This model would be valuable in programmatic planning and will help to inform policy makers who are making decisions regarding Federal research funding.

108
The NASA Glenn Research Center: An Economic Impact Study, Fiscal Year 2004. Report prepared for the NASA Glenn Research Center by Robert Sadowski, December 1, 2005.
This report has two major sections. The first section is an overview of John H. Glenn Research Center at Lewis Field, including information related to employment and occupations, employee residence, payroll, expenditures, awards to academia and other institutions, revenues, and taxes paid by NASA Glenn employees. The second section provides estimates of the economic impact generated by NASA Glenn on the eight-county Northeast Ohio region and the state of Ohio during FY 2004 and compared this to the FY 1998 impact.
Economic impacts were derived using an input-output model to estimate the effect of NASA Glenn spending on the studied economies. The analysis found that NASA Glenn activities in Ohio, stimulated by $795 million in revenues primarily from outside the state, generated an increased demand in output (sales) for products and services used across the state that were valued at $1.241 billion. In addition, 10,023 jobs were created in Ohio and households across the state saw their earnings increase by $567.6 million.
Businesses deriving the most benefit from direct NASA Glenn spending include contractors engaged in scientific research and development, academic institutions, power generation, construction, security, facilities support, data processing, and miscellaneous technical support. Businesses deriving the most benefit from spending by Glenn personnel and other workers whose earnings are due, in part, to Glenn expenditures follow typical consumer spending patterns. These include automobile dealers, automobile repair shops, food and beverage stores, restaurants and bars, insurance carriers, commercial banks, real estate companies, hospitals, and doctor and dentist offices.
In FY 2004, Glenn had 1,945 workers. These numbers do not include
employees who work for NASA Glenn’s 19 local contractors. The number of on- or near site contractors as of the end of FY 2004 was approximately 1,700.
Total compensation for NASA Glenn’s civil service employees was almost $200 million in FY 2004. Of this amount, payroll accounted for $162.3 million, while employee benefits accounted for another $36.4 million. The average wage per Glenn employee was $83,450 in FY 2004.
NASA Glenn spending in FY 2004 was less than one percent lower than in FY 1998 (nominal dollars). However, the expenditure share for Northeast Ohio and the state of Ohio increased significantly between 1998 and 2004. During FY 1998, Glenn distributed 32.9 percent of its total spending to Northeast Ohio vendors. This spending share increased to 45.4 percent ($232.6 million) in FY 2004. Similarly, the spending share across the state of Ohio increased from 47.3 percent in FY 1998 to 64.2 percent

109
($328.6 million) in FY 2004. These share increases are significant because of their positive effect on economic activity in both the region and the state.
Glenn revenues increased by almost $100 million (nominal dollars) or 13.7 percent between FY 1998 and FY 2004. During the interim period, NASA Glenn saw its revenues decline during 1999 and 2000 and then begin increasing, reaching a peak of $821.3 million during FY 2003. Total revenues in FY 2004 amounted to $795 million. The Economic Impact of Brookhaven National Laboratory on the New York State Economy. Report prepared by Dr. Pearl M. Kamer for Brookhaven National Laboratory, October 2005. This report found that Brookhaven National Laboratory (BNL) is among the five largest high-technology employers on Long Island, with 2,750 employees, including a high proportion of scientists, engineers, and technicians. In fiscal years 1993-2003, the Lab’s employees injected more than $4.76 billion in direct spending into the New York State economy, which increased the state’s output of goods and services by almost $9.2 billion and created almost 79,000 secondary jobs in the state.
Over the last five fiscal years, Brookhaven’s procurement expenditures totaled an estimated $223 million in New York State, with more than $100 million spent for goods and services on Long Island. In FY 2004 alone, the Lab’s procurement expenditures in New York State totaled approximately $41.6 million, with an estimated $27 million going to Long Island businesses. Laboratory direct spending of $454.4 million in FY 2004 caused New York State’s total output of goods and services to expand by more than $880 million, and created more than 7,700 secondary jobs throughout the state.
The Lab invites industry to develop and market the inventions it has patented. Of the 162 inventions in Brookhaven Science Associates’ (BSA) patent portfolio over the last 15 years, 96 were licensed and 63 were commercialized in the fields of molecular biology, pharmaceuticals, instrumentation, environmental technologies, and electronics -- industries that New York is relying on to form the core of a growing technology base. BNL’s continued viability as a premier research facility is critical to New York State’s future economic growth.
The Lab’s cooperative research and development agreements (CRADAs) with local industry allow these firms to use BNL’s unique equipment and technical staff. These CRADAs are funded largely by DOE, and during the fiscal 2000-2004 period, DOE funding for Brookhaven Lab’s CRADA program totaled $5.5 million. The Laboratory has become an invaluable resource in counter-terrorism planning and implementation, and researchers have developed an extensive portfolio of national security technologies that are applicable nationally, regionally, and locally.

110
Brookhaven’s research to improve fuel-oil efficiency has saved approximately $6 billion in the past decade for the 10 million U.S. homes and businesses that are heated by oil. Any research that results in greater fuel-oil efficiency will be a boon to both the state’s economy and that of the nation.
The Laboratory’s educational programs involve nearly 24,000 K-12 students
annually, with New York State participants representing at least 90 percent of this total. Since the late 1990s, over 550 New York State teachers have participated in these programs. More than 100 undergraduate student interns come to BNL each year from across the country; 45 percent of these interns are from communities in New York State.
Several planned projects will significantly enhance the Laboratory’s economic
value to New York State. The new Center for Functional Nanomaterials (CFN) will help to jump-start New York State’s nanotechnology industry, and the upgraded National Synchrotron Light Source (NSLS-II) will facilitate the commercialization of nanoscale discoveries.
Projected spending for the fiscal 2005 through 2014 period could total almost $5.6 billion. This includes more than $4.7 billion in operating and equipment expenditures and approximately $864 million in construction spending. More than 91,000 jobs would be created statewide, and virtually all industries, including some of the state’s key manufacturing industries, would benefit from this spending. IV.C. Employment Impact Studies For Other Energy Areas
IV.C.1. Green Energy and Clean Energy Green Recovery: A Program to Create Good Jobs and Start Building a Low-Carbon Economy. Report prepared by the Department of Economics and the Political Economy Research Institute (PERI) at the University of Massachusetts-Amherst for the Center for American Progress, September 2008.
This report advocated a “green economic recovery program to strengthen the U.S. economy over the next two years and leave it in a better position for sustainable prosperity.” This initiative is designed to expand job opportunities, stimulate economic growth, stabilize the price of oil, fight global warming, and build a green, low-carbon economy. This green economic recovery program would be a down payment on a 10-year policy program recommended by the Center for American Progress (CAP) in its 2007 “Progressive Growth” series, which recommended an economic strategy for the next administration.
The report’s recommended green economic recovery program would spend $100 billion dollars over two years in six green infrastructure investment areas, and would be paid for with proceeds from auctions of carbon permits under a GHG cap-and-trade

111
program. The authors estimated that the program would create two million jobs by investing in six energy efficiency and renewable energy strategies:
• Retrofitting buildings to improve energy efficiency • Expanding mass transit and freight rail • Constructing “smart” electrical grid transmission systems • Wind power • Solar power • Next-generation biofuels
Most of the federal spending would be in the form of public infrastructure
investments in public building retrofits, public transportation, and building smart grid systems and through the federal government to state and local governments. Investments in renewable energy and energy efficiency are also central to this proposal, and would be funded through a combination of public funds, tax credits, and loan guarantees to encourage private sector investment. The authors recommended that this $100 billion green energy stimulus package should be spent in the six technology areas listed above. The program would allocate the finding through:
• Tax credits ($50 billion) • Direct government spending ($46 billion) • Federal Loan guarantees ($4 billion)
The authors estimated that this would result in:
• Widespread employment gains • Lower unemployment • Renewed construction and manufacturing work • More stable oil prices • Self-financing energy efficiency
The report supports the CAP’s “10 Steps to a Lower Carbon Economy” broad
policy steps, and recommends the establishment of numerous new organizations such as, for example:
• A White House National Energy Council • An Energy Innovation Council • An Energy Technology Corporation • A Clean Energy Investment Administration • A Clean Energy Jobs Corps
While the report extensively criticized and attacked the oil and natural gas
industries, it had little to say directly about coal. Where coal is mentioned, the report recommended clean coal and CCS programs. The major findings in the report include:

112
• “Green energy” investments generate more jobs than equivalent investments in other energy technologies and these jobs also pay higher than average wages.
• The recommended investments in energy efficiency and renewable energy sources would stabilize demand for oil and slow the long-term rise in oil prices.
• The recommended program would reduce U.S. oil demand by one percent and would reduce world oil prices by eight percent.
• The program would create two million new jobs and reduce the U.S. unemployment rate by nearly 25 percent.
• The investments in energy efficiency would be self financing. • Renewable energy does not receive sufficient federal subsidies
compared to fossil fuels. • The $100 billion program would pay for itself “rapidly.” • Because a national cap-and-trade system cannot be quickly
implemented, the Federal Government will have to deficit spend initially until the C&T Fund revenue is available.
Energy Efficiency and Renewable Energy: A Growing Opportunity for Massachusetts. Massachusetts Technology Renewable Energy Trust, Westborough, Massachusetts, November 2005.
In 2005, the Massachusetts Technology Collaborative (MTC) worked with the University of Massachusetts -- Boston to analyze the high-tech energy efficiency and renewable energy technologies sectors in Massachusetts. It found that Massachusetts is among the world’s leaders in high-tech energy efficiency and renewable energy technologies and that the state’s energy industry has a global reach – exporting millions of dollars of products and services to overseas markets. Strong, steadily growing demand for energy efficiency and renewable energy technologies and products makes these sectors an attractive target for investment that will spur job growth and strengthen local companies.
The study estimated that there were approximately 8,000 jobs in energy efficiency and 2,000 in renewable energy companies in Massachusetts. Further, economic growth and venture investment in these sectors around the country and around the world indicates significant job creation potential in what is commonly referred to as the “clean energy” sector or in the broader sense, “clean tech”. In conducting the analysis, researchers considered Massachusetts firms that derive all or a portion of their business from creation and implementation of energy efficiency equipment and techniques; design and execution of energy conservation measures, including integrated designs, such as green buildings; design, manufacture, construction and operation of technologies which generate electricity and energy using renewable resources; and, installation and management of distributed energy resources and programs on both the supply- and demand-side of the market.

113
The researchers contend that there may be an emerging clean energy industry cluster – rivaling others within the state – and that Massachusetts may be in a position to stimulate additional benefits. They noted that other states are aggressively pursuing clean energy and clean tech investors and entrepreneurs through a variety of programs, and that California, Connecticut, Texas, New Mexico, New York, New Jersey, Florida, and Pennsylvania all have proactive clean energy and clean technology development policies. Several European countries and Japan are successfully building clean tech clusters; for example, Germany and Japan have usurped California’s once-leading position in solar and wind energy through targeted policies and initiatives.
They concluded that, as a leading technology state, Massachusetts has a
tremendous opportunity to develop next generation technologies that will revolutionize the energy industry -- active solar, wind, fuel cells, bioenergy, energy efficiency, and hydroelectric -- during the next decade. The state has outstanding scientific expertise, a culture of innovation, a highly-technical workforce, expertise in precision manufacturing, and exceptional institutional and financial services assets. By leveraging and coordinating existing strengths, the state can grow jobs and increase its share of the global clean energy market, and better understanding of the specific drivers and challenges will help Massachusetts to identify and leverage policy and investment opportunities to maximize job creation and economic growth. The Apollo Jobs Report: For Good Jobs and Energy Independence. Institute for America’s Future, the Center on Wisconsin Strategy, and the Perryman Group, January, 2004.
In this report, the Apollo Alliance recommended ambitious EE&RE initiatives for the U.S. and estimated the economic and jobs impact of implementing these initiatives over the next decade. The Apollo Initiative recommended a large scale federal commitment, on the scale of $30 billion/year for 10 years, to achieve a new energy infrastructure that is diversified, environmentally safe, and more efficient. The Apollo Initiative would achieve these benefits by pursuing four broad strategies: Diversify U.S. energy sources, invest in the industries of the future, promote construction of high performance, energy efficient buildings, drive investment in cities and communities: renewing the commitment to building smart public infrastructure for transportation, energy, and other vital public services. The report estimated that a $30 billion investment per year for 10 years would provide the following benefits:
• Add more than 3.3 million jobs to the economy • Stimulate $1.4 trillion in new Gross Domestic Product • Stimulate the economy through adding $953 billion in Personal
Income and $323.9 billion in Retail Sales • Produce $284 billion in net energy cost savings

114
It also found that, by creating jobs and economic growth, this investment will generate sufficient new returns to the U.S. treasury from increased income, to pay for itself over a ten year period. It estimated that the Apollo Initiative will create high-skilled, high-wage jobs:
• Investments in improving the performance of the existing U.S. energy system create good jobs in new construction, and improved maintenance and operations.
• Increasing incentives for energy efficiency also creates new construction investment and good jobs retro-fitting buildings. Energy efficiency is far more labor intensive than generation, creating 21.5 jobs for every $1 million invested, compared to 11.5 jobs for new natural gas generation.
• Renewable energy creates more jobs than other sources of energy, four times as many jobs per megawatt of installed capacity as natural gas and 40 percent more jobs per dollar invested than coal. Most of these jobs will be in the manufacturing, a sector of the economy that has been hemorrhaging jobs since 2001.
• New transit system starts, maintenance of the nation’s passenger train system, development of regional high speed rail networks, and improvements in the nation’s roads and highways will generate good jobs in basic industries. Infrastructure investments also guarantee that spending is made locally, directly stimulating the domestic economy, supporting small business and regional labor markets.
Clean Energy: Jobs for America’s Future. Alison Bailie, Stephen Bernow, William Dougherty, Michael Lazarus, Sivan Kartha, and Marshall Goldberg, report prepared for the World Wildlife Fund, October 2001.
This study analyzed the employment, macroeconomic, energy and environmental impacts of implementing the Climate Protection Scenario -- a suite of policies that would address U.S. energy needs while reducing dependence on fossil fuels and decreasing emissions of greenhouse gases. It found that implementing these policies would help address many of the nation’s most pressing concerns about energy supply, the economy, employment, energy security, and the environment, and that the Scenario would lead to net increases in employment over the next 20 years. The scenario would also reduce U.S. dependence on oil and other fossil fuels, thereby greatly increasing energy security.
The report found that the benefits of implementing the Scenario would be spread widely across all states and all sectors of the economy -- including construction, transportation, motor vehicles, manufacturing, services, retail trade and agriculture. However, some industries within the energy sector would not share in the economic benefits from this transition, as the economy’s reliance on carbon-intensive fossil fuels

115
would decline. This suggests that while there would be widespread gains to workers throughout the economy, it would be necessary to provide assistance and support in order to ensure a just transition for workers who would otherwise be displaced during the beginning of this transition.
If Congress were to implement the policies outlined in WWF’s Climate Protection
Scenario, the United States could reap the following benefits:
• A net annual employment increase of over 700,000 jobs in 2010, rising to approximately 1.3 million by 2020;
• An 8.5 percent decline in carbon emissions between 2000 and 2010, as opposed to the approximately 20 percent increase projected in the base case, and a 28 percent decline between 2000 and 2020 rather than a 36 percent increase;
• Twenty percent of the electricity generation needed in 2020 would come from wind, solar, biomass and geothermal energy;
• Oil consumption would decline by approximately 8 percent between 2000 and 2020, rather than increase by about 31 percent, thereby saving money and reducing the vulnerability of citizens and our economy to oil price shocks;
• Overall dependence on the consumption of fossil fuels would decline more than 15 percent between 2000 and 2020, rather than increasing by 40 percent as in the base case;
• Households and businesses would accumulate savings of over $600 billion by 2020;
• GDP would be about $43.9 billion above the base case in 2020; • Energy-related emissions of air pollution would be dramatically
reduced -- by 2020, emissions of sulfur dioxide would be virtually eliminated, while nitrogen oxide emissions would be almost halved, and emissions of fine particulates, carbon monoxide, volatile organic compounds and mercury would be substantially reduced;
• An additional $51.4 billion in wage and salary compensation by 2020 relative to the base case;
• Each state would experience a positive net job impact, rising to about 140,000 in California by 2020

116
Energy Efficiency and Economic Development in New York, New Jersey, and Pennsylvania. Steven Nadel, Skip Laitner, Marshall Goldberg, Neal Elliott, John DeCicco, Howard Geller, and Robert Morris, American Council for an Energy-Efficient Economy, 1997.
The purpose of this report was to better understand how additional investments in energy efficiency technologies can contribute to lower energy expenditures and new employment opportunities for residents of New York, New Jersey, and Pennsylvania, as well as generally strengthen economic activity and quality of life. The report examined the current energy consumption patterns and expenditures within each of the states and the regional economy, and projected what "business-as-usual" or "baseline" energy patterns might look like through the year 2010. These findings suggest that by 2010 the region as a whole will be approximately seven percent more efficient in how much energy it uses to support a dollar of economic activity (compared to 1993 as measured by Gross State Product [GSP]) due primarily to the fact that new equipment and buildings are generally more efficient than aging equipment and facilities that will be replaced over the next decade. But the findings also show that total energy consumption will increase by 21 percent as a result of a growing economy.
The study then developed two high-efficiency scenarios (one for total energy consumption and one for electricity consumption only) for the region through the year 2010. These high-efficiency scenarios were based upon detailed analysis of energy efficiency potential in buildings in the residential, commercial, and industrial sectors as well as efficiency improvements in light duty vehicles in the transportation sector. The analysis provides estimates of the investments needed to achieve these additional energy savings as well as the resulting economic and environmental benefits.
The findings of the study showed that by 2010, cost-effective investments in
energy efficiency in the three Mid-Atlantic states can:
• Reduce energy use in the region by more than 20 percent, reducing consumer and business energy bills by more than $150 billion cumulatively over the 1997-2010 period;
• Create 164,000 jobs in the region • Reduce emissions of critical air pollutants by up to 24 percent,
helping to improve environmental quality.

117
IV.C.2. Renewable Energy Putting Renewables to Work: How Many Jobs Can the Clean Energy Industry Generate? Daniel M. Kammen, Kamal Kapadia, and Matthias Fripp, RAEL Report, University of California, Berkeley, 2006.
The Energy and Resources Group (ERG) of the University of California, Berkeley, reviewed the findings of 13 independent reports and studies that analyzed the economic and employment impacts of the clean energy industry in the United States and Europe. These studies employed a wide range of methods, which, while lending credence to the findings, also made a direct comparison of the numbers difficult. In addition to reviewing and comparing these studies, the report examined the assumptions used in each case, and developed a job creation model which shows their implications for employment under several future energy scenarios.
The ERG found that expanding the use of renewable energy is not only good for U.S. energy self-sufficiency and the environment, it also has a significant positive impact on employment. This is the conclusion of 13 independent reports and studies reviewed that analyzed the economic and employment impacts of the clean energy industry in the United States and Europe.
The major conclusion of this analysis was that, across a broad range of scenarios, the renewable energy sector generates more jobs than the fossil fuel-based energy sector per unit of energy delivered (i.e., per average megawatt). In addition the ERG found that the employment rate in fossil fuel-related industries has been declining steadily for reasons that have little to do with environmental regulation. Finally, it found that supporting renewables within a comprehensive and coordinated energy policy that also supports energy efficiency and sustainable transportation will yield far greater employment benefits than supporting one or two of these sectors separately. While certain sectors of the economy may be net losers, policy interventions can help minimize the impact of a transition from the current fossil fuel dominated economy to a more balanced portfolio that includes significant amounts of clean energy. Further, generating local employment through the deployment of local and sustainable energy technologies is an important and underutilized way to enhance national security and international stability. Component Manufacturing: Ohio’s Future in the Renewable Energy Industry. George Sterzinger and Matt Svercek, Renewable Energy Policy Project, October 2005. The Renewable Energy Policy Project (REPP) analyzed the potential economic and employment benefits to Ohio of investments in four renewable energy technologies: Wind, solar, biomass, and geothermal. REPP noted that a national program to develop renewable energy will provide significant benefits to states and regions well beyond where projects are developed and will greatly stimulate demand for manufactured components. It was clear from earlier REPP research that many of the states and

118
regions that have suffered the greatest loss of manufacturing jobs have a significant concentration of manufacturing potential to supply those components. The REPP State Reports intend to provide an explanation of how this manufacturing potential is calculated and offer detailed analysis showing for a state, region, and county the potential for each of the 43 industrial codes that comprise the major component parts for the major renewable energy technologies. It is the intent of this report to outline the potential for Ohio from a national commitment to accelerate renewable energy development.
The report expanded earlier REPP analyses of modern, large wind turbine technologies, the results of which were encouraging both for the country as a whole and for Ohio in particular. It showed that investment in new wind energy systems will create a demand for all of the components that make up a wind generator. Twenty-five states have firms currently active in manufacturing components or sub-components for wind turbines; all fifty states have firms with the technical potential to become active.
The results indicated that a significant national investment in wind has clear potential to benefit regions of the U.S. other than only those states that have a significant wind resource. Furthermore, investigating the demographics of the top 20 states benefiting from wind manufacturing indicates that investment in wind will particularly target the most populous regions of the country, and will especially benefit regions that are most in need of new manufacturing jobs.
The methodology developed in the wind energy analyses was here extended to cover photovoltaics, biomass steam generators, and geothermal technologies. For the combined renewable technologies, REPP assumed that 50,000 MW of wind would be developed, 9,260 MW of photovoltaics, 8,700 MW of biomass, and 6,077 MW of geothermal. REPP found that Ohio is particularly well positioned to benefit from wind energy development and, when the picture is expanded to include other renewable energy technologies, the potential benefit to Ohio manufacturing industries is even greater. As in the case of wind technology, Ohio has a manufacturing base in most of the industries relevant to the production of renewable energy components. Specifically, REPP found that a major national renewable energy development program would create nearly 24,200 jobs in Ohio: 14,100 in wind, 6,300 in solar, 1,900 in geothermal, and 1,900 in biomass.
Solar PV Development: Location of Economic Activity. George Sterzinter and Matt Svrcek, Renewable Energy Policy Project, January 2005.
This study noted that, since many areas of the U.S. have the potential to employ PV technologies to produce a significant portion of their electricity needs with little or no environmental pollution, the development of PV is recognized as a critical part of an environmentally responsible national energy policy. The “PV Roadmap,” an industry led effort to assess the best mix of research and market development supports to accelerate PV development, predicted that with a reasonable set of incentives the solar
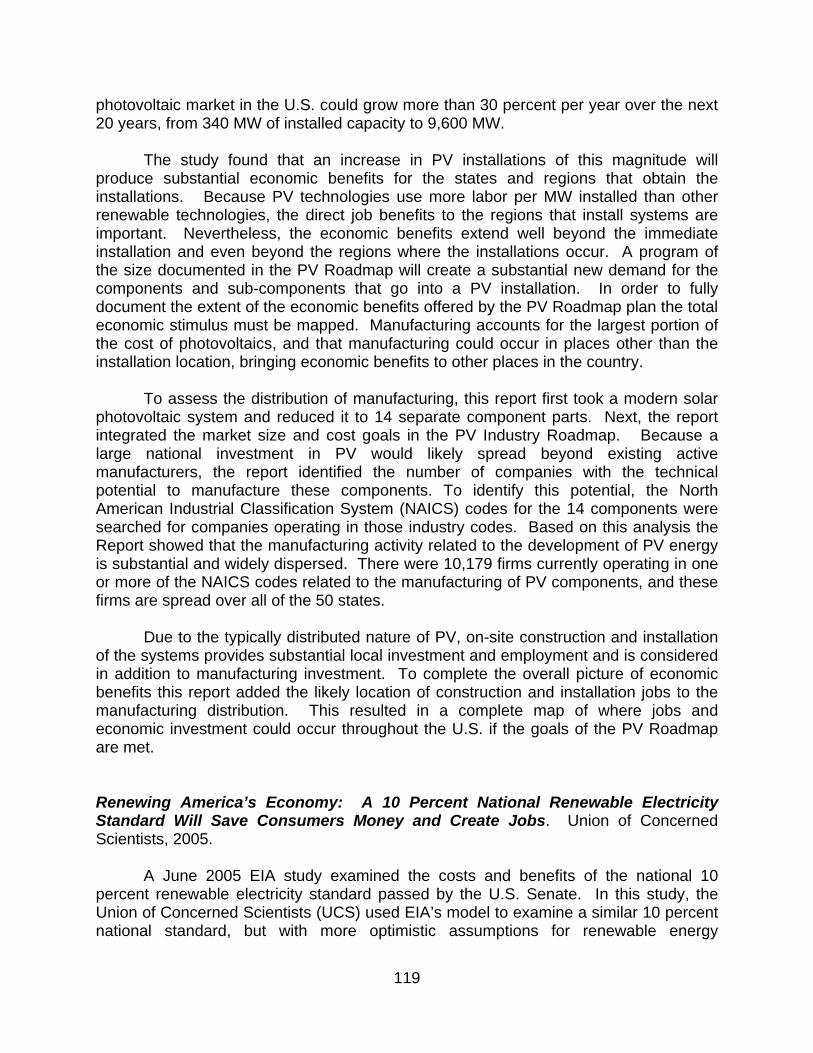
119
photovoltaic market in the U.S. could grow more than 30 percent per year over the next 20 years, from 340 MW of installed capacity to 9,600 MW.
The study found that an increase in PV installations of this magnitude will produce substantial economic benefits for the states and regions that obtain the installations. Because PV technologies use more labor per MW installed than other renewable technologies, the direct job benefits to the regions that install systems are important. Nevertheless, the economic benefits extend well beyond the immediate installation and even beyond the regions where the installations occur. A program of the size documented in the PV Roadmap will create a substantial new demand for the components and sub-components that go into a PV installation. In order to fully document the extent of the economic benefits offered by the PV Roadmap plan the total economic stimulus must be mapped. Manufacturing accounts for the largest portion of the cost of photovoltaics, and that manufacturing could occur in places other than the installation location, bringing economic benefits to other places in the country.
To assess the distribution of manufacturing, this report first took a modern solar photovoltaic system and reduced it to 14 separate component parts. Next, the report integrated the market size and cost goals in the PV Industry Roadmap. Because a large national investment in PV would likely spread beyond existing active manufacturers, the report identified the number of companies with the technical potential to manufacture these components. To identify this potential, the North American Industrial Classification System (NAICS) codes for the 14 components were searched for companies operating in those industry codes. Based on this analysis the Report showed that the manufacturing activity related to the development of PV energy is substantial and widely dispersed. There were 10,179 firms currently operating in one or more of the NAICS codes related to the manufacturing of PV components, and these firms are spread over all of the 50 states.
Due to the typically distributed nature of PV, on-site construction and installation of the systems provides substantial local investment and employment and is considered in addition to manufacturing investment. To complete the overall picture of economic benefits this report added the likely location of construction and installation jobs to the manufacturing distribution. This resulted in a complete map of where jobs and economic investment could occur throughout the U.S. if the goals of the PV Roadmap are met. Renewing America’s Economy: A 10 Percent National Renewable Electricity Standard Will Save Consumers Money and Create Jobs. Union of Concerned Scientists, 2005.
A June 2005 EIA study examined the costs and benefits of the national 10 percent renewable electricity standard passed by the U.S. Senate. In this study, the Union of Concerned Scientists (UCS) used EIA’s model to examine a similar 10 percent national standard, but with more optimistic assumptions for renewable energy

120
technology costs and performance that are more in line with projections by DOE’s national laboratories. Both studies found that the 10 percent by 2020 standard would increase competition in the marketplace, reducing long-term energy costs for homes and businesses by gradually bringing natural gas and electricity prices down.
UCS used a modified version of EIA’s NEMS model developed for AEO 2004 to
examine the costs and benefits of increasing renewable energy use by way of a national renewable electricity standard of 10 percent by 2020 and renewable energy tax credits. It found that the Senate’s 10 percent national standard would reduce natural gas and electricity prices and provide significant economic and environmental benefits for America:
• Consumer savings: $22.6 billion to $37.7 billion in lower electricity
and natural gas bills • Jobs: 91,220 new jobs -- nearly twice as many as generating the
same amount of electricity from fossil fuels • Economic development: $41.5 billion in new capital investment,
$5.7 billion in income to farmers, ranchers, and rural landowners, and $2.8 billion in new local tax revenues
• Healthier environment: Reductions of global warming pollution equal to taking from 25 million to 32 million cars off the road, plus less haze, smog, acid rain, mercury contamination, and water use
UCS found that average consumer electricity prices would be lower than
business-as-usual in every year of the forecast, with an average annual reduction of 1.7 percent. Average consumer natural gas prices would be virtually the same or lower than business-as-usual in nearly every year of the forecast, with an average annual reduction of 0.5 percent. Nationally, the 10 percent standard would save consumers $28.2 billion on their electricity and natural gas bills by 2020, with the savings continuing to grow to $37.7 billion by 2025.
The analysis also found that under a 10 percent by 2020 national standard the U.S. would increase its total homegrown renewable power capacity by more than five times over present levels -- from about 20,000 MW in 2005 to 109,000 MW by 2020. This development would be powered primarily by America’s strong wind, bioenergy, and geothermal resources, producing enough electricity to meet the needs of 73 million typical U.S. homes.
Furthermore, increased renewable energy development would create high-
paying jobs and other economic benefits in the United States. By 2020, the 10 percent standard would generate more than 190,000 jobs in manufacturing, construction, operations, maintenance, and other industries -- nearly twice as many as fossil fuels, representing a net increase of 91,220 jobs. Renewable energy would also provide an additional $5.1 billion in income and $5.9 billion in gross domestic product in the United States’ economy in 2020.

121
The report found that many of the jobs identified above would be created in rural areas where the renewable energy generating facilities would be located. By 2020, the 10 percent national standard would also provide a significant stimulus to the U.S. economy in other ways:
• $41.5 billion in new capital investment • $4.9 billion in payments to rural areas resulting from biomass
energy production • $2.8 billion in new property tax revenues for local communities • $755 million in lease payments to farmers and rural landowners
resulting from wind power generation Wind Turbine Development: Location of Manufacturing Activity. George Sterzinter and Matt Svrcek, Renewable Energy Policy Project, September, 2004.
This report noted that an important concern about renewable energy centers on how widely the benefits from a national commitment to renewable energy development will be spread across all regions and areas of the country, and that wind would be very likely to provide a large part of the renewable energy developed under any national program. Since the best wind resource is in the upper Great Plains region, it is reasonable to conclude that a large portion of the wind developed to meet a national standard will be in that region. Some have interpreted this to mean that a majority of the benefits from a national policy would flow to that region. That conclusion is shortsighted because it neglects to look at the chain of manufacturing related to components and sub-components that go into constructing a modern wind generator. While the economic benefits produced by the construction and operation phases of wind development are important and significant, a substantial portion of the benefits from the investment will result from manufacturing the equipment and will flow to those states and localities that either have or can develop the firms to supply the subcomponents.
In order to assess how the benefits could be distributed, this report took a
modern wind turbine and reduces it to its 20 separate component parts. The report first identified 90 companies in 25 states already active in manufacturing these components. However, a large national investment in wind would likely spread beyond these active companies. Thus, as a second step this report identified the number of companies with the technical potential to enter the wind turbine market. To identify this potential, the North American Industrial Classification System (NAICS) codes for the 20 components were searched for companies operating in those industry codes.
Based on this analysis, the report showed that the manufacturing activity related
to the development of wind energy is substantial and widely dispersed. There are 16,163 firms currently operating in one or more of the NAICS codes related to the manufacturing of wind components. These firms are spread over all of the 50 states,

122
however, they are concentrated in the most populous states, and the states that have suffered the most from loss of manufacturing jobs. The 20 states that, according to the analysis, would receive the most investment and most new manufacturing jobs from investment in wind account for 75 percent of the total U.S. population and 76 percent of the manufacturing jobs lost in recent years. Investment in wind will particularly benefit these states, sending new jobs where they are needed most. Furthermore, these states are also the most populous, indicating that investment in wind will benefit a large range of people in the country. Job Jolt: The Economic Impacts of Repowering the Midwest. Regional Economics Applications Laboratory, University of Illinois, Chicago, 2002.
This report analyzed the implementation of the Midwest Clean Energy Development Plan and concluded that it would create more than 200,000 new jobs across the 10-state Midwest region by 2020, up to $5.5 billion in additional worker income, and up to $20 billion in increased economic activity. The Clean Energy Development Plan promotes modern, energy efficient technologies and development of renewable energy resources, especially wind power and biomass energy. It contrasts with a business-as-usual scenario, which relies almost entirely on coal and nuclear power plants for electricity generation.
The huge resulting “Job Jolt” is the central finding of this study of the economic
impacts of phasing in more clean energy efficient technologies and renewable energy development across the Midwest and Great Plains. The Clean Energy Development Plan for the Heartland is a blueprint for producing economically and environmentally sound power by unleashing the Midwest’s homegrown clean energy potential. It calls for a gradual reduction of over reliance on some of the Midwest’s oldest and most polluting coal and nuclear generating plants that currently account for 95 percent of the region’s electricity generation -- and for a gradual increase in using modern clean energy technologies. To achieve this, the Clean Energy Development Plan calls for:
• Implementing cost-effective energy efficiency technologies to level
off the region’s overall electricity demand. • Diversifying the region’s over-dependence on coal and nuclear
plants by developing more renewable energy generating technologies: Wind and solar power, and biomass energy locked inside agricultural crops, such as switchgrass and cornhusks.
The magnitude of the estimated job and dollar gains is enormous. New jobs
resulting from implementing the Clean Energy Development Plan would be more than twice the total employment in the Midwest electric utility industry. The economic impacts from implementing the Plan would be distributed throughout the Midwest and Great Plains in both metropolitan and rural areas, and in every sector of the regional economy from manufacturing to construction to farming. For example: Jobs manufacturing and installing modern commercial lighting and efficient ballasts and

123
Energy Star® rated appliances, jobs manufacturing and assembling wind turbines and solar panels, and new sources of farm income from wind turbine leases and growing and processing biomass energy crops.
This job gain and economic growth greatly outweigh the projected loss of jobs and income in the electric utility industry caused by reducing demand for power from coal and nuclear plants. The report concluded that a partial switch to cleaner, smart energy efficiency and renewable energy would energize the Midwest economy with hundreds of thousands of new jobs. The Work That Goes Into Renewable Energy. Virinder Singh with BBC Research and Consulting and Jeffrey Fehrs, Renewable Energy Policy Project, November 2001.
This 2001 REPP/BBC report examined the labor requirements for renewable energy in the United States, from collecting fuel to manufacturing components to building and running power plants. It found that a variety of reinforcing trends make it essential to understand the job benefits of renewables. Renewable energy is growing steadily both domestically and worldwide, thanks to policy and technological advances, and in the United States, policies such as state energy funds, state mandates for renewables, environmental regulations, improved technology and retail consumer interest have increased the number of installations. Globally, dramatic growth continues in developed nations such as Denmark, Germany and Japan as well as the developing world.
Specifically, this study estimated the total hours required to manufacture, install
and service wind power and solar photovoltaics (PV). For biomass co-firing, this study estimated the hours needed to collect, transport, and process biomass to fuel a portion of a power plant primarily fueled by coal. The study was based upon extensive surveys of firms with U.S. operations, and the co-firing study included literature review, since there were few commercial operations.
On an energy capacity basis, PV employs the most workers among the renewables examined in this report, followed by wind and biomass co-firing. Co-firing has a range of job requirements, since different forms of biomass have different labor needs. Energy crops such as switchgrass provide the most jobs, and mill residues and urban wood wastes provide jobs at the low end of the co-firing job range. Module assembly (30 percent), systems integration (17 percent) and contracting (15 percent) make up almost two-thirds of jobs in PV. Blade manufacturing (26 percent), turbine servicing (20 percent) and installation (11 percent) lead the activities within the wind power sector in job requirements. Since co-firing represents a range of biomass feedstock and an associated range of job requirements, different activities hold different relative job values depending on the feedstock. Farming is the most important source of work when co-firing with energy crops, whereas Truckers obtain the most work for mill residues.

124
The report found that economies of scale and technological change will affect labor requirements in the future:
• PV manufacturing plants will grow in size and undergo more automation in module manufacturing, with both trends reducing the need for labor. The labor requirements for installation should also decline as local markets grow and standardized PV systems become the norm.
• The wind industry will feature more advanced rotor manufacturing, reductions in custom design of blades, and lower operations and maintenance (O&M) needs. These factors will reduce the need for labor. Economies of scale may represent over half the overall cost reductions for wind over the next 30 years, with reduced labor being one component of lower costs.
• Biomass co-firing may witness greater yields in energy crops that reduce labor requirements for cultivation and harvesting. However, because biomass co-firing is in its infancy, it is difficult to predict what labor trends will occur.

125
V. FINDINGS AND IMPLICATIONS The implications of this research can be divided into those derived from analysis of the five down-selected studies and those derived from review of all of the studies. V.A. Implications Derived From the Five Down-Selected Studies
Rigorous analysis of the down-selected studies can help identify best practices from the studies that can potentially be applied to the activities of special interest to NETL. Specifically, the strengths and innovations of each of these studies can be utilized and integrated to develop a comprehensive analytical approach that can serve NETL’s needs. A review of the potential contributions of each of the five studies for increasing the quality of job creation estimates related to NETL technologies and general analyses indicates this. The BBC study provided:
• Utilization of NETL and EPRI technical studies of advanced coal PC and IGCC plants for estimating relevant plant modeling parameters.
• Emphasis on the “good, union” jobs that will be created by advanced coal initiatives and the involvement of major labor unions as stakeholders. However, to accomplish this will require disaggregation of the jobs created; e.g. boilermakers, machinists, tool and die makers, sheet metal workers, etc.
• Recognition that advanced coal with CCS is necessary for energy, environmental, and economic reasons.
• Consideration of realistic, alternate scenarios for advanced coal with CCS.
• Focus on actual proposed legislation, e.g., HR 6258, giving the analysis special relevance.
• Use of state-of-the-art, noncontroversial economic and statistical techniques, providing credibility and estimates of direct plus indirect job creation.
The Noblis study offered:
• Rigorous specifications of the detailed technical components of CTL plants.
• Identification of potential worldwide manufacturing and supply of the major CTL capital components.
• Recognition that aggressive ramp-up may strain available labor supply.
• Realization that labor supply will have to be increased to permit desired ramp-up.
• Some (but insufficient) labor category disaggregation.

126
The University of Wyoming study provided:
• An excellent example of a relevant cost-benefit analysis for a specific state using actual, proposed state IGCC incentives
• Consideration of alternate regional locations within the state • Keen awareness of state policies and decision-making processes • Emphasis of the critically important point that coal states – such as
Wyoming – can realize much greater value from their coal resources by utilizing them in-state, rather than simply exporting coal
• Recognition that future advanced coal plants will likely require CCS, and that this will be expensive
The Penn State study offered:
• Emphasis on the economic and employment value of coal as the low-cost electricity generation option and the severe economic and jobs consequences that result from displacing it
• Development of economic and jobs impact estimates at the regional and state levels
• Development of economic output, income, and jobs impacts for each state under different scenarios
• Estimation of the total net economic and jobs impacts – net of the positive effects of utilizing alternate electricity generation technologies.
• Estimation of the value to the U.S. of the increased economic output, earnings, and employment associated with projected coal utilization, and the losses to the U.S. if coal use is curtailed
The MISI/SAIC study:
• Emphasized that simultaneous implementation of liquid fuels mitigation options must be analyzed
• Contained the highest level of economic, industry, employment, jobs, and occupational detail
• Emphasized the importance of simultaneously modeling demand side and supply side options
• Estimated important supplemental economic benefits, such as corporate sales and profits, government tax revenues, and oil import reduction
• Emphasized that long lead times were inevitable for any of the mitigation options
Thus, these studies indicate the following capabilities necessary for a
comprehensive data base and modeling system to increase the quality of job creation estimates related to NETL technologies and general analyses:

127
• The best detailed, credible technical specifications and parameters
available from DOE, NETL, EPRI and other organizations for IGCC, PC, CTL, EOR, CCS, etc. should be utilized at the front end of the modeling effort. While these data are available, their appropriate use is often inconsistent among studies.
• Realistic implementation schedules for the technologies should be utilized. Thus, for example, aggressive initiatives beginning in 2010 for technologies such as CTL, IGCC, and EOR can be realistically modeled. However, it would be unrealistic to assume such an early start date for zero emission coal plants or many of the advanced CCS technologies.
• The implementation schedules should be realistic and recognize that for any energy technology there will inevitably be a substantial time lag before significant impacts are felt. Constructing major energy plants takes at least four years, and most energy saving initiatives take at least as long to implement, and this implies that significant energy impacts at the national level will not be realized for at least a decade. Thus, objectives such as “energy independence by 2020” or “decarbonization of U.S. electricity production within 10 years” are not realistic.
• As much detail for the plant capital equipment and components should be included – detail on capital such as air separation units, gasifiers, reactors, controls, etc. This is especially important if aggressive, simultaneous energy initiatives are being modeled. This information will permit identification of the potential suppliers of the equipment (domestic or foreign) and determination if there may be supply-side capital constraints.
• A high level of industrial detail is also required, and this should be at least the 70-order NAICS level. This detail is required for several reasons. First, it will permit further identification of industrial capital, component, and system requirements. Second, this detail is required if input-output techniques are to be used to estimate total economic and industrial requirements. Third, such detail is required to develop employment requirements.
• Input-output methodology is required to estimate the total (direct plus indirect) output required throughout the economy. This methodology is standard and widely applied, and was utilized in many of the 50 studies reviewed here.
• It is essential that as much detail as possible be included on jobs, occupations, and skills. Jobs, skills, occupational requirements, education and training requirements and related concerns are always critical issues and must be incorporated into the modeling effort.
128
• Similarly, state-level and regional economic and jobs estimates are required. Benefits estimates are especially relevant at the state and local level and are required by policy-makers and decision-makers at this level of detail. These estimates can be derived using regional econometric forecasting models and variations of the regional input-output modeling system (RIMS).
• The modeling system developed should have the capability to estimate, not only proposed new coal initiatives, but also the current value of coal to the economy and the cost to the economy of reducing coal utilization. Coal is currently the nation’s most abundant, cheapest, secure, and valuable energy resource. However, this value is not widely recognized and needs to be quantified and emphasized.
• Actual, proposed incentives and policy initiatives must be simulated and analyzed to add relevance and credibility to the results. Two good examples in the studies down-selected are the BBC modeling of the effects of HR 6258 and the University of Wyoming modeling of proposed state tax incentives for IGCC.
• Supply side capital and labor constraints must be considered in the analysis – especially for aggressive programs that assume simultaneous implementation of numerous energy initiatives. It should be determined whether adequate supplies of specific capital equipment and labor with the necessary skills are likely to be available in the quantities required.
• Supply side capital and labor constraints must also be considered even for single plant initiatives. For example, while the development of a large advanced coal plant in a state such as Ohio or Michigan is not likely to strain available labor resources, development of such a plant in a state such as Wyoming may result in local labor and skill shortages
• The model should have the capability to simulate the widespread implementation of numerous ambitious energy programs. Indeed, many problems and concerns could arise from the attempt to address U.S. energy problems with multiple energy demand side and supply side initiatives, which may encounter serious capital and labor constraints – especially in the near term.
• The model should have the capability of estimating all of the benefits of coal utilization, in terms of environment, national security, tax revenues, balance of payments, regional development, energy prices, etc.
• The modeling effort should recognize that for future advanced coal development, some type of CCS will likely be required and must be included and appropriately priced.

129
• Estimates should be developed of the net economic and jobs impacts of the programs and initiatives simulated – net of the effects of utilizing alternate electricity generation or energy production technologies.
Development of a modeling capability with the characteristics listed above could be used to analyze many of the issues that are of interest to NETL and that are germane to the current project. For example, NETL has analyzed the CO2 mitigation potential of increasing the efficiency of existing coal-fired power plants and is interested in expanding this analysis to estimate the potential economic and employment impacts of engaging in a U.S.-wide efficiency improvement program. The impacts of such a program could range from employment and economic activity related to installing new equipment to impacts associated with marginal operation cost declines which could lead to lower end-user prices or increased profits. The down-selected studies offer important guidelines as to how this analysis could be conducted and how a range of potential economic and employment impacts associated with a U.S.-wide efficiency coal-fired power plant efficiency improvement program could be estimated. For example, for specific plants, careful consideration of specific technical capital equipment and components will be required, as will detailed industrial economic effects and impacts on jobs, occupational, and skill requirements – as demonstrated in the Noblis, BBC, and MISI/SAIC studies. Direct and indirect economic and employment effects can be estimated at the national, state, and regional levels – as demonstrated in the BBC, Wyoming, and MISI/SAIC studies. The effects of marginal cost declines could be estimated using the type of techniques utilized in the Penn State study.
As another example, significant changes in energy costs could have a measurable impact on GDP, and NETL seeks to better understand the relationship between energy intensity and GDP and the impacts of changing energy prices on GDP. Specifically, NETL is interested in analyzing the relationship between energy costs and GDP in both the short- and long-runs, differentiating between efficiency improvements and industrial restructuring and dislocation. The studies reviewed here can provide important input to this assessment:
• The Noblis and Wyoming studies indicate how the micro-level plant and regional estimates of the effects of energy costs can be derived
• The BBC, Penn State, and MISI/SAIC studies indicate how the macro-level and industrial economic and employment effects can be estimated
• Some of the other studies reviewed here offer insight into the long term industrial dislocation effects of changes in energy costs.

130
V.B. Implications Derived From All Studies Reviewed The most striking impression that emerges from the overall literature review is that many more studies of the economic and jobs impacts of green energy, clean energy, and renewable energy programs have been conducted in recent years than similar studies relating to fossil fuels or advanced coal programs. The difference is an order of magnitude of 10 or 20 to one. Many of these studies contend that green energy or renewable energy programs are preferable to fossil or nuclear energy programs on economic, employment, environmental, and other grounds. For example, a recent study reviewed here – Green Recovery – contended that, per dollar of expenditure, green energy programs create both more jobs and higher paying jobs than other types of energy investments.
Focusing on the reports dealing with government programs and advanced coal and fossil energy programs, a great diversity of studies are available with respect to level of effort, quality, coverage, and credibility. Several of the studies reviewed were extremely well done and were candidates for down-selection. For example, the Southern Illinois University study of the economic impact of Futuregen, the Northern Illinois University study of the economic impact of the Taylorville Energy Complex, the Penn State University study of the economic benefits of coal conversion investments, the SSEB study of energy scenarios, and the NETL studies of the Lab’s regional impacts were comprehensive, rigorous, and credible.
Most of the other studies were of decidedly mixed quality: Some were relatively
well done and credible, others were of questionable quality; for example:
• The studies of the impact of the NASA Glenn facility in Ohio and of Brookhaven National Lab in New York were rigorous and credible.
• Most of the studies of the impacts of specific proposed new coal plants were poorly documented, of questionable validity, and were presented more as hype than as rigorous analyses. The fact that most of these studies were conducted or funded by the company seeking to build the new facility did not add to the studies’ credibility.
• Further, individual plant siting studies often had significantly different estimates of the normalized economic and jobs impacts of plant construction and operation, which resulted from different definitions, assumptions, and modeling techniques. It is thus difficult to compare them.
One major failing that virtually every study reviewed here shared is the failure to distinguish between gross economic and job impacts and net economic and job impacts. Nearly every study estimated gross impacts, without estimating – or usually even discussing – alternative uses of expenditures or program funds or discussing the concept of opportunity costs. Resources are not finite, and funds expended on one program or set of priorities are not available for other uses. This approach to impact

131
analysis unfortunately yields results showing that all impacts are positive and none are negative; this provides an incomplete view of economic impacts. One notable exception to this was the MISI study of the economic and jobs impact of federally mandated vehicle fuel efficiency standards. This study estimated that, while enhanced CAFE standards would increase overall employment and most industries and occupation would gain jobs, some industries and occupations will lose jobs. Further, it also estimated that while most states would gain substantial numbers of jobs, job increases and decreases would be spread unevenly among different sectors and industries within each state, and there would thus be job shifts within and among states. This type of net job loss and displacement analysis is necessary to establish the credibility of any major energy program impact study. Many of the studies reviewed focused on comparing the relative job creating potential of different types of energy programs and initiatives. For example, the green energy studies often found that green energy, energy efficiency, and renewable energy programs created far more jobs (and usually “better” jobs) than equivalent investments in other types of energy programs, such as coal, oil, nuclear, etc. However, what is lacking is an objective and rigorous analysis of this critical issue. How can equivalent expenditures always create more and “better” jobs if devoted to one type of energy program as opposed to another? What are the guidelines for comparison? Are more labor intensive programs always to be preferred simply because they create more jobs? If the latter is the case, then perhaps we should be constructing highways with shovels, picks, and wheel barrels rather than using bulldozers and large earth moving equipment. The relative job creation issue is important and requires rigorous analysis.
Finally, a critical issue that few of the studies adequately address is that of net energy productivity and cost. The progress of the world energy economy over the past several centuries has been one of increasingly intense, efficient use of relatively low-cost, available, and abundant energy resources. If this begins to change in the future – for environmental, economic, or other reasons, and we must rely on more scare, diverse, difficult to develop, and relatively costly energy sources, the long-term impacts on economic and job development may be unfavorable. This is an important issue addressed in few of the studies reviewed here.

132
REFERENCES
Advanced Resources International. Recovering “Stranded Oil” Can Substantially Add to U.S. Oil Supplies. A series of reports prepared for the U.S. Department of Energy, Office of Fossil Energy, 2006. Altman, Ira. FutureGen: The Economic Impacts of Clean Coal for Illinois. Department of Agribusiness Economics, College of Agricultural Sciences, Southern Illinois University-Carbondale, June 2007. American Solar Energy Society and Management Information Services, Inc. “RE&EE in Colorado Compared to the Oil and Gas Sector,” Chapter IX in Defining, Estimating, and Forecasting the Renewable Energy and Energy Efficiency Industries in the U.S and in Colorado, December 2008. Bailie, Alison, Stephen Bernow, William Dougherty, Michael Lazarus, Sivan Kartha, and Marshall Goldberg. Clean Energy: Jobs for America’s Future. Report prepared for the World Wildlife Fund, October 2001. Barrett, James, J. Andrew Hoerner, Jan Mutl, Johann Wolfgang Goethe, Alison Bailie and Bill Dougherty. Jobs and the Climate Stewardship Act: How Curbing Global Warming can Increase Employment, Natural Resources Defense Council, 2005. Barrett, James P., and J. Andrew Hoerner. Making Green Policies Pay Off: Responsible Climate-Change Package Can Benefit Environment, Workforce. Washington, D.C.: Center for a Sustainable Economy and Economic Policy Institute, April 2000. Bartis, James T. Frank Camm, and David S. Ortiz. Producing Liquid Fuels from Coal: Prospects and Policy Issues. Report prepared for the United States Air Force and the National Energy Technology Laboratory by of the RAND Corporation, 2008. BBC Research and Consulting. Employment and Other Economic Benefits from Advanced Coal Electric Generation with Carbon Capture and Storage. Report prepared for the Industrial Union Council, AFL-CIO; the International Brotherhood of Boilermakers, Iron Ship Builders, Blacksmiths, Forgers, and Helpers; the International Brotherhood of Electrical Workers; the United Mine Workers of America; and the American Coalition for Clean Coal Electricity, Denver, Colorado, February 2009. Beecy, David. “Opportunities for Increasing Revenues from State and Federal Lands: Pursuing the ‘Stranded Oil’ Prize.” Presented at the Eastern Lands and Resources Council and Western States Land Commissions Association Joint Spring Conference, Washington, D.C., April 17-20, 2005.

133
Bergeron, Lisa, and John Lewis. The Economic Impacts of an Electric Power Generation Facility in Illinois. Regional Development Institute, Northern Illinois University, May 2007. Bezdek, Roger H. “Liquids from Coal,” Chapter V in The Urgency of Sustainable Coal, National Coal Council, May 2008. _______________. “The Outlook For Unconventional Fuels,” presented at the conference “Integrating Energy Policy and Climate Policy,” sponsored by the Association for Energy Economics and the Johns Hopkins University School of Advanced International Studies, Washington, D.C., April 2008. _______________. “Energy Workforce Needs for the 21st Century,” prepared for the National Research Council of the National Academies of Science, April 2006. Bezdek, Roger and Robert Wendling, “Fuel Efficiency and the Economy,” American Scientist, Volume 93 (March-April 2005), pp. 132-139 _______________. “Potential Long-term Impacts of Changes in U.S. Vehicle Fuel Efficiency Standards,” Energy Policy, Vol. 33, No. 3 (February 2005), pp. 407-419. Board on Environmental Studies and Toxicology. “Estimating the Public Health Benefits of Proposed Air Pollution Regulations,” 2002. Booz Allen Hamilton. Oil and Gas Impact Analysis. Report prepared for the Colorado Energy Research Institute, June 2007. Center for Business and Economic Research, College of Business Administration, University of Tennessee, Knoxville. The Economic Benefits of the U.S. Department of Energy for the State of Tennessee. Report prepared for the U.S. Department of Energy, Oak Ridge Office, June 2005. Center on Wisconsin Strategy and the Perryman Group. The Apollo Jobs Report: For Good Jobs and Energy Independence. Report prepared for the Institute for America’s Future, January 2004. Clean and Diversified Energy Advisory Committee of the Western Governors. Clean Energy, a Strong Economy, and a Healthy Environment. Report prepared for Western Governors Association, June 2006. Considine, Tim. Coal: America’s Energy Future, Volume II, “Appendix: Economic Benefits of Coal Conversion Investments.” Prepared for the National Coal Council, March 2006. Colorado Energy Research Institute, Oil and Gas Impact Analysis, June 2007.

134
Consumers Energy. Economic Impact Study of Consumers Energy’s Planned Expansion of the Karn/Weadock Generating Complex in Michigan. 2007. Coolimba Power. Commercializing Carbon Capture and Storage. 2008. Coupal, Roger, Robert Godby, David Bell, David Taylor, Jamison Pike, and Thomas Foulke. An Economic Impact Analysis of Proposed Tax Incentives to Attract Integrated Gasification Combined Cycle Power Generation Facilities to Wyoming. Report prepared for the Wyoming Infrastructure Authority, University of Wyoming, School of Energy Resources and Office of Research, January 9, 2007. “Department of Energy Selects OUC, Southern Company to Build Clean Coal Technology Plant.” U.S. Department of Energy, 2004. Department of Economics and the Political Economy Research Institute (PERI) at the University of Massachusetts-Amherst. Green Recovery: A Program to Create Good Jobs and Start Building a Low-Carbon Economy. Report prepared for the Center for American Progress, September 2008. Dunne, Timothy, and David R. Merrell “Gross Employment Flows in U.S. Coal Mining.” Economics Letters, May 2001, v. 71, issue 2, pp. 217-24, May 2001. Excelsior Energy, Inc. Mesaba Energy Project: Report to the Minnesota Public Utilities Commission. December 2005. Friedman, David, et. al. Drilling in Detroit: Tapping Automaker Ingenuity to Build Safe and Efficient Automobiles, Union of concerned Scientists, UCS Publications, Cambridge, MA, June 2001 Glasmeier, Amy, and Tom Bell. Economic Development Potential of Conventional and Potential Alternative Energy Sources in Appalachian Counties. Appalachian Regional Commission, June 21, 2006. Goldberg, Marshall, Michael Milligan, and Karin C. Sinclair. “Job And Economic Development Impact (Jedi) Model: A User-Friendly Tool To Calculate Economic Impacts From Wind Projects.” National Renewable Energy Laboratory, March 2004. “Governor Paterson Announces Support For New Advanced Coal Power Plant For Jamestown – First of its Kind in the World.” June 10, 2008. Idaho National Laboratory. The Cost of Not Building Transmission: Economic Impact of Proposed Transmission Line Projects for the Pacific Northwest Economic Region. July 2008.

135
Intelligent Energy Choices for Kentucky’s Future: Kentucky’s 7-Point Strategy for Energy Independence. Report prepared for Governor Steven L. Beshear, November 2008. Jackson, Randall, Lisa Phares, and Christa Jensen. Project Methodology & Model Implementation Plan EPAct Project: Valuing Domestically Produced Natural Gas and Oil. Report prepared for the National Energy Technology Laboratory, DOE/NETL-404.03.02/100608, October 6, 2008. Kamer, Pearl M. The Economic Impact of Brookhaven National Laboratory on the New York State Economy. Report prepared for the Brookhaven National Laboratory, October 2005. Kammen, Daniel M., Kamal Kapadia, and Matthias Fripp. Putting Renewables to Work: How Many Jobs Can the Clean Energy Industry Generate? RAEL Report, University of California, Berkeley, 2006.
Kleit, Andrew N. Short-and Long-Range Impacts of Increase in the Corporate Average Fuel Economy (CAFE) Standard, 2002. Lahr, Michael L, and Edward J. Bloustein. The Economic Contribution of Military and Coast Guard Installations to the State of New Jersey. Report prepared for the Office of the Governor of New Jersey by the Center For Urban Policy Research and the School Of Planning & Public Policy, Rutgers, the State University of New Jersey, April 29, 2004. Leeds Business Research Division, University of Colorado. The Impact of Federally Funded Laboratories in Colorado. May 2008. Management Information Services, Inc. Lights Out in 2009? Report prepared for NextGen Energy Council, October 2008. Management Information Services, Inc. and SAIC. Economic Impacts of U.S. Liquid Fuel Mitigation Options. Report prepared for the National Energy Technology Laboratory, July 2006. Management Information Services, Inc. and 20/20 Vision, Fuel Standards and Jobs: Economic, Employment, Energy, and Environmental Impacts of Increased CAFE Standards Through 2020, report prepared for the Energy Foundation, San Francisco, California, July 2002 Massachusetts Technology Renewable Energy Trust. Energy Efficiency and Renewable Energy: A Growing Opportunity for Massachusetts. Westborough, Massachusetts, November 2005.

136
Moore Economics. The Economic Contributions of U.S. Mining in 2007: Providing Vital Resources for America. Report prepared for the National Mining Association, February 2009. Nadel, Steven, Skip Laitner, Marshall Goldberg, Neal Elliott, John DeCicco, Howard Geller, and Robert Morris. Energy Efficiency and Economic Development in New York, New Jersey, and Pennsylvania. American Council for an Energy-Efficient Economy, 1997. National Energy Technology Laboratory. National, State, and Regional Economic and Environmental Impacts of NETL: Pennsylvania-West Virginia Region. U.S. Department of Energy, September 2007. _______________. Sales and Benefits of Technology from Clean Coal Demonstration Projects. 2006. National Research Council. Effectiveness and Impact of Corporate Average Fuel Economy (CAFE) Standards, National Academy Press, Washington, D.C. 2002. Noblis. Building a U.S. Coal-to-Liquids (CTL) Industry: Requirements and Implications. Report prepared for DOE under the technical direction of the National Energy Technology Laboratory, October 2007. “NRG Energy, Inc. Receives Conditional Award to Build Advanced Coal-Gasification Power Plant in Western New York: Will Enter into a Strategic Alliance with NYPA.” Company Release, 12/19/2006. Nuclear Energy Institute. “Nuclear Power Plants Provide More Jobs Than Other Sources of Electricity.” January 29, 2009. Phares, Lisa, Deborah Lange, Christopher Hendrickson, Randall Jackson, and David Martinelli. National, State, and Regional Economic and Environmental Impacts of NETL. Report prepared for the National Energy Technology Laboratory, DOE/NETL-404.02.01, June 30, 2007. Poulson, Barry, J.P. Giovanni, and Tapan Munroe. “National Economic Benefits Associated With a Moderate Four-Emission Approach to Power-Plant Regulation.” Journal of Energy & Development, Autumn 2002, Vol., 28, Issue 1, pp. 69-95. PricewaterhouseCoopers. Underground Coal Gasification: Industry Review and an Assessment of the Potential of UCG and UCG Value Added Products. May 2008. Regional Economics Applications Laboratory. Job Jolt: The Economic Impacts of Repowering the Midwest. University of Illinois, Chicago, 2002.

137
Renner, Michael. Working for the Environment: A Growing Source of Jobs. Worldwatch Paper 152, Washington, D.C.: Worldwatch Institute, 2000. Rose, Adam, and Dan Wei. The Economic Impacts of Coal Utilization and Displacement in the Continental United States, 2015. Report prepared for the Center for Energy and Economic Development, Inc., Alexandria, Virginia, the Pennsylvania State University, July 2006. Sadowski, Robert. The NASA Glenn Research Center: An Economic Impact Study, Fiscal Year 2004. Report prepared for the NASA Glenn Research Center, December 1, 2005. SAIC. Analysis of the Lieberman-Warner Climate Security Act (S. 2191) Using the National Energy Modeling System (NEMS/ACCF/NAM). Report prepared for the American Council for Capital Formation and the National Association of Manufacturers, April 2008. Schoening, Niles C., and Mary S. Spann. The Economic Impact of Defense Spending on Huntsville/Madison County. Report prepared by Office of Economic Development, University of Alabama in Huntsville, for the Huntsville/Madison County Chamber of Commerce, Huntsville, Alabama, December 2003. Singh, Virinder, and Jeffrey Fehrs. The Work That Goes Into Renewable Energy. BBC Research and Consulting and Renewable Energy Policy Project, November 2001. Southern States Energy Board. American Energy Security: Building a Bridge to Energy Independence and to a Sustainable Energy Future. Norcross, Georgia, July 2006. Sterzinger, George, and Matt Svercek. Component Manufacturing: Ohio’s Future in the Renewable Energy Industry. Renewable Energy Policy Project, October 2005. _______________. Solar PV Development: Location of Economic Activity. Renewable Energy Policy Project, January 2005. _______________. Wind Turbine Development: Location of Manufacturing Activity. Renewable Energy Policy Project, September, 2004. Sutherland, R.J. et. al. The Impact of High Energy Price Scenarios on Energy-Intensive Sectors: Perspectives from Industry Workshops. Argonne National Laboratory, PB97-181556INZ, July 1997 Tegen, S. Comparing Statewide Economic Impacts of New Generation from Wind, Coal, and Natural Gas in Arizona, Colorado, and Michigan. National Renewable Energy Laboratory, NREL/CP-500-38154, August 2005.

138
Teotia, Arvind, et al. “CAFE Compliance by Light Trucks: Economic Impacts of Clean Diesel Engines.” Energy Policy, v. 27, 1999, pp. 889-900. Texas Bureau of Economic Geology. CO2-Enhanced Oil Recovery Resource Potential in Texas: Potential Positive Economic Impacts, April 2004. Union of Concerned Scientists. Renewing America’s Economy: A 10 Percent National Renewable Electricity Standard Will Save Consumers Money and Create Jobs. 2005. _______________. Creating Jobs, Saving Energy and Protecting the Environment: An Analysis of the Potential Benefits of Investing in Efficient Cars and Trucks. Cambridge, Massachusetts, July 2004. _______________. Fuel Economy as an Engine for Job Growth, Cambridge, Massachusetts, February 2002. U.S. Energy Information Administration. Impacts of the Kyoto Protocol on U.S. Energy Markets and the U.S. Economy, October 1998. U.S. Environmental Protection Agency. Impacts of the Acid Rain Program on Coal Industry Employment. EPA 430-R-01-002, March 2001. Utt, Ronald D. Highways and Jobs: The Uneven Record of Federal Spending and Job Creation. Heritage Foundation, Backgrounder #1747, April 15, 2004 Western Resource Advocates. Western Coal at the Crossroads. April 2006. White House Council of Economic Advisers. The Kyoto Protocol and the President's Policies to Address Climate Change, July 1998.