Embed Size (px)
Citation preview

Literature Review for Intoeing Gait
Search terms used and how combined to reduce
Strategy 362294
# Database Search term Results
1 CINAHL (in-toeing gait).ti,ab 10
2 CINAHL (Tibial torsion).ti,ab 84
3 CINAHL (Normal variant walking).ti,ab 5
4 CINAHL (pigeon toed).ti,ab 0
5 CINAHL (growing child).ti,ab 2893
6 CINAHL (lower limb posture).ti,ab 184
7 CINAHL, Medline, PubMed (in-toeing gait).ti,ab 55
8 Medline, PubMed (tibial torsion).ti,ab 930
10 Medline, PubMed (pigeon toed).ti,ab 332
11 Medline, PubMed (growing child).ti,ab 4687
12 Medline, PubMed (lower limb posture).ti,ab 548
13 CINAHL (1 AND 5) 0
14 CINAHL (5 AND 6) 1
15 CINAHL (lower limb posture).ti,ab
[Human age groups Infant: 1-23
months OR Child~ Preschool:
2-5 years OR Child: 6-12 years
OR Adolescent: 13-18 years]
41
16 CINAHL (development of walking).ti,ab 756
17 CINAHL (development of walking).ti,ab
[Human age groups Infant: 1-23
months OR Child~ Preschool:
196
2-5 years OR Child: 6-12 years
OR Adolescent: 13-18 years]
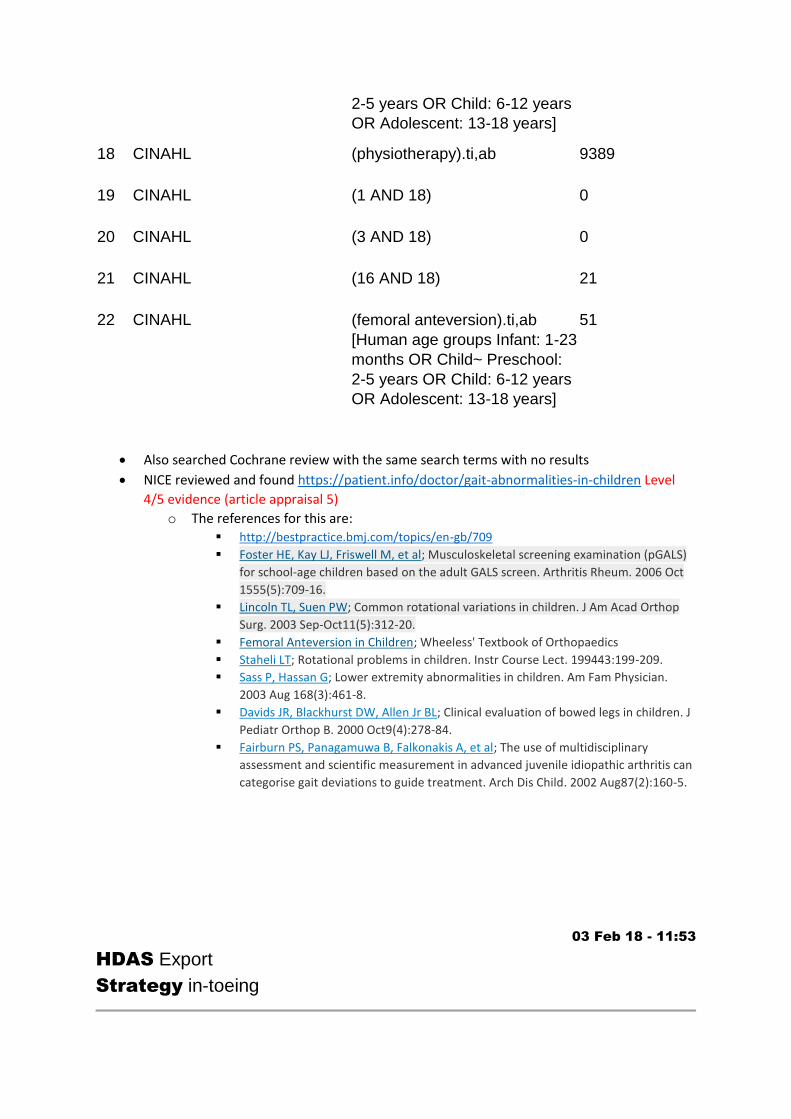
18 CINAHL (physiotherapy).ti,ab 9389
19 CINAHL (1 AND 18) 0
20 CINAHL (3 AND 18) 0
21 CINAHL (16 AND 18) 21
22 CINAHL (femoral anteversion).ti,ab
[Human age groups Infant: 1-23
months OR Child~ Preschool:
2-5 years OR Child: 6-12 years
OR Adolescent: 13-18 years]
51
Also searched Cochrane review with the same search terms with no results
NICE reviewed and found https://patient.info/doctor/gait-abnormalities-in-children Level
4/5 evidence (article appraisal 5)
o The references for this are: http://bestpractice.bmj.com/topics/en-gb/709
Foster HE, Kay LJ, Friswell M, et al; Musculoskeletal screening examination (pGALS)
for school-age children based on the adult GALS screen. Arthritis Rheum. 2006 Oct
1555(5):709-16.
Lincoln TL, Suen PW; Common rotational variations in children. J Am Acad Orthop
Surg. 2003 Sep-Oct11(5):312-20.
Femoral Anteversion in Children; Wheeless' Textbook of Orthopaedics
Staheli LT; Rotational problems in children. Instr Course Lect. 199443:199-209.
Sass P, Hassan G; Lower extremity abnormalities in children. Am Fam Physician.
2003 Aug 168(3):461-8.
Davids JR, Blackhurst DW, Allen Jr BL; Clinical evaluation of bowed legs in children. J
Pediatr Orthop B. 2000 Oct9(4):278-84.
Fairburn PS, Panagamuwa B, Falkonakis A, et al; The use of multidisciplinary
assessment and scientific measurement in advanced juvenile idiopathic arthritis can
categorise gait deviations to guide treatment. Arch Dis Child. 2002 Aug87(2):160-5.
03 Feb 18 - 11:53
HDAS Export
Strategy in-toeing

See full search strategy
Strategy 362294/saved
Contents 15 of 15 results on Saved Results
1. Rotational deformities of the long bones can be corrected with rotationally guided growth during
the growth phase. Not relevent as done with Rabbits
2. Lower Extremity Abnormalities in Children. Evidence based opinions discussed – Level 4/5 evidence (article appraisal 1)
3. Sex differences in clinical measures of lower extremity alignment. Reviews measurements of adults so not relevant to the paediatric population
4. Lower extremity abnormalities in children. Level4/5 evidence author opinion only no clear review of evidence to support (article appraisal 2)
5. Lower extremity rotational disorders in children. UNABLE TO FIND DOCUMENT
6. Orthopedic assessment of young children: developmental variations. Published 1989 so Old information therefore do not include
7. The Relationship Among Foot Posture, Core and Lower Extremity Muscle Function, and Postural
Stability. NOT PAEDIATRIC POPULATION SO NOT RELEVANT
8. Differences in lower extremity anatomical and postural characteristics in males and females
between maturation groups.
9. Postural assessment of lower limbs among 7 through 10 year-old obese children. ( Not relevant as
not specific to our patient group)
10. The "pigeon-toed" child. (Old article so excluded)
11. Orthopedic treatment of the pigeon-toed child.(Unable to access)
12. [Pigeon-toed legs and bowlegs in children]. (Old article so excluded
13. Biomechanics of growth and development in the healthy human infant: a pilot study.(Not
applicable as ontogenic study comparing to primates)
14. 7 lower limb positional variations:. Level 5 evidence (Article appraisal 3)
15. The intoeing child: etiology, prognosis, and current treatment options. (Level 4/5 evidence
Article appraisal 4)
Full strategy
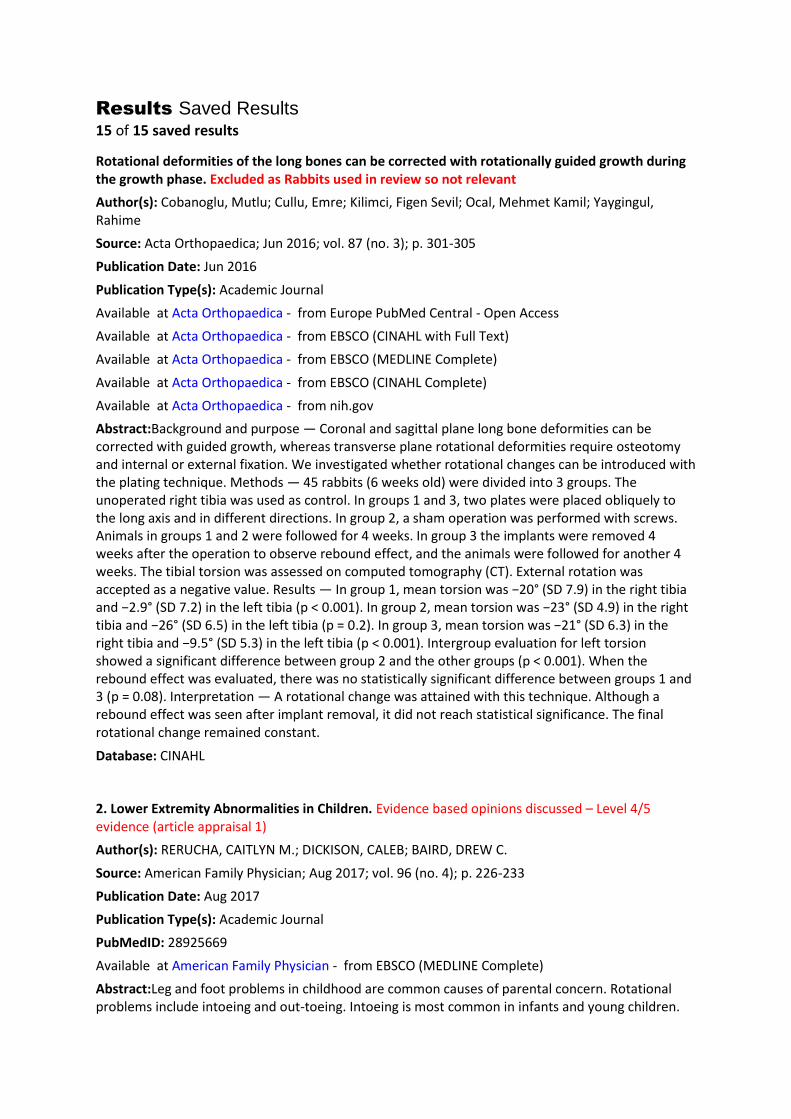
Results Saved Results
15 of 15 saved results
Rotational deformities of the long bones can be corrected with rotationally guided growth during the growth phase. Excluded as Rabbits used in review so not relevant
Author(s): Cobanoglu, Mutlu; Cullu, Emre; Kilimci, Figen Sevil; Ocal, Mehmet Kamil; Yaygingul, Rahime
Source: Acta Orthopaedica; Jun 2016; vol. 87 (no. 3); p. 301-305
Publication Date: Jun 2016
Publication Type(s): Academic Journal
Available at Acta Orthopaedica - from Europe PubMed Central - Open Access
Available at Acta Orthopaedica - from EBSCO (CINAHL with Full Text)
Available at Acta Orthopaedica - from EBSCO (MEDLINE Complete)
Available at Acta Orthopaedica - from EBSCO (CINAHL Complete)
Available at Acta Orthopaedica - from nih.gov
Abstract:Background and purpose — Coronal and sagittal plane long bone deformities can be corrected with guided growth, whereas transverse plane rotational deformities require osteotomy and internal or external fixation. We investigated whether rotational changes can be introduced with the plating technique. Methods — 45 rabbits (6 weeks old) were divided into 3 groups. The unoperated right tibia was used as control. In groups 1 and 3, two plates were placed obliquely to the long axis and in different directions. In group 2, a sham operation was performed with screws. Animals in groups 1 and 2 were followed for 4 weeks. In group 3 the implants were removed 4 weeks after the operation to observe rebound effect, and the animals were followed for another 4 weeks. The tibial torsion was assessed on computed tomography (CT). External rotation was accepted as a negative value. Results — In group 1, mean torsion was −20° (SD 7.9) in the right tibia and −2.9° (SD 7.2) in the left tibia (p < 0.001). In group 2, mean torsion was −23° (SD 4.9) in the right tibia and −26° (SD 6.5) in the left tibia (p = 0.2). In group 3, mean torsion was −21° (SD 6.3) in the right tibia and −9.5° (SD 5.3) in the left tibia (p < 0.001). Intergroup evaluation for left torsion showed a significant difference between group 2 and the other groups (p < 0.001). When the rebound effect was evaluated, there was no statistically significant difference between groups 1 and 3 (p = 0.08). Interpretation — A rotational change was attained with this technique. Although a rebound effect was seen after implant removal, it did not reach statistical significance. The final rotational change remained constant.
Database: CINAHL
2. Lower Extremity Abnormalities in Children. Evidence based opinions discussed – Level 4/5 evidence (article appraisal 1)
Author(s): RERUCHA, CAITLYN M.; DICKISON, CALEB; BAIRD, DREW C.
Source: American Family Physician; Aug 2017; vol. 96 (no. 4); p. 226-233
Publication Date: Aug 2017
Publication Type(s): Academic Journal
PubMedID: 28925669
Available at American Family Physician - from EBSCO (MEDLINE Complete)
Abstract:Leg and foot problems in childhood are common causes of parental concern. Rotational problems include intoeing and out-toeing. Intoeing is most common in infants and young children.

Intoeing is caused by metatarsus adductus, internal tibial torsion, and femoral anteversion. Out-toeing is less common than intoeing and occurs more often in older children. Out-toeing is caused by external tibial torsion and femoral retroversion. Angular problems include genu varum (bowleg) and genu valgum (knock knee). With pes planus (flatfoot), the arch of the foot is usually flexible rather than rigid. A history and physical examination that include torsional profile tests and angular measurements are usually sufficient to evaluate patients with lower extremity abnormalities. Most children who present with lower extremity problems have normal rotational and angular findings (i.e., within two standard deviations of the mean). Lower extremity abnormalities that are within normal measurements resolve spontaneously as the child grows. Radiologic studies are not routinely required, except to exclude pathologic conditions. Orthotics are not beneficial. Orthopedic referral is often not necessary. Rarely, surgery is required in patients older than eight years who have severe deformities that cause dysfunction.
Database: CINAHL
3. Sex differences in clinical measures of lower extremity alignment. Reviews measurements of Adults so not relevent to the paediatric population
Author(s): Nguyen A; Shultz SJ
Source: Journal of Orthopaedic & Sports Physical Therapy; Jul 2007; vol. 37 (no. 7); p. 389-398
Publication Date: Jul 2007
Publication Type(s): Periodical
PubMedID: 17710908
Available at Journal of Orthopaedic & Sports Physical Therapy - from American Physical Therapy Association
Abstract:STUDY DESIGN: Descriptive, cohort design. OBJECTIVES: To comprehensively examine sex differences in clinical measures of static lower extremity alignment (LEA). BACKGROUND: Sex differences in LEA have been included among a myriad of risk factors as a potential cause for the increased prevalence of knee injury in females. While clinical observations suggest that sex differences in LEA exist, little empirical data are available to support these sex differences or the normal values that should be expected in a healthy population. METHODS AND MEASURES: The right and left static LEA of 100 healthy college-age participants (50 males [mean +/- SD age, 23.3 +/- 3.6 years; height, 177.8 +/- 8.0 cm, body mass, 80.4 +/- 11.6 kg] and 50 females [mean +/- SD age, 21.8 +/- 2.5 years; height, 164.3 +/- 6.9 cm; body mass, 67.4 +/- 15.2 kg]) was measured. Each alignment characteristic was analyzed via separate repeated-measures analyses of variance, with 1 between-subject factor (sex) and 1 within-subject factor (side). RESULTS: There were no significant sex-by-side interactions and no differences between sides. Females had greater mean anterior pelvic tilt, hip anteversion, quadriceps angles, tibiofemoral angles, and genu recurvatum than males (P < .0001). No sex differences were observed in tibial torsion (P = .131), navicular drop (P = .130), and rearfoot angle (P = .590). CONCLUSION: Sex differences in LEA indicate that females, on average, have greater anterior pelvic tilt, thigh internal rotation, knee valgus, and genu recurvatum. These sex differences were not accompanied by differences in the lower leg, ankle, and foot. Understanding these collective sex differences in LEA may help us to better examine the influence of LEA on dynamic lower extremity function and clarify their role as a potential injury risk factor.
Database: CINAHL

4. Lower extremity abnormalities in children.
Author(s): Sass P; Hassan G
Source: American Family Physician; Aug 2003; vol. 68 (no. 3); p. 461-472
Publication Date: Aug 2003
Publication Type(s): Academic Journal
PubMedID: 12924829
Available at American Family Physician - from EBSCO (MEDLINE Complete)
Level 4/5 evidence author opinion only no clear review of evidence to support (article appraisal 2)
Abstract:Rotational and angular problems are two types of lower extremity abnormalities common in children. Rotational problems include intoeing and out-toeing. Intoeing is caused by one of three types of deformity: metatarsus adductus, internal tibial torsion, and increased femoral anteversion. Out-toeing is less common than intoeing, and its causes are similar but opposite to those of intoeing. These include femoral retroversion and external tibial torsion. Angular problems include bowlegs and knock-knees. An accurate diagnosis can be made with careful history and physical examination, which includes torsional profile (a four-component composite of measurements of the lower extremities). Charts of normal values and values with two standard deviations for each component of the torsional profile are available. In most cases, the abnormality improves with time. A careful physical examination, explanation of the natural history, and serial measurements are usually reassuring to the parents. Treatment is usually conservative. Special shoes, cast, or braces are rarely beneficial and have no proven efficacy. Surgery is reserved for older children with deformity from three to four standard deviations from the normal.
Database: CINAHL
5. Lower extremity rotational disorders in children. UNABLE TO FIND DOCUMENT
Author(s): Bastin JP
Source: Physician Assistant; Nov 2001; vol. 25 (no. 11); p. 30-38
Publication Date: Nov 2001
Publication Type(s): Periodical
Available at Physician Assistant - from ProQuest (Hospital Premium Collection) - NHS Version
Abstract:Lower extremity rotational deformities are common among pediatric patients, and clinicians who care for children are likely to encounter them. The 4 torsional deformities that affect the lower extremity-external tibial torsion, external femoral torsion, internal tibial torsion, and internal femoral torsion-present as toeing in or toeing out. The majority of these deformities spontaneously normalize over time without long-term sequelae. However, primary care clinicians need a general understanding of these deformities to accurately differentiate between pathologic and physiologic conditions.
Database: CINAHL
6. Orthopedic assessment of young children: developmental variations. Published 1989 so Old information therefore do not include
Author(s): Killam PE
Source: Nurse Practitioner; Jul 1989; vol. 14 (no. 7); p. 27-30
Publication Date: Jul 1989
Publication Type(s): Academic Journal

PubMedID: 2664594
Abstract:Parents often seek orthopedic evaluation of their young children because of apparent abnormalities. However, many of these are simply developmental variations that are part of normal growth and development. Pes planus, or flat foot, is one of the earliest and most common concerns. Torsional variations are also often seen; the presenting complaint may be intoeing (metatarsus adductus, tibial torsion and increased femoral anteversion) or out-toeing (pes calcaneovalgus and external rotation contractures of the hips). Angular variations (genu varum and genu valgum) are also seen frequently in young children. In assessing each finding, consideration must be given to the age at which the finding may be considered within normal limits, methods of examination and documentation, the expected course, findings that may signify abnormality, and appropriate follow-up and referral. An understanding of these common developmental variations in the orthopedic assessment of young children will enable the health care provider to respond to parents' concerns with accurate information and counseling.
Database: CINAHL
7. The Relationship Among Foot Posture, Core and Lower Extremity Muscle Function, and Postural Stability. NOT PAEDIATRIC PATIENTS SO NOT RELEVANT
Author(s): Cobb, Stephen C.; Bazett-Jones, David M.; Joshi, Mukta N.; Earl-Boehm, Jennifer E.; James, C. Roger
Source: Journal of Athletic Training (Allen Press); Mar 2014; vol. 49 (no. 2); p. 173-180
Publication Date: Mar 2014
Publication Type(s): Academic Journal
PubMedID: 24568226
Available at Journal of Athletic Training (Allen Press) - from Europe PubMed Central - Open Access
Available at Journal of Athletic Training (Allen Press) - from ProQuest (Hospital Premium Collection) - NHS Version
Available at Journal of Athletic Training (Allen Press) - from nih.gov
Abstract:Context: Identification of impaired balance as a risk factor for lower extremity injury regardless of injury history has led to subsequent investigation of variables that may adversely affect balance in healthy individuals. Objectives: To investigate the relationship among core and lower extremity muscle function, foot posture, and balance. Design: Descriptive laboratory study. Setting: Musculoskeletal injury biomechanics laboratory. Patients or Other Participants: A total of 108 individuals (40 men, 68 women; age = 22.8 ± 4.7 years, height = 168.5 ± 10.4 cm, mass = 69.9 ± 13.3 kg) participated in the study. Main Outcome Measure(s): Core endurance was assessed during 1 time-to-failure trial, and isometric hip and ankle strength were assessed using a handheld dynamometer and isokinetic dynamometer, respectively. Foot structure was quantified using the digital photographic measurement method. Single-limb-stance time to boundary was assessed using a force plate during an eyes-closed condition. Hierarchical multiple regression analyses were performed to predict balance using lower extremity strength, foot posture, and core endurance. Results: Foot posture (β = -0.22, P = .03) and ankle-inversion strength (β =-0.29, P = .006) predicted mediolateral balance. Increasing arch posture and ankle-inversion strength were associated with decreased mediolateral single-limb- stance balance. Conclusions: Increasing arch height was associated with decreased mediolateral control of single-limb stance. The relationship between time to boundary and injury risk, however, has not been explored. Therefore, the relationship between increasing arch height and injury due to postural instability cannot be determined from this study. If authors of future prospective studies identify a relationship between decreased time to boundary and increased injury risk, foot structure may be an important variable to assess during
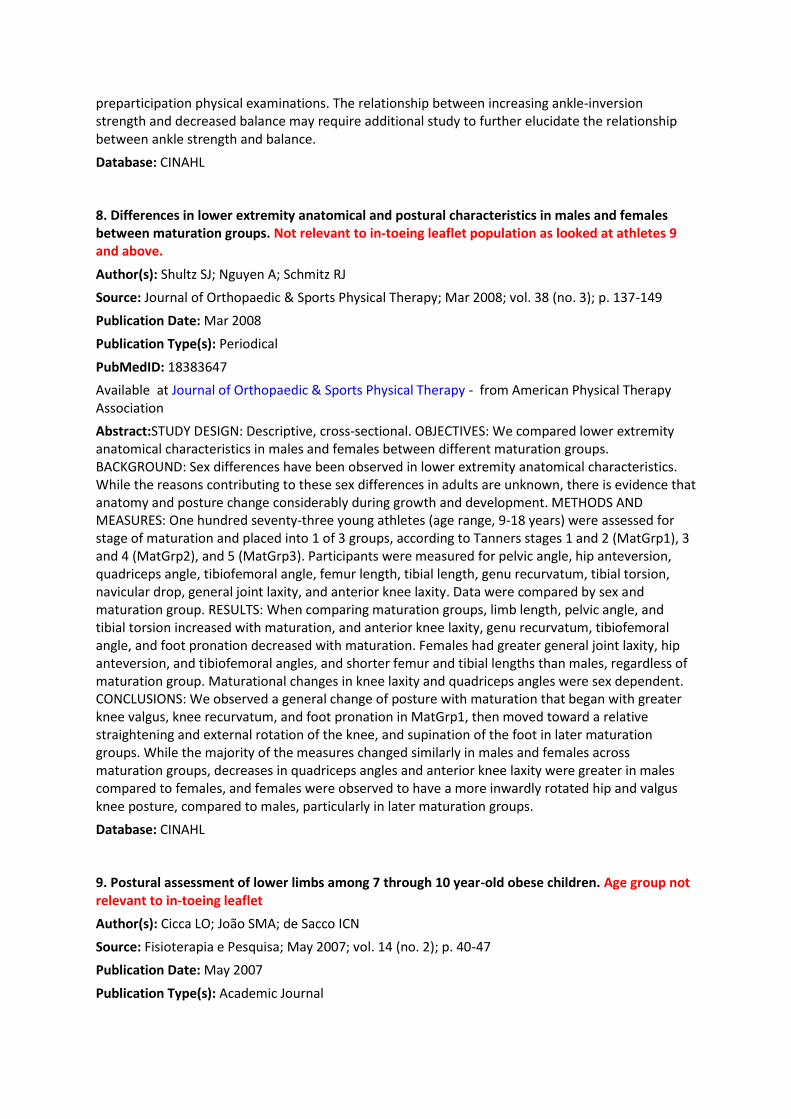
preparticipation physical examinations. The relationship between increasing ankle-inversion strength and decreased balance may require additional study to further elucidate the relationship between ankle strength and balance.
Database: CINAHL
8. Differences in lower extremity anatomical and postural characteristics in males and females between maturation groups. Not relevant to in-toeing leaflet population as looked at athletes 9 and above.
Author(s): Shultz SJ; Nguyen A; Schmitz RJ
Source: Journal of Orthopaedic & Sports Physical Therapy; Mar 2008; vol. 38 (no. 3); p. 137-149
Publication Date: Mar 2008
Publication Type(s): Periodical
PubMedID: 18383647
Available at Journal of Orthopaedic & Sports Physical Therapy - from American Physical Therapy Association
Abstract:STUDY DESIGN: Descriptive, cross-sectional. OBJECTIVES: We compared lower extremity anatomical characteristics in males and females between different maturation groups. BACKGROUND: Sex differences have been observed in lower extremity anatomical characteristics. While the reasons contributing to these sex differences in adults are unknown, there is evidence that anatomy and posture change considerably during growth and development. METHODS AND MEASURES: One hundred seventy-three young athletes (age range, 9-18 years) were assessed for stage of maturation and placed into 1 of 3 groups, according to Tanners stages 1 and 2 (MatGrp1), 3 and 4 (MatGrp2), and 5 (MatGrp3). Participants were measured for pelvic angle, hip anteversion, quadriceps angle, tibiofemoral angle, femur length, tibial length, genu recurvatum, tibial torsion, navicular drop, general joint laxity, and anterior knee laxity. Data were compared by sex and maturation group. RESULTS: When comparing maturation groups, limb length, pelvic angle, and tibial torsion increased with maturation, and anterior knee laxity, genu recurvatum, tibiofemoral angle, and foot pronation decreased with maturation. Females had greater general joint laxity, hip anteversion, and tibiofemoral angles, and shorter femur and tibial lengths than males, regardless of maturation group. Maturational changes in knee laxity and quadriceps angles were sex dependent. CONCLUSIONS: We observed a general change of posture with maturation that began with greater knee valgus, knee recurvatum, and foot pronation in MatGrp1, then moved toward a relative straightening and external rotation of the knee, and supination of the foot in later maturation groups. While the majority of the measures changed similarly in males and females across maturation groups, decreases in quadriceps angles and anterior knee laxity were greater in males compared to females, and females were observed to have a more inwardly rotated hip and valgus knee posture, compared to males, particularly in later maturation groups.
Database: CINAHL
9. Postural assessment of lower limbs among 7 through 10 year-old obese children. Age group not relevant to in-toeing leaflet
Author(s): Cicca LO; João SMA; de Sacco ICN
Source: Fisioterapia e Pesquisa; May 2007; vol. 14 (no. 2); p. 40-47
Publication Date: May 2007
Publication Type(s): Academic Journal
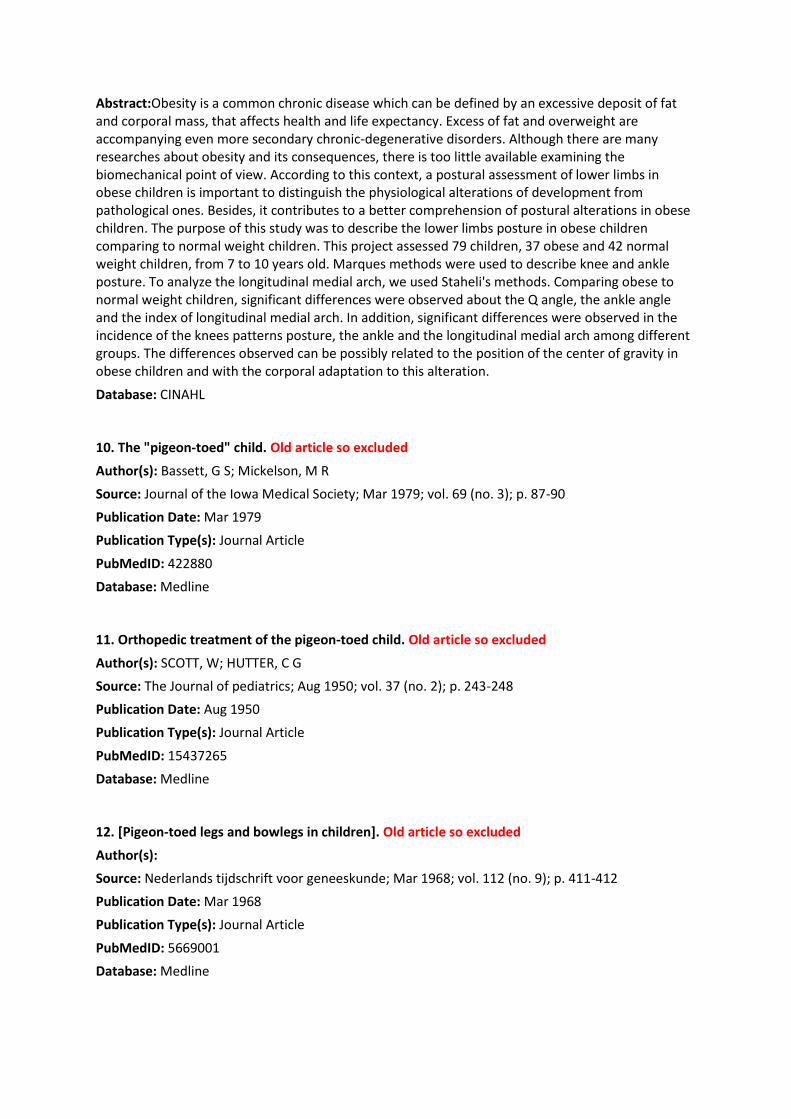
Abstract:Obesity is a common chronic disease which can be defined by an excessive deposit of fat and corporal mass, that affects health and life expectancy. Excess of fat and overweight are accompanying even more secondary chronic-degenerative disorders. Although there are many researches about obesity and its consequences, there is too little available examining the biomechanical point of view. According to this context, a postural assessment of lower limbs in obese children is important to distinguish the physiological alterations of development from pathological ones. Besides, it contributes to a better comprehension of postural alterations in obese children. The purpose of this study was to describe the lower limbs posture in obese children comparing to normal weight children. This project assessed 79 children, 37 obese and 42 normal weight children, from 7 to 10 years old. Marques methods were used to describe knee and ankle posture. To analyze the longitudinal medial arch, we used Staheli's methods. Comparing obese to normal weight children, significant differences were observed about the Q angle, the ankle angle and the index of longitudinal medial arch. In addition, significant differences were observed in the incidence of the knees patterns posture, the ankle and the longitudinal medial arch among different groups. The differences observed can be possibly related to the position of the center of gravity in obese children and with the corporal adaptation to this alteration.
Database: CINAHL
10. The "pigeon-toed" child. Old article so excluded
Author(s): Bassett, G S; Mickelson, M R
Source: Journal of the Iowa Medical Society; Mar 1979; vol. 69 (no. 3); p. 87-90
Publication Date: Mar 1979
Publication Type(s): Journal Article
PubMedID: 422880
Database: Medline
11. Orthopedic treatment of the pigeon-toed child. Old article so excluded
Author(s): SCOTT, W; HUTTER, C G
Source: The Journal of pediatrics; Aug 1950; vol. 37 (no. 2); p. 243-248
Publication Date: Aug 1950
Publication Type(s): Journal Article
PubMedID: 15437265
Database: Medline
12. [Pigeon-toed legs and bowlegs in children]. Old article so excluded
Author(s):
Source: Nederlands tijdschrift voor geneeskunde; Mar 1968; vol. 112 (no. 9); p. 411-412
Publication Date: Mar 1968
Publication Type(s): Journal Article
PubMedID: 5669001
Database: Medline

13. Biomechanics of growth and development in the healthy human infant: a pilot study. Not relevant as compared with primate study; ontogenic information.
Author(s): Wells JP; Hyler-Both DL; Danley TD; Wallace GH
Source: JAOA: Journal of the American Osteopathic Association; Jun 2002; vol. 102 (no. 6); p. 313-321
Publication Date: Jun 2002
Publication Type(s): Academic Journal
PubMedID: 12090648
Abstract:Detailed measurements were acquired from 168 healthy subjects who were brought to the West Virginia School of Osteopathic Medicine's Robert C. Byrd Clinic in Lewisburg, WVa, during 1998 and 1999 by their parents for routine well-baby visits. Measurements of body-segment length, diameter, circumference, and skinfold thickness were taken at several segment locations. The center of volume was calculated for each body segment and was used as an approximation of center of mass. Findings from this study are strikingly similar to those found in the preceding long-term study by Turnquist and Wells of body-segment morphology, locomotion, and posture in the rhesus monkey (Macaca mulata). In human growth and development, the center of mass of each limb body segment migrates proximally, and more so in the more proximal segments. This trend is more pronounced in the lower extremities. Limb length and circumference increase with age in a linear pattern. These ontogenic changes are the consequence of the development of a propulsive hindlimb. This report is part of an ongoing study that will conclude in 2005 and that is intended to provide clinicians with detailed ontogenic information about changes in limb proportions in normal healthy children.
Database: CINAHL
14. 7 lower limb positional variations:. Level 5 evidence (article appraisal 3)
Author(s): FRYE, STACY
Source: Contemporary Pediatrics; Sep 2017; vol. 34 (no. 9); p. 16-21
Publication Date: Sep 2017
Publication Type(s): Periodical
Available at Contemporary Pediatrics - from EBSCO (CINAHL with Full Text)
Available at Contemporary Pediatrics - from EBSCO (CINAHL Complete)
Available at Contemporary Pediatrics - from ProQuest (Hospital Premium Collection) - NHS Version
Abstract:The article discusses clinical characteristics and management of orthopedic variants of lower extremities in children and adolescents. Topics explored include the proper foot progression angle (FPA) and thigh-foot angle (TFA) assessment, the physical manifestation of internal tibial torsion and femoral anteversion, and the prevalance and risk factors for intoeing gait in young children.
Database: CINAHL
15. The intoeing child: etiology, prognosis, and current treatment options. Level 4/5 evidence
(article appraisal 4)
Author(s): Harris, Edwin

Source: Clinics in Podiatric Medicine & Surgery; Oct 2013; vol. 30 (no. 4); p. 531-565
Publication Date: Oct 2013
Publication Type(s): Periodical
PubMedID: 24075135
Abstract:Intoeing, a common entrance complaint in infants, toddlers, and young children, is best defined as internal rotation of the long axis of the foot to the line of progression. Intoeing may be caused by primary deformities within the foot, issues with tibial torsion, and femoral antetorsion (anteversion). Problems within the foot include hallux varus, metatarsus adductus, talipes equinovarus, and pes cavus, each of which has specific treatments available. Treatment must be individualized, and the risks and complications weighed against the predictable morbidity of intoeing.
Database: CINAHL

Page 1 of 4
Lower Extremity Abnormalities in Children.
Author(s): RERUCHA, CAITLYN M.; DICKISON, CALEB; BAIRD, DREW C.
Source: American Family Physician; Aug 2017; vol. 96 (no. 4); p. 226-233
Publication Date: Aug 2017
Publication Type(s): Academic Journal
PubMedID: 28925669
Available at American Family Physician - from EBSCO (MEDLINE Complete)
SYSTEMATIC REVIEW: Are the results of the review valid?
Evidence based opineons discussed – Level 4/5 evidence
What question (PICO) did the systematic review address?
Lower limb abnormalities in children, Femoral anteversion, Tibial Torsion, differential diagnosis,
Normal variant
What is best? Where do I find the information?
Several questions are being addressed as part
of the review.
The information on the questions asked are
throughout the paper
This paper: Yes No Unclear X
Comment: The paper is based on a expert opinion on review of the evidence available to them. It
is therefore not a true systematic review
F - Is it unlikely that important, relevant studies were missed?
What is best?The Search was completed Data
Sources: A PubMed search was completed using
Clinical Queries and the Therapy Narrow Filter with
the terms pediatric, lower extremity abnormality,
lower extremity variant, metatarsus adductus, genu
valgum, genu varum, tibial torsion, angular
deformity, intoeing, and out-toeing. The search
included randomized controlled trials, clinical trials,
and reviews. Also searched were Essential Evidence
Plus and the Cochrane Database of Systematic
Reviews. Search dates: December 2015 to February
2016, and April 2017. Figures 7, and 9 through 11
courtesy of Courtney Holland, MD. The opinions
and assertions contained herein are the private
views of the authors and are not to be construed as
official or as reflecting the views of the U.S. Army
Where do I find the information?
Information on the search completed was not
stated until the end of the paper
It does not state the way that the evidence was
reviewed
Page 2 of 4
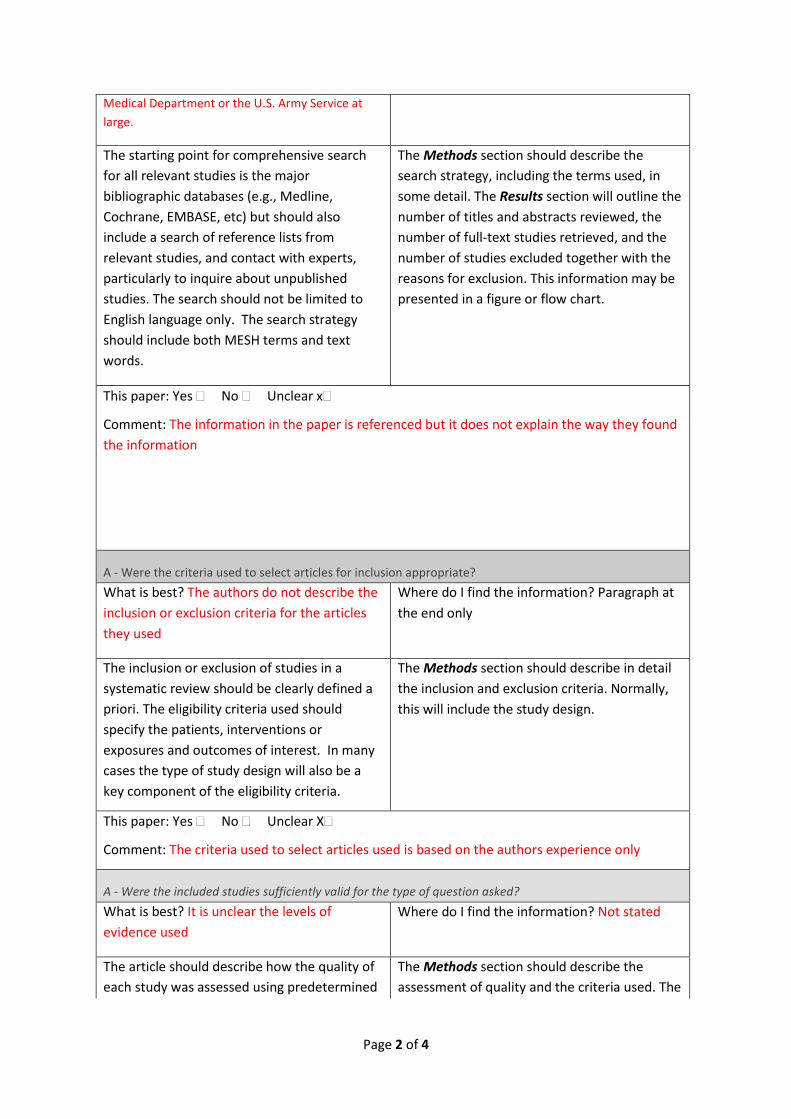
Medical Department or the U.S. Army Service at
large.
The starting point for comprehensive search
for all relevant studies is the major
bibliographic databases (e.g., Medline,
Cochrane, EMBASE, etc) but should also
include a search of reference lists from
relevant studies, and contact with experts,
particularly to inquire about unpublished
studies. The search should not be limited to
English language only. The search strategy
should include both MESH terms and text
words.
The Methods section should describe the
search strategy, including the terms used, in
some detail. The Results section will outline the
number of titles and abstracts reviewed, the
number of full-text studies retrieved, and the
number of studies excluded together with the
reasons for exclusion. This information may be
presented in a figure or flow chart.
This paper: Yes No Unclear x
Comment: The information in the paper is referenced but it does not explain the way they found
the information
A - Were the criteria used to select articles for inclusion appropriate?
What is best? The authors do not describe the
inclusion or exclusion criteria for the articles
they used
Where do I find the information? Paragraph at
the end only
The inclusion or exclusion of studies in a
systematic review should be clearly defined a
priori. The eligibility criteria used should
specify the patients, interventions or
exposures and outcomes of interest. In many
cases the type of study design will also be a
key component of the eligibility criteria.
The Methods section should describe in detail
the inclusion and exclusion criteria. Normally,
this will include the study design.
This paper: Yes No Unclear X
Comment: The criteria used to select articles used is based on the authors experience only
A - Were the included studies sufficiently valid for the type of question asked?
What is best? It is unclear the levels of
evidence used
Where do I find the information? Not stated
The article should describe how the quality of
each study was assessed using predetermined
The Methods section should describe the
assessment of quality and the criteria used. The

Page 3 of 4
quality criteria appropriate to the type of
clinical question (e.g., randomization, blinding
and completeness of follow-up)
Results section should provide information on
the quality of the individual studies.
This paper: Yes No Unclear
Comment: No results section
T - Were the results similar from study to study? Not able to assess
What is best? Where do I find the information?
Ideally, the results of the different studies
should be similar or homogeneous. If
heterogeneity exists the authors may estimate
whether the differences are significant (chi-
square test). Possible reasons for the
heterogeneity should be explored.
The Results section should state whether the
results are heterogeneous and discuss possible
reasons. The forest plot should show the
results of the chi-square test for heterogeneity
and if discuss reasons for heterogeneity, if
present.
This paper: Yes No Unclear
Comment:
How are the results presented? Results not presented

Page 4 of 4
A systematic review provides a summary of the data from the results of a number of individual studies. If the results of the individual studies are similar, a statistical method (called meta-analysis) is used to combine the results from the individual studies and an overall summary estimate is calculated. The meta-analysis gives weighted values to each of the individual studies according to their size. The individual results of the studies need to be expressed in a standard way, such as relative risk, odds ratio or mean difference between the groups. Results are traditionally displayed in a figure, like the one below, called a forest plot.
The forest plot depicted above represents a meta-analysis of 5 trials that assessed the effects of a hypothetical treatment on mortality. Individual studies are represented by a black square and a horizontal line, which corresponds to the point estimate and 95% confidence interval of the odds ratio. The size of the black square reflects the weight of the study in the meta-analysis. The solid vertical line corresponds to ‘no effect’ of treatment - an odds ratio of 1.0. When the confidence interval includes 1 it indicates that the result is not significant at conventional levels (P>0.05).
The diamond at the bottom represents the combined or pooled odds ratio of all 5 trials with its 95% confidence interval. In this case, it shows that the treatment reduces mortality by 34% (OR 0.66 95% CI 0.56 to 0.78). Notice that the diamond does not overlap the ‘no effect’ line (the confidence interval doesn’t include 1) so we can be assured that the pooled OR is statistically significant. The test for overall effect also indicates statistical significance (p<0.0001).
Exploring heterogeneity
Heterogeneity can be assessed using the “eyeball” test or more formally with statistical tests, such as the Cochran Q test. With the “eyeball” test one looks for overlap of the confidence intervals of the trials with the summary estimate. In the example above note that the dotted line running vertically through the combined odds ratio crosses the horizontal lines of all the individual studies indicating that the studies are homogenous. Heterogeneity can also be assessed using the Cochran chi-square (Cochran Q). If Cochran Q is statistically significant there is definite heterogeneity. If Cochran Q is not statistically significant but the ratio of Cochran Q and the degrees of freedom (Q/df) is > 1 there is possible heterogeneity. If Cochran Q is not statistically significant and Q/df is < 1 then heterogeneity is very unlikely. In the example above Q/df is <1 (0.92/4= 0.23) and the p-value is not significant (0.92) indicating no heterogeneity.
Note: The level of significance for Cochran Q is often set at 0.1 due to the low power of the test to detect heterogeneity.
Copyright of University of Oxford 2005

Page 1 of 4
4. Lower extremity abnormalities in children.
Author(s): Sass P; Hassan G
Source: American Family Physician; Aug 2003; vol. 68 (no. 3); p. 461-472
Publication Date: Aug 2003
Publication Type(s): Academic Journal
PubMedID: 12924829
Available at American Family Physician - from EBSCO (MEDLINE Complete)
SYSTEMATIC REVIEW: Are the results of the review valid?
Evidence based opinions discussed – Level 4/5 evidence
What question (PICO) did the systematic review address?
Lower limb abnormalities in children, Femoral anteversion, Tibial Torsion, differential diagnosis,
Normal variant
What is best? Where do I find the information?
Several questions are being addressed as part
of the review.
The information on the questions asked are
throughout the paper
This paper: Yes No Unclear X
Comment: The paper is based on a expert opinion on review of the evidence available to them. It
is therefore not a true systematic review
F - Is it unlikely that important, relevant studies were missed?
What is best?. Unable to tell as search results not
stated
Where do I find the information?
It is unclear where to find the information
other than the references stated
The starting point for comprehensive search
for all relevant studies is the major
bibliographic databases (e.g., Medline,
Cochrane, EMBASE, etc) but should also
include a search of reference lists from
relevant studies, and contact with experts,
particularly to inquire about unpublished
studies. The search should not be limited to
English language only. The search strategy
should include both MESH terms and text
words.
The Methods section should describe the
search strategy, including the terms used, in
some detail. The Results section will outline the
number of titles and abstracts reviewed, the
number of full-text studies retrieved, and the
number of studies excluded together with the
reasons for exclusion. This information may be
presented in a figure or flow chart.

Page 2 of 4
This paper: Yes No Unclear x
Comment: The information in the paper is referenced but it does not explain the way they found
the information
A - Were the criteria used to select articles for inclusion appropriate?
What is best? The authors do not describe the
inclusion or exclusion criteria for the articles
they used
Where do I find the information? References
stated
The inclusion or exclusion of studies in a
systematic review should be clearly defined a
priori. The eligibility criteria used should
specify the patients, interventions or
exposures and outcomes of interest. In many
cases the type of study design will also be a
key component of the eligibility criteria.
The Methods section should describe in detail
the inclusion and exclusion criteria. Normally,
this will include the study design.
This paper: Yes No Unclear X
Comment: The criteria used to select articles used is based on the authors experience only
A - Were the included studies sufficiently valid for the type of question asked?
What is best? It is unclear the levels of
evidence used
Where do I find the information? Not stated
The article should describe how the quality of
each study was assessed using predetermined
quality criteria appropriate to the type of
clinical question (e.g., randomization, blinding
and completeness of follow-up)
The Methods section should describe the
assessment of quality and the criteria used. The
Results section should provide information on
the quality of the individual studies.
This paper: Yes No Unclear
Comment: No results section
T - Were the results similar from study to study? Not able to assess
What is best? Where do I find the information?
Ideally, the results of the different studies
should be similar or homogeneous. If
heterogeneity exists the authors may estimate
The Results section should state whether the
results are heterogeneous and discuss possible
reasons. The forest plot should show the

Page 3 of 4
whether the differences are significant (chi-
square test). Possible reasons for the
heterogeneity should be explored.
results of the chi-square test for heterogeneity
and if discuss reasons for heterogeneity, if
present.
This paper: Yes No Unclear
Comment:
How are the results presented? Results not presented

Page 4 of 4
A systematic review provides a summary of the data from the results of a number of individual studies. If the results of the individual studies are similar, a statistical method (called meta-analysis) is used to combine the results from the individual studies and an overall summary estimate is calculated. The meta-analysis gives weighted values to each of the individual studies according to their size. The individual results of the studies need to be expressed in a standard way, such as relative risk, odds ratio or mean difference between the groups. Results are traditionally displayed in a figure, like the one below, called a forest plot.
The forest plot depicted above represents a meta-analysis of 5 trials that assessed the effects of a hypothetical treatment on mortality. Individual studies are represented by a black square and a horizontal line, which corresponds to the point estimate and 95% confidence interval of the odds ratio. The size of the black square reflects the weight of the study in the meta-analysis. The solid vertical line corresponds to ‘no effect’ of treatment - an odds ratio of 1.0. When the confidence interval includes 1 it indicates that the result is not significant at conventional levels (P>0.05).
The diamond at the bottom represents the combined or pooled odds ratio of all 5 trials with its 95% confidence interval. In this case, it shows that the treatment reduces mortality by 34% (OR 0.66 95% CI 0.56 to 0.78). Notice that the diamond does not overlap the ‘no effect’ line (the confidence interval doesn’t include 1) so we can be assured that the pooled OR is statistically significant. The test for overall effect also indicates statistical significance (p<0.0001).
Exploring heterogeneity
Heterogeneity can be assessed using the “eyeball” test or more formally with statistical tests, such as the Cochran Q test. With the “eyeball” test one looks for overlap of the confidence intervals of the trials with the summary estimate. In the example above note that the dotted line running vertically through the combined odds ratio crosses the horizontal lines of all the individual studies indicating that the studies are homogenous. Heterogeneity can also be assessed using the Cochran chi-square (Cochran Q). If Cochran Q is statistically significant there is definite heterogeneity. If Cochran Q is not statistically significant but the ratio of Cochran Q and the degrees of freedom (Q/df) is > 1 there is possible heterogeneity. If Cochran Q is not statistically significant and Q/df is < 1 then heterogeneity is very unlikely. In the example above Q/df is <1 (0.92/4= 0.23) and the p-value is not significant (0.92) indicating no heterogeneity.
Note: The level of significance for Cochran Q is often set at 0.1 due to the low power of the test to detect heterogeneity.
Copyright of University of Oxford 2005

Page 1 of 4
14. 7 lower limb positional variations:. Author(s): FRYE, STACY Source: Contemporary Pediatrics; Sep 2017; vol. 34 (no. 9); p. 16-21 Publication Date: Sep 2017
Publication Type(s): Periodical
SYSTEMATIC REVIEW: Are the results of the review valid? Evidence based opinions discussed – Level 5 evidence
What question (PICO) did the systematic review address? Lower limb abnormalities in children, Femoral anteversion, Tibial Torsion, differential diagnosis, Normal variant
What is best? Where do I find the information?
Several questions are being addressed as part of the review, these questions are clearly focused. Importance of recognising paediatric orthopaedic variation is highlighted.
The information is presented throughout the paper
This paper: Yes � No � Unclear X�
Comment: The paper is based on a expert opinion and presents available information. It is therefore not a true systematic review.
F - Is it unlikely that important, relevant studies were missed?
What is best?. Unable to tell as search results not stated
Where do I find the information?
It is unclear where to find the information no references stated
The starting point for comprehensive search for all relevant studies is the major bibliographic databases (e.g., Medline, Cochrane, EMBASE, etc) but should also include a search of reference lists from relevant studies, and contact with experts, particularly to inquire about unpublished studies. The search should not be limited to English language only. The search strategy
The Methods section should describe the search strategy, including the terms used, in some detail. The Results section will outline the number of titles and abstracts reviewed, the number of full-text studies retrieved, and the number of studies excluded together with the reasons for exclusion. This information may be presented in a figure or flow chart.

Page 2 of 4
should include both MESH terms and text words.
This paper: Yes � No � Unclear x�
Comment: The information is not referenced
A - Were the criteria used to select articles for inclusion appropriate? What is best? The authors do not describe the inclusion or exclusion criteria for the articles they used
Where do I find the information? Unclear
The inclusion or exclusion of studies in a systematic review should be clearly defined a priori. The eligibility criteria used should specify the patients, interventions or exposures and outcomes of interest. In many cases the type of study design will also be a key component of the eligibility criteria.
The Methods section should describe in detail the inclusion and exclusion criteria. Normally, this will include the study design.
This paper: Yes � No � Unclear X�
Comment: How the author has gained the information is unclear
A - Were the included studies sufficiently valid for the type of question asked? What is best? It is unclear the levels of evidence used
Where do I find the information? Not stated
The article should describe how the quality of each study was assessed using predetermined quality criteria appropriate to the type of clinical question (e.g., randomization, blinding and completeness of follow-up)
The Methods section should describe the assessment of quality and the criteria used. The Results section should provide information on the quality of the individual studies.
This paper: Yes � No � Unclear �
Comment: No results section
T - Were the results similar from study to study? Not able to assess What is best? Where do I find the information?

Page 3 of 4
Ideally, the results of the different studies should be similar or homogeneous. If heterogeneity exists the authors may estimate whether the differences are significant (chi-square test). Possible reasons for the heterogeneity should be explored.
The Results section should state whether the results are heterogeneous and discuss possible reasons. The forest plot should show the results of the chi-square test for heterogeneity and if discuss reasons for heterogeneity, if present.
This paper: Yes � No � Unclear �
Comment:
How are the results presented? Results not presented however there is a table summary addressing the key clinical findings and management for the 7 orthopaedic variants identified.

Page 4 of 4
A systematic review provides a summary of the data from the results of a number of individual studies. If the results of the individual studies are similar, a statistical method (called meta-analysis) is used to combine the results from the individual studies and an overall summary estimate is calculated. The meta-analysis gives weighted values to each of the individual studies according to their size. The individual results of the studies need to be expressed in a standard way, such as relative risk, odds ratio or mean difference between the groups. Results are traditionally displayed in a figure, like the one below, called a forest plot.
The forest plot depicted above represents a meta-analysis of 5 trials that assessed the effects of a hypothetical treatment on mortality. Individual studies are represented by a black square and a horizontal line, which corresponds to the point estimate and 95% confidence interval of the odds ratio. The size of the black square reflects the weight of the study in the meta-analysis. The solid vertical line corresponds to ‘no effect’ of treatment - an odds ratio of 1.0. When the confidence interval includes 1 it indicates that the result is not significant at conventional levels (P>0.05).
The diamond at the bottom represents the combined or pooled odds ratio of all 5 trials with its 95% confidence interval. In this case, it shows that the treatment reduces mortality by 34% (OR 0.66 95% CI 0.56 to 0.78). Notice that the diamond does not overlap the ‘no effect’ line (the confidence interval doesn’t include 1) so we can be assured that the pooled OR is statistically significant. The test for overall effect also indicates statistical significance (p<0.0001).
Exploring heterogeneity
Heterogeneity can be assessed using the “eyeball” test or more formally with statistical tests, such as the Cochran Q test. With the “eyeball” test one looks for overlap of the confidence intervals of the trials with the summary estimate. In the example above note that the dotted line running vertically through the combined odds ratio crosses the horizontal lines of all the individual studies indicating that the studies are homogenous. Heterogeneity can also be assessed using the Cochran chi-square (Cochran Q). If Cochran Q is statistically significant there is definite heterogeneity. If Cochran Q is not statistically significant but the ratio of Cochran Q and the degrees of freedom (Q/df) is > 1 there is possible heterogeneity. If Cochran Q is not statistically significant and Q/df is < 1 then heterogeneity is very unlikely. In the example above Q/df is <1 (0.92/4= 0.23) and the p-value is not significant (0.92) indicating no heterogeneity.
Note: The level of significance for Cochran Q is often set at 0.1 due to the low power of the test to detect heterogeneity.
Copyright of University of Oxford 2005

Page 1 of 5
15. The intoeing child: Etiology, Prognosis, and Current Treatment Options Author(s): HARRIS, Edwin Source: Clinics in Podiatric Medicine and Surgery; Oct 2013; vol. 30 (no. 4); p. 531-565
Publication Date: Oct 2013 Publication Type(s): Periodical
SYSTEMATIC REVIEW: Are the results of the review valid? Thorough presentation of available literature. Evidence based opinions discussed. Includes orthopaedic surgery – Level 4/5 evidence
What question (PICO) did the systematic review address? Intoeing, adducted gait, metatarsus adductus, internal tibial torsion, differential diagnosis, Normal variant
What is best? Where do I find the information?
The evidence surrounding assessment options and treatment options are presented. Differential diagnoses are discussed. Cohesive reference list included.
The information is presented in sections with clear headings based on the diagnosis.
This paper: Yes �x No � Unclear �
Comment: The paper is a review article and examines 73 journals on the topic. The patients are clearly defined. The interventions discussed are based on the pathology found. Many of the articles referenced are based on expert opinion and case series .
F - Is it unlikely that important, relevant studies were missed?
What is best?.
Relevant articles referenced. Cohesive literature review.
Where do I find the information?
Reference list provided. Information anaylsed and presented throughout the article.
The starting point for comprehensive search for all relevant studies is the major bibliographic databases (e.g., Medline, Cochrane, EMBASE, etc) but should also include a search of reference lists from relevant studies, and contact with experts, particularly to inquire about unpublished studies. The search should not be limited to English language only. The search strategy
The Methods section should describe the search strategy, including the terms used, in some detail. The Results section will outline the number of titles and abstracts reviewed, the number of full-text studies retrieved, and the number of studies excluded together with the reasons for exclusion. This information may be presented in a figure or flow chart.

Page 2 of 5
should include both MESH terms and text words.
This paper: Yes � No � Unclear x�
Comment:
No specific methods section as this article is in sections. The sections relate to assessment findings and treatment options.
A - Were the criteria used to select articles for inclusion appropriate? What is best? The authors do not describe the inclusion or exclusion criteria for the articles they used. Looking at the reference list, some up to date literature included along with seminal articles.
Where do I find the information?
The inclusion /exclusion details are not provided.
The inclusion or exclusion of studies in a systematic review should be clearly defined a priori. The eligibility criteria used should specify the patients, interventions or exposures and outcomes of interest. In many cases the type of study design will also be a key component of the eligibility criteria.
The Methods section should describe in detail the inclusion and exclusion criteria. Normally, this will include the study design.
This paper: Yes � No � Unclear X�
Comment: How the author has gained the information is unclear
A - Were the included studies sufficiently valid for the type of question asked? What is best? This is not included in the methodology as this is not a true systematic review
Where do I find the information? Not stated
The article should describe how the quality of each study was assessed using predetermined quality criteria appropriate to the type of clinical question (e.g., randomization, blinding and completeness of follow-up)
The Methods section should describe the assessment of quality and the criteria used. The Results section should provide information on the quality of the individual studies.

Page 3 of 5
This paper: Yes � No � Unclear �
Comment: No results section . Results of treatment options discussed in each section- references included.
T - Were the results similar from study to study? Yes What is best? Where do I find the information?
Ideally, the results of the different studies should be similar or homogeneous. If heterogeneity exists the authors may estimate whether the differences are significant (chi-square test). Possible reasons for the heterogeneity should be explored.
The Results section should state whether the results are heterogeneous and discuss possible reasons. The forest plot should show the results of the chi-square test for heterogeneity and if discuss reasons for heterogeneity, if present.
This paper: Yes � No � Unclear �
Comment:
How are the results presented? Evidence based opinions presented throughout the article.

Page 4 of 5
A systematic review provides a summary of the data from the results of a number of individual studies. If the results of the individual studies are similar, a statistical method (called meta-analysis) is used to combine the results from the individual studies and an overall summary estimate is calculated. The meta-analysis gives weighted values to each of the individual studies according to their size. The individual results of the studies need to be expressed in a standard way, such as relative risk, odds ratio or mean difference between the groups. Results are traditionally displayed in a figure, like the one below, called a forest plot.
The forest plot depicted above represents a meta-analysis of 5 trials that assessed the effects of a hypothetical treatment on mortality. Individual studies are represented by a black square and a horizontal line, which corresponds to the point estimate and 95% confidence interval of the odds ratio. The size of the black square reflects the weight of the study in the meta-analysis. The solid vertical line corresponds to ‘no effect’ of treatment - an odds ratio of 1.0. When the confidence interval includes 1 it indicates that the result is not significant at conventional levels (P>0.05).
The diamond at the bottom represents the combined or pooled odds ratio of all 5 trials with its 95% confidence interval. In this case, it shows that the treatment reduces mortality by 34% (OR 0.66 95% CI 0.56 to 0.78). Notice that the diamond does not overlap the ‘no effect’ line (the confidence interval doesn’t include 1) so we can be assured that the pooled OR is statistically significant. The test for overall effect also indicates statistical significance (p<0.0001).
Exploring heterogeneity
Heterogeneity can be assessed using the “eyeball” test or more formally with statistical tests, such as the Cochran Q test. With the “eyeball” test one looks for overlap of the confidence intervals of the trials with the summary estimate. In the example above note that the dotted line running vertically through the combined odds ratio crosses the horizontal lines of all the individual studies indicating that the studies are homogenous. Heterogeneity can also be assessed using the Cochran chi-square (Cochran Q). If Cochran Q is statistically significant there is definite heterogeneity. If Cochran Q is not statistically significant but the ratio of Cochran Q and the degrees of freedom (Q/df) is > 1 there is possible heterogeneity. If Cochran Q is not statistically significant and Q/df is < 1 then heterogeneity is very unlikely. In the example above Q/df is <1 (0.92/4= 0.23) and the p-value is not significant (0.92) indicating no heterogeneity.
Note: The level of significance for Cochran Q is often set at 0.1 due to the low power of the test to detect heterogeneity.
Copyright of University of Oxford 2005

Gait Abnormalities in Children
Author(s): Dr Mary Lowth
Source: https://patient.info/doctor/gait-abnormalities-in-children
Publication Date: Aug 2014
Publication Type(s): Review article
Available at https://patient.info/doctor/gait-abnormalities-in-children
SYSTEMATIC REVIEW: Are the results of the review valid?
Evidence based opinions discussed – Level 5 evidence . Included as referenced by NICE.
What question (PICO) did the systematic review address?
Normal versus abnormal gait variations in children. Intoeing, tibial torsion, met adductus, bow
legs, knock knees, flat feet, normal variant,assessment and treatment.
What is best? Where do I find the information?
Presents a general overview of pathological
gait disturbance as well as normal variation.
Provides overview of evidence based
assessment options.
The article has specific sections for the various
gait presentations.
This paper: Yes • No • Unclear X•
Comment: The article is a review of the available evidence and expert opinion; it is not written in
line with a rigorous systematic review but presents information available clearly and uses
seminal articles. Not a true systematic review.
F - Is it unlikely that important, relevant studies were missed?
What is best? It is difficult to ascertain how
rigorous the completed data search was however it
is stated that it is based on research evidence UK
and European Guidelines. This was peer reviewed
article and has a review date in 2019. There is a
reference list included at the end of the article.
Where do I find the information?
Information on the search completed was not
stated online. It does state that the article was
peer reviewed and that it was last reviewed in
August 2014 with a future review date in 2019.
There is no information on how the evidence
was reviewed
The starting point for comprehensive search
for all relevant studies is the major
bibliographic databases (e.g., Medline,
Cochrane, EMBASE, etc) but should also
The Methods section should describe the
search strategy, including the terms used, in
some detail. The Results section will outline the
number of titles and abstracts reviewed, the

include a search of reference lists from
relevant studies, and contact with experts,
particularly to inquire about unpublished
studies. The search should not be limited to
English language only. The search strategy
should include both MESH terms and text
words.
number of full-text studies retrieved, and the
number of studies excluded together with the
reasons for exclusion. This information may be
presented in a figure or flow chart.
This paper: Yes • No • Unclear x•
Comment: The information in the paper is referenced but it does not explain the way they found
the information . There is no methodological data.
A - Were the criteria used to select articles for inclusion appropriate?
What is best? The authors do not describe the
inclusion or exclusion criteria for the articles
they used
Where do I find the information? It is not clear
what the inclusion/exclusion criteria were.
The inclusion or exclusion of studies in a
systematic review should be clearly defined a
priori. The eligibility criteria used should
specify the patients, interventions or
exposures and outcomes of interest. In many
cases the type of study design will also be a
key component of the eligibility criteria.
The Methods section should describe in detail
the inclusion and exclusion criteria. Normally,
this will include the study design.
This paper: Yes • No • Unclear X•
Comment: The criteria used to select articles used is based on the authors experience only
A - Were the included studies sufficiently valid for the type of question asked?
What is best? It is unclear the levels of
evidence used
Where do I find the information? Reference list
The article should describe how the quality of
each study was assessed using predetermined
quality criteria appropriate to the type of
clinical question (e.g., randomization, blinding
and completeness of follow-up)
The Methods section should describe the
assessment of quality and the criteria used. The
Results section should provide information on
the quality of the individual studies.

This paper: Yes • No • Unclear •
Comment: No results section –not applicable as this is a review article of expert opinion.
T - Were the results similar from study to study? There is no specific result section, however the conclusions
drawn are in line with other review articles.
What is best? Where do I find the information?
Ideally, the results of the different studies
should be similar or homogeneous. If
heterogeneity exists the authors may estimate
whether the differences are significant (chi-
square test). Possible reasons for the
heterogeneity should be explored.
The Results section should state whether the
results are heterogeneous and discuss possible
reasons. The forest plot should show the
results of the chi-square test for heterogeneity
and if discuss reasons for heterogeneity, if
present.
This paper: Yes • No • Unclear •
Comment:
How are the results presented? No specific result section. There are conclusions drawn based on the information reviewed.

A systematic review provides a summary of the data from the results of a number of individual studies. If the results of the individual studies are similar, a statistical method (called meta-analysis) is used to combine the results from the individual studies and an overall summary estimate is calculated. The meta-analysis gives weighted values to each of the individual studies according to their size. The individual results of the studies need to be expressed in a standard way, such as relative risk, odds ratio or mean difference between the groups. Results are traditionally displayed in a figure, like the one below, called a forest plot.
The forest plot depicted above represents a meta-analysis of 5 trials that assessed the effects of a hypothetical treatment on mortality. Individual studies are represented by a black square and a horizontal line, which corresponds to the point estimate and 95% confidence interval of the odds ratio. The size of the black square reflects the weight of the study in the meta-analysis. The solid vertical line corresponds to ‘no effect’ of treatment - an odds ratio of 1.0. When the confidence interval includes 1 it indicates that the result is not significant at conventional levels (P>0.05).
The diamond at the bottom represents the combined or pooled odds ratio of all 5 trials with its 95% confidence interval. In this case, it shows that the treatment reduces mortality by 34% (OR 0.66 95% CI 0.56 to 0.78). Notice that the diamond does not overlap the ‘no effect’ line (the confidence interval doesn’t include 1) so we can be assured that the pooled OR is statistically significant. The test for overall effect also indicates statistical significance (p<0.0001).
Exploring heterogeneity
Heterogeneity can be assessed using the “eyeball” test or more formally with statistical tests, such as the Cochran Q test. With the “eyeball” test one looks for overlap of the confidence intervals of the trials with the summary estimate. In the example above note that the dotted line running vertically through the combined odds ratio crosses the horizontal lines of all the individual studies indicating that the studies are homogenous. Heterogeneity can also be assessed using the Cochran chi-square (Cochran Q). If Cochran Q is statistically significant there is definite heterogeneity. If Cochran Q is not statistically significant but the ratio of Cochran Q and the degrees of freedom (Q/df) is > 1 there is possible heterogeneity. If Cochran Q is not statistically significant and Q/df is < 1 then heterogeneity is very unlikely. In the example above Q/df is <1 (0.92/4= 0.23) and the p-value is not significant (0.92) indicating no heterogeneity.
Note: The level of significance for Cochran Q is often set at 0.1 due to the low power of the test to detect heterogeneity.
Copyright of University of Oxford 2005

Parent Feedback on Publication

Parent Feedback on Publication

Parent Feedback on Publication
Intoeing Reference list:
Frye, Stacy., (2017) “7 lower limb positional variations”, Contemporary Pediatrics, vol. 34 (no.
9); p. 16-21

Parent Feedback on Publication
Harris, E., (2013) “The Intoeing child: Etiology, Prognosis, and Current Treatment Options”,
Clinics in Podiatric Medicine and Surgery, vol. 30 (no. 4); p. 531-565.
Lowth, M., (2014) “Gait Abnormalities in Children” Available at https://patient.info/doctor/gait-abnormalities-in-children
Rerucha, C.M., Dickison, C., Baird, D.C., Darnall, C.R., (2017) “Lower Extremity
Abnormalities in Children”, American Family Physician, vol. 96 (no. 4); p. 226-233.
Sass, P., Hassan, G., (2003) “Lower extremity abnormalities in children”, American Family
Physician, vol. 68 (no. 3); p. 461-472.