Embed Size (px)
Citation preview

LITERACY STATISTICS 2016
Government of Tripura
State Literacy Mission Authority Education (School) Department

Literacy Statistics 2016
-2-

Literacy Statistics 2016
-3-
Table of Contents
SL
No.
Contents Page
No.
1 Executive Summary 9
2 Tripura Literacy Rate - 2016 10
3 Definition and measurement of literacy 11
4 Rationale for conducting literacy assessment survey 12
5 Methodology 12
6 Introduction 15
7 Background 16
8 Major Achievement 17
9 Efforts by the State Government 17
10 Data relating to various ongoing adult literacy programme 20
11 Present status of ongoing Equivalency and Skill
Development Programme
21
12 Current initiatives and its achievement 24
13 Schedule Tribes – Level of Literacy 25
14 Schedule Caste – Level of Literacy 25
15 Calculating the literacy and illiteracy rates 25
16 Calculating the number literates and illiterates 26
17 Metadata Information 27

Literacy Statistics 2016
-4-
Literacy Statistics 2016
-5-
MINISTER Education (School & Higher),
Industry & Commerce, and Law Department
Government of Tripura
Secretariat Building, Agartala, Tripura
TAPAN CHAKRABORTY
MESSAGE
I am delighted to know that State Literacy Mission Authority (SLMA) has
successfully completed the Literacy Assessment Survey (LAS) for assessing the status
of adult literacy in Tripura and other stakeholders are increasingly interested in
assessing the skills of the adult population in order to monitor how well prepared they
are for facing the challenges of the modern knowledge-based society. Adults are
expected to use information in complex ways and to maintain and enhance their
literacy skills, to adopt ever-changing technologies. Literacy is important not only for
personal development, but also for positive educational, social and economic outcomes.
On the international level, low skills pose problems for individuals trying to cope with
work and life in modern societies where the demands for literacy skills are on the
increase. SLMA has designed LAS following the international procedures to assess
the current status of the literacy status in Tripura. Therefore, the LAS is a relevant
and time-need survey both for government policy initiatives. The LAS will provide
information on literacy status for adult age, in particular, by including the skills of
reading in digital environments and to identify ability of understanding, interpret,
create, communicate and compute, using printed and written materials associated
with varying contexts. I believe, it will also enhance enabling individuals to be needful
resource to achieve their goals, to develop their knowledge and potential, and to
participate fully in their community and wider society.
I extend my thanks to the Member Secretary, State Literacy Mission Authority and
all level officers for bringing out this valuable report. I hope it will be a useful
document for policy-makers, planners, researchers and development partners in
formulating their strategies and programmes for development of Tripura and facing
the upcoming challenges.
(Tapan Chakraborty)
Minister

Literacy Statistics 2016
-6-

Literacy Statistics 2016
-7-
MEMBER SECRETARY
State Literacy Mission Authority
JS & Director. Directorate of School Education
Government of Tripura
Office Lane, Agartala, Tripura
DR. P K GOYAL, IAS
MESSAGE
I am glad to learn that State Literacy Mission Authority (SLMA) has successfully
completed the Literacy Assessment Survey (LAS) for assessing the rate of literacy in
Tripura and the report is ready for publication. I hope this important exercise will
increase our knowledge about literacy scenario of Tripura. As the movement to
eliminate illiteracy is a global agenda, the need for detailed information about adult
literacy has become greater than ever before. This study has provided sound
information on adult literacy status of Tripura.
This report is based on the findings of the LAS for determining adult literacy rate in
2016. The definition and methodology adopted in this survey may be used for the
future surveys of this kind. The survey result may be used by government
organizations, researchers, policymakers, planners, teachers, scholars and students.
I like to extend my thanks to State, Districts and Blocks level concerned officials of
Saksharata Samities to finalize the report on time. I take this opportunity to express
my sincere thanks to all elected public representative for their kind co-operation in
undertaking this important survey.
(Dr. P K Goyal, IAS)
Member Secretary, SLMA

Literacy Statistics 2016
-8-
Literacy Statistics 2016
-9-
1. Executive Summary
This report presents final results from the third round of Literacy Assessment Survey
(LAS) conducted by State Literacy Mission Authority. The Key findings from LAS
2016 are that the literacy rate of the State of Tripura.
1.1 Survey period and sample size:
Literacy assessment tests were carried out during 2011 (1st round), 2013 (2nd round)
2014 (3rd round) and 26 June, 2016 (4th round) throughout the State. The LAS 2014-
2016 covers 73,204 persons of age 15-50 years (one eligible person from each sample
household was suppose to be assessed) drawn from 3,350 Primary Sampling Units
(PSUs) which is a sub- sample of the sample designed for Sample Census 2016, from
08 districts. Among 3,350 PSUs, 2605 were from Rural and 745 were from Urban
Areas. Among the total respondents 37,522 were male and 35,682 were female. On the
other hand 57,848 respondents were from rural areas and 15,356 were selected from
urban areas.
1.2 Testing Instrument and data collection:
Four different measures of literacy level of the respondents were considered in the
test. These are (i) reading (ii) writing and (iii) numeracy. The total score for the test
was 150, comprising of 20 in each measure type. Data collection and assessment test
was carried out by competent and well trained staff members of School education
department. A strict quality control measure was applied to ensure the quality of
data.
1.3 Literacy Levels:
The test was carried out to assess three different skill of literacy level of the
respondents. These are (i) Reading (ii) Writing and (iii) Numeracy. Based on the
competencies three levels were defined as followings:
(a) Non-literate: Lack of ability to recognize and write alphabets, words and
numbers. (b) Semi-literate: Ability to recognize and write some simple
words, to count objects and numbers at a very basic level. (c) Literate at
initial level: Ability to read and write sentences, possessing skills of four
basic rules of arithmetic and limited use of literacy skills.
Out of these three levels of literacy skills, respondents falling in only two levels
namely, Semi-Literate and Literate at initial level have been considered as literates,
while other methods of determining literacy, such as self-declaration or proxy-
declaration used in censuses and other household level surveys, may include the semi-
literates in the group of literates.

Literacy Statistics 2016
-10-
1.4. Tripura Literacy Rate 2016
Literacy rate in Tripura has seen upward trend and is 97.22 percent as per 2016
Literacy Assessment Survey (LAS). Of that, male literacy stands at 97.34 percent
while female literacy is at 96.79 percent. In 2011, literacy rate in Tripura stood at
87.22 percent of which male and female were 92.18 percent and 83.15 percent literate
respectively. In actual numbers, total literates in Tripura stands at 36,10,514 of
which males were 18,22,168 and females were 17,88,346.
1.5 Summary of Literacy Assessment Survey 2016:
The Literacy Assessment Survey, 2016 found overall literacy rate 97.22% for
population of age 7+ and above years. Following is the Summary of Key findings from
the LAS 2016:
• Rural Literacy Rate (97.34%) is found to be much higher than that of urban areas
(96.79%). The highest literacy rate (98.98%) is found in Unakoti District and the
lowest (95.97%) is found in South District.
• Remarkable difference is observed for male-female and urban-rural. The highest
male literacy rate 98.62% is found in Unakoti District and the lowest 96.16% is
found in Dhalai District. The highest Female literacy rate 99.33% is found in
Unakoti District and the lowest 95.73% is found in South District.
Description 2016 2011
Actual Population 41,82,625 36,73,917
Male 21,07,921 1,874,376
Female 20,74,704 1,799,541
Population Growth 13.84% 14.84%
Sex Ratio 969 960
Child Sex Ratio 952 957
Total Child Population (0-6 Age) 4,69,003 458,014
Male Population (0-6 Age) 2,37,429 234,008
Female Population (0-6 Age) 2,31,574 224,006
Literacy 97.22% 87.22 %
Male Literacy 97.34% 91.53 %
Female Literacy 96.79% 82.73 %
Gap 0.55% 8.8%
Total Literate 36,10,514 2,804,783
Male Literate 18,22,168 1,501,369
Female Literate 17,88,346 1,303,414
Total Illiterate Population (7+ and above Years) 1, 03,108 4,11,120
Illiterate Population (7-50 Years) 35.547 1,42,569
Illiterate Population (51+ and above Years) 67,561 2,68,551

Literacy Statistics 2016
-11-
1.6 District wise Literacy rate 2016:
District Literacy Male
Literacy
Female
Literacy
Gap Male
Literate
Female
Literate
Dhalai 96.04% 96.16% 95.92% 0.24% 186086 185737
Gomati 96.83% 97.08% 96.57% 0.51% 211541 205839
Khowai 97.74% 97.78% 97.70% 0.08% 171196 170196
North 97.76% 97.96% 97.56% 0.40% 199219 194884
Sepahijala 97.76% 98.56% 96.94% 1.62% 244518 235889
South 95.97% 96.21% 95.73% 0.48% 200859 193408
Unakoti 98.98% 98.62% 99.33% -0.71% 134514 134261
West 97.23% 97.31% 97.15% 0.16% 474235 468132
2. Definition and measurement of literacy
Different organizations use the term literacy differently still today. Therefore, proper
measurement of literacy cannot be done. As a result, literacy rate vary among the
surveys. SLMA generally uses self/proxy reporting definition i.e., respondents
reporting as capable of writing a letter in any language are considered as literates for
getting general literacy information in the regular censuses and household surveys.
Recognizing the fact, for conducting Literacy Assessment Survey 2016 SLMA adopted
the definition of literacy from UNESCO 2003. This definition is quoted below:
“Literacy is the ability to identify, understand, interpret, create, communicate and
compute using printed and written materials associated with varying contexts.
Literacy involves a continuum of learning in enabling individuals to achieve his or her
goals, develop his or her knowledge and potentials, and participate fully in the
community and wider society.”
Literacy Assessment Survey 2016 is conducted by adopting the above mentioned
definition of the UNESCO. Hence, the word ‘literacy’ is used throughout the report to
mean the ‘functional literacy’ in order to avoid the confusion (if there is/are any)
between literacy rate stated in this report and stated in other published reports of
censuses and surveys of SLMA.
3. Rationale for conducting Literacy Assessment Survey
Like the Literacy Assessment Survey (LAS) 2014, the LAS-2016 survey aims at
providing valid, reliable, comparable and interpretable literacy data through
administering cognizance test using literacy assessment/testing instruments.
These data will help the government and other stakeholders to focus on real needs
and allow them to fix target and assess the resources that required implementing the

Literacy Statistics 2016
-12-
target. The reliable and valid data set will also allow development partners more
confidence to deal with poverty alleviation, economic growth and social advancement.
4. Methodology
There has been a continuing debate on what constitutes literacy and how to define it.
It is obvious that the literacy rates derived from national census and household
surveys do not measure the literacy skills and thus do not reflect the exact functional
ability of the people on literacy rate in the country. SLMA tried to come out from the
traditional method to assessment based method for measuring literacy rate in Tripura
for the first time in 2005. It is the Forth effort of SLMA in this regard. On that
mission however, accurate measurement of literacy skill is very difficult when there is
no standard methodology for doing so. This assessment effort tried to pull the
experience of the previous assessment efforts mentioned earlier.
4.1 Method of data collection:
The Literacy Assessment Survey 2016 was carried out on Panchayat/Village
Council/Ward (Urban areas) basis. Direct interview method was followed during data
collection. The interviewers conducted literacy test using printed literacy testing
instruments (Assessment Questionnaires). These questionnaires contained Bangla
words and a paragraph for reading, four sentences on self introduction, name of days
of week and writing five sentences about the area of his/her respective residence,
doing arithmetic with identification of numbers, addition, subtraction, multiplication,
division, arranging numbers in a definite order, understanding of family accounts and
a few gestations on application skill tests.
Background information about individuals and households were taken from the
Census-2011 which was collected just before administering the assessment of literacy
test in the same household. The selected person was tested for assessing literacy skills
through administration of the assessment questionnaire, which was designed to
measure reading, writing, numeracy and communication & comprehension of the
respondent. While the interviewers conducted the assessment, the supervisors
randomly verified the tests. Later on the test papers were scored through checking
the test script using a predetermined standard of marks.
4.2 Questionnaire:
State Equivalency Examination Board (SEEB) developed two types of instrument for
collecting data by conducting Literacy Assessment Survey (LAS-2016). These are:
(a) Sample Questionnaire, which contains the requisite background information and
(b) Literacy testing instrument

Literacy Statistics 2016
-13-
4.3 Assessment Questionnaire (Literacy Testing Instrument)
The assessment questionnaire contained test items to validate different levels of skills
of the selected persons. Total score is 150 marks. This questionnaire is divided into 3
modules. Module 1 consists of reading items such as words and literature, Module 2
consists of writing items, Module 3 consists of arithmetic such as recognition of
numbers, addition, subtraction, multiplication, division and understanding of
personal budget and general knowledge.
Each module contains 50 marks which aggregate to a total of 150 marks. Functional
literacy rate is classified into three levels to determine the skill of the persons under
investigation. The levels are non-literate, semi-literate and literate at initial level on
the basis of the scores obtained by the persons.
The selected Literacy Assessment Survey 2016 respondents were requested to sit for
the test in the examination center when none of the any members was allowed to stay
nearby to avoid copying or adopting any unfair means in the test.
The respondents were assessed on the basis of their performance in reading, writing,
arithmetic and general knowledge test. A respondent is non-literate if he/she obtains
less than 20 marks in each subject, semi-literates if score is between 60 and 100 and
initial literate if score is equal to or above 100. This study has considered semi-
literate as literate and initial literate as literate.
4.4 Quality control:
Throughout the data collection period there was mechanism for monitoring the
interviewers work by the supervisors. At the beginning of data collection, each
interviewers work was carefully monitored. During the training period, interviewers
were informed that their work would be monitored.
A total of thirty supervisors were engaged to supervise the field work of Literacy
Assessment Survey. The well trained supervisors observed each interviewer’s work
cautiously and continuously every day during the whole data collection period.
The supervisors were instructed to review status of work of each interviewer such as
found out how much they have worked, quality of collected data, reviewed the
problem associated with collected data and motivated them to finish the work on time.
4.5 Editing and data processing:
A great deal of quality control depends on post data collection activities including
editing and processing. Utmost effort was made to ensure quality of data through
appropriate editing and processing. The methods adopted for data editing, coding,
entry and processing were as follows:

Literacy Statistics 2016
-14-
4.6 Data editing system:
The survey collected data through two sets of questionnaires. A group of trained staff
members primarily edited the data based on some predetermined principles. They
were instructed to check ID, range and consistency and they corrected the data
wherever necessary. Besides these an edit program was developed to produce error
list. An expert programmer developed the edit program to clean the data efficiently
and logically.
Edit program was tested several times with a good number of records. The final edit
program was run after all data have been captured. After running the edit program,
errors and inconsistencies were detected and were printed out as an error-list. Then
these were checked by a group of operators using data from the original filled-in
questionnaires and corrected records accordingly.
During computer editing internal consistency, omission, duplication and validation of
data/records were checked. Thus the data file has been made error-free.
5. Introduction:
Education is one of the pillars of modernization and literacy growth rate is an
indicator through which the educational growth can be measured partially. Literacy
and education are intrinsic to human development. So literacy has always remained
as area of importance. One of the declared objectives of State Government is to make
all illiterate learners literate. Education is a powerful instrument of social change and
often initiates upward movement in the social structure.
The educational scenario of Tripura has undergone major changes over the years,
results in better provision of education and better educational practices. Tripura is a
hilly state situated in the North-Eastern region of India. The third-smallest state in
the country, it covers 10,491.72 sq km (4,051 sq mi) and is bordered by Bangladesh
and the Indian states of Assam and Mizoram to the east.
Bir Bikram Kishore Manikya was the last king of Tripura during India’s
Independence and the state’s merger in India in 1949. In 1945, a group of educated
Tribals formed an organization for mass education called the Jana Siksha Samiti. The
samiti opened around 450 primary schools across the Tripura. This is arguably the
first organization with in the tribals in India who took up the issue of education and
brought that into the arena of public action and mobilization.
However, due to the lack of proper educational infrastructure literacy rate was very
negligible in Tripura. During the last few years literacy growth rate of the state has
increased handsomely. At present, the literacy rate of the state is 96.82 percent.

Literacy Statistics 2016
-15-
5.1 Ranking of States and Union Territories by literacy rate: 2011
Top 5 State / UT Below 5 State / UT
1) Kerala (93.91)
2) Lakshadweep (92.28)
3) Mizoram (91.58)
4) Goa (87.70)
5) Tripura (87.22)
1) Andhra Pradesh (67.66)
2) Jharkhand (67.63)
3) Rajasthan (67.06)
4) Arunachal Pradesh (66.95)
5) Bihar (63.82)
5.2 Literacy rate in Tripura (1911-2011 Census Years):
Census Year Person Male Female Gap
1911 4.76 8.06 0.92 7.14
1921 8.21 14.32 1.12 13.20
1931 3.43 5.93 0.52 5.41
1941 7.95 12.74 2.46 10.28
1951 15.50 22.30 8.00 14.30
1961 24.30 29.60 10.20 19.40
1971 31.00 40.20 21.20 19.00
1981 50.10 61.50 38.00 23.50
1991 60.40 70.60 49.70 20.90
2001 73.70 81.50 65.40 16.10
2011 87.22 91.53 82.73 8.80
6. Background:
Period:
1995-2003
� Literacy and education are intrinsic to human development. So,
literacy has always remained as area of importance and priority of
the State Government. One of the declared objectives of State
Government is to make all illiterate learners literate.
� The State Government introduced Total literacy campaign (TLC),
Post literacy campaign (PLC), Project for residual illiterates (PRI)
and Continuing Education programme (CEP) in true sense during
the years from 1995-2003.
� Out of targeted 1,64,755 learners 1,32,563 learners came out as
successful as a result of proper implementation of the aforesaid
programmes under the guidance of Indian Institute of Management,
Kolkata, an empanelled agency of NLMA, GOI.

Literacy Statistics 2016
-16-
Period:
2004-2007
� The State Government declared a 9-Point programme during the
period 2004-2007 including the programme of achieving 100 per cent
literacy by way of providing opportunities of pre-primary education to
all children in the age group of 3-6, admission of all dropouts in the
age group of 6-14 through SSA and education of all persons in the age
group of 15-45.
� As per Census 2001, literacy rate of the State was 73.20% against
National rate 65.38%. Male literacy rate of the State was 81.00%
(National rate 75.85%) and female literacy rate of State 64.9%
(National rate 54.16%).
� As a result of successful implementation of State sponsored 9-Point
Programme the State achieved literacy rate of 80.14 percent as on
31st March, 2007 i.e. 6.94 per cent higher than the literacy rate
decaled in the Census report 2001.
� This time, the Indian Statistical Institute (ISI), Kolkata an
empanelled agency of NLMA, GOI was entrusted with the final
evaluation of literacy programme.
7. Major Achievement
7.1 Decadal Literacy Award on highest reduction between male and female
literacy rate (7%) during 2001-2011:
Tripura has achieved highest reduction between male and female literacy rate (7%) in
the country during 2001-2011. One Decadal Literacy Award (One Trophy and a
Certificate) has been given to Tripura for this achievement. Her Excellency, the
President of India conferred this Award in the ceremony of 45th International
Literacy Day which was organised by the National Literacy Mission, MHRD, GOI in
collaboration with UNESCO, Paris on September 8, 2011 at Manekshaw Centre,
Delhi Cantonment.
7.2 Interview with the NRI-SAMAY, Los Angeles:
Dr. K Rajeswara Rao, Principal Secretary, School Education Department in an
interview with the NRI-SAMAY of Los Angeles in October, 2014 responded to
questionnaires on the background of the above mentioned success story, which was
live broadcast for awareness of the people of eight Countries.

Literacy Statistics 2016
-17-
8. Efforts by the State Government:
The State Government is working for last few years to achieve 100% literacy in the
State of Tripura. To achieve this goal, the State Government launched time bound
Special Adult literacy Programme in 2011-12 throughout the State. Specific target
was also fixed to achieve this goal by August, 2014.
To implement the aforesaid target, a special survey was conducted by all Zilla
Saksharata Samities in the year 2012. As per survey, it was found that total 1,31,634
illiterates in the age group of 15 and above were there whom we could not be made
literate for various reasons. Among them 72,115 were in the age group of 15-50 years
and balances 59,519 were in the age group of 50 and above.
Total 8,152 nos. teaching-learning centers were opened in each of the Panchayats,
Village committees, Blocks, Nagar Panchayats and each ward of Agartala Municipal
Council of Tripura and 8,254 literacy workers were engaged to cover all identified
adult learners. In all Panchayats, monitoring committees were formed to encourage
as well as to supervise the regular attendance of the learners. To make this
programme fully successful, Anganwadi workers, Primary School teachers, elected
PRI Bodies, educated un-employed Volunteers and persons interested in education
were actively involved. It may be mentioned here that as per norms of National
Literacy Mission, GOI a State can be declared as full literate State even if the State
can achieve its 80 percent literacy rate. In this respect, as per Census-2011
(Provisional) the literacy rate of Tripura was 87.75 and its position was 4th in India.
Despite above prevailing guideline of the Government of India, the Government of
Tripura decided to declare this State as total literate only after achieving 100%
literacy. To have this success, all educated persons, elected PRI bodies and various
voluntary organisations encouraged all adult learners irrespective of caste and creed
and in-turn helped to be 100 percent literate State in India. All Anganwadi Workers,
primary school teachers of State and TTAADC, educated youth served voluntarily to
make literate the identified illiterates. Neither un-employed educated youths nor the
Anganwadi workers and Primary School teachers of TTAADC were pain any
honorarium or extra remuneration for their service.
To ascertain the progress achieved so far through the literacy campaign in the State,
an internal evaluation was conducted during June, 2013 and the State Resource
Center–Tripura was given the responsibility to conduct this evaluation. It was seen
that there were 98,175 learners who sat for the internal evaluation against which
65,831 were in the age group of 15-50 years and 32,344 were in the age group of above
50 years. At this stage total 83,951 learners became successful. The learners who
could not appear at the internal evaluation and thus not succeeded, sat in the
concurrent evaluation conducted by Zilla Saksharata Samities concerned during July,
2013. This initiative was taken to make them eligible for the Final Evaluation.
Literacy Statistics 2016
-18-
Thereafter, the final evaluation was conducted during the period from August, 2013.
The Indian Statistical Institute (ISI), Kolkata and National Institute of open School
(NIOS), Noida being empanelled agencies of Government of India were entrusted with
the responsibility of conducting this final evaluation. A team comprising 09 experts
from ISI, Kolkata came to conduct the final evaluation. Dr. (Mrs) Anjali Ghosh
headed the team.
Total 1,00,681 learners sat for final evaluation throughout the State, of which 71,925
learners were in the age group of 15-50 years and 71,925 learners were in the age
group of above 50 years. As per reports received from evaluators, based on norms of
National Literacy Mission, Government of India, 94,600 learners became successful.
Elected PRI bodies at all levels, various voluntary organisations, Panchayats, Blocks,
District Administrations, Tripura Tribal Areas Autonomous District Council
(TTAADC), persons interested in education and common people played a very
significant and active role in implementation of this programme. The ISI, Kolkata
highly appreciated the level of commitment of the Government of Tripura for its all-
out efforts and specifically mentioned about large scale participation of women in the
final evaluation.
As a result of successful implementation of adult literacy programme, the literacy rate
of Tripura reached to 95.16 percent as on 08.09.2013. It needs to be mentioned here
that as per final report of Census 2011 published in June 2013, the literacy rate of
Tripura was 87.22 percent and the rank was fifth (5th) amongst all the States and
UTs in the Country. It can be claimed that at present Tripura ranks first amongst all
States and UTs. It may also be pointed out here that Tripura could reduce male and
female literacy gap from 19 percent to 7 percent during 2001-2011, which is
considered as the highest reduction in India. As a result of this, the Government of
India awarded Tripura with a Trophy and Certificate on International Literacy Day
i.e. 8th September, 2011.
The State Government is not ready to stop the exercise only with the above
achievements. Meanwhile, the Mop-up Programme to literate the un-successful
learners who appeared in the last Special Adult Literacy Programme during 2013-14
started from 1st November, 2013 throughout the State to make them literate by June,
2014. For this, 643 literacy centers had been opened to cover 4,729 learners and 727
literacy workers had been engaged. However, as a result of successful implementation
of Mop-up Programme out of 3150 learners, sat in the evaluation test 2930 could
success.
Consequent upon successful implementation of Special
Adult Literacy Programme, the literacy rate of the State
reached to 96.82 percent as on 08.09.2014.

Literacy Statistics 2016
-19-
9. Data relating to various ongoing adult literacy programme:
9.1 The remarkable improvement of Tripura in Literacy is shown in the following
Table.
State 1991 2001 2011
Tripura 60.44 73.19 87.22
Arunachal Pradesh 41.59 54.34 66.59
Nagaland 61.65 66.59 80.11
Manipur 59.89 70.53 79.85
Mizoram 82.26 88.80 91.58
Meghalaya 49.1 62.56 75.48
Assam 52.89 63.25 73.18
In the table show that Tripura has increased its literacy rate by around 27 percent
from 60.44 percent to 87.22 percent between 1991 and 2011.
Tripura has resulted in an improvement in its rank amongst the Indian states, from
12th in 2001 to 1st position with 96.82 %.
9.2 Gender wise literacy rate in Tripura are shown below.
Year Total Male Female Difference between M & F
1991 60.44 70.58 49.65 20.93
2001 73.20 81.02 64.91 16.11
2011 87.22 91.53 82.73 8.80
2014 96.82 97.93 95.71 2.22
The literacy rate of females during the period from 1991 to 2014 the state managed to
increase by 47.88% -from 49.65 to 97.53 percent while in the case of men the increase
was just 28.01% - from 70.58 percent to 98.59 percent. In Tripura, increase of female
literacy is better than their male counterparts.

Literacy Statistics 2016
-20-
10. Present status of ongoing Equivalency and Skill
Development Programme (SDP).
10.1 Equivalency Programme:
All related initiatives have been taken up by all concerned Zilla, Block, NP and MC
level Saksharata Samities for successful implementation of the Equivalency
Programme in the State.
10.1.1 Data relating to Equivalency Programme (Class III):
District Total Learners Social Category
Total Male Female SC ST Minority OBC Others
North 780 132 648 65 514 93 83 25
Unakoti 419 60 359 86 201 74 54 4
Dhalai 7953 2105 5848 560 7157 31 163 42
Khowai 958 136 822 56 809 13 73 7
West 714 111 603 180 402 23 62 47
Sepahijala 3873 818 3055 719 1762 913 340 139
Gomati 1641 317 1324 85 1324 125 69 38
South 1264 237 1027 179 796 43 140 106
Total 17602 3916 13686 1930 12965 1315 984 408
10.1.2 Data relating to Equivalency Programme (Class IV):
District Total Learners Social Category
Total Male Female SC ST Minority OBC Others
North 2186 277 1909 213 1547 243 140 43
Unakoti 588 82 506 82 222 180 91 13
Dhalai 4974 1298 3676 916 3565 116 322 55
Khowai 1314 159 1155 171 984 21 115 23
West 3868 470 3398 1092 1622 269 510 375
Sepahijala 2820 472 2348 569 782 1028 313 128
Gomati 1963 300 1663 169 1513 162 70 49
South 6829 1023 5806 715 4965 195 524 430
Total 24542 4081 20461 3927 15200 2214 2085 1116

Literacy Statistics 2016
-21-
10.2 Skill Development Programme (SDP):
Present status of Skill Development Programme under Continuing Education
Programme is as under:
Name of
the
District
Training
centres
opened
Beneficiary
enrolled
No. beneficiaries
trained
beneficiary
benefited in
various
ways
Upto
August,
2015
Upto
May,
2016
Upto
August,
2015
Upto
May,
2016
Sepahijala 3 3373 8131 1177 358 172
Gomati 3 1951 5942 1328 80 115
South 3 3437 10587 863 186 106
West 4 2566 3343 1874 68 208
Khowai 3 2363 5663 2046 469 94
Dhalai 3 7928 13722 2428 1459 354
Unakoti 3 1835 3524 881 547 91
North 3 2949 3688 651 550 156
Total 25 26402 54600 11,248 3717 1296
10.3 Literacy rate in Tripura (Census Year 2011, Year 2013, Year 2014):
District Literacy rate (%) -
Census 2011
Literacy rate (%) -
August 2013
Literacy rate (%) -
September 2014
Male Female Total Male Female Total Male Female Total
West 94.04 88.01 91.07 97.12 94.69 95.91 97.96 95.11 96.54
Sepahijala 89.80 79.49 84.68 94.58 91.25 92.92 97.89 95.66 96.78
Khowai 92.17 83.17 87.78 96.68 92.36 94.52 98.12 96.87 97.50
Gomati 89.94 78.90 84.53 97.89 95.10 96.50 97.89 95.10 96.50
Dhalai 89.96 79.16 84.68 94.69 90.25 92.47 97.89 95.69 96.79
Unakoti 91.31 79.79 85.72 96.58 91.25 93.92 97.25 94.89 96.07
North 90.92 82.79 86.91 96.56 94.58 95.57 98.12 96.87 97.50
South 91.27 84.39 87.90 96.68 93.25 94.97 98.28 95.45 96.87
TRIPURA 91.53 82.73 87.22 96.35 92.84 94.65 97.93 95.71 96.82

Literacy Statistics 2016
-22-
10.4 Details of Skill Development Programme (SDP):
District Name and location of the training
Center
Name of the
ongoing trades
No. of
benefi
ciary
traine
d
North Panisagar SHG Training Hall
Fish Farmer Training Center,
Kalachera SHG Training Hall
Piggery, Prawn
Cultivation,
Poultry
1201
Unakoti Chirakuti AWC Vill., Kirtantali,
Kumarghat Panchayet Samity Hall
Rajib Gandhi Seba Kendra,
Vermi Compost
Goaterry
Fishery
1428
Dhalai Krishi Vigyan Kendra, Selama Block
Training Hall, DZP, Ambassa Block
Nalkata Farm Complex, 82-Miles,
Agriculture &
Horticulture based
Pisciculture Based
3887
West DRDA Training Hall, Jirania
Panchayat Samity Hall, Samar Smriti
Bhavan, Jogendra Nagar, AMC
Bharat Nirman Rajib Gandhi Seba
Kendra, Paschim Taranagar,
ARDD /
Agriculture
Fishery
Agriculture
ARDD
1942
Gomati Udaipur NP Conference Hall, Udaipur
Amarpur Block Conference Hall,
Amarpur
Kaobook Block Conference Hall,
Fishery
Agriculture,
ARDD based
1408
South O/o the Supdt. of Agriculture, Rajnagar
Agriculture Hall, Baikhora,
Santirbazar
Unnayan Bhavan, Satchand, Sabroom
Agri, Horti and
Forest
Pisciculture,
Meat and Egg
Production
1049
Sepahijala Panchayet Samity Hall, Bishalghar
DC Office old Building, Takarjala
NP Conference Hall, Sonamura
Agri, Horti and
Forest
Pisciculture,
Meat and Egg
Production
1535
Khowai Khowai Block HQ, Khowai
Padmabil Bazar Community Hall,
padmabil Block
Teliamura Block HQ, Teliamura
Pisciculture
ARDD
Horticulture
2515
Grand Total 14965

Literacy Statistics 2016
-23-
11. Current initiatives and its achievement:
1) The State Government has launched Equivalency Programme as well as Skill
Development Programme under the Continuing Education Programme (CEP)
since 1st January, 2014 to make all neo-literates to acquire further learning up to
standard III level and also to enhance their earning skills on different trades.
2) 4,350 teaching-learning centers have been opened in all the Gram Panchayats,
Village committees, Blocks, Nagar Panchayat areas of Tripura and 3,056 literacy
workers have been engaged to cover 70,425 identified neo-literates.
3) In all Panchayats, monitoring committees have been formed to encourage as well
as to supervise the regular attendance of the learners.
4) Anganwadi workers, Primary School teachers, Elected PRI Bodies, Educated un-
employed Volunteers and persons interested in education have been actively
involved.
5) 25 Skill Development Training Centers have been opened throughout the State for
running thus Skill Development Programme. Meanwhile, total 8,926 neo-literates
have been covered under the programme.
6) For Equivalency Programme the State Government has constituted a State
Equivalency Examination Board (SEEB) for its overall plan, monitoring and
evaluation. Under this Board, the Equivalency Examination (Std.III level) was
held on July, 2015 throughout the State.
7) Out of registered 46,674 learners appeared 39,326, of which 7,362 male, 31,964
female, 6,646 Schedule Caste, 24,604 Schedule Tribe, 3,461 Minority and 4,612
belong to others.
8) Out of appeared 39,326 learners passed 32,318, of which 5,538 male and 26,780
female. The percentage of candidates passed is 82.18.
9) The State Government has been decided to start Equivalence programme Std. V
level by February, 2017 covering 23,318 learners along with its existing
Equivalence programme Std. III & IV level.
10) For this, preparation of primer, registration of learners, batching matching of
learners, identification of learning centers, identification of Literacy workers etc
are going on in full suing.

Literacy Statistics 2016
-24-
12. Scheduled Tribes - Level of Literacy
The population of Tripura is characterized by social diversity. The people of the
Scheduled Tribes (ST) comprise about one-third of the population.
As per Census-2011, ST population of the State is 11,66,813 which is 31.8 percent of
the total population of the State. There are 19 sub tribes among the ST population of
the State with their own cultural identity, namely – (i) Tripuri, (ii) Reang, (iii)
Jamatia, (iv) Chakma, (v) Lusai, (vi) Mog, (vii) Garo, (viii) Kuki, (ix) Chaimal, (x)
Uchai, (xi) Halam, (xii) Khasia, (xiii) Bhutia, (xiv) Munda, (xv) Orang, (xvi) Lepcha,
(xvii) Santal, (xviii) Bhil and (xix) Noatia
The Census-2011 data reveals that the overall ST literacy rate reached to 79.05
percent from earlier 56.50 percent in 2001. The ST literacy rate has significantly
increased during intra-census period of 2001-2011 in the State, i.e, about 22.55
percent, which is quite impressive.
13. Scheduled Castes - Level of Literacy
The Census-2011 data shows that SC population of the State is 6,54,918 (17.8
percent). The total SC male is 3,34,370 and SC female was 3,20,548. The demography
of Scheduled Castes in the State is not confined to any particular 'paras' or 'bastis'.
The SC literacy rate has increased to 89.45 percent in 2011 from earlier level of 74.68
percent in 2001. During intra-census period of 2001-2011 an increase of 14.77 percent
is noticed for SC literacy.
14. Calculating the literacy and illiteracy rates
Definition: The literacy rate is defined as the percentage of the population for a given
age group that can both read and write with understanding a short simple statement
on his/her everyday life. The complement of this measure, the illiteracy rate, is
defined as the percentage of the population for a given age group that cannot both
read and write with understanding a short simple statement on his/her everyday life.
Purpose: The literacy rate shows the accumulated achievement of primary education
and literacy programmes in imparting basic literacy skills to the population, thereby
enabling them to apply such skills in daily life and to continue learning and
communicating using the written word. Literacy represents a potential for further
intellectual growth and contribution to the economic-socio-cultural development of a
society.
Data required: The number of literates and illiterates aged 7 years and above.

Literacy Statistics 2016
-25-
t
Data sources: Primarily
population and household
censuses; NSSO sample
surveys.
Types of disaggregation:
This indicator can be
calculated by sex (total,
male and female),
geography (state, urban
and rural) and age group
(aged 15 years and over by
five-year age groups or combinations of five-year age groups).
15. Calculating the number of literates and illiterates
Definition: The number of illiterates is defined as the number of persons who cannot
both read and write with understanding a short simple statement on their everyday
life. The number of literates is defined as the number of persons who can both read
and write with understanding a short simple statement on their everyday life.
Purpose: This indicator identifies the size and, if possible, characteristics of the
illiterate and literate populations within a given country or territory. The illiterate
population should be targeted for policies and efforts in expanding literacy
programmes.
Data required: State population estimates for persons aged 15 years and above;
literacy and illiteracy rates by age group.
Data sources: Primarily
population and household
censuses; sample surveys.
Types of disaggregation:
This indicator can be
calculated by sex (total, male
and female), geography
(national, urban and rural)
and age group (aged 15 years
and over by five-year age groups or combinations of five-year age groups).
Note: Calculation formula in respect of literacy and illiteracy as shown above on UNESCO guideline.

Literacy Statistics 2016
-26-
16. Metadata Information
Table: 1.1: District level Population and literacy rate based on Census-2011 final data
District Population Literacy rate (%)
Male Female Total Male Female Total
West 466152 452048 918200 94.04 88.01 91.07
Sepahijala 247829 235858 483687 89.80 79.49 84.68
Khowai 167401 160163 327564 92.17 83.17 87.78
Gomati 225428 216110 441538 89.94 78.90 84.53
South 220162 210589 430751 89.96 79.16 84.68
Dhalai 194544 183686 378230 91.31 79.79 85.72
Unakoti 140210 136296 276506 90.92 82.79 86.91
North 212650 204791 417441 91.27 84.39 87.90
TRIPURA 1874376 1799541 3673917 91.50 82.70 87.22
Table: 1.2: Population in the Age-Group 0-6 and Number of Literates: Census 2011
State /
District
Population in age
group 0-6
Number of literates
Total Male Female Total Male Female
TRIPURA 444055 227354 216701 2831742 1515973 1315769
West 184656 95085 89571 1369122 727353 641769
South 108805 55876 52929 654503 355784 298719
Dhalai 54416 27600 26816 280930 154161 126769
North 96178 48793 47385 527187 278675 248512
Table: 1.3: Number of Literates (7+ and above year) and Literacy Rate: Census 2011
State /
District
Number of Literates
Literacy rate (%)
Total Male Female Total Male Female
TRIPURA 2831742 1515973 1315769 87.75 92.18 83.15
West 1369122 727353 641769 88.91 92.91 84.76
South 654503 355784 298719 85.41 90.94 79.64
Dhalai 280930 154161 126769 86.82 92.45 80.83
North 527187 278675 248512 88.29 91.77 84.69

Literacy Statistics 2016
-27-
Table: 1.4: Population in the age-group 0-6 years for State and Districts: 2011
Name TRU Total Male Female
TRIPURA Total 458014 234008 224006
TRIPURA Rural 365309 186400 178909
TRIPURA Urban 92705 47608 45097
West Tripura Total 190850 97787 93063
West Tripura Rural 127118 65022 62096
West Tripura Urban 63732 32765 30967
South Tripura Total 111949 57382 54567
South Tripura Rural 100135 51240 48895
South Tripura Urban 11814 6142 5672
Dhalai Total 56011 28460 27551
Dhalai Rural 51571 26196 25375
Dhalai Urban 4440 2264 2176
North Tripura Total 99204 50379 48825
North Tripura Rural 86485 43942 42543
North Tripura Urban 12719 6437 6282
Table: 1.5: State / UT wise Literacy Rate (Census 1951 to 2011)
(in Percent)
Sl. No. States / Union
Territories
1951 1961 1971 1981 1991 2001 2011
1 Sikkim NA NA 17.74 34.05 56.94 68.81 82.20
2 Arunachal Pradesh NA 7.13 11.29 25.55 41.59 54.34 66.95
3 Nagaland 10.52 21.95 33.78 50.28 61.65 66.59 80.11
4 Manipur 12.57 36.04 38.47 49.66 59.89 70.53 79.85
5 Mizoram 31.4 44.01 53.80 59.88 82.26 88.80 91.58
6 Tripura 18.52 20.24 30.98 50.10 60.44 73.19 87.22
7 Meghalaya NA 26.92 29.49 42.05 49.10 62.56 75.48
8 Assam 18.53 32.95 33.94 NA 52.89 63.25 73.18
ALL INDIA 18.33 28.3 34.45 43.57 52.21 64.84 74.04

Literacy Statistics 2016
-28-
Table: 1.6: The following Table showing district level literacy rate based on literacy
campaign throughout the State during August, 2013
District CENSUS 2011 AUGUST, 2013
Male Female Total Male Female Total
West 94.04 88.01 91.07 97.12 94.69 95.91
Sepahijala 89.80 79.49 84.68 94.58 91.25 92.92
Khowai 92.17 83.17 87.78 96.68 92.36 94.52
Gomati 89.94 78.90 84.53 97.89 95.10 96.50
Dhalai 89.96 79.16 84.68 94.69 90.25 92.47
Unakoti 91.31 79.79 85.72 96.58 91.25 93.92
North 90.92 82.79 86.91 96.56 94.58 95.57
South 91.27 84.39 87.90 96.68 93.25 94.97
TRIPURA 91.53 82.73 87.22 96.35 92.84 94.65
Table: 1.7: The following Table showing district level literacy rate based on literacy
campaign throughout the State during January, 2014
District CENSUS 2011 JANUARY, 2014
Male Female Total Male Female Total
West 94.04 88.01 91.07 97.85 94.79 96.28
Sepahijala 89.80 79.49 84.68 95.23 92.36 93.80
Khowai 92.17 83.17 87.78 97.32 92.84 95.08
Gomati 89.94 78.90 84.53 97.89 95.10 96.50
Dhalai 89.96 79.16 84.68 95.35 92.36 93.86
Unakoti 91.31 79.79 85.72 96.98 91.31 94.15
North 90.92 82.79 86.91 96.77 94.69 95.73
South 91.27 84.39 87.90 96.89 93.87 95.38
TRIPURA 91.53 82.73 87.22 96.79 93.41 95.16
Table: 1.8: The following Table showing district level literacy rate based on literacy
campaign throughout the State during September, 2014
District CENSUS 2011 SEPTEMBER, 2014
Male Female Total Male Female Total
West 94.04 88.01 91.07 97.96 95.11 96.54
Sepahijala 89.80 79.49 84.68 97.89 95.66 96.78
Khowai 92.17 83.17 87.78 98.12 96.87 97.50
Gomati 89.94 78.90 84.53 97.89 95.10 96.53
Dhalai 89.96 79.16 84.68 97.91 95.69 96.79
Unakoti 91.31 79.79 85.72 97.25 94.89 96.07
North 90.92 82.79 86.91 98.12 96.87 97.50
South 91.27 84.39 87.90 98.28 95.45 96.87
TRIPURA 91.53 82.73 87.22 97.93 95.71 96.82

Literacy Statistics 2016
-29-
Table: 1.9: Population in the age-group 0-6 years for the State and Districts- 2011
Area Name Age Population total
Persons Males Females
TRIPURA 0 56275 28650 27625
TRIPURA 1 64108 32563 31545
TRIPURA 2 65012 33442 31570
TRIPURA 3 69528 35467 34061
TRIPURA 4 67643 34383 33260
TRIPURA 5 69220 35258 33962
TRIPURA 6 66228 34245 31983
TRIPURA TOTAL (0-6 YRS) 4,58,014 2,34,008 2,24,006
WEST 0 23509 12077 11432
WEST 1 26238 13408 12830
WEST 2 26608 13753 12855
WEST 3 28853 14731 14122
WEST 4 28556 14549 14007
WEST 5 29129 14842 14287
WEST 6 27957 14427 13530
SOUTH 0 13652 6993 6659
SOUTH 1 14692 7456 7236
SOUTH 2 16065 8214 7851
SOUTH 3 17189 8822 8367
SOUTH 4 16849 8645 8204
SOUTH 5 16943 8672 8271
SOUTH 6 16559 8580 7979
DHALAI 0 6488 3285 3203
DHALAI 1 8798 4453 4345
DHALAI 2 7991 4109 3882
DHALAI 3 8469 4190 4279
DHALAI 4 7864 3947 3917
DHALAI 5 8350 4276 4074
DHALAI 6 8051 4200 3851
NORTH 0 12626 6295 6331
NORTH 1 14380 7246 7134
NORTH 2 14348 7366 6982
NORTH 3 15017 7724 7293
NORTH 4 14374 7242 7132
NORTH 5 14798 7468 7330
NORTH 6 13661 7038 6623
Literacy Statistics 2016
-30-
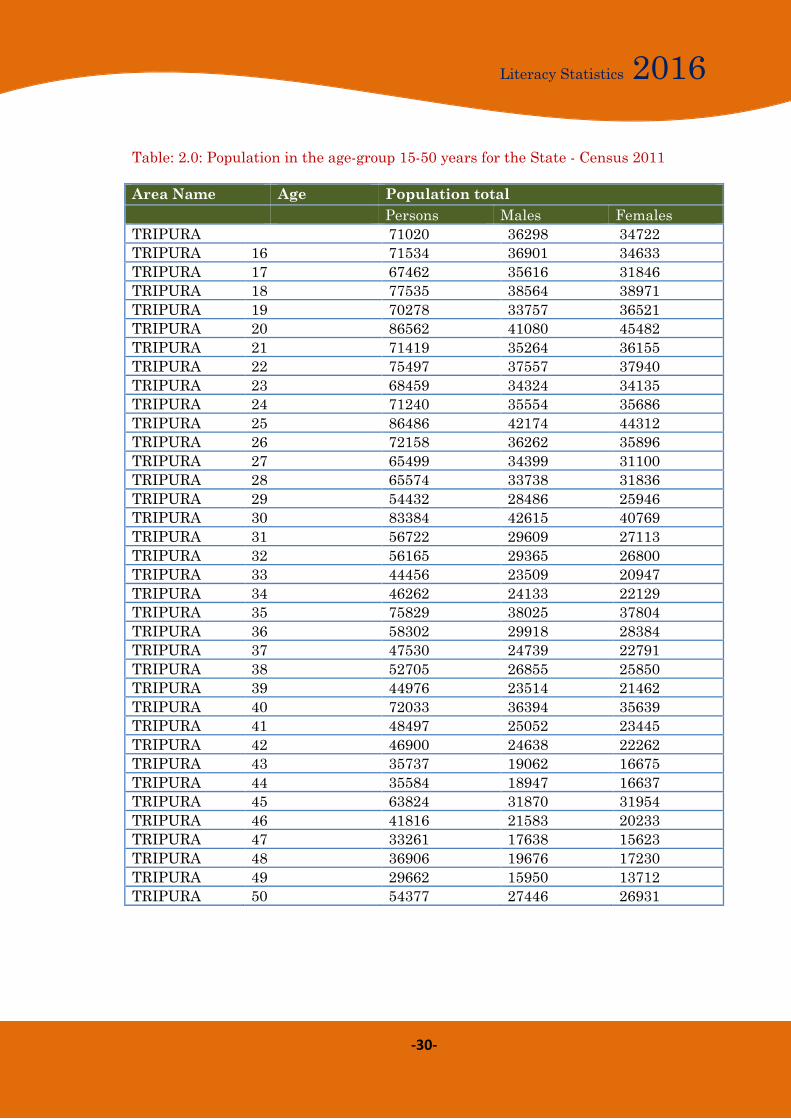
Table: 2.0: Population in the age-group 15-50 years for the State - Census 2011
Area Name Age Population total
Persons Males Females
TRIPURA 15 71020 36298 34722
TRIPURA 16 71534 36901 34633
TRIPURA 17 67462 35616 31846
TRIPURA 18 77535 38564 38971
TRIPURA 19 70278 33757 36521
TRIPURA 20 86562 41080 45482
TRIPURA 21 71419 35264 36155
TRIPURA 22 75497 37557 37940
TRIPURA 23 68459 34324 34135
TRIPURA 24 71240 35554 35686
TRIPURA 25 86486 42174 44312
TRIPURA 26 72158 36262 35896
TRIPURA 27 65499 34399 31100
TRIPURA 28 65574 33738 31836
TRIPURA 29 54432 28486 25946
TRIPURA 30 83384 42615 40769
TRIPURA 31 56722 29609 27113
TRIPURA 32 56165 29365 26800
TRIPURA 33 44456 23509 20947
TRIPURA 34 46262 24133 22129
TRIPURA 35 75829 38025 37804
TRIPURA 36 58302 29918 28384
TRIPURA 37 47530 24739 22791
TRIPURA 38 52705 26855 25850
TRIPURA 39 44976 23514 21462
TRIPURA 40 72033 36394 35639
TRIPURA 41 48497 25052 23445
TRIPURA 42 46900 24638 22262
TRIPURA 43 35737 19062 16675
TRIPURA 44 35584 18947 16637
TRIPURA 45 63824 31870 31954
TRIPURA 46 41816 21583 20233
TRIPURA 47 33261 17638 15623
TRIPURA 48 36906 19676 17230
TRIPURA 49 29662 15950 13712
TRIPURA 50 54377 27446 26931
Literacy Statistics 2016
-31-
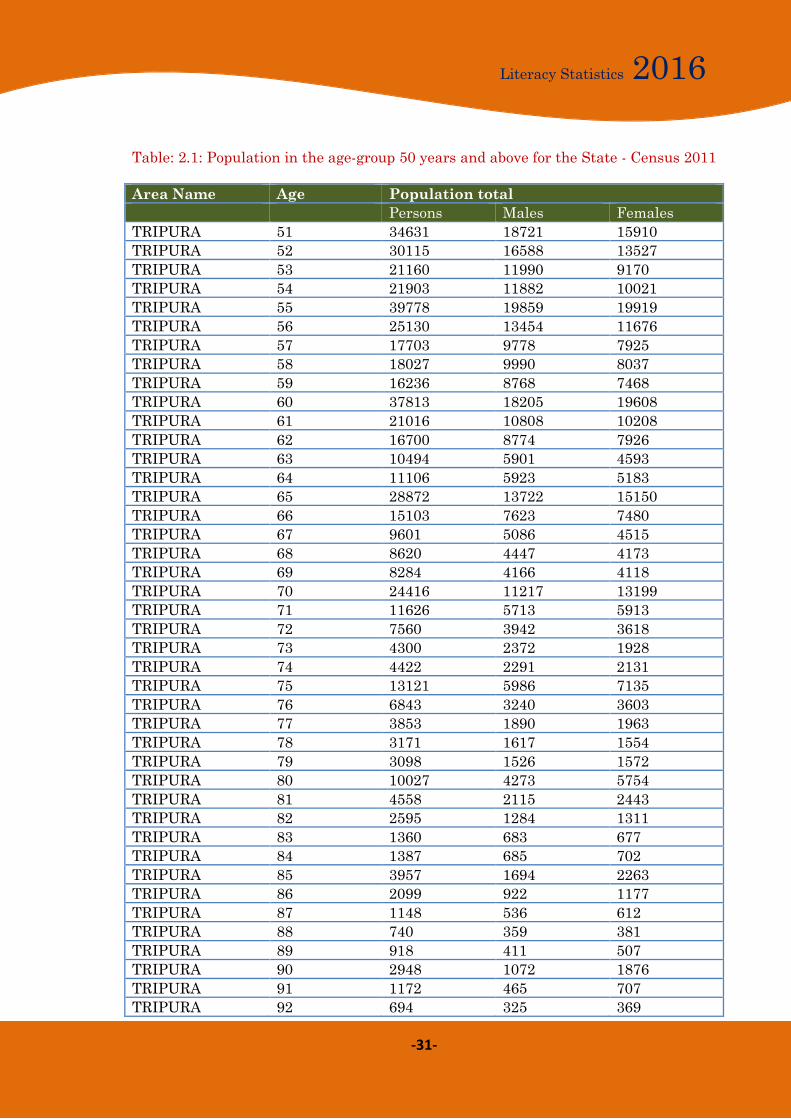
Table: 2.1: Population in the age-group 50 years and above for the State - Census 2011
Area Name Age Population total
Persons Males Females
TRIPURA 51 34631 18721 15910
TRIPURA 52 30115 16588 13527
TRIPURA 53 21160 11990 9170
TRIPURA 54 21903 11882 10021
TRIPURA 55 39778 19859 19919
TRIPURA 56 25130 13454 11676
TRIPURA 57 17703 9778 7925
TRIPURA 58 18027 9990 8037
TRIPURA 59 16236 8768 7468
TRIPURA 60 37813 18205 19608
TRIPURA 61 21016 10808 10208
TRIPURA 62 16700 8774 7926
TRIPURA 63 10494 5901 4593
TRIPURA 64 11106 5923 5183
TRIPURA 65 28872 13722 15150
TRIPURA 66 15103 7623 7480
TRIPURA 67 9601 5086 4515
TRIPURA 68 8620 4447 4173
TRIPURA 69 8284 4166 4118
TRIPURA 70 24416 11217 13199
TRIPURA 71 11626 5713 5913
TRIPURA 72 7560 3942 3618
TRIPURA 73 4300 2372 1928
TRIPURA 74 4422 2291 2131
TRIPURA 75 13121 5986 7135
TRIPURA 76 6843 3240 3603
TRIPURA 77 3853 1890 1963
TRIPURA 78 3171 1617 1554
TRIPURA 79 3098 1526 1572
TRIPURA 80 10027 4273 5754
TRIPURA 81 4558 2115 2443
TRIPURA 82 2595 1284 1311
TRIPURA 83 1360 683 677
TRIPURA 84 1387 685 702
TRIPURA 85 3957 1694 2263
TRIPURA 86 2099 922 1177
TRIPURA 87 1148 536 612
TRIPURA 88 740 359 381
TRIPURA 89 918 411 507
TRIPURA 90 2948 1072 1876
TRIPURA 91 1172 465 707
TRIPURA 92 694 325 369
Literacy Statistics 2016
-32-
TRIPURA 93 391 181 210
TRIPURA 94 503 251 252
TRIPURA 95 1210 515 695
TRIPURA 96 647 318 329
TRIPURA 97 426 210 216
TRIPURA 98 482 236 246
TRIPURA 99 395 156 239
TRIPURA 100+ 1868 780 1088
TRIPURA Age not stated 1616 867 749
Table: 2.2: Population in the age-group 15-50 years for the West District (2011)
Area Name Age Population total
Persons Males Females
WEST 15 32316 16414 15902
WEST 16 33250 17107 16143
WEST 17 31613 16545 15068
WEST 18 36541 18304 18237
WEST 19 33366 16324 17042
WEST 20 40734 19433 21301
WEST 21 33858 16858 17000
WEST 22 35412 17732 17680
WEST 23 32638 16459 16179
WEST 24 33789 16916 16873
WEST 25 41380 20254 21126
WEST 26 34554 17329 17225
WEST 27 31566 16470 15096
WEST 28 31029 15936 15093
WEST 29 26473 13851 12622
WEST 30 40329 20617 19712
WEST 31 28404 14865 13539
WEST 32 27423 14320 13103
WEST 33 21649 11409 10240
WEST 34 22665 11811 10854
WEST 35 36804 18271 18533
WEST 36 28577 14562 14015
WEST 37 23514 12095 11419
WEST 38 25602 13002 12600
WEST 39 22363 11573 10790
WEST 40 35742 17900 17842
WEST 41 24487 12682 11805
WEST 42 23441 12174 11267
WEST 43 17826 9363 8463
WEST 44 17812 9406 8406
WEST 45 31789 15922 15867
WEST 46 21190 10794 10396

Literacy Statistics 2016
-33-
WEST 47 16763 8843 7920
WEST 48 18428 9808 8620
WEST 49 14911 7868 7043
WEST 50 27059 13679 13380
Table: 2.3: Population in the age-group 50 years and above for the West - 2011
Area Name Age Population total
Persons Males Females
WEST 51 17797 9552 8245
WEST 52 15179 8414 6765
WEST 53 10772 6045 4727
WEST 54 11321 6094 5227
WEST 55 19907 9888 10019
WEST 56 12749 6813 5936
WEST 57 9047 5101 3946
WEST 58 9207 5176 4031
WEST 59 8355 4529 3826
WEST 60 18662 9026 9636
WEST 61 10648 5503 5145
WEST 62 8139 4313 3826
WEST 63 5143 2911 2232
WEST 64 5501 2880 2621
WEST 65 13833 6517 7316
WEST 66 7506 3731 3775
WEST 67 4701 2455 2246
WEST 68 4148 2152 1996
WEST 69 4038 2062 1976
WEST 70 12012 5384 6628
WEST 71 5881 2837 3044
WEST 72 3632 1843 1789
WEST 73 2187 1192 995
WEST 74 2235 1147 1088
WEST 75 6630 3017 3613
WEST 76 3561 1657 1904
WEST 77 1899 916 983
WEST 78 1579 815 764
WEST 79 1527 722 805
WEST 80 5011 2097 2914
WEST 81 2285 1044 1241
WEST 82 1300 615 685
WEST 83 661 339 322
WEST 84 715 325 390
WEST 85 1996 848 1148
WEST 86 1115 447 668
WEST 87 557 250 307

Literacy Statistics 2016
-34-
WEST 88 375 180 195
WEST 89 466 203 263
WEST 90 1521 543 978
WEST 91 619 238 381
WEST 92 331 153 178
WEST 93 195 88 107
WEST 94 234 113 121
WEST 95 580 243 337
WEST 96 315 143 172
WEST 97 196 77 119
WEST 98 211 87 124
WEST 99 187 72 115
WEST 100+ 912 365 547
WEST Age not stated 959 518 441
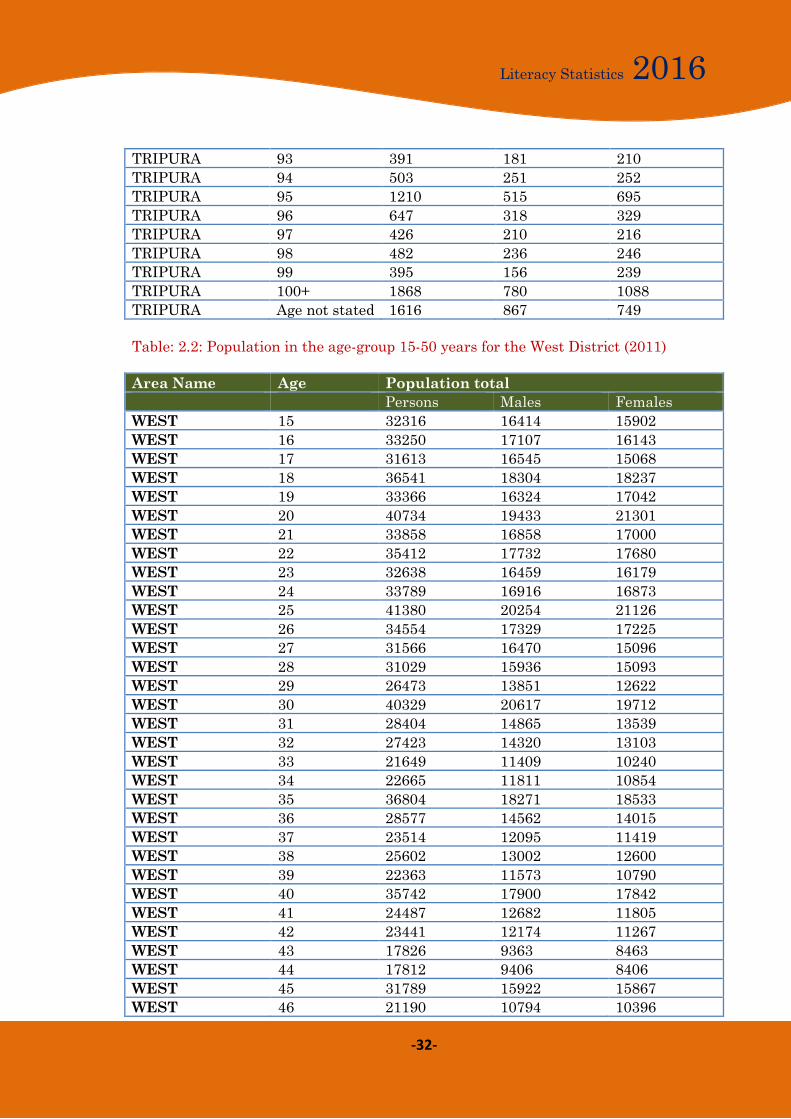
Table: 2.4: Population in the age-group 15-50 years for the South District - 2011
Area Name Age Population total
Persons Males Females
SOUTH 15 17212 8847 8365
SOUTH 16 17227 8953 8274
SOUTH 17 15804 8442 7362
SOUTH 18 17848 8750 9098
SOUTH 19 16692 7878 8814
SOUTH 20 20534 9759 10775
SOUTH 21 16697 8140 8557
SOUTH 22 17650 8750 8900
SOUTH 23 16110 8019 8091
SOUTH 24 16804 8464 8340
SOUTH 25 19968 9808 10160
SOUTH 26 17247 8721 8526
SOUTH 27 15715 8356 7359
SOUTH 28 15679 8094 7585
SOUTH 29 12798 6715 6083
SOUTH 30 19329 9886 9443
SOUTH 31 13135 6910 6225
SOUTH 32 13171 6924 6247
SOUTH 33 10586 5681 4905
SOUTH 34 11026 5830 5196
SOUTH 35 17434 8744 8690
SOUTH 36 14030 7279 6751
SOUTH 37 11200 5953 5247
SOUTH 38 12858 6483 6375
Literacy Statistics 2016
-35-
SOUTH 39 10560 5592 4968
SOUTH 40 16118 8209 7909
SOUTH 41 11027 5687 5340
SOUTH 42 11279 5935 5344
SOUTH 43 8580 4627 3953
SOUTH 44 8374 4480 3894
SOUTH 45 14692 7281 7411
SOUTH 46 9589 4986 4603
SOUTH 47 7953 4226 3727
SOUTH 48 8766 4631 4135
SOUTH 49 6969 3797 3172
SOUTH 50 12146 6123 6023
Table: 2.5: Population in the age-group 50 years and above for the South - 2011
Area Name Age Population total
Persons Males Females
SOUTH 51 7748 4252 3496
SOUTH 52 7424 4043 3381
SOUTH 53 4969 2889 2080
SOUTH 54 4906 2692 2214
SOUTH 55 9135 4551 4584
SOUTH 56 5800 3051 2749
SOUTH 57 4164 2230 1934
SOUTH 58 4306 2343 1963
SOUTH 59 3695 1999 1696
SOUTH 60 8425 4031 4394
SOUTH 61 4713 2414 2299
SOUTH 62 4146 2096 2050
SOUTH 63 2486 1394 1092
SOUTH 64 2580 1399 1181
SOUTH 65 7049 3333 3716
SOUTH 66 3664 1882 1782
SOUTH 67 2380 1235 1145
SOUTH 68 2101 1052 1049
SOUTH 69 1978 941 1037
SOUTH 70 5741 2576 3165
SOUTH 71 2709 1320 1389
SOUTH 72 1981 1028 953
SOUTH 73 949 516 433
SOUTH 74 999 517 482
SOUTH 75 3157 1385 1772
SOUTH 76 1604 733 871
SOUTH 77 1023 478 545

Literacy Statistics 2016
-36-
SOUTH 78 823 393 430
SOUTH 79 749 376 373
SOUTH 80 2327 963 1364
SOUTH 81 1120 523 597
SOUTH 82 665 331 334
SOUTH 83 367 170 197
SOUTH 84 305 156 149
SOUTH 85 957 400 557
SOUTH 86 486 229 257
SOUTH 87 316 141 175
SOUTH 88 174 74 100
SOUTH 89 225 104 121
SOUTH 90 714 243 471
SOUTH 91 307 133 174
SOUTH 92 230 113 117
SOUTH 93 130 70 60
SOUTH 94 133 79 54
SOUTH 95 349 166 183
SOUTH 96 187 104 83
SOUTH 97 138 91 47
SOUTH 98 164 95 69
SOUTH 99 121 59 62
SOUTH 100+ 459 190 269
SOUTH Age not stated 343 169 174
Table: 2.6: Population in the age-group 15-50 years for the Dhalai District - 2011
Area Name Age Population total
Persons Males Females
DHALAI 15 7803 4063 3740
DHALAI 16 7391 3913 3478
DHALAI 17 6946 3636 3310
DHALAI 18 8074 3953 4121
DHALAI 19 7137 3299 3838
DHALAI 20 8655 4012 4643
DHALAI 21 7249 3568 3681
DHALAI 22 7928 3937 3991
DHALAI 23 6867 3439 3428
DHALAI 24 7207 3577 3630
DHALAI 25 8865 4342 4523
DHALAI 26 7303 3705 3598
DHALAI 27 6512 3429 3083
DHALAI 28 6808 3565 3243
DHALAI 29 5686 3066 2620
DHALAI 30 8535 4495 4040
DHALAI 31 5511 2908 2603

Literacy Statistics 2016
-37-
DHALAI 32 5457 2881 2576
DHALAI 33 4211 2254 1957
DHALAI 34 4403 2277 2126
DHALAI 35 7487 3945 3542
DHALAI 36 5574 2906 2668
DHALAI 37 4530 2439 2091
DHALAI 38 5082 2696 2386
DHALAI 39 4338 2315 2023
DHALAI 40 6870 3600 3270
DHALAI 41 4429 2387 2042
DHALAI 42 4172 2288 1884
DHALAI 43 3130 1748 1382
DHALAI 44 3303 1812 1491
DHALAI 45 5935 2983 2952
DHALAI 46 3714 1960 1754
DHALAI 47 2915 1534 1381
DHALAI 48 3343 1814 1529
DHALAI 49 2609 1427 1182
DHALAI 50 4858 2452 2406
Table: 2.7: Population in the age-group 50 years and above for the Dhalai– 2011
Area Name Age Population total
Persons Males Females
DHALAI 51 3124 1664 1460
DHALAI 52 2471 1385 1086
DHALAI 53 1639 935 704
DHALAI 54 1803 974 829
DHALAI 55 3549 1788 1761
DHALAI 56 2160 1157 1003
DHALAI 57 1422 770 652
DHALAI 58 1408 765 643
DHALAI 59 1433 765 668
DHALAI 60 3606 1711 1895
DHALAI 61 2005 1057 948
DHALAI 62 1462 746 716
DHALAI 63 906 496 410
DHALAI 64 1054 561 493
DHALAI 65 2761 1360 1401
DHALAI 66 1389 713 676
DHALAI 67 885 501 384
DHALAI 68 773 400 373
DHALAI 69 792 394 398
DHALAI 70 2241 1091 1150
DHALAI 71 1053 558 495
DHALAI 72 621 348 273

Literacy Statistics 2016
-38-
DHALAI 73 349 206 143
DHALAI 74 399 212 187
DHALAI 75 1152 563 589
DHALAI 76 569 274 295
DHALAI 77 320 159 161
DHALAI 78 243 137 106
DHALAI 79 284 148 136
DHALAI 80 880 405 475
DHALAI 81 412 201 211
DHALAI 82 200 104 96
DHALAI 83 118 72 46
DHALAI 84 133 70 63
DHALAI 85 355 180 175
DHALAI 86 175 93 82
DHALAI 87 116 67 49
DHALAI 88 72 42 30
DHALAI 89 92 45 47
DHALAI 90 275 111 164
DHALAI 91 103 44 59
DHALAI 92 51 21 30
DHALAI 93 21 7 14
DHALAI 94 45 19 26
DHALAI 95 100 40 60
DHALAI 96 59 35 24
DHALAI 97 36 20 16
DHALAI 98 48 21 27
DHALAI 99 35 16 19
DHALAI 100+ 212 107 105
DHALAI Age not stated 127 75 52
Table: 2.8: Population in the age-group 15-50 years for the North District – 2011
Area Name Age Population total
Persons Males Females
NORTH 15 13689 6974 6715
NORTH 16 13666 6928 6738
NORTH 17 13099 6993 6106
NORTH 18 15072 7557 7515
NORTH 19 13083 6256 6827
NORTH 20 16639 7876 8763
NORTH 21 13615 6698 6917
NORTH 22 14507 7138 7369
NORTH 23 12844 6407 6437
NORTH 24 13440 6597 6843

Literacy Statistics 2016
-39-
NORTH 25 16273 7770 8503
NORTH 26 13054 6507 6547
NORTH 27 11706 6144 5562
NORTH 28 12058 6143 5915
NORTH 29 9475 4854 4621
NORTH 30 15191 7617 7574
NORTH 31 9672 4926 4746
NORTH 32 10114 5240 4874
NORTH 33 8010 4165 3845
NORTH 34 8168 4215 3953
NORTH 35 14104 7065 7039
NORTH 36 10121 5171 4950
NORTH 37 8286 4252 4034
NORTH 38 9163 4674 4489
NORTH 39 7715 4034 3681
NORTH 40 13303 6685 6618
NORTH 41 8554 4296 4258
NORTH 42 8008 4241 3767
NORTH 43 6201 3324 2877
NORTH 44 6095 3249 2846
NORTH 45 11408 5684 5724
NORTH 46 7323 3843 3480
NORTH 47 5630 3035 2595
NORTH 48 6369 3423 2946
NORTH 49 5173 2858 2315
NORTH 50 10314 5192 5122
Table: 2.9: Population in the age-group 50 years and above for the North - 2011
Area Name Age Population total
Persons Males Females
NORTH 51 5962 3253 2709
NORTH 52 5041 2746 2295
NORTH 53 3780 2121 1659
NORTH 54 3873 2122 1751
NORTH 55 7187 3632 3555
NORTH 56 4421 2433 1988
NORTH 57 3070 1677 1393
NORTH 58 3106 1706 1400
NORTH 59 2753 1475 1278
NORTH 60 7120 3437 3683
NORTH 61 3650 1834 1816
NORTH 62 2953 1619 1334

Literacy Statistics 2016
-40-
NORTH 63 1959 1100 859
NORTH 64 1971 1083 888
NORTH 65 5229 2512 2717
NORTH 66 2544 1297 1247
NORTH 67 1635 895 740
NORTH 68 1598 843 755
NORTH 69 1476 769 707
NORTH 70 4422 2166 2256
NORTH 71 1983 998 985
NORTH 72 1326 723 603
NORTH 73 815 458 357
NORTH 74 789 415 374
NORTH 75 2182 1021 1161
NORTH 76 1109 576 533
NORTH 77 611 337 274
NORTH 78 526 272 254
NORTH 79 538 280 258
NORTH 80 1809 808 1001
NORTH 81 741 347 394
NORTH 82 430 234 196
NORTH 83 214 102 112
NORTH 84 234 134 100
NORTH 85 649 266 383
NORTH 86 323 153 170
NORTH 87 159 78 81
NORTH 88 119 63 56
NORTH 89 135 59 76
NORTH 90 438 175 263
NORTH 91 143 50 93
NORTH 92 82 38 44
NORTH 93 45 16 29
NORTH 94 91 40 51
NORTH 95 181 66 115
NORTH 96 86 36 50
NORTH 97 56 22 34
NORTH 98 59 33 26
NORTH 99 52 9 43
NORTH 100+ 285 118 167
NORTH Age not stated 187 105 82

Literacy Statistics 2016
-41-
Table: 3.0: Population in the age-group 15-54 years for the State and Districts - 2011
Area Name Age Population total
Persons Males Females
TRIPURA 15-19 357829 181136 176693
TRIPURA 20-24 373177 183779 189398
TRIPURA 25-29 344149 175059 169090
TRIPURA 30-34 286989 149231 137758
TRIPURA 35-39 279342 143051 136291
TRIPURA 40-44 238751 124093 114658
TRIPURA 45-49 205469 106717 98752
TRIPURA 50-54 162186 86627 75559
WEST 15-19 167086 84694 82392
WEST 20-24 176431 87398 89033
WEST 25-29 165002 83840 81162
WEST 30-34 140470 73022 67448
WEST 35-39 136860 69503 67357
WEST 40-44 119308 61525 57783
WEST 45-49 103081 53235 49846
WEST 50-54 82128 43784 38344
SOUTH 15-19 84783 42870 41913
SOUTH 20-24 87795 43132 44663
SOUTH 25-29 81407 41694 39713
SOUTH 30-34 67247 35231 32016
SOUTH 35-39 66082 34051 32031
SOUTH 40-44 55378 28938 26440
SOUTH 45-49 47969 24921 23048
SOUTH 50-54 37193 19999 17194
DHALAI 15-19 37351 18864 18487
DHALAI 20-24 37906 18533 19373
DHALAI 25-29 35174 18107 17067
DHALAI 30-34 28117 14815 13302
DHALAI 35-39 27011 14301 12710
DHALAI 40-44 21904 11835 10069
DHALAI 45-49 18516 9718 8798
DHALAI 50-54 13895 7410 6485
NORTH 15-19 68609 34708 33901
NORTH 20-24 71045 34716 36329
NORTH 25-29 62566 31418 31148
NORTH 30-34 51155 26163 24992
NORTH 35-39 49389 25196 24193
NORTH 40-44 42161 21795 20366
NORTH 45-49 35903 18843 17060
NORTH 50-54 28970 15434 13536

Literacy Statistics 2016
-42-
Table: 3.1: Targeted beneficiary in the age-group of 15 years and above for the State
and Districts under State sponsored Special Adult Literacy Programme (SALP)
Area Name Age-group PHASE-1 (2009-12) PHASE-2 (2012-14)
Persons Male Femal
e
Person Male Female
NORTH 15-50 YRS 9108 1526 7582 2712 254 2458
50 YRS AND
ABOVE
4580 926 3654 3672 1125 2547
15 YRS AND
ABOVE
13688 2452 11236 6384 1379 5005
UNAKOTI 15-50 YRS 3847 1258 2589
50 YRS AND
ABOVE
3839 852 2987
15 YRS AND
ABOVE
7686 2110 5576
DHALAI 15-50 YRS 13956 3698 10258 23134 8547 14587
50 YRS AND
ABOVE
7876 3587 4289 12115 3258 8857
15 YRS AND
ABOVE
21832 7285 14547 35249 11805 23444
KHOWAI 15-50 YRS 7463 1589 5874
50 YRS AND
ABOVE
3483 896 2587
15 YRS AND
ABOVE
10946 2485 8461
WEST 15-50 YRS 20157 3258 16899 12373 4521 7852
50 YRS AND
ABOVE
13627 2369 11258 14110 4258 9852
15 YRS AND
ABOVE
33784 5627 28157 26483 8779 17704
SEPAHIJA
LA
15-50 YRS 12465 4569 7896
50 YRS AND
ABOVE
12861 5874 6987
15 YRS AND
ABOVE
25326 10443 14883
GOMATI 15-50 YRS 4799 1258 3541
50 YRS AND
ABOVE
2150 254 1896
15 YRS AND
ABOVE
6949 1512 5437
SOUTH 15-50 YRS 3532 985 2547 6666 2541 4125
50 YRS AND
ABOVE
1489 231 1258 7113 1896 5217
15 YRS AND 5021 1216 3805 13779 4437 9342

Literacy Statistics 2016
-43-
ABOVE
TRIPURA 15-50 YRS 46753 9467 37286 73459 24537 48922
50 YRS AND
ABOVE
27572 7113 20459 59343 18413 40930
15 YRS AND
ABOVE
74325 16580 57745 132802 42950 89852
Table: 3.2: Successful beneficiary in the age-group of 15 years and above for the State
and Districts under State sponsored Special Adult Literacy Programme (SALP)
Area Name Age-group PHASE-1 (2009-12) PHASE-2 (2012-14)
Person Male Femal
e
Person Male Femal
e
NORTH 15-50 YRS 8078 1489 6589 2661 251 2410
50 YRS AND
ABOVE
3966 841 3125 3509 1020 2489
15 YRS AND
ABOVE
12044 2330 9714 6170 1271 4899
UNAKOTI 15-50 YRS 3695 1126 2569
50 YRS AND
ABOVE
3793 841 2952
15 YRS AND
ABOVE
7488 1967 5521
DHALAI 15-50 YRS 12221 2369 9852 22557 8321 14236
50 YRS AND
ABOVE
6439 2587 3852 11908 3156 8752
15 YRS AND
ABOVE
18660 4956 13704 34465 11477 22988
KHOWAI 15-50 YRS 7219 1496 5723
50 YRS AND
ABOVE
3344 893 2451
15 YRS AND
ABOVE
10563 2389 8174
WEST 15-50 YRS 18597 2856 15741 12373 4521 7852
50 YRS AND
ABOVE
12154 1896 10258 14110 4258 9852
15 YRS AND
ABOVE
30751 4752 25999 26483 8779 17704
SEPAHIJAL
A
15-50 YRS 12465 4569 7896
50 YRS AND
ABOVE
12861 5874 6987
15 YRS AND
ABOVE
25326 10443 14883
GOMATI 15-50 YRS 4799 1258 3541
50 YRS AND 2150 254 1896

Literacy Statistics 2016
-44-
ABOVE
15 YRS AND
ABOVE
6949 1512 5437
SOUTH 15-50 YRS 3001 856 2145 6666 2541 4125
50 YRS AND
ABOVE
1331 229 1102 7113 1896 5217
15 YRS AND
ABOVE
4332 1085 3247 13779 4437 9342
TRIPURA 15-50 YRS 41897 7570 34327 72435 24083 48352
50 YRS AND
ABOVE
23890 5553 18337 58788 18192 40596
15 YRS AND
ABOVE
65787 13123 52664 131223 42275 88948
Table:3.3: Children enrolled in Class-II during 2011-2014 in different schools in the
State and Districts
AREA CLASS-II
BOYS GIRLS TOTAL
WEST 22888 23537 46425
SOUTH 13146 13352 26498
DHALAI 17351 15369 32720
NORTH 14909 13237 28146
SEPAHIJALA 15634 14808 30442
KHOWAI 9430 8307 17737
GOMATI 13356 13190 26546
UNAKOTI 10980 10084 21064
TRIPURA 117694 111884 229578
Table: 3.4: Children enrolled in Class-II during 2011-2012 in different schools in the
State and Districts
AREA CLASS-II
BOYS GIRLS TOTAL
WEST 7123 6987 14110
SOUTH 4236 4120 8356
DHALAI 5966 4456 10422
NORTH 5241 4101 9342
SEPAHIJALA 4963 4236 9199
KHOWAI 2855 2130 4985
GOMATI 4201 3965 8166
UNAKOTI 3698 2987 6685
TRIPURA 38283 32982 71265

Literacy Statistics 2016
-45-
Table:3.5 : Children enrolled in Class-II during 2012-2013 in different schools in the
State and Districts
AREA CLASS-II
BOYS GIRLS TOTAL
WEST 7963 8369 16332
SOUTH 4463 4695 9158
DHALAI 5987 5325 11312
NORTH 4896 4369 9265
SEPAHIJALA 5569 5123 10692
KHOWAI 3698 3159 6857
GOMATI 4789 4566 9355
UNAKOTI 3987 3698 7685
TRIPURA 41352 39304 80656
Table: 3.6: Children enrolled in Class-II during 2013-2014 in different schools in the
State and Districts
AREA CLASS-II
BOYS GIRLS TOTAL
WEST 7802 8181 15983
SOUTH 4447 4537 8984
DHALAI 5398 5588 10986
NORTH 4772 4767 9539
SEPAHIJALA 5102 5449 10551
KHOWAI 2877 3018 5895
GOMATI 4366 4659 9025
UNAKOTI 3295 3399 6694
TRIPURA 38059 39598 77657
Table: 3.7: Demographic, Socio-economic and Health profile of Tripura State as
compared to India figure
Indicator
Tripura India
Total Population (In crore) (Census 2011) 0.37 121.01
Decadal Growth (%) (Census 2011) 14.75 17.64
Crude Birth Rate (SRS 2011) 14.3 21.8
Crude Death Rate (SRS 2011) 5.0 7.1
Natural Growth Rate (SRS 2011) 9.4 14.7
Infant Mortality Rate (SRS 2011) 29 44
Maternal Mortality Rate (SRS 2007-09) NA 212
Total Fertility Rate (SRS 2011) NA 2.4
Sex Ratio (Census 2011) 961 940
Child Sex Ratio (Census 2011) 953 914
Schedule Caste population (in crore) (Census 2001) 0.056 16.6

Literacy Statistics 2016
-46-
Schedule Tribe population (in crore) (Census 2001) 0.099 8.4
Total Literacy Rate (%) (Census 2011) 87.75 74.04
Male Literacy Rate (%) (Census 2011) 92.18 82.14
Female Literacy Rate (%) (Census 2011) 83.15 65.46
Table: 3.8: Scheduled Caster and Tribes Literacy Rate – Census 2011
State/
Union Territory
Literacy rate State/
Union Territory
Literacy rate
Top 5 Bottom 5
Scheduled Castes
Daman & Diu 92.6 Bihar 48.6
Mizoram 92.4 Jharkhand 55.9
Tripura 89.4 Rajasthan 59.7
D & N Haveli 89.4 Uttar Pradesh 60.9
Kerala 88.7 Andhra Pradesh 62.3
Scheduled Tribes
Lakshadweep 91.7 Andhra Pradesh 49.2
Mizoram 91.5 Jammu & Kashmir 50.6
Nagaland 80.0 Madhya Pradesh 50.6
Sikkim 79.7 Bihar 51.1
Tripura 79.1 Odisha 52.2
Table: 3.9: States / UTs ranked by Literacy Rate – Census 2011
State /
Union Territory
Literacy rate State /
Union Territory
Literacy rate
Top 5 Bottom 5
Kerala 94.0 Bihar 61.8
Lakshadweep 91.8 Arunachal Pradesh 65.4
Mizoram 91.3 Rajasthan 66.1
Goa 88.7 Jharkhand 66.4
Tripura 87.2 Andhra Pradesh 67.0
Table: 4.0 : Population in the age group of 7+ and above by Sex as on August 2016
District
TRU Population Male Female
Dhalai Total 3,87,158 1,93,512 1,93,646
Rural 3,66,173 1,82,993 1,83,180
Urban 20,985 10,519 10,466
Gomati Total 4,31,058 2,17,913 2,13,145
Rural 3,83,003 1,93,216 1,89,787

Literacy Statistics 2016
-47-
Urban 48,055 24,697 23,358
Khowai Total 3,49,290 1,75,088 1,74,202
Rural 3,12,639 1,56,530 1,56,109
Urban 36,651 18,558 18,093
North Total 4,03,113 2,03,363 1,99,750
Rural 3,53,562 1,78,707 1,74,855
Urban 49,551 24,656 24,895
Sepahijala Total 4,91,405 2,48,080 2,43,325
Rural 4,42,694 2,23,188 2,19,506
Urban 48,711 24,892 23,819
South Total 4,10,802 2,08,775 2,02,027
Rural 3,71,316 1,88,748 1,82,568
Urban 39,486 20,027 19,459
Unakoti Total 2,71,556 1,36,396 1,35,160
Rural 2,39,684 1,20,773 1,18,911
Urban 31,872 15,623 16,249
West Total 9,69,240 4,87,365 4,81,875
Rural 4,67,616 2,35,880 2,31,736
Urban 5,01,624 2,51,485 2,50,139
Tripura Total 37,13,622 18,70,492 18,43,130
Rural 29,36,687 14,80,035 14,56,652
Urban 7,76,935 3,90,457 3,86,478
Table: 4.1: Literate Population in the age group of 7+ and above by Sex as on August
2016
District
TRU Population Male Female
Dhalai Total 3,71,823 1,86,086 1,85,737
Rural 3,51,561 1,75,883 1,75,678
Urban 20,262 10,203 10,059
Gomati Total 4,17,380 2,11,541 2,05,839
Rural 3,70,070 1,87,216 1,82,854
Urban 47,310 24,325 22,985
Khowai Total 3,41,392 1,71,196 1,70,196
Rural 3,05,643 1,53,098 1,52,545
Urban 35,749 18,098 17,651
North Total 3,94,103 1,99,219 1,94,884
Rural 3,45,001 1,74,722 1,70,279

Literacy Statistics 2016
-48-
Urban 49,102 24,497 24,605
Sepahijala Total 4,80,407 2,44,518 2,35,889
Rural 4,32,685 2,20,007 2,12,678
Urban 47,722 24,511 23,211
South Total 3,94,267 2,00,859 1,93,408
Rural 3,55,452 1,81,007 1,74,445
Urban 38,815 19,852 18,963
Unakoti Total 2,68,775 1,34,514 1,34,261
Rural 2,37,266 1,19,102 1,18,164
Urban 31,509 15,412 16,097
West Total 9,42,367 4,74,235 4,68,132
Rural 4,60,822 2,32,708 2,28,114
Urban 4,81,545 2,41,527 2,40,018
Tripura Total 36,10,514 18,22,168 17,88,346
Rural 28,58,500 14,43,743 14,14,757
Urban 7,52,014 3,78,425 3,73,589
Table:4.2 : Schedule Caste and Schedule Tribe Population in the age group of 0-6
years as on August 2016
District
Total Population SC Population ST Population
DHALAI 54742 8537 36231
RURAL 51806 7657 36039
URBAN 2936 880 192
GOMATI 61198 12604 27487
RURAL 58606 11684 26961
URBAN 2592 920 526
KHOWAI 41472 9561 21067
RURAL 37916 8845 20977
URBAN 3556 716 90
NORTH 55343 10227 16733
RURAL 52729 9474 16720
URBAN 2614 753 13
SEPAHIJALA 61607 12527 15005
RURAL 56963 10473 14988
URBAN 4644 2054 17
SOUTH 53455 9503 22708
RURAL 51001 8905 22527
URBAN 2454 598 181
UNAKOTI 35295 8451 8586

Literacy Statistics 2016
-49-
RURAL 33743 7904 8556
URBAN 1552 547 30
WEST 105891 30149 17600
RURAL 47509 12339 15387
URBAN 58382 17810 2213
Grand Total 469003 101559 165417
Table: 4.3: Population in the age group of 0-6 years by sex as on August 2016
RURAL URBAN Total
Male
Total
Female
District Male Female Male Female
DHALAI 26033 25773 1481 1455 27514 27228
GOMATI 29643 28963 1317 1275 30960 30238
KHOWAI 18894 19022 1811 1745 20705 20767
NORTH 26680 26049 1286 1328 27966 27377
SEPAHIJALA 28774 28189 2471 2173 31245 30362
SOUTH 25965 25036 1223 1231 27188 26267
UNAKOTI 16959 16784 741 811 17700 17595
WEST 24224 23285 29927 28455 54151 51740
Grand Total 197172 193101 40257 38473 237429 231574

Literacy Statistics 2016
-50-
Government of Tripura
State Literacy Mission Authority Education (School) Department