Embed Size (px)
Citation preview

Journal of Geography and Regional Planning Vol. 4(6), pp. 305-325, June 2011 Available online at http://www.academicjournals.org/JGRP ISSN 2070-1845 ©2011 Academic Journals
Review
Literacy and work participation among Muslims in Uttar Pradesh
Farasat Ali Siddiqui, Nazmul Hussain* and Akram Hannan
Department of Geography, Aligarh Muslim University, Aligarh-202002, India.
Accepted 10 February, 2011
India is a multi-ethnic, multi-cultural and multi-linguistic country; people belonging to many religious faiths live side by side. Muslims are the largest minority of the country. This paper attempts to present a demographic and socio-economic profile of the Muslims in Uttar Pradesh by focusing on the district wise distributional variation of Muslim concentration, their literacy, work participation rate and broad occupational groups. It is based on secondary data obtained from religion data, 2001 census. For understanding of current situations in the state, a cross-comparison of population in distribution, of literacy and employment have been made. The rate of urbanization is 37% among Muslims of Uttar Pradesh, which is 2% points more than that of national Muslims average. The position of Muslims in the state both in terms of education and employment has also been dissatisfactory, where male literacy rate is 58% and female literacy rate 41%, whereas the WPR (work participation rate) 41 and 12% to male and female respectively, an overwhelming majority of women working in the marginal. Comparison of existing inequalities by religion operates within the large matrix of structural inequalities such as among regional difference. The paper proves that the increase in inequalities aid the increase in backwardness; which have a disproportionate impact on women as well as in the cumulative development of the state in particular and nation in general. Key words: Literacy rate, Muslims, occupational structure, regional analysis, Uttar Pradesh, work participation.
INTRODUCTION Since the historic past, India has been incredible, being a home of multi-religious people. People belonging to many religious faiths live side by side. The invaders came with distinct race, religion, culture and language and left their imprints on the country. Today our country is the living epitome of social unity in cultural, racial, religious and linguistic diversity. India is culturally enriched, accom-modating multi-religious and multi cultural people, leading to the link of unique character. India is a plural society. People belonging to many religions like Hinduism, Islam, Buddhism, Jainism, Sikhism and Christianity live in this country since time immemorial. But religious communities show inequality consequent upon diverse socio-cultural and economic status which causes human group disparities. Muslims are one of them who constitute the largest minority of the country (India) and one of the
*Corresponding author. E-mail: [email protected]. Tel: +91-9410060741.
largest Muslim communities in the world (Abedi, 2011). The Muslims occupy an important position in Indian society and civilization. Indeed India has the second largest Muslim population in the world after Indonesia. According to Census of India 2001, total population of India is 1029 millions out of which 138 millions (14%) are Muslims. This makes them not only the second largest religious group after the Hindus and the first major (principal) minority in the whole country. Muslims are geographically scattered all over India, and it is only in the state of Jammu and Kashmir and in Lakshadweep that they constitute a majority but also highly noticeable in the entire length and breath of the country. The majority of Indian Muslims are ethnically Indian since they are the descendants of Indians of indigenous origin who were converted to Islam centuries ago.
As considerable evidence exists, a process of margi-nalisation of minority communities exists in almost all societies and there is nothing warrants that the same is not true of Muslims in India to a greater or a lesser degree (Ahmad, 2007). Muslims have negligible influence

306 J. Geogr. Reg. Plann. on the process of economic development (Beg, 1989). There is widely held belief that Muslims have remained largely unaffected by the process of economic develop-ment and social change that have been taking place in the country and their general economic condition has been deteriorating progressively (Ahmad, 1975).
In this
regard Hunter (1969) wrote, “…earlier it was impossible for a well born Musalman to become poor; at present it is almost impossible for him to continue rich”.
In post-independent India, significant minority community especially Muslim has been reduced to the lowest socio-economic stratum. They (all minorities) have lagged behind the SCs in many walks of life. It has been observed that Muslims have been experiencing higher population growth rates than the Hindus, the majority in India, and this is sometimes made into a political issue. Demographers have observed that the higher growth rate among Muslims is mainly due to their higher fertility rate that can, to some extent, be associated with their lower socio-economic status. The available data on the socio-economic profile of Muslims reveal that, Muslims in India have remained socially and economically backward (Ramesh, 2010).
They have further tried to explain this in terms of the time lag and delayed changes in proximate variables between different religious groups in undergoing demographic transition. They are educationally most backward, economically poor and politically a powerless community of the country. Marginalized status of Indian Muslims is not merely confirmed by individual researchers and surveys of voluntary organizations but also by Committees of Government from time to time. The High Power Panel under the chairmanship of Dr. Gopal Singh, set up by the Ministry of Home Affairs in the early 1980 to enquire into the conditions of religious minorities, SCs and STs found that at the national level, Muslims and Neo-Buddhists are the most educationally backward communities (GOI, 1983). The panel also found that their economic condition was poorer than that of SC’s and ST’s. They were deprived of benefits of developmental schemes which government launched for ameliorating conditions of poor and marginalized sections of the society. They were under-represented in government services and decision-making bodies (Zakariya, 1995). No improvement in the living conditions of Muslims has taken place in the last 23 years. This is evident from the findings of the Prime Minister’s High Level Committee under the chairmanship of Justice Rajinder Sachar, constituted to enquire into socio-economic and educational status of Muslims on 2005. Report of the Committee unambiguously states, ‘’our analysis shows that while there is considerable variation in the conditions of Muslims across the states, the com-munity exhibits deficits and deprivation in practically all dimensions of development. In fact, by and large, Muslims rank somewhat above SCs/STs but below Hindu-OBCs, other minorities and Hindu-general (mostly
upper castes) in almost all indicators considered. Among the states that have large Muslim populations, the situation is particularly grave in the states of West Bengal, Bihar, Uttar Pradesh and Assam’” (GOI, 2006). However; there appears a substantial difference in the socio-economic and political representation of major religious communities in India. Among all the religious communities, Muslims are the most socio-economically underdeveloped and politically under-representative community in Indian society. It has been noted by several scholars that the underprivileged sections of this numerically significant minority group has not received social and political support from the state, if their position is compared with their counter part in the Hindu community (Dasgupta, 2009) Abedi (2011) stated that Indian Muslims are not granted the same constitutional safeguards as the SC and ST and they are not entitled to reservation in education or employment.
Despite their large numbers India's Muslim community on the whole being economically and educationally marginalized and it is a widely accepted fact. In many part of the country the Muslim community continues to lag behinds than that of others in socio-economic and educational development. The situation is more serious in regards to education and employment and type of occupations. This paper presents a demographic and socio-economic profile of the Muslims of Uttar Pradesh, who form the largest minority in the state. This paper attempts to explain the current demographic situation of Muslims of the state which include literacy and work participation profile of the Muslims in Uttar Pradesh. Hence their district-wise, literacy rate and workers are analysed. The hypothesis, literacy is inversely proportionate to employment and especially non primary occupation of the population and they are the cause and effect to each other, is quantitatively proved. Therefore, this paper shall try to analyze the literacy condition and occupational situation of Muslims of Uttar Pradesh in particular.
The state of Uttar Pradesh has been chosen as the study area for the present study. The state of Uttar Pradesh is socio-culturally and economically one of the lagging behind states of India. It lies between 23°52' to 31°28' North latitudes and 77°04' to 84°38' East longitudes (Figure 1A). It covers 2,40,928 km
2 of area
and contains 166197921 populations, wherein Muslims are 30,740,158 (18.5% of the total state’s population constitute about one-fourth of the population of Indian Muslims or 22% of total population of Indian Muslims and Hindus are 133979263 (80.61%). The other religious groups in the state are Christians (0.13%), Sikhs (0.41%), Buddhists (0.18%) and Jains (0.12%). The states records 56.27% of literacy rate, 32.48% work participation rate and 20.78% of urban population (Census of India, 2001).
Socio-economic differentials in India at the level of religious aggregation are simplistic and not advisable. However, academic research has to reflect the socio-

Siddiqui et al 307
A A
Figure 1A. Administrative Division of Uttar Pradesh.
economic and cultural realities of its age. The present analysis is based on the secondary sources of data, basically collected from Census of India, 2001
supplemented with information collected from District Statistical Handbook, obtained secondary data has been analyzed both qualitatively and quantitatively, since it is

308 J. Geogr. Reg. Plann. the latest census (2001) in which information relative to religion is available. Census 2001, for the first time in post-independent India provides religion-wise data about sex-ratio, literacy level and workers. Yet data available from different sample surveys conducted in different parts of the country reveal that the Muslims have been left out of the developmental process. In the present analysis, district has been considered as the smallest unit of study. The demographic aspects, that is, population distribution, literacy rate, workers and occupational structure of Muslim in different districts of Uttar Pradesh have been studied in detail. Simple percentage and some suitable standard statistical technique have also been used to test the hypothesis that literacy and employment is inversely related to each other. For the graphical presentation, thematic mapping technique based on GIS Arc View (Version3.2) has also been used to regionalize variation which helps to understand the regional pattern of the aspects. RESULTS AND ANALYSIS The Indian economy has made remarkable progress in the last 60 years. Yet, for various reasons, Muslims in India have been unable to enjoy the fruits of development and so they continue to belong to the weaker sections of society. As a result of the ongoing trends of globalization and liberalization, the economic conditions of Muslims are expected to worsen since only highly competitive and skilled individuals and industries are expected to survive in such an economy. Therefore, there is an urgent need for the socio-economic upliftment of Indian Muslims. But it is reported that there is dearth of data on Indian Muslims. Unfortunately, however, the leading data collection agencies in the country, namely, the Registrar General’s Office and the National Sample Survey, do not provide data by religion on grounds of political considerations though the data is available with them.
But, recently, census of India 2001 for the first time in post-independent India has come out with religion-wise data on few socio-economic indicators like, sex-ratio, literacy level and workers. Hence, we limit our study to demographic, urban population, sex ratio, literacy rate, educational attainment, work participation rate and political representation of the community. A brief review of each selected indicator is given in the work. The method of classifying the five categories of very high, high, medium, low and very low invariably has been that maximum and minimum values.
Muslims constitute 18% of the total population of Uttar Pradesh (U.P.) according to Census 2001. With regards to the geographical distribution of Muslim population in the state, it is found they are distributed across all the districts of the state. It varies from 2.97% in Lalitpur to 49.14% in Rampur. The district wise percentage of Muslim population presented in the Appendix 1 and
Figure 1B shows five grades of districts according to percentage of Muslim population. It is evident from the Figure 1B that in category of very high (Above 39.90%) of Muslim population is found in only three districts. They are Rampur, Moradabad and Bijnor. Concentration of Muslims in these districts may be significant for their socio-economic and educational development as well as for political action if sincere efforts are made, whereas the high level of Muslim population concentration (30.66 to 39.90%) is found in the 7 districts. They are Jyotiba Phule Nagar, Saharanpur, Muzaffarnagar, Balrampur, Bahraich, Bareilly and Meerut. Medium level of Muslim concentration (21.42 to 30.66%) observed again in 7 districts. They are Siddharthnagar, Shrawasti, Baghpat, Sant Kabir Nagar, Ghaziabad, Pilibhit and Barabanki. In the category of low level of Muslim population concentration (12.18 to 21.41%) is found in the 27 districts. It is evident from the same figure that in category of very low (below 12.18%) 18 districts is fall. Most of the districts of this group are of southern parts of the state. Overall the distributional pattern of the Muslim in U.P. shows that Muslim concentrated districts are located in the northern edge of the state boundary and southern districts have low concentration of Muslim population. LITERACY RATE Literacy is one of the basic determinants of socio-economic development attained by a human group. Literacy and education are like oxygen for human beings in contemporary technology driven world and knowledge economy. Higher level of literacy brings social change, cultural advancement and economic development. Despite the commitment in the constitution, number of children dropping out of school is alarmingly large. India has registered phenomenal growth in the sphere of education since independence. But the benefits of educational development have not percolated down to the poorest of the poor. Growing inter-group educational disparity is one of the challenging problems. Under-served and marginalized groups are far behind others in literacy and education. Two of the religious groups of the country, that is, Muslims and Neo-Buddhists are found most educationally backward at national level by a high powered panel headed by Dr. Gopal Singh, appointed by Ministry of Home Affairs, Government of India, in the beginning of 1980 to look into the conditions of the minorities, schedule castes and schedule tribes. Educational conditions of Muslims has not improved till date despite the government’s policy of Area Intensive and Madarsa Modernization programme, launched in 1992, for their educational uplift in the wake of findings of Dr. Gopal Singh Committee. After 18 years Muslims are still found to be the most educationally backward community of the country by the Prime Minister’s High

Siddiqui et al 309
B
B
Figure 1B. Distribution of Muslim Population in Uttar Pradesh.
Source: Census of India, 2001. Level Committee which shows, “that Muslims are at a double disadvantage with low levels of education combined with low quality education; their deprivation increases manifold as the level of education rises. In some instances, the relative share for Muslims is lower
than even the SCs who are victims of a long standing caste system. Such relative deprivation calls for a significant policy shift, in the recognition of the problem and in devising corrective measures, as well as in the allocation of resources” (GOI, 2006). In India 65% of

310 J. Geogr. Reg. Plann.
Table 1. Religion wise gender differentials in literacy rate in Uttar Pradesh 2001 (%).
Religion Total Male Female Gender gap
Uttar Pradesh 56.27 68.82 42.22 26.60
Hindu 57.98 71.24 43.08 28.16
Muslim 47.79 57.29 37.38 19.91
Christian 72.85 78.14 67.36 10.78
Sikhs 71.91 72.19 52.61 19.58
Buddhist 56.21 70.34 40.29 30.05
Jains 93.21 95.90 90.29 5.61
Mean 66.66 74.18 55.17
SD 16.20 12.65 20.36
CV 24.30 17.05 36.91
Data source: Census of India 2001.
India’s population is literate. Literacy levels are expectedly higher for males than for females, that is, 75 against 53%. Literacy is also higher in urban areas (79%) than in rural areas (58%). This gap of about 21% points between rural-urban areas and across gender has been a persistent feature of Indian society over the last two decades despite the increase in literacy levels during this period. The low literacy level of Muslims and SCs/STs is well documented. According to the Census of India 2001, district-wise literacy level of Muslims in UP and compared their literacy level with that of Hindus. With 56.26% literacy level, U.P. is far behind national literacy level, that is, 65.38%. Gender gap in literacy is quite significant. About 69% males and 39% females are literate. Thus there is a gap of 30% points in literacy level of males and females which is again higher than the gap that exists at national level, that is, of 22% points. There is a disparity in literacy level by religious communities. Literacy level of three religious communities is not only more than the state’s average but also of national average literacy level. Highest literacy level is found among Jains (93.20%); while Christians and Sikhs with their literacy level 72.48 and 71.95%, respectively occupy second and third highest position among six religious communities. Both Hindus and Buddhists have 57% literacy level; equal to that of state average. Condition of Muslims is worse than that of five religious communities of the state. Only 48% of them are literate. Fifty seven percentage males and 37% females are literate among them. In other words, Muslims are most illiterate religious community in the state of U.P.
The disparity in literacy has been registered across the religious communities in UP (Table 1). As mention earlier education is an area of grave concern for the Muslim community. Among six selected religious communities (that is, Hindu, Muslim, Christian, Sikh, Buddhist and Jain), Muslim have recorded least literacy rate, that is, 47.79% while Janis with 93.21% stood at top position in 2001. Within Muslim community, only 37.38% female
literacy rate is very much less than 57.29% male literacy rate. The female literacy rate is very much lower than male literacy rate across all the religious groups. It is observed that in the state across the religious communities is highly inconsistent accounting for 36.91% coefficient of variation (CV) against the male 17.05%. It may be ascertained from the aforementioned analysis that females have fewer propensity of education than males. Beside the gender gap, a higher variation in literacy rate is observed among the religious communities which are more pronounced in the study area (Table 1).
Literacy level of Muslims differs from one district to another. The percentage of female literates by district varies between 26.05% in Shrawasti to 70.54 per cent in Mau. Figure 2A show Muslims literacy, 12 districts fall in very high (Above 61.64%) namely Mau, Ghazipur, Azamgarh, Jhansi, Ballia, Lalitpur, Chitrakoot, Kanpur Nagar, Ambedkar Nagar, Allahabad, Mahoba and Hamirpur. The districts of high level (52.75 to 61.64%) of Muslim literacy rate are observed in 21 districts. There are 23 districts in the medium level Muslim literacy. The low level (34.94 to 43.84%) of Muslim literacy rate is observed in the districts of Jyotiba Phule Nagar, Kheri, Barabanki, Etah, Shahjahanpur, Pilibhit, Mathura, Gonda, Bareilly, Moradabad and Budaun. There are only four district of very low level of Muslim literacy rate namely Balrampur, Rampur, Bahraich and Shrawasti. Appendix-I shows that 7 districts have higher literacy level than average state literacy level, the districts are, Mau (70%), Azamgarh (68%), Ghazipur (68%), Chitrakoot (66%), Jhansi (66%), Ballia (66%) and Lalitpur (66%). Thus, it shows that the higher the concentration of Muslim population, the lower their literacy level. Same pheno-menon has been observed by Ahmad (1981) who has analyzed literacy figures. He says that, “an interesting feature of the data is that literacy rates are particularly low in districts with a high concentration of Muslim population”.
Hindus and Muslims are two main religious com-munities, which constitute almost 98% population of the state. Therefore, comparisons of literacy level of Muslims with Hindus in all districts of the state have been made. An attempt has been made to clusters the districts on the basis of 5% point difference of literacy level among these two religious communities. Comparative figures of literacy level among Hindus and Muslims in different clusters of the districts are presented in the Table 2. The table shows that in 48 districts of the state literacy rate of Muslims is less than that of Hindus. There is a difference of below 5% points in 12 districts, while the difference of 5
to 10% points exists in 8 districts and above 10% points, 28 districts. In another 8 districts, Hindus and Muslims have equal literacy rates. In the remaining 22 districts of the state, Muslims have higher literacy level than that of Hindus. Of these 22 districts, 5 districts have a difference of below 5% points, while 6 districts have difference of 5 to 10% points and 11 districts as such where the

Siddiqui et al 311
A
Figure 2A. Distribution of Muslim Literacy Rate in Uttar Pradesh.
Table 2. Clusters of districts according to literacy level of Muslims in comparison with Hindus.
Data source: Uttar Pradesh, Census of India 2001, “Report on Religion Data”, Series 10, 2005.
Grade Difference No. of districts Name of the districts
Higher
Below 5 12 Sant Ravidas Nagar Bhadohi, Mahrajganj, Mirzapur, Fatehpur, Kushinagar, Basti, Chandauli, Sultanpur, Budaun, Bahraich, Rae Bareli, Sitapur
5 - 10 8 Unnao, Gonda, Kheri, Barabanki, Hardoi, Lucknow, Jyotiba Phule Nagar, Rampur
Above 10 28
Shrawasti, Shahjahanpur, Jalaun, kanpur Nagar Kanpur Dehat, Auraiya, Pilibhit, Agra, Etawah, Bijnor, Varanasi, Farrukhabad, Moradabad, Aligarh, Bareilly, Etah, Mainpuri, Kannauj, Bulandshahar, Firozabad, Hathras, Saharanpur, Muzaffarnagar, Mathura, Baghpat, Gautam Buddha Nagar, Ghaziabad, Meerut
Lesser
Below 5 11 Hamirpur, Gorakhpur, Banda, Jhansi, Allahabad, Jaunpur, Chitrakoot, Deoria, Faizabad, Balrampur, Pratapgarh
5 - 10 6 Mahoba, Ballia, Ambedkar Nagar, Kaushambi, Sant Kabir Nagar, Siddharthnagar
11 - 20 5 Lalitpur, Azamgarh, Ghazipur, Mau,Sonbhadra

312 J. Geogr. Reg. Plann. Table 3. Religion wise gender differentials in WPR in Uttar Pradesh 2001 (in percent).
Religion Person Male Female Gender gap
General 32.48 46.80 16.54 30.26
Hindu 33.24 47.27 17.55 29.72
Muslim 29.15 44.56 12.36 32.20
Christian 33.94 46.72 20.64 26.08
Sikhs 32.73 53.40 9.16 44.24
Buddhist 33.36 46.65 18.51 28.14
Jains 28.85 50.14 5.49 44.65
Mean 31.88 48.12 13.95
SD 2.26 3.15 5.93
CV 7.10 6.54 42.47
Data source: Census of India 2001.
difference is more than 10% points. The closer look between concentration of Muslim
population and Muslim literacy rate shows that, the lesser the percentage of Muslims in a district, the higher is their literacy level, whereas, the districts in which the Muslims have more than 20% population their literacy level is less than that of Hindus. The present analysis reveals that a causal relation relationship exists between concentration of Muslim population (x) that is, in dependent variable and their literacy rate (y), that is, dependent variable. The analysis reveals that both variable. That is, x and y are negatively correlated to each other with r value -0.585 significant at 5% level at 78 degree of freedom. It ascertains that higher concentration of Muslim population is the cause of low level of Muslim literacy in a region because Muslims are suffering from higher illiteracy associated with deprived socio-economic conditions. It is because of this unique combination (of high Muslims population and low Muslims literacy rate), it can be deducted that as the concentration of Muslim population increases in the districts, the literacy rate decreases. This is one of the negative capabilities for the socio-economic development of any community as emphasized in Human Development Report, 2004.
The relative deprivation in education of Muslim versus other religion groups call for the significant shift in the policy for the state, along with the creation of effective partnership with private and voluntary organization. Muslim have been not been able to sufficiently reap the benefit of the state intervention and grant of education. Moreover, skill development initiatives for those who are illiterates may also be particularly relevant for some section of Muslim give their employment and occupational structure.
WORK PARTICIPATION RATE (WPR) Availability of employment provides an individual and his/her family with many economic and non-economic
benefits and opportunities. The work force of a place is usually indicated by work participation rate (WPR) which is the ratio of total workers (main and marginal) to the total population of a place generally expressed in percentage. Bogue (1969) defined it as the percentage of total population which is economically active to the total population. The population of working age is crucial for the determination of the size of labour-force (Agarwal, 1965). Indeed, one could gauge holistic development of the population through its WPR. The socio-economic condition of workers is largely determined by the status of the socio-economic activity in which he is usually engaged, that is, agricultural or non-agricultural sector. Further, the census of India had classified the workers into four categories, which includes, cultivators, agricul-tural workers, household industry workers and other workers. As we earlier stated that for the first time since independence, the census of India provides the religion wise data on workers and its category. As per 2001 census, the WPR of UP is 32.48% however it is 46.80% for male and 16.54% for female. The WPR by gender and religion in U.P. is presented in Table 3. The table shows that the WPR also varies across religious groups. It is important to study the variation of WPR among the religious communities in order to analyze how far a community is lagging behind or other community is moving forward within same region. In UP, the WPR among Muslim is 29.15% comprising 44.56% male and 12.36% for female. The data shows that among Muslim, the WPR is second lowest among the religious groups further the female WPR is also lower among them. Distribution of work participation rate by religion for male and female is given in Table 3. The low aggregate work participation rate for Muslims are essentially due to much lower participation in economic activity by women in the community (GIO, 2006). Apart from this the lack of education and work opportunities for females, the cultural factors such as the practice of purdha and seclusion might have affected the female WPRs at state level (Khalidi, 1995).
The disparity in WPR has seen registered across the religious communities in U.P as seen in the Table 3. Among six selected religious communities (that is, Hindu, Muslim, Christian, sikh, Buddist and Jain), Muslim have recorded second least WPR, that is, 29.15% while Christian with 33.95% stood at top position in 2001. Within Muslim community, only 12.36% female WPR is very much less than 47.27% male WPR. The female literacy rate is much lower than male literacy rate across all the religious groups. It is observed that in the state across the religious communities is highly inconsistent accounting for 42.47% coefficient of variation (CV) against the male 6.54%. It may be ascertained from the aforementioned analysis that females have fewer propensity of employment than males. Beside the gender gap, a higher variation in literacy rate is observed among the religious communities which are more pronounced in the study area.

Siddiqui et al 313
B
Figure 2B. Distribution of Muslim Work Participation Rate in Uttar Pradesh.
The inter district distribution of Muslim WPR in UP shows a wide variations, it runs from 23.89% in Azamgarh to 39.22% in Shrawasti. The pattern of regional distribution of Muslim WPR in the state may be projected systemically by grouping the districts percentage into five grades with the help of maximum
and minimum, that is, very high (above 36.15%), high (33.08 to 36.15%), medium (30.01 to 33.07%), low (26.94 to 30.00%) and very low (Below 26.94%). Considering the above mention five grades separately, it is observed from Figure 2B shows that the first grade of above 36.15% constitutes four district of Shrawasti, Balrampur,
314 J. Geogr. Reg. Plann.
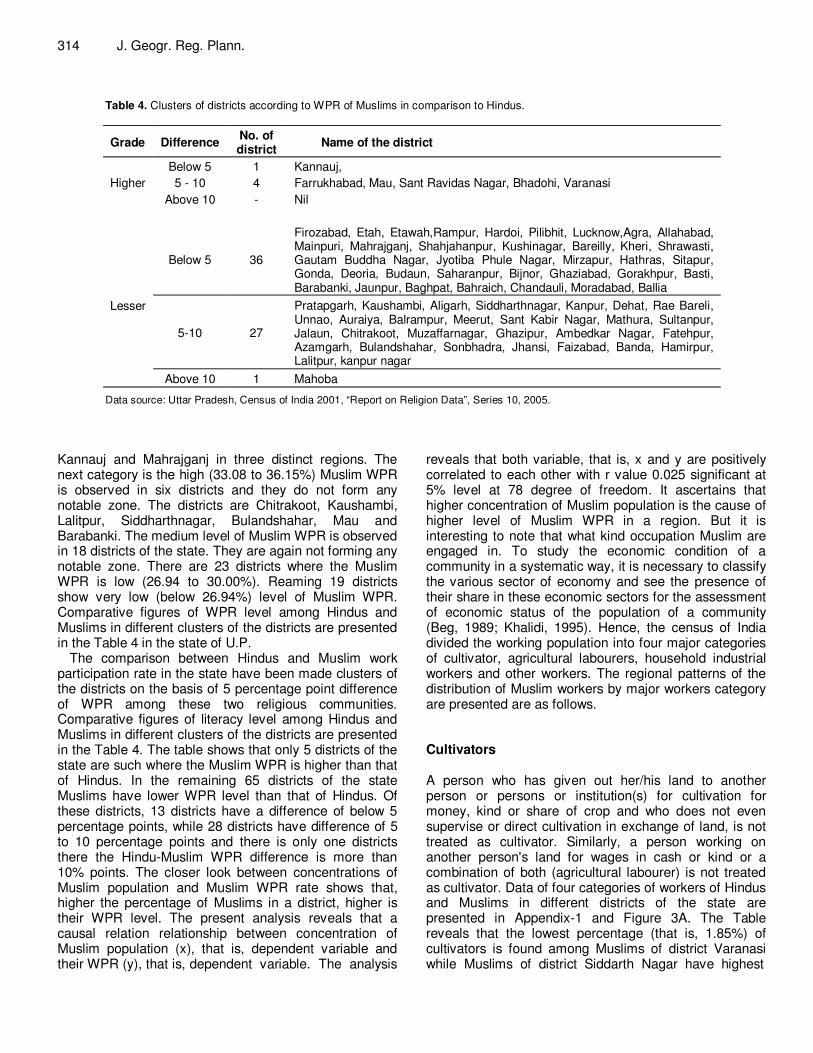
Table 4. Clusters of districts according to WPR of Muslims in comparison to Hindus.
Grade Difference No. of district
Name of the district
Higher
Below 5 1 Kannauj,
5 - 10 4 Farrukhabad, Mau, Sant Ravidas Nagar, Bhadohi, Varanasi
Above 10 - Nil
Lesser
Below 5 36
Firozabad, Etah, Etawah,Rampur, Hardoi, Pilibhit, Lucknow,Agra, Allahabad, Mainpuri, Mahrajganj, Shahjahanpur, Kushinagar, Bareilly, Kheri, Shrawasti, Gautam Buddha Nagar, Jyotiba Phule Nagar, Mirzapur, Hathras, Sitapur, Gonda, Deoria, Budaun, Saharanpur, Bijnor, Ghaziabad, Gorakhpur, Basti, Barabanki, Jaunpur, Baghpat, Bahraich, Chandauli, Moradabad, Ballia
5-10 27
Pratapgarh, Kaushambi, Aligarh, Siddharthnagar, Kanpur, Dehat, Rae Bareli, Unnao, Auraiya, Balrampur, Meerut, Sant Kabir Nagar, Mathura, Sultanpur, Jalaun, Chitrakoot, Muzaffarnagar, Ghazipur, Ambedkar Nagar, Fatehpur, Azamgarh, Bulandshahar, Sonbhadra, Jhansi, Faizabad, Banda, Hamirpur, Lalitpur, kanpur nagar
Above 10 1 Mahoba
Data source: Uttar Pradesh, Census of India 2001, “Report on Religion Data”, Series 10, 2005.
Kannauj and Mahrajganj in three distinct regions. The next category is the high (33.08 to 36.15%) Muslim WPR is observed in six districts and they do not form any notable zone. The districts are Chitrakoot, Kaushambi, Lalitpur, Siddharthnagar, Bulandshahar, Mau and Barabanki. The medium level of Muslim WPR is observed in 18 districts of the state. They are again not forming any notable zone. There are 23 districts where the Muslim WPR is low (26.94 to 30.00%). Reaming 19 districts show very low (below 26.94%) level of Muslim WPR. Comparative figures of WPR level among Hindus and Muslims in different clusters of the districts are presented in the Table 4 in the state of U.P.
The comparison between Hindus and Muslim work participation rate in the state have been made clusters of the districts on the basis of 5 percentage point difference of WPR among these two religious communities. Comparative figures of literacy level among Hindus and Muslims in different clusters of the districts are presented in the Table 4. The table shows that only 5 districts of the state are such where the Muslim WPR is higher than that of Hindus. In the remaining 65 districts of the state Muslims have lower WPR level than that of Hindus. Of these districts, 13 districts have a difference of below 5 percentage points, while 28 districts have difference of 5 to 10 percentage points and there is only one districts there the Hindu-Muslim WPR difference is more than 10% points. The closer look between concentrations of Muslim population and Muslim WPR rate shows that, higher the percentage of Muslims in a district, higher is their WPR level. The present analysis reveals that a causal relation relationship between concentration of Muslim population (x), that is, dependent variable and their WPR (y), that is, dependent variable. The analysis
reveals that both variable, that is, x and y are positively correlated to each other with r value 0.025 significant at 5% level at 78 degree of freedom. It ascertains that higher concentration of Muslim population is the cause of higher level of Muslim WPR in a region. But it is interesting to note that what kind occupation Muslim are engaged in. To study the economic condition of a community in a systematic way, it is necessary to classify the various sector of economy and see the presence of their share in these economic sectors for the assessment of economic status of the population of a community (Beg, 1989; Khalidi, 1995). Hence, the census of India divided the working population into four major categories of cultivator, agricultural labourers, household industrial workers and other workers. The regional patterns of the distribution of Muslim workers by major workers category are presented are as follows. Cultivators A person who has given out her/his land to another person or persons or institution(s) for cultivation for money, kind or share of crop and who does not even supervise or direct cultivation in exchange of land, is not treated as cultivator. Similarly, a person working on another person's land for wages in cash or kind or a combination of both (agricultural labourer) is not treated as cultivator. Data of four categories of workers of Hindus and Muslims in different districts of the state are presented in Appendix-1 and Figure 3A. The Table reveals that the lowest percentage (that is, 1.85%) of cultivators is found among Muslims of district Varanasi while Muslims of district Siddarth Nagar have highest
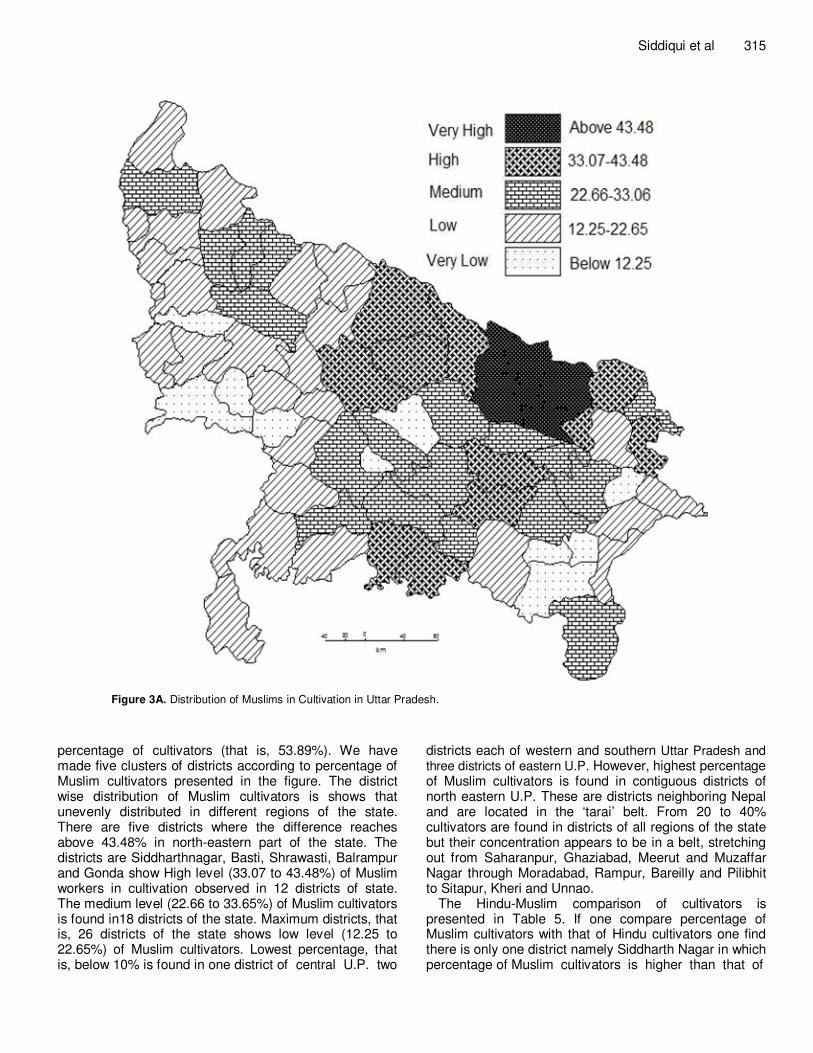
Siddiqui et al 315
Figure 3A. Distribution of Muslims in Cultivation in Uttar Pradesh.
percentage of cultivators (that is, 53.89%). We have made five clusters of districts according to percentage of Muslim cultivators presented in the figure. The district wise distribution of Muslim cultivators is shows that unevenly distributed in different regions of the state. There are five districts where the difference reaches above 43.48% in north-eastern part of the state. The districts are Siddharthnagar, Basti, Shrawasti, Balrampur and Gonda show High level (33.07 to 43.48%) of Muslim workers in cultivation observed in 12 districts of state. The medium level (22.66 to 33.65%) of Muslim cultivators is found in18 districts of the state. Maximum districts, that is, 26 districts of the state shows low level (12.25 to 22.65%) of Muslim cultivators. Lowest percentage, that is, below 10% is found in one district of central U.P. two
districts each of western and southern Uttar Pradesh and
three districts of eastern U.P. However, highest percentage of Muslim cultivators is found in contiguous districts of north eastern U.P. These are districts neighboring Nepal and are located in the ‘tarai’ belt. From 20 to 40% cultivators are found in districts of all regions of the state but their concentration appears to be in a belt, stretching out from Saharanpur, Ghaziabad, Meerut and Muzaffar Nagar through Moradabad, Rampur, Bareilly and Pilibhit to Sitapur, Kheri and Unnao.
The Hindu-Muslim comparison of cultivators is presented in Table 5. If one compare percentage of Muslim cultivators with that of Hindu cultivators one find there is only one district namely Siddharth Nagar in which percentage of Muslim cultivators is higher than that of

316 J. Geogr. Reg. Plann. Table 5. Clusters of districts according to cultivators of Muslims in comparison with Hindus.
Data Source: Uttar Pradesh, Census of India 2001, “Report on Religion Data”, Series 10, 2005
share of Hindu cultivators. In rest of the districts of U.P. percentage of Muslim cultivators is lower than that of Hindu cultivators. There are 4 districts in which there is a difference of below 5% points, whereas in another 8 districts, the difference is of 5 to 10%. The difference of above 10% exists in 56 districts. Thus the analysis shows that about three-fourth of the total districts have the Hindu-Muslim cultivators difference is above 10% points itself suggest the poor conditions of the Muslim in the state. Agricultural labourers Agricultural labour is an important occupation in UP. Like the Muslim cultivators, lowest percentage of Muslim agricultural workers. The percentage of Muslim agricultural workers in U.P. is in Varanasi with 1.68% and maximum of 46.36% in Kushinagar. The state may be categorized into five grades of very high, high, medium, low and very low percentage (Figure 3B). The districts with very high grades (above 37.42%) of Muslim agricultural labourer are only 2 districts and located in the north east part of the state. The category of high grade (28.48 to 37.42%) of Muslim agricultural labour is observed in nine districts into three distinct regions in the state. The districts are Shrawasti, Balrampur, Bahraich, Siddharthnagar, Kanpur Dehat, Sant Kabir Nagar, Fatehpur, Pilibhit and Kaushambi. The district of medium grade (19.54 to 28.47%) of Muslim agricultural labour is observed in the 00 districts. They are spread over the study area. There are 21 district of the state which shows the relatively low (10.60 to 19.53%) of Muslim agricultural labour. They are basically located to the western margin of the state. Remaining 10 districts shows very low level (below 10.60%).
The Figures 3B no doubt lead us to conclude that the percentage of cultivators is more than that of agricultural workers among Muslims. But the conclusion is
immediately contradicted by other figures, which show that the number of districts having third category of Muslim cultivators were less than the districts of agricultural works.
The compares percentage of Muslim agricultural workers in different districts with that of Hindus, this is presented in the Table 6. It is found that the number of districts is higher than Hindus, lower than Hindus in 20 districts.
This shows percentage-wise distribution of Muslim agricultural workers vis-à-vis cultivators has increased while in case of Hindus it has decreased. There are 2 districts as such where the share of Hindu agricultural workers is higher than (above 10% points) that of Muslim agricultural workers, whereas in another 4 districts the difference is of 5 to 10% points and the difference is below 5% points in 14 districts. In rest of the districts (40 districts) of U.P. percentage of Muslim cultivators is higher than that of Hindu cultivators. There are 17 districts in which there is a difference of below 5% points, whereas in another 17 districts, the difference is of 5 to 10%. The difference of above 10% exists in 16 districts. Therefore the analysis shows that in most of the districts of the state, Muslim cultivators is higher as high above 10% points, again suggest the poor conditions of the Muslim in the state. Further more, Muslim share in cultivator and agricultural workers is much higher as compared to Hindus.
As it is stated, earlier that cultivators and agricultural workers are two categories of workers which have their relevance in showing the share of population or a community in rural economy, so some inferences about the share of Muslims in rural economy of U.P. can be inferred from the comparative picture of percentage of rural Muslim population and of cultivators and agricultural workers in different districts of the state. The data shows that in all the districts of U.P. percentage of Muslim cultivators and agricultural workers in combination is lower than that of rural Muslim population in all the
Grade Difference No. of district Name of the district
Lesser Below 5 1 Siddharthnagar
Higher
Below 5 4 Basti, Mahrajganj, Sant Kabir Nagar, Ghaziabad,
5 - 10 8 Pratapgarh, Kushinagar, Kaushambi, Balrampur, Deoria, Sultanpur, Sonbhadra, Saharanpur
Above 10 56
Banda, Chitrakoot, Shrawasti, Gonda, Gautam Buddha Nagar, Meerut, Rae Bareli, Faizabad, Muzaffarnagar, Gorakhpur, Azamgarh, Lucknow, Bahraich, Chandauli, Ballia, Hamirpur, Moradabad, Fatehpur, Kheri, Mirzapur Allahabad, Mathura, Ambedkar Nagar, Rampur, Hathras, Varanasi, Agra, Bijnor, Bulandshahar, Jalaun, Unnao, Ghazipur, Aligarh, Sant Ravidas Nagar Bhadohi, Sitapur, Jaunpur, Jhansi, Hardoi, Kanpur Dehat, kanpur Nagar, Bareilly, Baghpat, Firozabad, Mahoba, Auraiya, Barabanki, Jyotiba Phule Nagar, Mau, Pilibhit, Budaun, Shahjahanpur, Farrukhabad, Etah, Etawah, Mainpuri, Kannauj Lalitpur

Siddiqui et al 317
Figure 3B. Distribution of Muslims in Agricultural Labour in Uttar Pradesh.
Table 6. Clusters of districts according to agricultural labour of Muslims in comparison to Hindus.
Grade Difference No. of district Name of the district
Lesser
Below 5 14 Bahraich, Mainpuri, Balrampur, Pilibhit, Gonda, Kheri, Gautam Buddha Nagar, Ghaziabad, Auraiya, Etah, Muzaffarnagar, Farrukhabad, Kushinagar, Hathras
5 - 10 4 Shrawasti, Kanpur Dehat, kanpur Nagar Bareilly
Above 10 2 Baghpat, Budaun
Higher
Below 5 17 Mathura, Rampur, Hardoi, Barabanki, Moradabad, Shahjahanpur, Meerut, Mahrajganj, Sitapur, Basti, Fatehpur, Kannauj, Saharanpur, Jyotiba Phule Nagar, Bulandshahar, Chitrakoot, Deoria.
5 - 10 17 Siddharthnagar, Aligarh, Unnao, Agra, Faizabad, Jalaun, Banda, Bijnor, Rae Bareli, Sultanpur, Sant Kabir Nagar, Firozabad, Hamirpur, Lalitpur, Lucknow, Etawah, Gorakhpur.
Above 10 16 Pratapgarh, Jaunpur, Mahoba, Varanasi, Jhansi, Sonbhadra, Sant Ravidas Nagar Bhadohi, Ghazipur, Kaushambi, Allahabad, Mirzapur, Azamgarh, Chandauli, Ambedkar Nagar Ballia, Mau.
Data Source: Uttar Pradesh, Census of India 2001, “Report on Religion Data”, Series 10, 2005.

318 J. Geogr. Reg. Plann.
Table 7. Percentage of Muslims household industry workers in comparison with Hindus.
Grade Difference No. of district Name of the district
Lesser
Below 5 36
Auraiya, Faizabad, Rae Bareli, Jhansi, Mainpuri, Baghpat, Gorakhpur, Sant Kabir Nagar, Pratapgarh, Pilibhit, Mahoba, Agra Ghaziabad, Gautam Buddha Nagar, Jalaun, Kanpur Dehat, Budaun, Sonbhadra, Deoria, Kheri, Muzaffarnagar, Aligarh, Hathras, Chitrakoot, Firozabad, Fatehpur, Gonda, Kushinagar, Basti, Mathura, Bahraich, Shrawasti, Saharanpur, Mahrajganj, Balrampur, Hamirpur
5 - 10 13 Sitapur, Lalitpur, Ballia, Rampur, Bulandshahar, Bijnor, Lucknow
Unnao, Bareilly, Shahjahanpur, Sultanpur, Moradabad, Meerut
Above 10 19 Mau, Varanasi, Kannauj, Farrukhabad, Sant Ravidas Nagar Bhadohi, Allahabad, Mirzapur, Azamgarh, Chandauli, Ambedkar Nagar, Jaunpur, Barabanki, Jyotiba Phule Nagar, Ghazipur, Kaushambi, Etawah, Etah, Hardoi
Higher Below 5 2 Siddharthnagar, Banda
5 - 10 Nil
Data source: Uttar Pradesh, Census of India 2001, “Report on Religion Data”, Series 10, 2005.
districts of the U.P. Household industry workers Household Industry is an industry conducted by one or more members of the household at home or within the village in rural areas and only within the precincts of the house where the household lives in urban areas. The larger proportion of workers in the household industry consists of members of the household. Muslim Household Industry Workers are found in every district of U.P. However, their percentage varies from one district to another.
The range of the household industrial workers varies from 2.14% in the district of Siddharth Nagar to 66.85% in the district Mau. The district wise variation of Muslim household industrial workers is divided into five clusters presented in the Appendix-I and Figure 4A. The table shows that very high level (above 53.90%) of Muslim household industry workers are found in three districts of the state namely Kanpur Nagar, Firozabad, Lucknow and Agra located in the south-eastern part. In this way these districts may be said to be significant for concentration of Muslim household industry workers. In the next category of high level (40.97 to 53.91%) of Muslim household industrial worker district of Ghaziabad, Gautam Buddha Nagar, Aligarh, Jhansi, Meerut, Etawah, Mathura, Lalitpur, Bulandshahar and Mahoba.
If we compare percentage of Muslim household industry workers with that of their cultivators and agricultural workers in combination, we found that the latter two categories of workers preponderate over the workers of former category. Percentage of Muslim Household industry workers in comparison to that of Hindus is shown in the Table 7. Although percentage of
Muslim household industry workers is less than that of cultivators and agricultural workers in the state, their percentage is more than that of Hindu household industry worker in 65 districts of the state, as it is shown in the table. In district Banda, Muslim household industry workers are less than that of Hindus while in districts Bahraich, Hamirpur and Siddharth Nagar their percentage is almost equal. Percentage difference between Muslim and Hindu household industry workers is in 48 districts where the difference is below 10% points. In another 9 districts there is a difference of 10.01 to 20.00% points which also cannot be said to be very significant. However, Muslims household industry workers have significant edge over that of Hindu household industry workers in remaining 9 districts of the state there is a difference of above 20 percentage points. There are two districts of the state namely, Mau and Varanasi where Muslim household industry workers no doubt have dominance over to that of Hindu household industry workers. Here the difference is very high, more than 50% points.
The main criterion of a household industry even in urban areas is the participation of one or more members of a household. Even if the industry is not actually located at home in rural areas, there is a greater possibility of the members of the household participating, even if it is located anywhere within the village limits. In the urban areas, where organized industry takes greater prominence, the household industry is confined to the precincts of the house where the participants live. In urban areas, even if the members of the household run an industry by themselves, but at a place away from the precincts of their home, it is not considered as a household industry. It should be located within the precincts of the house where the members live in the case of urban areas.

Siddiqui et al 319
A
Figure 4. Distribution of Muslims in Household Industrial Workers in Uttar Pradesh.
Other workers Other worker is the residual category of workers which includes workers of innumerable kinds having varied socio-economic status in society and living opportunities in market situations. On the one hand, the category includes workers associated with white collar occupa-tions, salaried jobs, trade and commerce, bank and industry, on the other hand it includes menial workers and wage earners like rickshaw-puller, musicians, construction site workers etc. It is, therefore a deceptive category of workers whereby we cannot know economic
condition of religious communities. If in a religious com-munity, large numbers of workers are rickshaw-pullers or wage earners, data of this category would show their favorable condition. Muslim workers engaged in other workers in different grade of districts of U.P. are presented in the Appedix-I and Figure 4B. The Minimum percentage of 10.26% of Muslim other workers is found in district Shrawasti while maximum percentage of 84.47% exist in district Kanpur Nagar.
The distribution of Muslim other workers shows that very high (above 69.63%) grade of Muslim workers engaged in other works is observed only in four districts

320 J. Geogr. Reg. Plann.
B
Figure 4B. Distribution of Muslims in Other Work in Uttar Pradesh.
of Kanpur Nagar, Firozabad, Lucknow and Agra. The reasons for the concentration of Muslim Other Workers in these districts is due to people of these districts engaged art and handicraft industry which generate daily wage employment of various forms for many people. Therefore large number of Muslims might have engaged them-selves in occupations like rickshaw pulling, construction workers, and other wage earners in these districts. And of course these districts are basically urban areas so there is less possibility of the agricultural works so people are bound to work on non-agricultural sector. The category of high (54.79 to 69.63%) grade of Muslim workers engaged
in other works observed in 10 districts of the state namely Ghaziabad, Gautam Buddha Nagar, Aligarh, Jhansi, Meerut, Etawah, Mathura, Lalitpur, Bulandshahar and Mahoba. There are 23 districts in the category of medium grade (39.95 to 54.78%) of Muslim workers engaged in other works. Low level of Muslim workers engaged in other works in 23 districts while very low level of Muslim other workers are observed in 11 districts of the state.
They are Kannauj, Bahraich, Mau, Gonda, Sant Kabir Nagar, Kushinagar, Basti, Mahrajganj, Balrampur, Siddharthnagar and Shrawasti. They are basically forming a compact zone in the south-eastern part of the

Siddiqui et al 321
Table 8. Percentage of Muslim other workers in comparison to Hindus in other workers
Grade Difference No. of district
Name of the district
Lesser
Below 5 02 Ghaziabad, Mau
5 - 10 - Nil
Above 10 1 Varanasi
Greater
Below 5 06 Kushinagar, Balrampur, Shrawasti, Basti, Mahrajganj, Siddharthnagar
5 - 10 09 Bahraich, Sultanpur, Deoria, Kannauj, Meerut, Farrukhabad, Gonda, Gautam Buddha Nagar, Sant Kabir Nagar
Above 10 52
Lalitpur, Mahoba, Firozabad, Etawah, Jhansi, Mainpuri, Aligarh, Shahjahanpur, Jalaun, Agra, Ballia, Etah, Pilibhit, Hamirpur, Ghazipur, Auraiya, Unnao, Bijnor, Ambedkar Nagar, Jaunpur, Budaun, Mathura, Hathras, Gorakhpur, Sonbhadra, Jyotiba Phule Nagar, Banda, Fatehpur, Hardoi, Sitapur, Kanpur Dehat, Bulandshahar, Bareilly, Sant Ravidas Nagar Bhadohi, Lucknow, Rae Bareli, Barabanki, Allahabad, Faizabad, Mirzapur, Baghpat, Chitrakoot, Chandauli, Kheri, Rampur, Saharanpur, Moradabad, Pratapgarh, Azamgarh, Muzaffarnagar, Kaushambi
Data source: Uttar Pradesh, Census of India 2001, “Report on Religion Data”, Series 10, 2005.
Table 9. Correlation matrix of relationship between literacy and workers, Uttar Pradesh, 2001.
X1 X2 X3 X4 X5 X6
X1 1.00 -0.189 -0.325** -0.386** 0.335** 0.209
X2 1.00 0.446** 0.300* .084 -0.576**
X3 1.00 0.683** -0.397** -0.777**
X4 1.00 -0.491** -0.616**
X5 1.00 -0.093
X6 1.00
Correlation is significant at ** 1% level, * 5% level. Data source: Computed by the authors.
state. A comparison of workers engaged in other works
between two major religious groups of the state, that is, Hindus and Muslim in different district clusters of the state is presented in the Table 8. The table explicitly shows that there are only three districts in which the percentage of Muslim other workers is less than that of Hindus. These are Ghaziabad (1.68%), Mau (1.90%) and Varanasi (16.67%). Remaining 67 districts of the state show that the percentage of Muslim other workers is higher than that of Hindus. In the 14 districts, the difference is of below 10% points while this difference ranges between 10.01 to 20.00% points in 27 districts. Difference of 20.01 to 30.00% points is found in 20 districts. In 5 out of remaining 6 districts, the difference goes above 30.01% points while the maximum difference exists in district Lalitpur (43% point).
The percentage of Muslim other worker more than that of Hindus in almost the entire state is it due to their marginalized condition which forces them to take up any kind of work which comes their way. They cannot feed
their children, if they don’t work as daily wage labourers, cycle repairmen, rickshaw-pullers and other menial jobs. It is the rich and prosperous class of the population which can afford to feed its non-working members. Therefore more Muslims population is engaged in other works than Hindus. In developing countries, open unemployment is typically found to be low. This is partly because a large number of the poor cannot afford to be unemployed and thus undertake whatever work comes their way (GOI, 2006). INTER-RELATIONSHIP BETWEEN MUSLIM LITERACY AND WORKERS The present analysis is an attempt to examine the causal relationship between occupational compositions as cause and literacy rate as an effect. Following inter correlation matrix reveals the causal relationship among the variables of literacy and worker (that is, X1…X6). The variables are literacy rate (X1), work participation rate (X2), percentage of cultivators (X3), agricultural labour (X4), household industrial workers (X5) and other workers (X6). Extent and direction of their relationship has been examined on the basis of Karl Pearson’s technique of coefficient of correlation and level significance have been tested using student’s‘t’ test technique with the assumption that linear relationship existed in all case (Siddiqui, 1984; Hussain and Siddiqui, 2009). The result association between literacy and employment and occupational structures are shown in Table 9.
Table 9 reveals that there is negative correlation of literacy rate (X1) with the variables, that is, work participation rate (X2), percentage of cultivators (X3) and agricultural labour (X4). The values of correlation of X1 with X2 (r = -0.189), X3 (r = -0.325) and X4 (r = -0.386) whereas there are positive relationship between X1 with

322 J. Geogr. Reg. Plann. X5 (r = 335) is significant at 1% level. It may be ascertained that that lower literacy rate is the cause of low level of work participation rate in the study area among Muslim and higher level of literacy is mainly asso-ciated with the occupational composition of agricultural labour and cultivation because Muslims are suffering from higher illiteracy associated with deprived socio-economic conditions and because of this they are bound to work in agricultural sector. As per the spatial analysis of occupational composition, higher concen-tration of cultivators is recorded in those districts where literacy rate is found low. However, the there is positive correlation between literacy and with household industrial workers (X5) and other works (X6) proves the philosophy that low level of literacy is the cause of higher rate of population in household industrial workers and other works and vice-versa. The hypothesis, literacy is inversely proportionate to non-primary occupation of the population and they are the cause and effect to each other, is quantitatively proved. The analysis further discloses the fact that both literacy rate and primary occupation are inversely correlated to each other. It is because; usually illiterate people are not eligible for other than labour work in secondary and tertiary sectors, therefore primary occupation is the main livelihood for them. Insufficient income from primary occupation does not allow them to send their children to the school causes low level of literacy. Because of very little wages from this occupation, people are incapable to send their children even for primary education, rather expect earning from them. Therefore, people of this group keep their children engaged in cattle rearing and in agriculture labouring for their family assistance. These factors are responsible for the low rate of literacy in those parts of the state.
On the other hand, the correlation matrix between the variables of the workers and occupational categories shows that there is positive correlation between the variables X2 with percentage of workers engaged in cultivation (X3) and agricultural laborers (X4) is significant at 1 and 5% level which ascertain that high level of WPR is the cause and consequence of both higher cultivators and agricultural laborers. There is a positive relationship between cultivation and agricultural labour whereas there are negative correlations with household industrial workers and other workers. Further the table reveals that there is very higher degree of negative correlation with other workers (X6) is significant at 1% level. The negative association of variable X4 (agricultural labour) with the variables X5 and X6 ascertains that higher number of people largely engaged as agricultural labour severally hamper the expansion of household industrial and other works which is the synonym of socio-economic develop-ment of the Muslim community. The analysis infers the fact that, no one of the occupational compositions shows much higher degree of positive correlation with literacy rate. Perhaps because of the insufficient family income, working population of this occupation is not capable of
sending their children for education therefore comparatively lower household industrial workers and other works has been found among Muslim. Another fact may be inferred from the analysis that due to higher income occupation from household, industrial workers and other works, higher degree of correlation has been found from the causal relationship of literacy rate with former occupational group than latter one. Therefore, it may be ascertained that family income, that is, economic strength is the key factor of educational level as well as literacy rate of a region or a community in particular. CONCLUSION Being 18% of states total population, Muslims form the principal minority group. Preceding analysis shows that U.P. is home to one-fourth of the total Muslim population of India. They are found to be distributed all over the state and settled more in urban areas than that of the rural. Although they constitute 18% of the population of the state, their concentration in 20 districts of the state is of paramount significance. Thirty seven percentage Muslims of U.P. live in urban areas while 63% dwell in villages. In addition, in the 60 years since independence, Muslims as a community have failed to achieve socio-economic progress.
Generally, poor socio-economic condition is one of the major constraints of low level of literacy, while deprived socio-economic condition may be the outcome of low level of literacy as well as education. Thus, the two major goals that need to be achieved by Muslims are those of eradicating communalism and achieving socio-economic upliftment for their community in cooperation with the society. In addition, the status of Muslim women needs to be improved. In order for all this to be achieved, an enlightened leadership is required along with a great deal of commitment and focused developmental work on the part of the Indian nation and the Muslims of India as well. India cannot claim to be a ‘just society’ or a powerful nation if its largest minority remains deprived, handicapped and marginalized. This trend of course puts an impediment in the development of the community as education is supposed to be the main instrument for bringing about social, economic and political inclusion and durable integration of people particularly those ‘excluded’, from the mainstream of any society.
The WPR of Muslims is less than the state as well as the majority community. But the major concern is low WPR for Muslim women which directly influence the low aggregate of the community’s WPR. Hence there is an urgent need to take meaningful steps for uplift meant of Indian Muslims who are living in abject poverty, insecure conditions and are under represented in Governmental services, educational institutions and in decision-making bodies. Muslim literacy rate is not satisfactory level at country level in general and U.P. in particular.

Disaggregative analysis of district level data of the state of UP present a less flattering picture of the status of Muslims in general and Muslim women in particular. With regards to education, the condition of Muslim is grave concern. The data clearly indicates that the educational status of Muslim community in particular is matter of great concern. The WPR of Muslims is less than the state as well as the majority community. But the major concern is low WPR for Muslim women which directly influence the low aggregate of the community’s WPR. Muslims in India as well as in U.P. are politically alienated community. Their political participation in mainstream politics is minimal. Muslims are under-represented in the parliament and state legislature. Their participation in the political process did not increase to the extent what it should be since the inception of first general election. Their political participation is also less in proportion with their population share in the state. However, it needs to be pointed out that without political empowerment, socio-economic progress of Muslims will be a utopian come close to and vice versa. REFERENCES Abedi Z (2011). Indian Muslim: Social Economic and Educational
Status, Arise Publishers and Distributors, New Delhi, p.5. Ahmad I (2007). Exploring the Status of Muslims in the Economy”,
Economic and Political Weekly, Vol. 42, No. 37, September 15, p. 3703-3704.
Siddiqui et al 323 Ahmad I (1975). Economic and Social Changes”, in Muslims in India,
ed. Zafar Imam, Orient Longman, Delhi, p. 231-255. Ahmad I (1981). Muslim Educational backwardness- an Inferential
analysis, Economic Political Weekly, Vol.16: p.1457-1465. Agarwal SN (1965). Indian’s Population Problem, New Delhi, p.186. Beg T (1989). Economic development of Indian Muslim: Some strategic
Option, In Ansari IA (Ed.). The Muslim situation in India, Sterling Publishers. New Delhi. p. 116-131.
Bogue DJ (1969). Introduction to the Study of Demography in Principles of Demography, John Wiley and. Sons, Inc., New York
Census of India (2001). Report on Religion Data (Series 10, Uttar Pradesh). Lucknow: Joint Director, Directorate of Census Operation, Uttar Pradesh and Uttaranchal. New Delhi
Dasgupta A (2009). On the Margins: Muslims in West Bengal”, Economic and Political Weekly, Vol. 54, No 16, April 18, p. 91-96
GOI (1983). Report on Minorities, Ministry of Home Affairs, Government of India, (Chirperson Gopal Singh), New Delhi.
GOI (2006). Social, Economic and Educational Status of the Muslim Community of India- A Report. New Delhi: Prime Minister's High Level Committee, Cabinet Secretariat, Government of India, New Delhi (Chairperson Justice Rajindar Sachar).
Hunter WW (1969). The Indian Musalmans , ndological Book House, London, Delhi, p. 158.
Khalidi (1995). Indian Muslim since Independence, Vikash Publication, New Delhi.
Ramesh K (2010). Socio-economic Disparities among Social groups in India, Serial Publication, New Delhi.
Siddiqui FA (1984). Regional Analysis of Population Structure- A case Study of Uttar Pradesh, Concept Publishing Company, New Delhi, p.114.
Hussain N, Siddiqui FA (2009). Literacy and Socio economic Marginalization of Muslim Population of Malda District, West Bengal (India), Arab World Geogr., 12(1,2): 62-75.
Zakariya (1995). The Widening Divide: An Insight into Hindu-Muslim Relation, Viking Publication, New Delhi.

324 J. Geogr. Reg. Plann.
Appendix-I. Distribution of Muslim Sex Ratio, Literacy and Workers in Uttar Pradesh, 2001.
Name of the districts Literacy Worker Cultivator AL HHIW OTW
1 Saharanpur 47.64 25.82 21.31 23.73 4.42 50.54
2 Muzaffarnagar 46.45 28.88 24.22 26.08 4.81 44.89
3 Bijnor 49.93 25.82 14.04 24.45 11.09 50.42
4 Moradabad 36.42 28.37 27.87 17.73 8.68 45.73
5 Rampur 32.81 27.50 29.48 24.97 11.41 34.14
6 Jyotiba Phule Nagar 43.40 30.11 27.62 13.78 18.02 40.58
7 Meerut 45.65 26.10 15.03 12.06 8.80 64.11
8 Baghpat 44.32 29.22 16.90 28.04 7.40 47.66
9 Ghaziabad 49.13 25.21 13.72 9.90 7.21 69.17
10 Gautam Buddha Nagar 45.62 27.67 14.53 12.45 6.79 66.23
11 Bulandshahar 45.02 34.16 15.87 14.24 13.22 56.67
12 Aligarh 45.34 26.38 11.13 15.56 7.97 65.34
13 Hathras 43.93 26.32 12.65 25.49 8.20 53.66
14 Mathura 39.03 31.93 20.29 17.32 5.24 57.15
15 Agra 50.29 25.19 6.51 7.79 9.59 76.11
16 Firozabad 47.09 26.36 4.10 8.40 7.64 79.85
17 Etah 40.22 27.88 21.56 19.98 13.84 44.62
18 Mainpuri 48.68 25.33 21.57 20.45 6.67 51.31
19 Budaun 35.34 27.03 32.90 26.27 4.79 36.05
20 Bareilly 37.02 28.43 19.66 22.97 8.90 48.47
21 Pilibhit 39.30 26.37 18.91 29.47 6.51 45.10
22 Shahjahanpur 39.71 26.60 21.40 22.63 8.66 47.31
23 Kheri 42.25 29.08 39.17 27.28 4.96 28.59
24 Sitapur 44.25 28.16 33.35 21.11 12.82 32.73
25 Hardoi 44.50 31.02 34.38 18.88 13.51 33.23
26 Unnao 49.50 29.52 31.10 16.78 11.07 41.05
27 Lucknow 61.49 28.04 7.31 5.23 11.10 76.36
28 Rae Bareli 49.98 30.92 30.53 28.36 8.09 33.02
29 Farrukhabad 48.16 32.54 19.28 19.51 30.62 30.60
30 Kannauj 47.07 37.93 19.82 13.66 42.69 23.83
31 Etawah 56.96 26.49 9.24 13.34 13.85 63.57
32 Auraiya 58.72 27.86 21.02 25.84 7.66 45.47
33 Kanpur Dehat 55.49 28.01 24.39 32.40 5.76 37.45
34 Kanpur Nagar 64.85 26.60 4.06 5.57 5.90 84.47
35 Jalaun 54.13 29.99 19.43 27.54 6.16 46.88
36 Jhansi 66.90 29.35 13.68 11.02 10.03 65.27
37 Lalitpur 66.36 34.58 21.47 9.49 12.31 56.72
38 Hamirpur 61.69 31.03 25.60 28.23 2.92 43.26
39 Mahoba 62.29 31.07 16.48 21.53 6.22 55.78
40 Banda 56.55 32.21 36.29 25.72 2.36 35.63
41 Chitrakoot 66.19 35.79 42.99 23.50 4.46 29.05
42 Fatehpur 54.93 31.16 28.21 30.61 4.94 36.23
43 Pratapgarh 57.70 29.20 41.95 21.84 8.44 27.76
44 Kaushambi 53.35 34.77 29.53 28.77 16.48 25.23
45 Allahabad 63.35 31.91 13.70 10.78 28.88 46.64
46 Barabanki 41.38 33.21 26.19 26.77 19.18 27.87
47 Faizabad 56.63 32.06 33.35 24.24 7.93 34.47
48 Ambedkar Nagar 64.79 27.67 23.03 17.61 21.99 37.37
49 Sultanpur 52.85 27.33 34.32 26.54 11.54 27.60
50 Bahraich 32.65 32.41 42.09 33.90 2.73 21.28

Siddiqui et al 325
Appendix-I. Contd
51 Shrawasti 26.05 39.22 51.75 34.97 3.02 10.26
52 Balrampur 34.86 38.95 50.59 34.71 2.38 12.32
53 Gonda 37.21 31.01 49.65 27.05 3.70 19.60
54 Siddharthnagar 47.35 34.38 53.89 32.55 2.14 11.42
55 Basti 50.48 31.41 52.20 25.94 4.60 17.26
56 Sant Kabir Nagar 56.61 30.12 42.79 31.89 6.51 18.81
57 Mahrajganj 46.39 37.16 39.13 43.34 3.16 14.37
58 Gorakhpur 61.18 26.21 16.52 26.89 7.66 48.93
59 Kushinagar 45.24 32.17 31.68 46.36 4.52 17.45
60 Deoria 59.18 25.23 34.04 28.03 5.89 32.04
61 Azamgarh 67.06 23.89 31.81 13.14 26.15 28.91
62 Mau 70.54 33.32 7.95 4.63 66.85 20.57
63 Ballia 66.76 24.14 14.99 21.99 14.33 48.69
64 Jaunpur 61.17 26.91 26.25 11.16 23.77 38.81
65 Ghazipur 68.83 25.18 21.05 14.03 20.70 44.23
66 Chandauli 57.49 27.86 14.19 19.23 26.75 39.83
67 Varanasi 54.44 31.72 1.85 1.68 64.75 31.72
68 Sant Ravidas Nagar Bhadohi 57.84 29.47 2.83 2.45 46.92 47.80
69 Mirzapur 53.88 31.01 11.73 18.10 30.66 39.51
70 Sonbhadra 58.55 29.12 26.36 25.83 65.29 43.19
Uttar Pradesh 47.79 29.15 25.72 21.62 11.14 41.52
Note: AL- agricultural Labourers, HHIW- Household Industrial Workers OTW-Other Workers. Source: Census of India, 2001, Religion Data 2005