Embed Size (px)
Citation preview
Frontiers in Immunology | www.frontiersin.
Edited by:Jorge Correale,
Fundacion Para la Lucha Contra lasEnfermedades Neurologicas de la
Infancia (FLENI), Argentina
Reviewed by:Elizabeth J. Coulson,
The University of Queensland,Australia
Bruce Douglas Carter,Vanderbilt University, United States
Rick Meeker,University of North Carolina at Chapel
Hill, United States
*Correspondence:Benjamin W. Dorschner
Specialty section:This article was submitted to
Multiple Sclerosisand Neuroimmunology,a section of the journal
Frontiers in Immunology
Received: 15 February 2021Accepted: 22 March 2021Published: 16 April 2021
Citation:Dorschner BW, Wiedemuth R,
Funke A-C, Gentzel M, Rogers M-L,Brenner S and Thieme S (2021)
Listening to the Whispers inNeuroimmune Crosstalk: A
Comprehensive Workflow toInvestigate Neurotrophin Receptorp75NTR Under Endogenous, Low
Abundance Conditions.Front. Immunol. 12:648283.
doi: 10.3389/fimmu.2021.648283
METHODSpublished: 16 April 2021
doi: 10.3389/fimmu.2021.648283
Listening to the Whispers inNeuroimmune Crosstalk:A Comprehensive Workflow toInvestigate Neurotrophin Receptorp75NTR Under Endogenous,Low Abundance ConditionsBenjamin W. Dorschner1*, Ralf Wiedemuth1, Ann-Christin Funke1, Marc Gentzel2,Mary-Louise Rogers3, Sebastian Brenner1 and Sebastian Thieme1
1 Experimental Hematology, Department of Pediatrics, University Clinic Carl Gustav Carus, Dresden, Germany, 2 MolecularAnalysis - Mass Spectrometry, Center for Molecular and Cellular Bioengineering (CMCB), Technische Universitaet Dresden,Dresden, Germany, 3 Centre for Neuroscience, College of Medicine and Public Health, Flinders University, Adelaide, SA, Australia
Inflammatory conditions are critically influenced by neuroimmune crosstalk. Cytokines andneurotrophic factors shape the responses of both nervous and immune systems.Although much progress has been made, most findings to date are based onexpression of recombinant (tagged) proteins. The examination of receptor interactionsby immunoprecipitation (IP) at endogenous levels provides further insight into the moresubtle regulations of immune responses. Here, we present a comprehensive workflowand an optimized IP protocol that provide step-by-step instructions to investigateneurotrophin receptor p75NTR at endogenous, low abundance levels: from lysatepreparation and confirmation of receptor expression to antibody validation andsuccessful detection of protein-protein interactions. We employ human melanoma cellline A375 to validate specific antibodies and IP conditions, and apply these methods toexplore p75NTR interactions in human leukemic plasmacytoid dendritic cell line PMDC05detecting 14-3-3ϵ:p75NTR interaction in this cell type. With p75NTR as an exemplaryprotein, our approach provides a strategy to detect specific interaction partners evenunder endogenous, low abundance expression conditions.
Keywords: p75NTR, CD271 (p75NTR), mass spectrometry, endogenous immunoprecipitation, protein-proteininteraction, PMDC05, A375 (human melanoma) cell line, neuroimmune crosstalk
INTRODUCTION
Despite the apparent differences between the nervous and immune systems, they share an intriguingsimilarity: both employ a system of cytokines and neurotrophic factors enabling them to transmitinformation fromone systemto theother (1).Thisneuroimmunecrosstalkhasbeen implicated inawiderange of reactions and conditions, e.g. neuroinfectious and autoimmune reactions, as well as allergic
org April 2021 | Volume 12 | Article 6482831
Dorschner et al. Comprehensive Workflow to Investigate p75NTR
diseases (2–4). A special role has been proposed for neurotrophins,including Nerve Growth Factor (NGF) and their receptors (5, 6).p75NTR is a universal neurotrophin receptor that relaysextracellular NGF signals to intracellular compartments, either asa single receptor, or in complex with other receptors (7). The aim ofthe current study was to establish a comprehensive workflow toinvestigate protein interactions of p75NTR in cell types with lowendogenous expression. Given that to date most results stem fromrecombinant expressionmodels, our approachmayprovide furtherinsight into more subtle regulations of immune responses.
A prominent role in neuroimmune crosstalk has been proposedfor neurotrophin NGF and p75NTR, a universal neurotrophinreceptor with a single transmembrane domain (6, 8). Originallypurified in the late 1970s and early 1980s from rodent sympatheticganglia and human melanoma cells (9), p75NTR is expressed incentral nervous system cells as well as a variety of immune cells (6,8). Under inflammatory conditions, both NGF secretion andp75NTR expression are dynamically regulated (6, 8). Thesedynamic changes shape different immune responses depending onp75NTR expression levels [for review see (10)].
P75NTR is also expressed in conventional and plasmacytoiddendritic cells (pDC) (11, 12). Dendritic cells play a pivotal role inbridging innate and adaptive immune responses (13). Theircapacity to present antigens to T lymphocytes is a key elementin the initiation of effective immune responses (14). Conventionaland plasmacytoid dendritic cell functionality is influenced by NGFthrough p75NTR (11, 12). Recently, we have shown that NGFbinding to p75NTR on pDCmodulates T cell priming, aggravatinglung inflammation in a TH2-prone asthma model and alleviatingdisease progression in a TH1-prone diabetes model (12). Despitethese effects, p75NTR expression levels show a considerable inter-individual variation in human pDC (12). Therefore, wheninvestigating p75NTR and its interacting proteins, a methodshould be used that encompasses the entire dynamic range ofendogenous expression from low to high abundance levels.
A standard method to study protein-protein interactions isimmunoprecipitation (IP). Its principle is to capture a targetprotein (and interacting proteins) by use of a specific antibodycoupled to a stationary matrix [for review see (15)]. Extensiveresearch advanced the field extraordinarily and recent developmentsinclude e.g. single cell IP, multiplexed IP, and time-resolved analysisof protein-protein interaction networks (16–18). In general, manyvariables determine the success of IP experiments, e.g. matrixmaterial and antibody coupling, lysis and washing buffers as wellas elution conditions. The investigation of proteins at endogenousexpression levels is further limited by factors such as relativeabundance and the quality of antibodies used to detect theprotein in question. Many experiments rely on the recombinantexpression of (tagged) proteins, thereby overcoming theselimitations. Interestingly, there is an increasing body of evidencethat expression levels of receptor proteins may regulate the functionof their downstream mediators [e.g. (19), for review see (10)]. Thisemphasizes the complementary rather than interchangeable natureof both approaches (20). But although protocols for IP ofendogenous membrane proteins are published (21–23) optimizedprotocols when dealing with low abundance proteins are lacking.
Frontiers in Immunology | www.frontiersin.org 2
The receptor p75NTR is an excellent example of atransmembrane protein that poses a challenge to endogenous IPexperiments with subsequent mass spectrometric detection. Themolecular mass of p75NTR amounts to approx. 42 kDa based onthe amino acid composition. The protein runs between 65 to 80kDa in denaturing SDS-PAGE as it is subject to extensive post-translational modification with intra- and intermoleculardisulfide-linkages, O- and N-glycosylation (24–28). In contrastto other membrane proteins, effective solubilization of p75NTRfrom cell membranes can be achieved by various buffers, includingcompositions based on detergents CHAPS (29, 30), NP-40 (31–33), n-octyl b-D-glucopyranoside (34, 35), Triton X-100 (36–39)and RIPA buffer (26, 40). Successful p75NTR IP from humanurine samples confirms solubility even in detergent-free solutions(41, 42). Several p75NTR specific antibodies were generated andhave been used extensively, e.g. 192-IgG (43), ME20.4 (44), andMLR1/2 (45). To our knowledge, however, there are only a fewarticles that report mass spectrometry after IP with antibodiesdetecting p75NTR epitopes. This approach was employed toconfirm the successful capture of p75NTR itself (42), toinvestigate its phosphorylation sites (46) and to detect novelinteracting proteins Galectin-3 and Trio (39, 47).
This comprehensive protocol collection details the workflowto successfully immunoprecipitate p75NTR at endogenous, lowabundance expression levels. We validated the specificity of threemonoclonal p75NTR antibodies (1 commercially available, 2hybridoma culture derived) and IP conditions in humanmelanoma cell line A375, a model cell line for these conditions(9, 48). We then applied our experimental conditions to humanleukemic plasmacytoid dendritic cell line PMDC05, a pDC-likecell line that had not been investigated for p75NTR expressionbefore but – based on our data – shows very low endogenousp75NTR expression (49, 50). Since immune responses ofdendritic cell subsets were shown to be modulated by lowabundance levels of p75NTR (11, 12), we hypothesized thatPMDC05 expressed p75NTR and could be employed as a pDC-like model cell line for p75NTR interaction experiments.
Our proposed workflow consisted of the following steps:
1. confirmation of p75NTR mRNA transcription by quantitativeRT-PCR and protein expression by flow cytometry andimmunofluorescence in both model and target cell lines
2. antibody validation in cell line A375 by IP, western blottingand mass spectrometry,
3. application of this optimized protocol to immunoprecipitatep75NTR and potentially interacting proteins in pDC-like cellline PMDC05.
MATERIALS AND EQUIPMENT
Cell Lines
• Mouse hybridoma cell line 2003G64 (20.4; HB-8737)producing p75NTR antibody ME20.4, American TypeCulture Collection, Manassas, VA, USA
April 2021 | Volume 12 | Article 648283
Dorschner et al. Comprehensive Workflow to Investigate p75NTR
• Human melanoma cell line A375, a kind gift from FriedegundMeier and Dana Westphal, Clinic of Dermatology, UniversityClinic Carl Gustav Carus, Dresden, Germany
• Human leukemic plasmacytoid dendritic cell line PMDC05,provided by Miwako Narita (Laboratory of Hematology andOncology, Graduate School of Health Sciences, NiigataUniversity, Niigata, Japan), Kana Sakamoto and KengoTakeuchi (both Cancer Institute of the Japanese Foundationfor Cancer Research, Tokyo, Japan) (50)
Cell Culture Reagents and ChemicalsCell culture reagents and chemicals are detailed inSupplementary Table S1.
AntibodiesDetails about the use of antibodies in immunofluorescence andflow cytometry are listed in Table 1. P75NTR antibody MLR2production has been described earlier (45). MLR2 antibodyrequests for academic and non-profit use may be addressed toMary-Louise Rogers ([email protected]).Unlabeled p75NTR antibody ME20.4 was produced inhybridoma cells. After cell expansion in IMDM supplementedwith 10% FCS and 2 mM GlutaMAX, medium was switched toHybridoma-SFM. Supernatant containing the antibody wasstored at -20°C. Fluorescent dye-conjugated p75NTRantibodies ME20.4-1.H4 (PE), appropriate isotype control (IS5-21F5) and FcR human blocking reagent were purchased fromMiltenyi Biotech. Clone D4B3 and isotype control DA1E, andanti-rabbit IgG-HRP were obtained from Cell SignalingTechnology. Polyclonal rabbit IgG isotype control (NBP2-24891) was purchased from Novus Biologicals.
Goat anti-Rabbit IgG-Alexa Fluor 555 (A-21429), chickenanti-mouse IgG-Alexa-Fluor 647 (A-21463), goat anti-MouseIgG-Alexa Fluor 555 (A-21424), Chicken anti-Rabbit IgG-AlexaFluor 647 (A-21443) were purchased from Thermo FisherScientific. HRP-linked Donkey anti-Rabbit IgG (NA9340) wasobtained from GE Healthcare.
Frontiers in Immunology | www.frontiersin.org 3
Recipes for Buffers and Media
• Elution Buffer: 0.1 M glycine in distilled water (pH 2.4 adjustedwith HCl).
• Lysis Buffer: 130mMNaCl, 50mMHEPES (pH7.4), 1% (v/v)TritonX-100 indistilledwater. Supplementedwith1 tabletprotease inhibitorcocktail (Roche cOmplete Ultra Mini EDTA-free) per 10 mL.
• 4% (w/v) PFA solution: dissolve 4% (w/v) PFA in HBSS,incubate at 80°C until solution becomes transparent, cool onice. Store at 4°C and use for a month.
• HBSS: CaCl2 0.14 g L-1, MgCl2 · 6 H2O 0.1 g L-1, MgSO4 ·7 H2O 0.1 g L-1, KCl 0.4 g L-1, KH2PO4 0.06 g L
-1, NaCl 8 g L-1,Na2HPO4 · 7 H2O 0.09 g L-1, D-glucose 1 g L-1 in ddH2O.
• PBS: KCl 0.2 g L-1, KH2PO4 0.2 g L-1, NaCl 8 g L-1, Na2HPO4
1.15 g L-1 in ddH2O.• PBS++: 0.5% (w/v) BSA and 2 mM EDTA in PBS.• PBS-DAPI: 0.1 µg mL-1 DAPI in PBS.• Permeabilization Buffer: 0.1% (v/v) Triton X-100 and 1% (w/v)BSA in PBS.
• RPMIcomplete: RPMI1640 supplementedwith10%(v/v)FCS, 2mM GlutaMAX and 100 units mL-1 penicillin-streptomycin.
• SDS Sample Buffer (2×): 5% (w/v) SDS, 25% (v/v) glycerol, 20%(v/v) 2-mercaptoethanol, 0.25 mM Tris (pH 6.8) in ddH2O.
• TBS-T: 0.05% (v/v) Tween 20 in TBS (0.05 mM Tris, 0.145 MNaCl, pH 7.6, made from 10 × stock solution).
• TBS-T-M: 5% (w/v) nonfat dry milk powder in TBS-T.• Washing Buffer: 130 mM NaCl, 50 mM HEPES (pH 7.4,adjusted with HCl).
• 10× Tris buffered saline (500 mM Tris, 1.45 M NaCl, pH 7.6).
METHODS
Biosafety Notes:
• Both cell lines A375 and PMDC05 must be handled at biosafetylevel 1: wear personal protective equipment (gloves, lab coat,protective eyewear if splashes are possible) at all times.
TABLE 1 | Antibodies in immunofluorescence and flow cytometry.
Antibody Clone Host Isotype Function Dye Concentration [µg mL-1]
IF FC
p75NTR D4B3 rabbit IgG primary unconjugated 0.1 0.1ME20.4 mouse IgG1 primary PE 0.8 –
ME20.4 mouse IgG1 primary unconjugated – 1.5MLR2 mouse IgG2a primary unconjugated 2 2
Isotype DA1E rabbit IgG primary unconjugated – 0.1polyclonal rabbit IgG primary unconjugated 0.1 –
eBM2a mouse IgG2a primary unconjugated 2 –
DM1a mouse IgG1 primary unconjugated – 1.5IS5-21F5 mouse IgG1 primary PE 0.8 0.8
2nd anti-mouse polyclonal goat IgG secondary AF555 4 –
polyclonal chicken IgY secondary AF647 – 42nd anti-rabbit polyclonal goat IgG secondary AF555 4 –
polyclonal chicken IgY secondary AF647 – 4
April
2021 | Volume 12 | AAF555, Alexa Fluor 555; AF647, Alexa Fluor 647; FC, flow cytometry; IF, immunofluorescence; PE, phycoerythrin.
rticle 648283
Dorschner et al. Comprehensive Workflow to Investigate p75NTR
• Adhere to additional biosafety regulations of your institution,especially when transfected or infectious cell lines are used.
Protocols for step 1—Confirmation ofp75NTR Expression by QuantitativeRT-PCR, Flow Cytometry andImmunofluorescence in Cell LinesA375 and PMDC05Culture of Human Melanoma Cell Line A375
1. Cultivate at a density of 2-5 × 10⁴ cells cm-2 in pre-warmedRPMI complete (0.2 mL cm-2) in an incubator (37°C, 95%humidity, 5% CO2).
2. Passaging (usually after 2-3 days)
a. remove cell culture supernatant, gently addPBS (0.1mL cm-2),swivel cell culture vessel and discard supernatant.
b. add pre-warmed 21 µM trypsin solution (0.03 mL cm-2)and incubate at 37°C for 5 min, check cell detachment withmicroscope.
c. add 3 volumes of RPMI complete.
d. transfer cell suspension to a centrifuge tube and centrifugeat 300 × g for 8 min at RT.
e. resuspend cells in pre-warmed RPMI complete and countcells (e.g. in a Neubauer chamber).
f. adjust cells to desired concentration.
Culture of Human Leukemic Plasmacytoid DendriticCell Line PMDC05
1. Cultivate at a density of 0.25-0.5 × 10⁶ cells cm-2 in pre-warmed RPMI complete (0.2 mL cm-2) in an incubator (37°C,95% humidity, 5% CO2).
2. Passaging (usually twice a week)
a. transfer cell suspension to a centrifuge tube, rinse surface ofthe culture vessels with PBS (0.05 mL cm-2) to loosen slightlyattached cells and centrifuge at 300 × g for 8 min at RT.
b. resuspend cells in pre-warmed RPMI complete and countcells (e.g. in a Neubauer chamber).
c. Adjust cells to desired concentration.
Critical Parameters
• Viable cell concentration can be determined by trypan blueexclusion.
• PMDC05 are sensitive, slowly growing cells and tend to formclusters. At the beginning, they may struggle to regeneratefrom the thawing process. Once stable growth has beenobserved subcultivation intervals may be increased to 7 days.
Sample Preparation for RNA Isolation and WholeCell Protein Lysates
1. Transfer cells to centrifuge tubes and perform the followingsteps at 4°C.
Frontiers in Immunology | www.frontiersin.org 4
2. Wash cells twice by centrifugation at 300 × g for 8 min andresuspension in ice-cold 1x PBS.
3. For RNA preparation:
a. Transfer 5 × 10⁶ cells to a 1.5 mL reaction tube.
b. Centrifuge at 500 × g for 8 min.
c. Carefully remove supernatant as completely as possible.
d. Store dry pellets at -80°C.
4. For whole cell protein lysates:
a. Transfer 2-10 × 107 cells to a 1.5 mL reaction tube.
b. Lyse cells in lysis buffer (108 cells mL-1) e.g. by trituration.
c. Incubate for 1 hour under constant agitation.
d. Clear lysates by centrifugation at ≥10,000 × g for 45 min.
e. Store lysates at -20°C.
RNA Isolation, cDNA Synthesis, and QuantitativeReal-Time PCRTotal RNA was purified from human cell lines A375 andPMDC05 using RNeasy Mini Kit (QIAGEN) according to themanufacturer’s instructions. Content and purity of RNApreparations was assessed on a microvolume spectrometer(NanoDrop One, Thermo Fisher Scientific) by calculating 260nm/280 nm absorbance ratios. Complementary DNA (cDNA)was synthesized using SuperScript IV First-Strand SynthesisSystem (Thermo Fisher Scientific) with oligo-dT primersaccording to the manufacturer’s instructions. Quantitative PCRwas performed on a QuantStudio 5 Real-Time-PCR-System(Thermo Fisher Scientific) using the TaqMan system (ThermoFisher Scientific) according to the manufacturer’s instructions.Assay probes were purchased from Thermo Fisher Scientificdesigned to cover exons 1-5 of human p75NTR (NCBI ReferenceSequence: NM_002507.3; for details see SupplementaryTable S2).
Fluorescent Dye Labeled Antibody Staining forFlow Cytometry
1. Transfer cell suspension prepared during cell culturehandling to a centrifuge tube.
2. Perform the following steps at 4°C.3. Centrifuge at 300 × g for 8 min and resuspend in ice-cold
PBS++.4. Repeat the centrifugation step and resuspend in PBS++
containing human FcR blocking reagent (1:10) at aconcentration of 2 × 10⁷ cells mL-1.
5. Transfer 50 µL of cell suspension to a 96-well plate cavity.6. Incubate for 10 min.7. Add 200 µL PBS++, centrifuge for 8 min at 300 × g and
discard the supernatant.8. Resuspend in 55 µL PBS++ containing the appropriate
antibody concentration (see Table 1).9. Incubate for 30 min in the dark.10. Add 200 µL PBS++, centrifuge for 8 min at 300 × g and
discard the supernatant.11. If using fluorescent dye labeled primary antibodies, proceed
to step 13.
April 2021 | Volume 12 | Article 648283
Dorschner et al. Comprehensive Workflow to Investigate p75NTR
12. If using primary-secondary staining:
a. Wash cells again with 200 µL PBS++.
b. Resuspend in 55 µL PBS++ containing the appropriatesecondary antibody (see Table 1).
c. Incubate for 30 min in the dark.
d. Add 200 µL PBS++, centrifuge for 8 min at 300 × g anddiscard the supernatant.
13. Resuspend in 200 µL PBS++.
14. Transfer to a FACS tube and add an equal amount of PBS-DAPIresulting in a working DAPI concentration of 0.05 µg µL-1.
15. Flow cytometry was performed on an LSR II flow cytometer(BD Biosciences). Data were analyzed using FlowJo (Version10.6.1, BD Biosciences).
Critical Parameters
• An important step when handling immune cells for flowcytometry consists in blocking receptors that may bind Fcparts of immunoglobulins. FcR blocking reagents shouldalways be included to prevent unspecific antibody binding.
• Remember to include unstained and isotype controls.• When staining with multiple dyes, compensation forinterfering fluorescence signals is recommended.
• Typical DAPI working concentrations range from 0.05-2 µgµL-1. Although general recommendations on the use of DAPIin flow cytometry exist, working concentrations should bevalidated in the specific experimental condition.
• Based on their fluorescence intensity, different cell subsets canbe sorted [for suitable protocols see e.g. (51, 52)]. Thisapproach may be used to enrich populations with certainexpression levels of the protein of interest. The success rates ofsubsequent IP experiments may increase because the depletionof non-expressing cells reduces the background noise.
Immunofluorescence
1. Coat sterile precision coverslips (Carl Roth) with poly-L-lysine (Merck)
a. Add 0.01% (v/v) poly-L-lysine solution to coverslips(40 µL cm-2).
b. Incubate for 5min at room temperature on a rocking platform.
c. Remove poly-L-lysine solution and rinse with doubledistilled water.
d. Allow coated coverslips to dry for at least 2 hours under asterile hood before further use.
2. Grow cells overnight on poly-L-lysine coated coverslips with at adensity of 5 × 10⁴ A375 cells cm-2 or 1 × 10⁵ PMDC05 cells cm-2.
3. Wash A375 coverslips three times by gentle addition of HBSS(containing calcium, magnesium)
a. PMDC05 coverslips were centrifuged in 24-well plates at300 × g for 5 min at each washing step.
4. Fix cells in 4% (w/v) PFA solution for 15 min at 37°C.
5. Remove 4% (w/v) PFA solution and wash cells three times for5 min with HBSS on a shaker.
Frontiers in Immunology | www.frontiersin.org 5
6. Counterstain the membrane with WGA (wheat germagglutinin; 5 µg mL-1) in HBSS for 10 min at 37°C.
7. Wash A375 cells three times in HBSS for 5 min on a rockingplatform at medium speed.
a. Wash PMDC05 cells three times by centrifugation in 24-well plates at 300 × g for 5 min.
8. Optional permeabilization step:
a. Incubate cells for 15 min in Permeabilization Buffer.
b. Remove Permeabilization Buffer carefully.
9. Block A375 cells for 60 min in 1% (w/v) BSA in PBS andPMDC05 cells for 60 min in 1% (w/v) BSA in PBS containinghuman FCR Block (1:80), and 10% goat/mouse serum(depending on the dye-labeled primary and secondaryantibody).
10. Stain cells with the primary antibodies in 1% (w/v) BSA in PBS.
11. Incubate for 2 hours (A375) at RT or overnight (PMDC05) ina wet chamber in the dark at 4°C.
12. Wash A375 cells three times in HBSS for 5 min on a rockingplatform at medium speed.
a. Wash PMDC05 cells three times by centrifugation in 24-well plates at 300 × g for 5 min.
13. Stain cells with the secondary antibody in 1% (w/v) BSA in PBS.
14. Incubate for 60 min at RT in a wet chamber in the dark.
15. Wash A375 cells three times in HBSS for 5 min on a rockingplatform at medium speed.
a. Wash PMDC05 cells three times by centrifugation in 24-well plates at 300 × g for 5 min.
16. Counterstain DNA with 1 µg Hoechst 33342 mL-1 in HBSSfor 15 min at 37°C.
17. Wash A375 cells twice in HBSS for 5 min and once in distilledwater on a rocking platform at medium speed.
a. Wash PMDC05 cells twice in HBSS and once in distilled waterby centrifugation in 24-well plates at 300 × g for 5 min.
18. Remove coverslips carefully andmount them with VECTASHIELDAntifade Mounting Medium on glass slides.
Microscopy was performed according to Weidemuth et al. (53).Briefly, stained cellswere imagedwithaLeica SP5 inversemicroscope(Leica).Confocal imageswere collectedat405, (488), 543and594 nmwith a 63 ×NA1.4 objective lens. Image acquisition, shutter, Z-axisposition, laser lines, and confocal systemwere all controlled by LeicaLASAF software. Equivalent exposure conditionswere used betweensamples. Depending on cell density, a digital zoom was applied topresent numerous cells per image. Images were analyzed using Fijisoftware (54). Image processing includes amedianfilterwith a radiusof 1 pixel to subtract background, and equal brightness and contrastadjustments between the samples.
Critical Parameters
• PMDC05 cells basically grow in suspension and thereforeadhere to coated coverslips weakly. To avoid losing cellsduring the staining procedure shortened washing andcentrifugation is mandatory. That might affect cell integrity
April 2021 | Volume 12 | Article 648283
Dorschner et al. Comprehensive Workflow to Investigate p75NTR
and thus antibody localization. The risk of losing adherentA375 cells after fixation is minimal.
• Permeabilization and fixation chemicals might influenceepitope accessibility and therefore antibody binding.Different protocols for permeabilization and fixation [e.g.(55)] may be tried to achieve optimal results.
Protocols for Steps 2 and 3—Immunoprecipitation and Analysis by MassSpectrometry and Western BlottingImmunoprecipitation
1. Perform all steps on ice/at 4°C (unless indicated otherwise).
2. Resuspend 1.5 mg magnetic protein G Dynabeads in PBS in1.5 mL reaction tube.
3. Wash beads in following procedure
a . Put on a stat ic magnet (e .g . DYNAL MPC-S,Thermo Fisher Scientific), collect beads by incubation for5 min.
b. Carefully aspirate supernatant and discard withoutdisturbing collected beads.
c. Remove bead containing reaction tube from static magnet.
d. Resuspend beads by gently pipetting up and down in 500µL PBS and repeat washing steps from a to c twice.
4. For antibodies MLR2 and D4B3:
a. Prepare 200 µL PBS containing 2 µg D4B3 and 10 µgMLR2, respectively.
b. resuspend beads by gently pipetting up and down inantibody coupling solution.
5. For antibody ME20.4:
a. resuspend beads gently in 10 mL serum free hybridomaculture supernatant.
6. Prepare coupling solutions containing the same concentrationof isotype control antibody.
a. resuspend beads by gently pipetting up and down inantibody coupling solution.
7. Incubate magnetic beads for 2 h at room temperature underconstant agitation to prevent the beads from settling down.
8. Put on a static magnet, collect beads by incubation for 5 min.
9. Carefully aspirate supernatant and discard.
10. Remove bead containing reaction tube from static magnet.
11. Add 200 µL protein lysates (corresponding to 2 × 10⁷ cells)and adjust volume to 500 µL by adding lysis buffer, ifnecessary.
12. Incubate overnight under constant agitation.
13. Put on a static magnet, collect beads by incubation for 5 min.
14. Carefully aspirate supernatant and discard.
15. Wash with lysis buffer
a. Remove bead containing reaction tube from static magnet.
b. Resuspend beads by gently pipetting up and down in 500 µLlysis buffer.
Frontiers in Immunology | www.frontiersin.org 6
c. Put on a static magnet, collect beads by incubation for 5 min.
d. Carefully aspirate supernatant and discard.
16. Wash with washing buffer
a. Remove bead containing reaction tube from static magnet.
b. Resuspend beads by gently pipetting up and down in 500µL washing buffer.
c. Put on a static magnet, collect beads by incubation for 5 min.
d. Carefully aspirate supernatant and discard.
e. repeat steps a to d once.
17. Remove bead containing reaction tube from static magnet.
18. Resuspend beads in 100 µL elution buffer.
19. Incubate at roomtemperatureunder constant agitation for 10min.
20. Put on a static magnet, collect beads by incubation for 5 min.
21. Carefully aspirate and save eluate (fraction E1).
22. For a second elution (fraction E2), repeat steps 17-21.
23. Resuspend beads in 100 µL SDS sample buffer.
24. Heat to 95°C and incubate for 5 min under constant agitation.
25. Put on a static magnet, collect beads by incubation for 5 minand save eluate (fraction col).
Critical Parameters
• Careful resuspension of magnetic beads ensures the beadintegrity. But especially after coupling antibodies, harshtreatment, e.g. vortexing, must be avoided to preserve stablebinding and capture.
• Addition of detergent to all washing solutions and couplingbuffers prevents clumping of beads and may reduce unspecificbinding if downstream applications permit this.
• For mass spectrometry, any detergent must be washed outbefore analysis. This is ensured by washing and elution indetergent-free buffer.
• If captured protein amounts are low, consider washing indetergent-free buffers. The use of crosslinking agents, e.g.dithiobis succinimidyl propionate, is compatible with manydownstream applications.
• Heating protein samples is a critical step when eluting in SDSsample buffer. Hydrophobic membrane proteins mayprecipitate when heated above 70°C. Avoid long incubationtimes at high temperatures as peptide bonds may hydrolyze.
SDS Polyacrylamide Gel Electrophoresis, WesternBlotting and Membrane Staining
1. Add 10 µL 2× SDS sample buffer to 10 µL sample solution.2. Incubate at 95°C for 10 min under constant agitation.3. Load samples and protein standard on gels and run
electrophoresis for 35 min keeping voltage constantly at200 V.
4. Transfer gel proteins to Immobilon-P transfer membrane ina wet chamber for 90 min keeping voltage constantly at30 V.
April 2021 | Volume 12 | Article 648283
Dorschner et al. Comprehensive Workflow to Investigate p75NTR
5. Perform all following steps under constant agitation (e.g. ona rocking platform).
6. Wash membrane three times for 5 min in 20 mL TBS-T.7. block membrane in 20 mL TBS-T-M for 15 min at room
temperature.8. Incubate with D4B3 antibody buffer (1:1000 in 4 mL TBS-T-
M) overnight at 4°C.9. Wash membrane three times for 5 min in 20 mL TBS-T.10. Incubate in secondary antibody solution (anti rabbit-HRP,
1:10,000 in 10 mL TBS-T-M) for 1 hour at roomtemperature.
11. Wash membrane three times for 5 min in 20 mL TBS-T.12. Add Lumi-Light PLUS western blotting substrate (10-15 µL
cm-2) to PVDF membrane.13. Detect signal on the Azure c600 imaging device (Azure
Biosystems).
Critical Parameters
• Addition of dyes to SDS sample buffers may ease loadingprotein samples onto gels.
• Some proteins may be heat-sensitive (see above). Lowertemperatures if necessary.
• Larger proteins transfer from gel to membrane more slowlythan smaller ones. Protein transfer may be assessed by gelstaining with Coomassie or silver-based dyes. Transfer timesmay be extended if protein transfer is insufficient. Membraneswith small pore sizes (0.22 µm) may be sensible when smallerproteins are lost during transfer.
• If capture and detection antibody are derived from the samespecies HRP-linked protein A/G may be used instead of asecondary antibody. This approach minimizes unspecificdetection of denatured capture antibodies (Figure 3).
• A positive control is recommended when sampling unknownantibodies in western blot. These positive controls can bemanufactured from cell lines/tissues with a well detectableexpression of the protein in question. In our case, an exampleis cell line A875. If such a cell line or tissue is not available analternative strategy is the generation of a cell line with atransgenic expression (see Supplementary Methods).
Mass Spectrometry
1. For information on the instrumentation and softwareapplied see Table 2.
2. Resuspend beads in 100-200 µL suitable buffer forproteolytic digestion (e.g. 20-50 mM Tris-HCl or HEPESpH 7.5).
3. Add 2 µL sequencing grade Trypsin (100 ng µL-1) andincubate overnight (12-18h) at 37°C in a shaker to avoidsettling of the beads.
4. Add additional 2 µL sequencing grade Trypsin (100 ng µL-1)and incubate again overnight at 37°C in a shaker.
5. Add 2 µL sequencing grade Lys-C (e.g. 50 ng µL-1 for rLys-Cfrom Promega) and incubate again overnight at 37°C in ashaker.
Frontiers in Immunology | www.frontiersin.org 7
6. Spin-down beads and collect supernatant.7. Acidify supernatant with 2% TFA (pH<2) and desalt on C18
ultramicro column (e.g. Nest Group or Harvard ScientificUltramicro Spin-Columns C18) according to themanufacturer’s instructions (61).
8. Dry the eluate of the desalting column in a speed vac andstore the dry peptide mixture at -20°C until LC-MS/MSanalysis.
9. Dissolve the peptide mixture in an appropriate volumeformic acid (final concentration 3.5-4.0%) and transfer thesolution into an HPLC vial for LC-MSMS analysis.
10. Proteomic LC-MS/MS is commonly performed with ananoflow UPLC system hyphenated directly to a massspectrometer. Low flow rates of 200-300 nL min-1 andlinear gradients of water, 0.1% formic acid (A) andacetonitrile, 0.1% formic acid achieve the high sensitivityrecommended for this kind of analysis. Commonly the massspectrometer is operated in data dependent acquisitionmode selecting the most intense peptide ions forfragmentation automatically.
11. The peptide fragmentation data is extracted from the rawMS data files and submitted to a data interpretation programthat identifies the peptides and the proteins present in thesample.
12. Quantification of proteins can be performed to gain insightinto quantitative changes between samples rather thanjudgment by presence or absence of proteins todifferentiate true interactors from experimental background.
13. To support data interpretation the enrichment of proteinidentifications with additional information, e.g. GOmolecular function or localization, may prove helpful andsuitable commercial and academic programs are available.
Critical Parameters
• The protease quality is essential for efficiency and specificity ofthe digestion. Sequencing grade proteases are recommended.
• Trypsin is generally available as stabilized (chemicallymodified) enzyme that reduces auto-digestion of the enzyme.
• Lys-C is available as native and recombinant enzyme, and thespecific activity (U mg-1) may vary depending on themanufacturer.
• Speed of the shaker should be just intense enough to keep thebeads in suspension.
• Proteomic LC-MS/MS is commonly performed with nanoflowUPLC system operated at flow rates of 200-300 nL min-1 withlinear gradients of water, 0.1% formic acid (A) and acetonitrile,0.1% formic acid. Different companies offer this kind of LCsystems and specific parameters for equilibration time,gradient steepness and handling may apply.
• Different mass spectrometers are suitable for massspectrometric analysis of complex peptide mixtures anddiffer in resolution, acquisition speed and peptidefragmentation methodology. In general, a typical approachfor the bottom-up proteomic LC-MS/MS analysis is thefragmentation of the most intense multiply charged (z = +2,
April 2021 | Volume 12 | Article 648283
Dorschner et al. Comprehensive Workflow to Investigate p75NTR
+3,…, +5) peptide ions (TopN) in data-dependent acquisitionmode.
• Peptide and protein identification from mass spectrometricraw data requires extraction of fragment spectra, matching ofexperimental spectra with theoretical spectra or spectrallibraries and a variety of academic and commercial softwareare available (56, 59, 60, 62).
RESULTS
Step 1—p75NTR Expression by TaqManand p75NTR Detection by AntibodiesD4B3, ME20.4 and MLR2A prerequisite for the analysis of protein-protein interactions isthe detection of p75NTR expression on RNA and protein level.The p75NTR gene has six exons, as annotated in the referencetranscript NM_002507.3 (63). We used four different TaqManprobes covering the exon boundaries 1-2, 2-3, 3-4, and 4-5, andone covering gapdh for quantification of RNA expression. Allanalyzed exons are expressed in cell lines A375 and PMDC05with an average expression compared to gapdh of 0.26 and0.29%, respectively, indicating a low expression in both cell lines.
We investigated expression on protein level in melanoma cellline A375 using three different p75NTR specific antibodies,D4B3 (rabbit IgG), ME20.4 (mouse IgG1) and MLR2 (mouseIgG2a). Cells were prepared and labeled for flow cytometryaccording to protocol. In a strict gating strategy with twosinglet gates and a DAPI-based dead cell exclusion gate(Figure 1A), each antibody exhibited a specific staining patterncompared to unstained and isotype control labeled cells(Figures 1B–D). The shoulder in p75NTR graphs hints at adistinct A375 population with increased p75NTR antibodybinding. Immunofluorescence microscopy revealed that only asubset of A375 cells stained positive for p75NTR (Figures 1E–G).
Frontiers in Immunology | www.frontiersin.org 8
The ME20.4 staining (Figure 1F) appeared slightly fainter incomparison with D4B3 and MLR2 stainings (Figures 1E, G).Isotype controls and single channel images as well as images ofpermeabilized cells are provided in the supplementary information(Figures S1, S2).
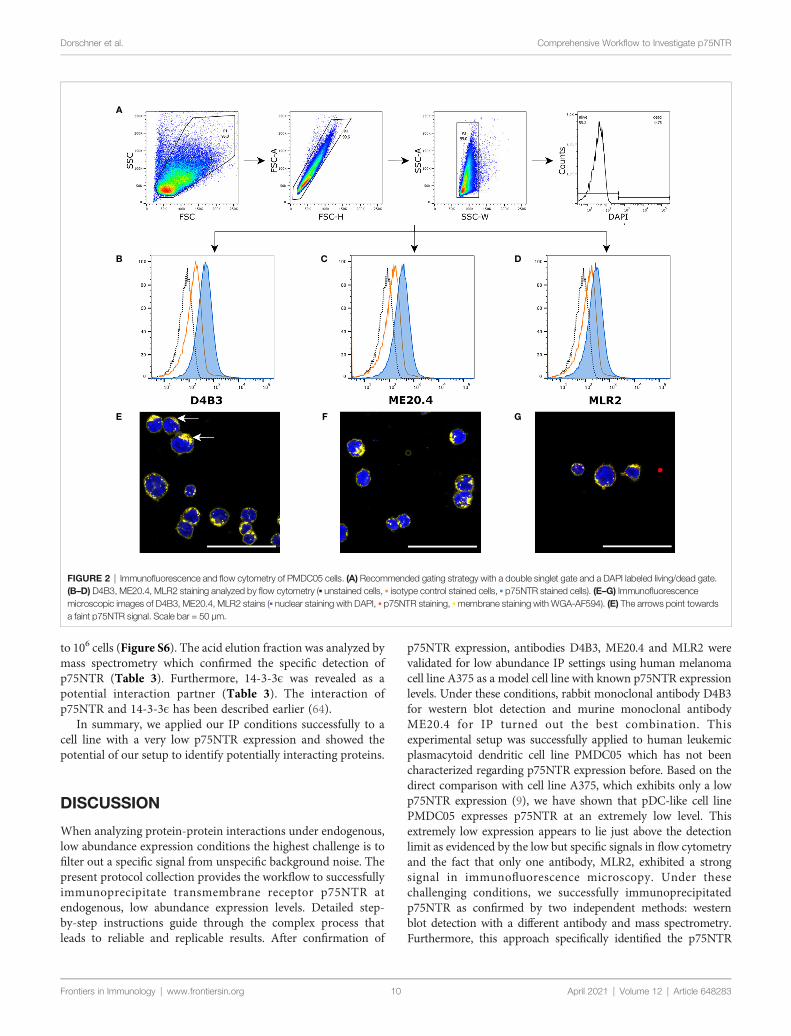
The same approach was chosen to analyze p75NTR expressionin pDC-like cell line PMDC05. Applying the same gating strategy(Figure 2A), all three antibodies detected a specific signal in thiscell line (Figures 2B–D). In comparison to A375 cells, theprominent shoulder in the graphs is missing and medianfluorescent intensity is lower but different from controls.Immunofluorescence microscopy is rather challenging due tothe non-adherent nature of PMDC05. An additionalcentrifugation step after each washing was included in ourprotocol. D4B3 exhibited a faint signal (Figure 2E). ME20.4staining resulted in no detectable signal (Figure 2F). Only,MLR2 was able to provide a stronger signal (Figure 2G). Thecorresponding isotype control stainings, single channel images,and images of permeabilized cells are shown in Figures S3 and S4.
Summarizing our findings, both cell lines expressed low levels ofp75NTR mRNA. On protein level, PMDC05 cells appeared toexpress even less p75NTR than A375 cells. Compared to cell lineswith no and high p75NTR expression (see SupplementaryInformation and Figure S5), the observed slight increases influorescence intensity do correspond to low p75NTR expression.This conclusion was drawn after careful interpretation of expressiondata from all cell lines (for details see Supplementary Results).
Step 2—Validation of Antibodies and IPConditions in Model Cell Line A375For this purpose, lysates from 2 × 10⁷ A375 cells were preparedand used for immunoprecipitation experiments with antibodiesD4B3, ME20.4 and MLR2. Immunoprecipitation was performedaccording to protocol. Great effort was put into gentle butcomplete resuspension of the beads. Acid elution and SDSsample buffer elution fractions were loaded on a gel for SDS
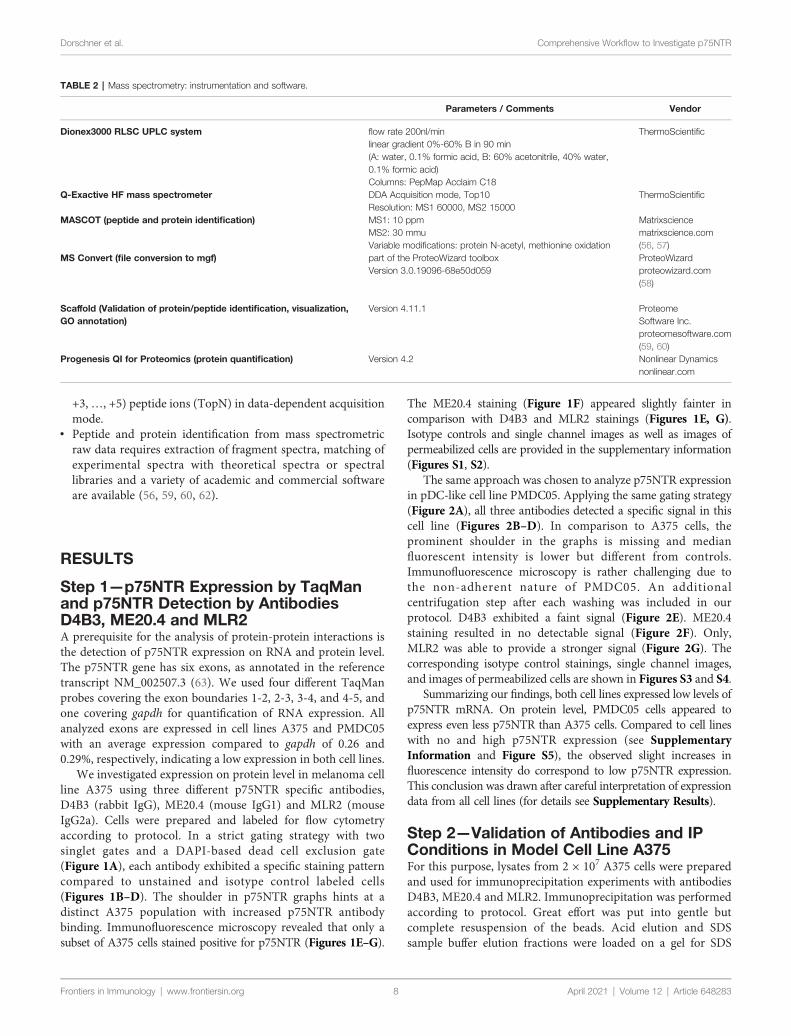
TABLE 2 | Mass spectrometry: instrumentation and software.
Parameters / Comments Vendor
Dionex3000 RLSC UPLC system flow rate 200nl/min ThermoScientificlinear gradient 0%-60% B in 90 min(A: water, 0.1% formic acid, B: 60% acetonitrile, 40% water,0.1% formic acid)Columns: PepMap Acclaim C18
Q-Exactive HF mass spectrometer DDA Acquisition mode, Top10 ThermoScientificResolution: MS1 60000, MS2 15000
MASCOT (peptide and protein identification) MS1: 10 ppm MatrixscienceMS2: 30 mmu matrixscience.comVariable modifications: protein N-acetyl, methionine oxidation (56, 57)
MS Convert (file conversion to mgf) part of the ProteoWizard toolbox ProteoWizardVersion 3.0.19096-68e50d059 proteowizard.com
(58)
Scaffold (Validation of protein/peptide identification, visualization,GO annotation)
Version 4.11.1 ProteomeSoftware Inc.proteomesoftware.com(59, 60)
Progenesis QI for Proteomics (protein quantification) Version 4.2 Nonlinear Dynamicsnonlinear.com
April 2021 | Volu
me 12 | Article 648283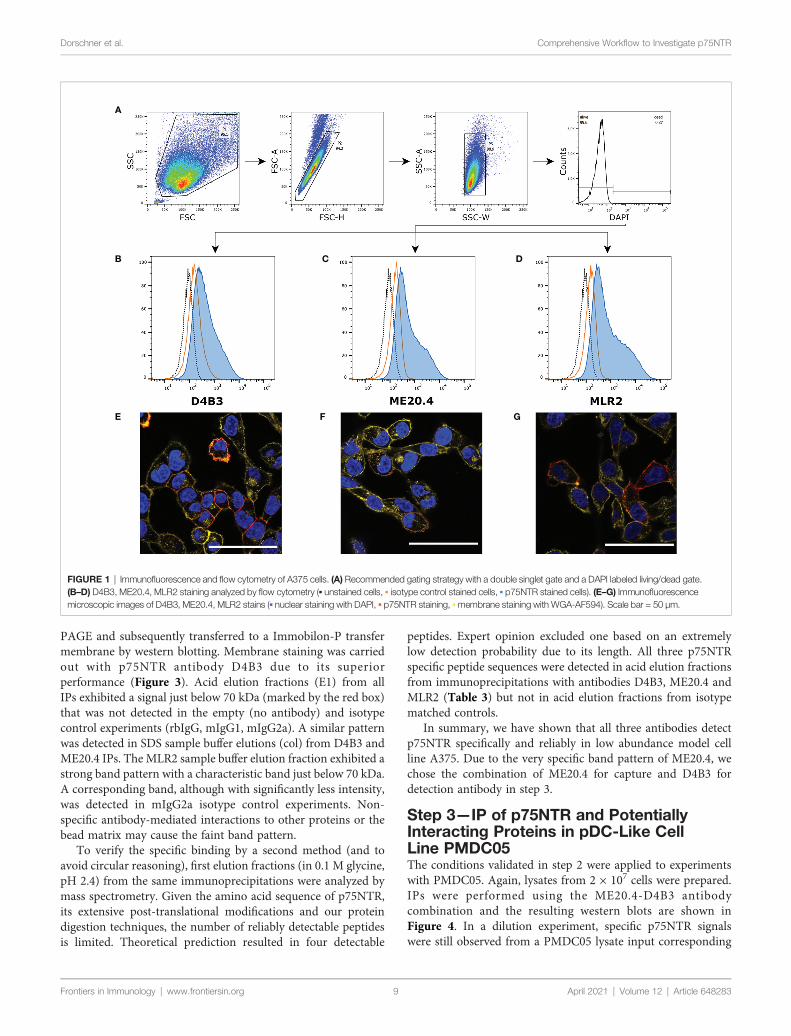
Dorschner et al. Comprehensive Workflow to Investigate p75NTR
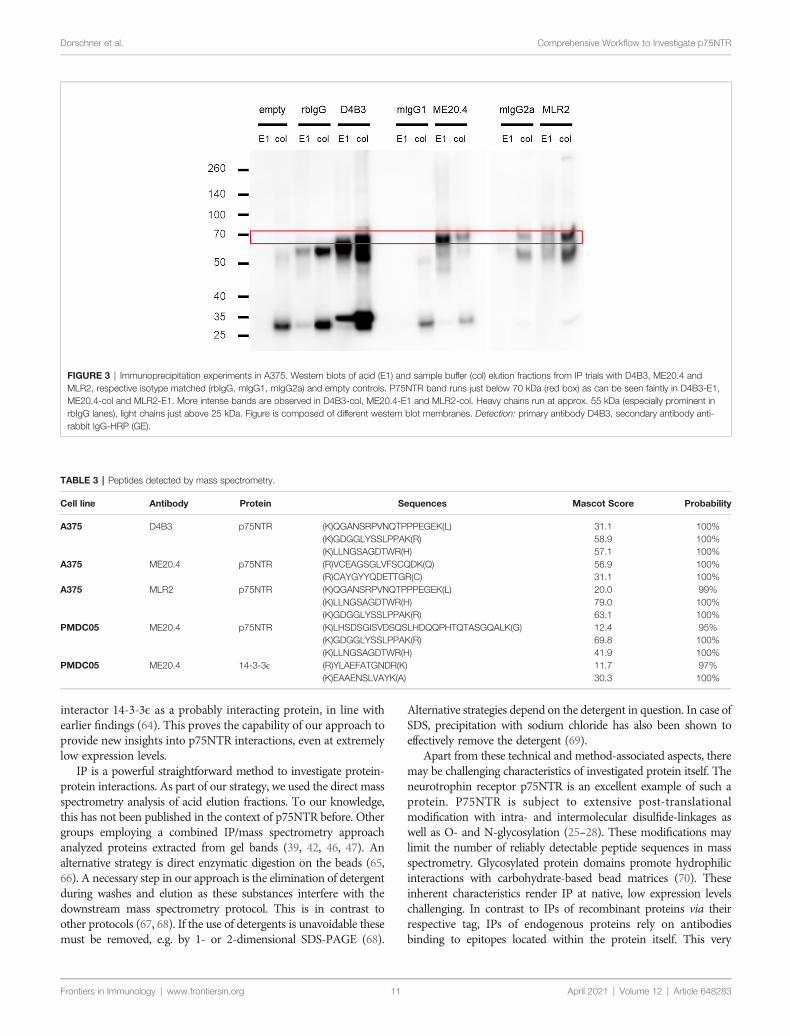
PAGE and subsequently transferred to a Immobilon-P transfermembrane by western blotting. Membrane staining was carriedout with p75NTR antibody D4B3 due to its superiorperformance (Figure 3). Acid elution fractions (E1) from allIPs exhibited a signal just below 70 kDa (marked by the red box)that was not detected in the empty (no antibody) and isotypecontrol experiments (rbIgG, mIgG1, mIgG2a). A similar patternwas detected in SDS sample buffer elutions (col) from D4B3 andME20.4 IPs. The MLR2 sample buffer elution fraction exhibited astrong band pattern with a characteristic band just below 70 kDa.A corresponding band, although with significantly less intensity,was detected in mIgG2a isotype control experiments. Non-specific antibody-mediated interactions to other proteins or thebead matrix may cause the faint band pattern.
To verify the specific binding by a second method (and toavoid circular reasoning), first elution fractions (in 0.1 M glycine,pH 2.4) from the same immunoprecipitations were analyzed bymass spectrometry. Given the amino acid sequence of p75NTR,its extensive post-translational modifications and our proteindigestion techniques, the number of reliably detectable peptidesis limited. Theoretical prediction resulted in four detectable
Frontiers in Immunology | www.frontiersin.org 9
peptides. Expert opinion excluded one based on an extremelylow detection probability due to its length. All three p75NTRspecific peptide sequences were detected in acid elution fractionsfrom immunoprecipitations with antibodies D4B3, ME20.4 andMLR2 (Table 3) but not in acid elution fractions from isotypematched controls.
In summary, we have shown that all three antibodies detectp75NTR specifically and reliably in low abundance model cellline A375. Due to the very specific band pattern of ME20.4, wechose the combination of ME20.4 for capture and D4B3 fordetection antibody in step 3.
Step 3—IP of p75NTR and PotentiallyInteracting Proteins in pDC-Like CellLine PMDC05The conditions validated in step 2 were applied to experimentswith PMDC05. Again, lysates from 2 × 10⁷ cells were prepared.IPs were performed using the ME20.4-D4B3 antibodycombination and the resulting western blots are shown inFigure 4. In a dilution experiment, specific p75NTR signalswere still observed from a PMDC05 lysate input corresponding
A
B C D
E F G
FIGURE 1 | Immunofluorescence and flow cytometry of A375 cells. (A) Recommended gating strategy with a double singlet gate and a DAPI labeled living/dead gate.(B–D) D4B3, ME20.4, MLR2 staining analyzed by flow cytometry (▪ unstained cells, ▪ isotype control stained cells, ▪ p75NTR stained cells). (E–G) Immunofluorescencemicroscopic images of D4B3, ME20.4, MLR2 stains (▪ nuclear staining with DAPI, ▪ p75NTR staining, ▪membrane staining with WGA-AF594). Scale bar = 50 µm.
April 2021 | Volume 12 | Article 648283
Dorschner et al. Comprehensive Workflow to Investigate p75NTR
to 106 cells (Figure S6). The acid elution fraction was analyzed bymass spectrometry which confirmed the specific detection ofp75NTR (Table 3). Furthermore, 14-3-3ϵ was revealed as apotential interaction partner (Table 3). The interaction ofp75NTR and 14-3-3ϵ has been described earlier (64).
In summary, we applied our IP conditions successfully to acell line with a very low p75NTR expression and showed thepotential of our setup to identify potentially interacting proteins.
DISCUSSION
When analyzing protein-protein interactions under endogenous,low abundance expression conditions the highest challenge is tofilter out a specific signal from unspecific background noise. Thepresent protocol collection provides the workflow to successfullyimmunoprecipitate transmembrane receptor p75NTR atendogenous, low abundance expression levels. Detailed step-by-step instructions guide through the complex process thatleads to reliable and replicable results. After confirmation of
Frontiers in Immunology | www.frontiersin.org 10
p75NTR expression, antibodies D4B3, ME20.4 and MLR2 werevalidated for low abundance IP settings using human melanomacell line A375 as a model cell line with known p75NTR expressionlevels. Under these conditions, rabbit monoclonal antibody D4B3for western blot detection and murine monoclonal antibodyME20.4 for IP turned out the best combination. Thisexperimental setup was successfully applied to human leukemicplasmacytoid dendritic cell line PMDC05 which has not beencharacterized regarding p75NTR expression before. Based on thedirect comparison with cell line A375, which exhibits only a lowp75NTR expression (9), we have shown that pDC-like cell linePMDC05 expresses p75NTR at an extremely low level. Thisextremely low expression appears to lie just above the detectionlimit as evidenced by the low but specific signals in flow cytometryand the fact that only one antibody, MLR2, exhibited a strongsignal in immunofluorescence microscopy. Under thesechallenging conditions, we successfully immunoprecipitatedp75NTR as confirmed by two independent methods: westernblot detection with a different antibody and mass spectrometry.Furthermore, this approach specifically identified the p75NTR
A
B C D
E F G
FIGURE 2 | Immunofluorescence and flow cytometry of PMDC05 cells. (A) Recommended gating strategy with a double singlet gate and a DAPI labeled living/dead gate.(B–D) D4B3, ME20.4, MLR2 staining analyzed by flow cytometry (▪ unstained cells, ▪ isotype control stained cells, ▪ p75NTR stained cells). (E–G) Immunofluorescencemicroscopic images of D4B3, ME20.4, MLR2 stains (▪ nuclear staining with DAPI, ▪ p75NTR staining, ▪membrane staining with WGA-AF594). (E) The arrows point towardsa faint p75NTR signal. Scale bar = 50 µm.
April 2021 | Volume 12 | Article 648283
Dorschner et al. Comprehensive Workflow to Investigate p75NTR
interactor 14-3-3ϵ as a probably interacting protein, in line withearlier findings (64). This proves the capability of our approach toprovide new insights into p75NTR interactions, even at extremelylow expression levels.
IP is a powerful straightforward method to investigate protein-protein interactions. As part of our strategy, we used the direct massspectrometry analysis of acid elution fractions. To our knowledge,this has not been published in the context of p75NTR before. Othergroups employing a combined IP/mass spectrometry approachanalyzed proteins extracted from gel bands (39, 42, 46, 47). Analternative strategy is direct enzymatic digestion on the beads (65,66). A necessary step in our approach is the elimination of detergentduring washes and elution as these substances interfere with thedownstream mass spectrometry protocol. This is in contrast toother protocols (67, 68). If the use of detergents is unavoidable thesemust be removed, e.g. by 1- or 2-dimensional SDS-PAGE (68).
Frontiers in Immunology | www.frontiersin.org 11
Alternative strategies depend on the detergent in question. In case ofSDS, precipitation with sodium chloride has also been shown toeffectively remove the detergent (69).
Apart from these technical and method-associated aspects, theremay be challenging characteristics of investigated protein itself. Theneurotrophin receptor p75NTR is an excellent example of such aprotein. P75NTR is subject to extensive post-translationalmodification with intra- and intermolecular disulfide-linkages aswell as O- and N-glycosylation (25–28). These modifications maylimit the number of reliably detectable peptide sequences in massspectrometry. Glycosylated protein domains promote hydrophilicinteractions with carbohydrate-based bead matrices (70). Theseinherent characteristics render IP at native, low expression levelschallenging. In contrast to IPs of recombinant proteins via theirrespective tag, IPs of endogenous proteins rely on antibodiesbinding to epitopes located within the protein itself. This very
FIGURE 3 | Immunoprecipitation experiments in A375. Western blots of acid (E1) and sample buffer (col) elution fractions from IP trials with D4B3, ME20.4 andMLR2, respective isotype matched (rbIgG, mIgG1, mIgG2a) and empty controls. P75NTR band runs just below 70 kDa (red box) as can be seen faintly in D4B3-E1,ME20.4-col and MLR2-E1. More intense bands are observed in D4B3-col, ME20.4-E1 and MLR2-col. Heavy chains run at approx. 55 kDa (especially prominent inrbIgG lanes), light chains just above 25 kDa. Figure is composed of different western blot membranes. Detection: primary antibody D4B3, secondary antibody anti-rabbit IgG-HRP (GE).
TABLE 3 | Peptides detected by mass spectrometry.
Cell line Antibody Protein Sequences Mascot Score Probability
A375 D4B3 p75NTR (K)QGANSRPVNQTPPPEGEK(L)(K)GDGGLYSSLPPAK(R)(K)LLNGSAGDTWR(H)
31.158.957.1
100%100%100%
A375 ME20.4 p75NTR (R)VCEAGSGLVFSCQDK(Q)(R)CAYGYYQDETTGR(C)
56.931.1
100%100%
A375 MLR2 p75NTR (K)QGANSRPVNQTPPPEGEK(L)(K)LLNGSAGDTWR(H)(K)GDGGLYSSLPPAK(R)
20.079.063.1
99%100%100%
PMDC05 ME20.4 p75NTR (K)LHSDSGISVDSQSLHDQQPHTQTASGQALK(G)(K)GDGGLYSSLPPAK(R)(K)LLNGSAGDTWR(H)
12.469.841.9
95%100%100%
PMDC05 ME20.4 14-3-3ϵ (R)YLAEFATGNDR(K)(K)EAAENSLVAYK(A)
11.730.3
97%100%
A
pril 2021 | Volume 12 | Ar ticle 648283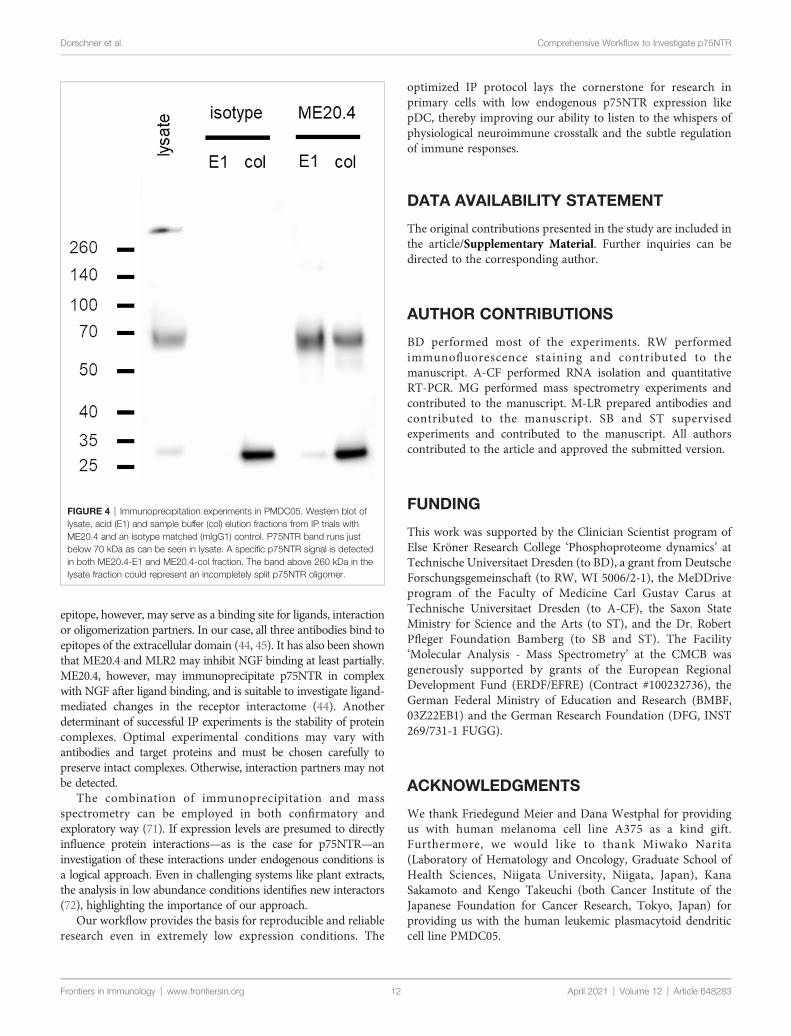
Dorschner et al. Comprehensive Workflow to Investigate p75NTR
epitope, however, may serve as a binding site for ligands, interactionor oligomerization partners. In our case, all three antibodies bind toepitopes of the extracellular domain (44, 45). It has also been shownthat ME20.4 and MLR2 may inhibit NGF binding at least partially.ME20.4, however, may immunoprecipitate p75NTR in complexwith NGF after ligand binding, and is suitable to investigate ligand-mediated changes in the receptor interactome (44). Anotherdeterminant of successful IP experiments is the stability of proteincomplexes. Optimal experimental conditions may vary withantibodies and target proteins and must be chosen carefully topreserve intact complexes. Otherwise, interaction partners may notbe detected.
The combination of immunoprecipitation and massspectrometry can be employed in both confirmatory andexploratory way (71). If expression levels are presumed to directlyinfluence protein interactions—as is the case for p75NTR—aninvestigation of these interactions under endogenous conditions isa logical approach. Even in challenging systems like plant extracts,the analysis in low abundance conditions identifies new interactors(72), highlighting the importance of our approach.
Our workflow provides the basis for reproducible and reliableresearch even in extremely low expression conditions. The
Frontiers in Immunology | www.frontiersin.org 12
optimized IP protocol lays the cornerstone for research inprimary cells with low endogenous p75NTR expression likepDC, thereby improving our ability to listen to the whispers ofphysiological neuroimmune crosstalk and the subtle regulationof immune responses.
DATA AVAILABILITY STATEMENT
The original contributions presented in the study are included inthe article/Supplementary Material. Further inquiries can bedirected to the corresponding author.
AUTHOR CONTRIBUTIONS
BD performed most of the experiments. RW performedimmunofluorescence staining and contributed to themanuscript. A-CF performed RNA isolation and quantitativeRT-PCR. MG performed mass spectrometry experiments andcontributed to the manuscript. M-LR prepared antibodies andcontributed to the manuscript. SB and ST supervisedexperiments and contributed to the manuscript. All authorscontributed to the article and approved the submitted version.
FUNDING
This work was supported by the Clinician Scientist program ofElse Kröner Research College ‘Phosphoproteome dynamics’ atTechnische Universitaet Dresden (to BD), a grant from DeutscheForschungsgemeinschaft (to RW, WI 5006/2-1), the MeDDriveprogram of the Faculty of Medicine Carl Gustav Carus atTechnische Universitaet Dresden (to A-CF), the Saxon StateMinistry for Science and the Arts (to ST), and the Dr. RobertPfleger Foundation Bamberg (to SB and ST). The Facility‘Molecular Analysis - Mass Spectrometry’ at the CMCB wasgenerously supported by grants of the European RegionalDevelopment Fund (ERDF/EFRE) (Contract #100232736), theGerman Federal Ministry of Education and Research (BMBF,03Z22EB1) and the German Research Foundation (DFG, INST269/731-1 FUGG).
ACKNOWLEDGMENTS
We thank Friedegund Meier and Dana Westphal for providingus with human melanoma cell line A375 as a kind gift.Furthermore, we would like to thank Miwako Narita(Laboratory of Hematology and Oncology, Graduate School ofHealth Sciences, Niigata University, Niigata, Japan), KanaSakamoto and Kengo Takeuchi (both Cancer Institute of theJapanese Foundation for Cancer Research, Tokyo, Japan) forproviding us with the human leukemic plasmacytoid dendriticcell line PMDC05.
FIGURE 4 | Immunoprecipitation experiments in PMDC05. Western blot oflysate, acid (E1) and sample buffer (col) elution fractions from IP trials withME20.4 and an isotype matched (mIgG1) control. P75NTR band runs justbelow 70 kDa as can be seen in lysate. A specific p75NTR signal is detectedin both ME20.4-E1 and ME20.4-col fraction. The band above 260 kDa in thelysate fraction could represent an incompletely split p75NTR oligomer.
April 2021 | Volume 12 | Article 648283
Dorschner et al. Comprehensive Workflow to Investigate p75NTR
SUPPLEMENTARY MATERIAL
The Supplementary Material for this article can be found onlineat: https://www.frontiersin.org/articles/10.3389/fimmu.2021.648283/full#supplementary-material
Supplementary Figure 1 | Immunofluorescent images of A375 cells. Panelsshow single channel images of A375 nuclear staining with DAPI, p75NTR/isotypestaining, membrane staining with wheat germ agglutinin (WGA)-Alexa Fluor 594,and a merged channel image (▪ nuclear staining with DAPI, ▪ p75NTR staining, ▪membrane staining with WGA-AF594). (A) Staining with D4B3, (B) staining withMLR2, (C) staining with ME20.4. Scale bar = 50µm.
Supplementary Figure 2 | Immunofluorescent images of permeabilized A375cells. Panels show single channel images of A375 nuclear staining with DAPI,p75NTR/isotype staining, membrane staining with wheat germ agglutinin (WGA)-Alexa Fluor 594, and a merged channel image (▪ nuclear staining with DAPI, ▪p75NTR staining, ▪ membrane staining with WGA-AF594). Staining with D4B3,staining with MLR2, staining with ME20.4. Scale bar = 50µm.
Supplementary Figure 3 | Immunofluorescent images of PMDC05 cells. Panelsshow single channel images of PMDC05 nuclear staining with DAPI, p75NTR/isotype staining, membrane staining with wheat germ agglutinin (WGA)-Alexa Fluor594, and a merged channel image (▪ nuclear staining with DAPI, ▪ p75NTR staining,▪ membrane staining with WGA-AF594). (A) Staining with D4B3, (B) staining withMLR2, (C) staining with ME20.4. Scale bar = 50µm.
Supplementary Figure 4 | Immunofluorescent images of permeabilizedPMDC05 cells. Panels show single channel images of PMDC05 nuclear staining
Frontiers in Immunology | www.frontiersin.org 13
with DAPI, p75NTR/isotype staining, membrane staining with wheat germagglutinin (WGA)-Alexa Fluor 594, and a merged channel image (▪ nuclear stainingwith DAPI, ▪ p75NTR staining, ▪ membrane staining with WGA-AF594). Stainingwith D4B3, staining with MLR2, staining with ME20.4. Scale bar = 50µm.
Supplementary Figure 5 | p75NTR expression in different cell lines. (A) FACSanalysis of wildtype NIH/3T3, 293T and p75NTR overexpressing (OE) NIH/3T3 and293T. In WT-NIH/3T3, no fluorescence shift is observed, while WT-293T show aminimal expression indicated by the slight shift in fluorescence. In OE cells, GFPfluorescence indicates a uniform transduction, and D4B3 stainings show a bimodaldistribution. ▪ isotype control, ▪ p75NTR staining (B) left: D4B3 stainings of A375and PMDC05 (▪ isotype control, ▪ p75NTR staining); right: western blots comparingp75NTR expression in 293T-WT, 293T-OE, A375, B16 (murine melanoma),PMDC05 (numbers above the lanes correspond to the number of cells lysateswere prepared from); detection antibody: D4B3, exposure time is indicated belowthe blots.
Supplementary Figure 6 | p75NTR IP with reduced PMDC05 input. Westernblots of acid (E1) and sample buffer (col) elution fractions from IP trials withME20.4 and isotype matched control (CTL), and lysate. Numbers above fractionlabels indicate the number of cells used as IP input. At approx. 70 kDa (red box),specific signals for p75NTR are detected with as little as 106 cells. 15% of acideluate (E1), 30% of sample buffer eluate (col) and lysate of 106 cells were loadedonto the gel. Detection: primary antibody D4B3, secondary antibody anti-rabbitIgG-HRP (CST).
Supplementary Table 1 | Ordering information of applied reagents and chemicals.
Supplementary Table 2 | Ordering information of applied TaqMan assay probes.
REFERENCES
1. Kerschensteiner M, Stadelmann C, Dechant G, Wekerle H, Hohlfeld R.Neurotrophic cross-talk between the nervous and immune systems:implications for neurological diseases. Ann Neurol (2003) 53:292–304.doi: 10.1002/ana.10446
2. Langford D, Masliah E. Role of trophic factors on neuroimmunity inneurodegenerative infectious diseases. J Neurovirol (2002) 8:625–38.doi: 10.1080/13550280290100996
3. Nassenstein C, Kammertoens T, Veres TZ, Uckert W, Spies E, Fuchs B, et al.Neuroimmune crosstalk in asthma: dual role of the neurotrophin receptorp75NTR. J Allergy Clin Immunol (2007) 120:1089–96. doi: 10.1016/j.jaci.2007.07.007
4. Skaper SD. Nerve growth factor: a neuroimmune crosstalk mediator for allseasons. Immunology (2017) 151:1–15. doi: 10.1111/imm.12717
5. Freund-Michel V, Frossard N. The nerve growth factor and its receptors inairway inflammatory diseases. Pharmacol Ther (2008) 117:52–76.doi: 10.1016/j.pharmthera.2007.07.003
6. Minnone G, de Benedetti F, Bracci-Laudiero L. NGF and Its Receptors in theRegulation of Inflammatory Response. Int J Mol Sci (2017) 18:1028.doi: 10.3390/ijms18051028
7. Roux PP, Barker PA. Neurotrophin signaling through the p75 neurotrophinreceptor. Prog Neurobiol (2002) 67:203–33. doi: 10.1016/s0301-0082(02)00016-3
8. Frossard N, Freund V, Advenier C. Nerve growth factor and its receptors inasthma and inflammation. Eur J Pharmacol (2004) 500:453–65. doi: 10.1016/j.ejphar.2004.07.044
9. Fabricant RN, Larco JE de, Todaro GJ. Nerve growth factor receptors onhuman melanoma cells in culture. Proc Natl Acad Sci USA (1977) 74:565–9.doi: 10.1073/pnas.74.2.565
10. Sennikov SV, Alshevskaya AA, Zhukova J, Belomestnova I, Karaulov AV,Lopatnikova JA. Expression Density of Receptors as a Potent Regulator of CellFunction and Property in Health and Pathology. Int Arch Allergy Immunol(2019) 178:182–91. doi: 10.1159/000494387
11. Jiang Y, Chen G, Zhang Y, Lu L, Liu S, Cao X. Nerve growth factor promotesTLR4 signaling-induced maturation of human dendritic cells in vitro through
inducible p75NTR 1. J Immunol (2007) 179:6297–304. doi: 10.4049/jimmunol.179.9.6297
12. Bandoła J, Richter C, Ryser M, Jamal A, Ashton MP, Bonin Mv, et al.Neurotrophin Receptor p75NTR Regulates Immune Function of PlasmacytoidDendritic Cells. Front Immunol (2017) 8:981. doi: 10.3389/fimmu.2017.00981
13. Collin M, Bigley V. Human dendritic cell subsets: an update. Immunology(2018) 154:3–20. doi: 10.1111/imm.12888
14. Siller-Farfan JA, Dushek O. Molecular mechanisms of T cell sensitivity toantigen. Immunol Rev (2018) 285:194–205. doi: 10.1111/imr.12690
15. DeCaprio J, Kohl TO. Immunoprecipitation. Cold Spring Harb Protoc (2020)2020:pdb.top098509. doi: 10.1101/pdb.top098509
16. Ryu JY, Kim J, Shon MJ, Sun J, Jiang X, Lee W, et al. Profiling protein-proteininteractions of single cancer cells with in situ lysis and co-immunoprecipitation.Lab Chip (2019) 19:1922–8. doi: 10.1039/c9lc00139e
17. Slaastad H, Wu W, Goullart L, Kanderova V, Tjønnfjord G, Stuchly J, et al.Multiplexed immuno-precipitation with 1725 commercially availableantibodies to cellular proteins. Proteomics (2011) 11:4578–82. doi: 10.1002/pmic.201000744
18. Chen Y, Leng M, Gao Y, Zhan D, Choi JM, Song L, et al. A Cross-Linking-Aided Immunoprecipitation/Mass Spectrometry Workflow Reveals ExtensiveIntracellular Trafficking in Time-Resolved, Signal-Dependent EpidermalGrowth Factor Receptor Proteome. J Proteome Res (2019) 18:3715–30.doi: 10.1021/acs.jproteome.9b00427
19. Doppler W, Windegger M, Soratroi C, Tomasi J, Lechner J, Rusconi S, et al.Expression Level-Dependent Contribution of Glucocorticoid ReceptorDomains for Functional Interaction with STAT5. Mol Cell Biol (2001)21:3266–79. doi: 10.1128/MCB.21.9.3266-3279.2001
20. Stein BD, Herzig S, Martınez-Bartolome S, Lavallee-Adam M, Shaw RJ, YatesJR. Comparison of CRISPR Genomic Tagging for Affinity Purification andEndogenous Immunoprecipitation Coupled with Quantitative MassSpectrometry To Identify the Dynamic AMPKa2 Interactome. J ProteomeRes (2019) 18:3703–14. doi: 10.1021/acs.jproteome.9b00378
21. Bicocca VT, Tyner JW. Immunoprecipitation of ROR1. Bio Protoc (2013) 3:e904. doi: 10.21769/bioprotoc.904
22. Lee Y-R, Kang W, Kim Y-M. Detection of Interaction BetweenToll-Like Receptors and Other Transmembrane Proteins by Co-
April 2021 | Volume 12 | Article 648283
Dorschner et al. Comprehensive Workflow to Investigate p75NTR
immunoprecipitation Assay. Methods Mol Biol (2016) 1390:107–20.doi: 10.1007/978-1-4939-3335-8_7
23. Dubois C, Prevarskaya N. Western Blotting and Co-immunoprecipitation ofEndogenous STIM/ORAI and Protein Partners. Methods Mol Biol (2018)1843:107–13. doi: 10.1007/978-1-4939-8704-7_9
24. Marmorstein AD, Gan YC, Bonilha VL, Finnemann SC, Csaky KG,Rodriguez-Boulan E. Apical polarity of N-CAM and EMMPRIN in retinalpigment epithelium resulting from suppression of basolateral signalrecognition. J Cell Biol (1998) 142:697–710. doi: 10.1083/jcb.142.3.697
25. Grob PM, Berlot CH, Bothwell MA. Affinity labeling and partial purificationof nerve growth factor receptors from rat pheochromocytoma and humanmelanoma cells. Proc Natl Acad Sci USA (1983) 80:6819–23. doi: 10.1073/pnas.80.22.6819
26. Barker PA, Miller FD, Large TH, Murphy RA. Generation of the truncatedform of the nerve growth factor receptor by rat Schwann cells. Evidence forpost-translational processing. J Biol Chem (1991) 266:19113–9. doi: 10.1016/S0021-9258(18)55180-2
27. Yeaman C, Le Gall AH, Baldwin AN, Monlauzeur L, Le Bivic A, Rodriguez-Boulan E. The O-glycosylated stalk domain is required for apical sorting ofneurotrophin receptors in polarized MDCK cells. J Cell Biol (1997) 139:929–40. doi: 10.1083/jcb.139.4.929
28. Anastasia A, Barker PA, Chao MV, Hempstead BL. Detection of p75NTRTrimers: Implications for Receptor Stoichiometry and Activation. J Neurosci(2015) 35:11911–20. doi: 10.1523/JNEUROSCI.0591-15.2015
29. Marchetti D, Parikh N, Sudol M, Gallick GE. Stimulation of the proteintyrosine kinase c-Yes but not c-Src by neurotrophins in human brain-metastatic melanoma cells. Oncogene (1998) 16:3253–60. doi: 10.1038/sj.onc.1201877
30. Herrmann JL, Menter DG, Hamada J, Marchetti D, Nakajima M, NicolsonGL. Mediation of NGF-stimulated extracellular matrix invasion by the humanmelanoma low-affinity p75 neurotrophin receptor: melanoma p75 functionsindependently of trkA. Mol Biol Cell (1993) 4:1205–16. doi: 10.1091/mbc.4.11.1205
31. Valdo P, Stegagno C, Mazzucco S, Zuliani E, Zanusso G, Moretto G, et al.Enhanced expression of NGF receptors in multiple sclerosis lesions.J Neuropathol Exp Neurol (2002) 61:91–8. doi: 10.1093/jnen/61.1.91
32. Shan DE, Beck CE, Werrbach-Perez K, Perez-Polo JR. Reverse-phase high-performance liquid chromatography of nerve growth factor receptor-likeproteins identified with monoclonal antibodies. J Neurosci Res (1990)27:620–32. doi: 10.1002/jnr.490270423
33. Huber LJ, Chao MV. A potential interaction of p75 and trkA NGF receptorsrevealed by affinity crosslinking and immunoprecipitation. J Neurosci Res(1995) 40:557–63. doi: 10.1002/jnr.490400415
34. Zupan AA, Osborne PA, Smith CE, Siegel NR, Leimgruber RM, Johnson EM.Identification, purification, and characterization of truncated forms of thehuman nerve growth factor receptor. J Biol Chem (1989) 264:11714–20.doi: 10.1016/S0021-9258(18)80123-5
35. DiStefano PS, Johnson EM. Nerve growth factor receptors on cultured ratSchwann cells. J Neurosci (1988) 8:231–41. doi: 10.1523/JNEUROSCI.08-01-00231.1988
36. Monlauzeur L, Breuza L, Le Bivic A. Putative O-glycosylation sites and amembrane anchor are necessary for apical delivery of the humanneurotrophin receptor in Caco-2 cells. J Biol Chem (1998) 273:30263–70.doi: 10.1074/jbc.273.46.30263
37. Le Bivic A, Sambuy Y, Patzak A, Patil N, Chao M, Rodriguez-Boulan E. Aninternal deletion in the cytoplasmic tail reverses the apical localization ofhuman NGF receptor in transfected MDCK cells. J Cell Biol (1991) 115:607–18. doi: 10.1083/jcb.115.3.607
38. Grob PM, Ross AH, Koprowski H, Bothwell M. Characterization of the humanmelanoma nerve growth factor receptor. J Biol Chem (1985) 260:8044–9. doi:10.1016/S0021-9258(17)39561-3
39. Delacour D, Greb C, Koch A, Salomonsson E, Leffler H, Le Bivic A, et al.Apical sorting by galectin-3-dependent glycoprotein clustering. Traffic (2007)8:379–88. doi: 10.1111/j.1600-0854.2007.00539.x
40. Gargano N, Levi A, Alema’ S. Modulation of nerve growth factorinternalization by direct interaction between p75 and TrkA receptors.J Neurosci Res (1997) 50:1–12. doi: 10.1002/(SICI)1097-4547(19971001)50:1%3C1:AID-JNR1%3E3.0.CO;2-N
Frontiers in Immunology | www.frontiersin.org 14
41. DiStefano PS, Clagett-Dame M, Chelsea DM, Loy R. Developmentalregulation of human truncated nerve growth factor receptor. Ann Neurol(1991) 29:13–20. doi: 10.1002/ana.410290105
42. Shepheard SR, Chataway T, Schultz DW, Rush RA, Rogers M-L. Theextracellular domain of neurotrophin receptor p75 as a candidatebiomarker for amyotrophic lateral sclerosis. PloS One (2014) 9:e87398.doi: 10.1371/journal.pone.0087398
43. Taniuchi M, Johnson EM. Characterization of the binding properties andretrograde axonal transport of a monoclonal antibody directed against the ratnerve growth factor receptor. J Cell Biol (1985) 101:1100–6. doi: 10.1083/jcb.101.3.1100
44. Ross AH, Grob P, Bothwell M, Elder DE, Ernst CS, Marano N, et al.Characterization of nerve growth factor receptor in neural crest tumorsusing monoclonal antibodies. Proc Natl Acad Sci USA (1984) 81:6681–5.doi: 10.1073/pnas.81.21.6681
45. Rogers M-L, Atmosukarto I, Berhanu DA, Matusica D, Macardle P, Rush RA.Functional monoclonal antibodies to p75 neurotrophin receptor raised inknockout mice. J Neurosci Methods (2006) 158:109–20. doi: 10.1016/j.jneumeth.2006.05.022
46. Butowt R, Bartheld CSv. Fates of neurotrophins after retrograde axonaltransport: phosphorylation of p75NTR is a sorting signal for delayeddegradation. J Neurosci (2009) 29:10715–29. doi: 10.1523/JNEUROSCI.2512-09.2009
47. Deinhardt K, Kim T, Spellman DS, Mains RE, Eipper BA, Neubert TA, et al.Neuronal growth cone retraction relies upon proneurotrophin receptorsignaling through Rac. Sci Signal (2011) 4:ra82. doi: 10.1126/scisignal.2002060
48. Redmer T, Welte Y, Behrens D, Fichtner I, Przybilla D, Wruck W, et al. Thenerve growth factor receptor CD271 is crucial to maintain tumorigenicity andstem-like properties of melanoma cells. PloS One (2014) 9:e92596.doi: 10.1371/journal.pone.0092596
49. Narita M, Kuroha T, Watanabe N, Hashimoto S, Tsuchiyama J, Tochiki N,et al. Plasmacytoid dendritic cell leukemia with potent antigen-presentingability. Acta Haematol (2008) 120:91–9. doi: 10.1159/000165510
50. Narita M, Watanabe N, Yamahira A, Hashimoto S, Tochiki N, Saitoh A, et al. Aleukemic plasmacytoid dendritic cell line, PMDC05, with the ability to secreteIFN-alpha by stimulation via Toll-like receptors and present antigens to naïveT cells. Leuk Res (2009) 33:1224–32. doi: 10.1016/j.leukres.2009.03.047
51. Cossarizza A, Chang H-D, Radbruch A, Akdis M, Andrä I, Annunziato F,et al. Guidelines for the use of flow cytometry and cell sorting inimmunological studies. Eur J Immunol (2017) 47:1584–797. doi: 10.1002/eji.201646632
52. Liao X, Makris M, Luo XM. Fluorescence-activated Cell Sorting forPurification of Plasmacytoid Dendritic Cells from the Mouse Bone Marrow.J Vis Exp (2016) 117:e54641. doi: 10.3791/54641
53. Wiedemuth R, Thieme S, Navratiel K, Dorschner B, Brenner S. UTX -moonlighting in the cytoplasm? Int J Biochem Cell Biol (2018) 97:78–82.doi: 10.1016/j.biocel.2018.02.004
54. Schindelin J, Arganda-Carreras I, Frise E, Kaynig V, Longair M, Pietzsch T,et al. Fiji: an open-source platform for biological-image analysis. Nat Methods(2012) 9:676–82. doi: 10.1038/nmeth.2019
55. Donaldson JG. Immunofluorescence Staining. Curr Protoc Cell Biol (2015)69:4.3.1–7. doi: 10.1002/0471143030.cb0403s69
56. Perkins DN, Pappin DJ, Creasy DM, Cottrell JS. Probability-based proteinidentification by searching sequence databases using mass spectrometry data.Electrophoresis (1999) 20:3551–67. doi: 10.1002/(SICI)1522-2683(19991201)20:18<3551:AID-ELPS3551>3.0.CO;2-2
57. Cottrell J, Creasy D, Pappin D. John Cottrell, David Creasy & Darryl Pappin.Interview by H. Craig Mak. Nat Biotechnol (2012) 30:963. doi: 10.1038/nbt.2393
58. Kessner D, Chambers M, Burke R, Agus D, Mallick P. ProteoWizard: opensource software for rapid proteomics tools development. Bioinformatics(2008) 24:2534–6. doi: 10.1093/bioinformatics/btn323
59. Nesvizhskii AI, Keller A, Kolker E, Aebersold R. A statistical model foridentifying proteins by tandem mass spectrometry. Anal Chem (2003)75:4646–58. doi: 10.1021/ac0341261
60. Searle BC. Scaffold: a bioinformatic tool for validating MS/MS-basedproteomic studies. Proteomics (2010) 10:1265–9. doi: 10.1002/pmic.200900437
April 2021 | Volume 12 | Article 648283
Dorschner et al. Comprehensive Workflow to Investigate p75NTR
61. Junqueira M, Spirin V, Balbuena TS, Thomas H, Adzhubei I, Sunyaev S, et al.Protein identification pipeline for the homology-driven proteomics.J Proteomics (2008) 71:346–56. doi: 10.1016/j.jprot.2008.07.003
62. Chambers MC, Maclean B, Burke R, Amodei D, Ruderman DL, Neumann S,et al. A cross-platform toolkit for mass spectrometry and proteomics. NatBiotechnol (2012) 30:918–20. doi: 10.1038/nbt.2377
63. O’Leary NA, Wright MW, Brister JR, Ciufo S, Haddad D, McVeigh R, et al.Reference sequence (RefSeq) database at NCBI: current status, taxonomicexpansion, and functional annotation. Nucleic Acids Res (2016) 44:D733–45.doi: 10.1093/nar/gkv1189
64. KimuraMT, Irie S, Shoji-Hoshino S, Mukai J, NadanoD, OshimuraM, et al. 14-3-3 is involved in p75 neurotrophin receptor-mediated signal transduction.J Biol Chem (2001) 276:17291–300. doi: 10.1074/jbc.M005453200
65. Hubner NC, Bird AW, Cox J, Splettstoesser B, Bandilla P, Poser I, et al.Quantitative proteomics combined with BAC TransgeneOmics reveals in vivoprotein interactions. J Cell Biol (2010) 189:739–54. doi: 10.1083/jcb.200911091
66. Lipinszki Z, Wang P, Grant R, Lindon C, Dzhindzhev NS, D’Avino PP, et al. Affinitypurification of protein complexes from Drosophila embryos in cell cycle studies.Methods Mol Biol (2014) 1170:571–88. doi: 10.1007/978-1-4939-0888-2_33
67. Bonifacino JS, Dell’Angelica EC, Springer TA. Immunoprecipitation. Curr ProtocMol Biol (2001). doi: 10.1002/0471142727.mb1016s48. Chapter 10:Unit 10.16.
68. Sousa MM, Steen KW, Hagen L, Slupphaug G. Antibody cross-linking andtarget elution protocols used for immunoprecipitation significantly modulatesignal-to noise ratio in downstream 2D-PAGE analysis. Proteome Sci (2011)9:45. doi: 10.1186/1477-5956-9-45
Frontiers in Immunology | www.frontiersin.org 15
69. Zhou J-Y, Dann GP, Shi T, Wang L, Gao X, Su D, et al. Simple sodium dodecylsulfate-assisted sample preparation method for LC-MS-based proteomicsapplications. Anal Chem (2012) 84:2862–7. doi: 10.1021/ac203394r
70. Zhang Y, Go EP, Desaire H. Maximizing coverage of glycosylationheterogeneity in MALDI-MS analysis of glycoproteins with up to 27glycosylation sites. Anal Chem (2008) 80:3144–58. doi: 10.1021/ac702081a
71. Mohammed H, Carroll JS. Approaches for assessing and discovering proteininteractions in cancer. Mol Cancer Res (2013) 11:1295–302. doi: 10.1158/1541-7786.MCR-13-0454
72. Qin G, Ma J, Chen X, Chu Z, She Y-M. Methylated-antibody affinitypurification to improve proteomic identification of plant RNA polymerasePol V complex and the interacting proteins. Sci Rep (2017) 7:42943.doi: 10.1038/srep42943
Conflict of Interest: The authors declare that the research was conducted in theabsence of any commercial or financial relationships that could be construed as apotential conflict of interest.
Copyright © 2021 Dorschner, Wiedemuth, Funke, Gentzel, Rogers, Brenner andThieme. This is an open-access article distributed under the terms of the CreativeCommons Attribution License (CC BY). The use, distribution or reproduction in otherforums is permitted, provided the original author(s) and the copyright owner(s) arecredited and that the original publication in this journal is cited, in accordance withaccepted academic practice. No use, distribution or reproduction is permitted whichdoes not comply with these terms.
April 2021 | Volume 12 | Article 648283