Embed Size (px)
Citation preview

Listening to Mothers:
Report of the First National U.S. Survey of
Women’s Childbearing Experiences
Eugene R. Declercq, Carol Sakala, Maureen P. Corry, Sandra Applebaum, and Peter Risher
October 2002
Conducted for the Maternity Center Association by Harris Interactive

Listening to Mothers:
Report of the First National U.S. Survey of
Women’s Childbearing Experiences
Eugene R. Declercq Boston University School of Public Health
Carol Sakala, Maureen P. Corry Maternity Center Association
Sandra Applebaum, Peter Risher Harris Interactive
Conducted May 15 – June 16, 2002 for the Maternity Center Association
by Harris Interactive®
October 2002

Listening to Mothers
Recommended citation:
Declercq ER, Sakala C, Corry MP, Applebaum S, Risher P. Listening to Mothers: Report of the First National U.S. Survey of Women’s Childbearing Experiences. New
York: Maternity Center Association, October 2002.
2002 Maternity Center Association / Harris Interactive Inc.
Written permission from Maternity Center Association / Harris Interactive Inc. is required prior to distributing, releasing, or reproducing excerpts of the information contained
herein in this report.
An electronic file of this entire report, together with electronic files of the full survey questionnaire and the Maternity Center Association’s recommendations developed on the basis of survey results, is available on the Maternity Center Association’s Maternity
Wise website at: www.maternitywise.org/listeningtomothers/.
Maternity Center Association 281 Park Avenue South, Fifth Floor
New York, NY 10010 (212) 777-5000 (phone)
(212) 777-9320 (fax) [email protected] www.maternitywise.org
Harris Interactive Corporate Headquarters 135 Corporate Woods Rochester, NY 14623
(877) 919-4765 (phone) [email protected] www.harrisinteractive.com

Listening to Mothers
– iii –
Contents List of Figures ...............................................................................................................................v List of Tables ...............................................................................................................................vi
Executive Summary ...................................................................................................................... 1
Survey Highlights......................................................................................................................... 1 Major Survey Findings................................................................................................................. 3 Procedures and Methods ............................................................................................................ 8
Introduction.................................................................................................................................... 9
Part One: Pre-Pregnancy and the Prenatal Period.................................................................. 12
Planning for a Healthy Pregnancy............................................................................................. 12 Type of Prenatal Caregiver........................................................................................................ 12 Number of Prenatal Caregivers ................................................................................................. 13 Childbirth Education................................................................................................................... 13
Part Two: Women’s Experience of Birth .................................................................................. 14
Where Women Gave Birth......................................................................................................... 14 Caregiver Who was the Primary Birth Attendant....................................................................... 14 Supportive Care During Labor................................................................................................... 15 Labor and Birth Interventions: Induction.................................................................................... 17 Labor and Birth Interventions: Fetal Monitoring During Labor .................................................. 18 Labor and Birth Interventions: Methods of Labor Pain Relief.................................................... 18 Labor and Birth Interventions: Augmentation, Episiotomy, and Others .................................... 23 Freedom and Constraint in Labor.............................................................................................. 24 Method of Delivery..................................................................................................................... 26 In the Hospital After the Birth..................................................................................................... 27 Women’s Evaluation of Their Care During Labor and Birth ...................................................... 30 How Women Felt While in Labor ............................................................................................... 32
Listening to Mothers
– iv –
Part Three: After the Baby is Born............................................................................................ 33
Maternity Care in the Postpartum Period .................................................................................. 33 Physical Well-being in the Postpartum Period .......................................................................... 34 Mental Health in the Postpartum Period.................................................................................... 37 How Women Felt in the Weeks and Months after Birth............................................................. 38
Part Four: Looking at Some Important Variations in Experience.......................................... 40
Comparing Vaginal and Cesarean Births .................................................................................. 40 Comparing First-Time and Experienced Mothers...................................................................... 42
Part Five: Attitudes about Birth and Understanding of Maternity Rights............................. 45
Opinion About the Role of Medical Intervention in the Birth Process........................................ 45 Opinion About Choosing a Cesarean without Medical Reason for a Future Birth .................... 45 Knowledge of Legal Rights, Interest in Knowing More.............................................................. 46
Appendix A. Listening to Mothers National Advisory Council ............................................... 47 Appendix B. Demographic Overview of Survey Participants ................................................. 48 Appendix C. Methodology .......................................................................................................... 49 Appendix D. Comparing Listening to Mothers Results and Federal Vital
and Health Statistics ............................................................................................ 56

Listening to Mothers
– v –
List of Figures
Figure 1. Number of Prenatal Caregivers ................................................................................. 13
Figure 2. Providers of Supportive Care During Labor and Birth ............................................... 15
Figure 3. Methods Used to Try to Induce Labor........................................................................ 17
Figure 4. Reasons for Trying to Induce Labor........................................................................... 17
Figure 5. Pain Relief Medications Used During Labor .............................................................. 19
Figure 6. Drug-Free Methods Used For Labor Pain Relief ....................................................... 20
Figure 7. Sources of Information About Pain Relief Options .................................................... 23
Figure 8. Percentage of Women Who Experienced Selected Interventions During Labor....... 24
Figure 9. Reasons for Not Walking Around During Labor......................................................... 25
Figure 10. Primary Location of Baby in First Hour After Birth ..................................................... 28
Figure 11. Where Baby Stayed in the Hospital ........................................................................... 28
Figure 12. Feeding Method Planned Prior to Birth vs. Feeding Method Used One Week After
Birth............................................................................................................................ 29
Figure 13. Length of Newborn Hospital Stay .............................................................................. 30
Figure 14. Proportion of Women Scoring 13 or Higher on Edinburgh Postnatal Depression
Scale, by Time Elapsed Since Birth.......................................................................... 38
Figure 15. How Competent Women Felt as Mothers.................................................................. 39
Figure 16. “Giving birth is a natural process that should not be interfered with unless medically
necessary”.................................................................................................................. 45

Listening to Mothers
– vi –
List of Tables
Table 1. Average Proportion of Time During Labor That Specified Person
Provided Supportive Care.......................................................................................... 16
Table 2. Quality of Supportive Care Provided.......................................................................... 16
Table 3. Effectiveness of Methods for Labor Pain Relief......................................................... 21
Table 4. Knowledge of Effects of Epidural Analgesia .............................................................. 22
Table 5. Method of Delivery: Types of Vaginal and Cesarean Births ...................................... 27
Table 6. Breastfeeding-Related Practices Provided by Hospital or Birth Center Staff ............ 29
Table 7. Overall Evaluation of Care During Labor and Birth.................................................... 31
Table 8. Evaluation of Labor Care Received From Nursing Staff and
from Doctors or Midwives .......................................................................................... 32
Table 9. How Women Felt While in Labor ............................................................................... 32
Table 10. Physical Health Problems in First Two Months after Birth, and
New-Onset Physical Problems .................................................................................. 36
Table 11. How Women Felt in Weeks and Months After Birth................................................... 39
Table 12. Experiences of Women Who Had Vaginal and Cesarean Births............................... 41
Table 13. Comparison of First-Time and Experienced Mothers ................................................ 44
Table 14. Unweighted and Weighted Demographic Profile of Survey Participants................... 48
Table 15. Approximate Sampling Tolerances (at 95% Confidence) to Use In Evaluating
Percentage Results Appearing in This Report........................................................... 53
Table 16. Approximate Sampling Tolerances (at 95% Confidence) to Use in Evaluating
Differences Between Two Percentage Results Appearing in This Report ................ 54
Table 17. Comparison of Listening to Mothers Survey Results and Federal
Vital and Health Statistics .......................................................................................... 57

– 1 –
Executive Summary
Survey Highlights Technology-Intensive Labor the Norm. A majority of women reported having each of the following interventions while giving birth: electronic fetal monitoring (93%), intravenous drip (86%), epidural analgesia (63%), artificially ruptured membranes (55%), artificial oxytocin to strengthen contractions (53%), bladder catheter (52%), and stitching to repair an episiotomy or a tear (52%).
High Levels of Satisfaction with Care. An overwhelming proportion of mothers were pleased with the care that they received noting that they generally understood what was happening (94%), felt comfortable asking questions (93%), got the attention they needed (91%), and felt they were as involved as they wanted to be in making decisions (89%).
Frequency of Labor Induction. Almost half of all mothers reported that their caregiver tried to induce labor, most commonly through the use of artificial oxytocin. More than one-third of those mothers cited a non-medical factor as at least partially the reason for the attempted induction. The drugs or techniques used actually caused more than one-third of all labors to begin.
Popularity of Epidurals. Almost two-thirds of the mothers used epidural analgesia, including 59% who had a vaginal birth. Mothers gave high ratings to the ability of epidurals to relieve labor pain, but between 26% and 41% of mothers were unable to respond to questions about side effects associated with epidurals.
Unknown Birth Attendant. Almost three in ten mothers said they had never, or had only briefly, met the person who delivered their baby before the birth. In about 4% of hospital births, mothers said that either a nurse who wasn’t a midwife or a physician’s assistant delivered their baby. Five percent reported choosing labor induction to be able to give birth with the caregiver of their choice.
Postpartum Depression. Almost one mother in five was probably experiencing some degree of depression in the week preceding the survey, on the basis of the Edinburgh Postnatal Depression Scale, a validated screening tool.

Listening to Mothers
– 2 –
Myth of the Pain-Free Cesarean. For women who had a cesarean, pain in the area of the surgical incision was the leading postpartum health concern, with five out of six of these mothers citing it as a problem in the first two months and one in fourteen citing it as a problem at least six months after birth.
Highly Rated Pain Relief Methods Rarely Used. Although immersion in a tub, showering, and use of “birth balls” received high ratings for their help with labor pain, these approaches were used by 8% or fewer women.
Highly Rated Labor Support of Doulas and Midwives. Doulas and midwives were the most highly rated providers of labor support, yet were used for this purpose far less frequently than other types of providers (5% and 11% respectively).
Limited Support for “Elective Cesareans.” By a margin of more than five to one mothers thought it unlikely that they would choose a cesarean for non-medical reasons for a future birth. Only 6% of women whose most recent birth was vaginal indicated that they would be likely to choose cesarean birth in the future.
Declining Access to VBAC. The willingness of caregivers and hospitals to permit vaginal birth after a previous cesarean birth declined substantially for women who had given birth within twelve months of the survey, as compared to those who had given birth from twelve to twenty-four months earlier.
Differences in Vaginal and Cesarean Birth Experiences. Compared to women who gave birth vaginally, those with cesareans were less likely to “room-in” with their babies and be breastfeeding at one week, and more likely to experience several health concerns after the birth, including abdominal pain, bladder and bowel difficulties, headaches, and backaches.
Differences Between First-Time and Experienced Mothers. Compared to first-time mothers, experienced mothers were less likely to: attend childbirth education classes, use pain medications and various other labor interventions, report negative feelings during labor, have a physician as birth attendant, or give birth by cesarean. Experienced mothers also reported feeling more confident as parents, despite being as likely to report feeling “fatigued” and “disorganized” as first-time mothers.
Listening to Mothers
– 3 –
Major Survey Findings
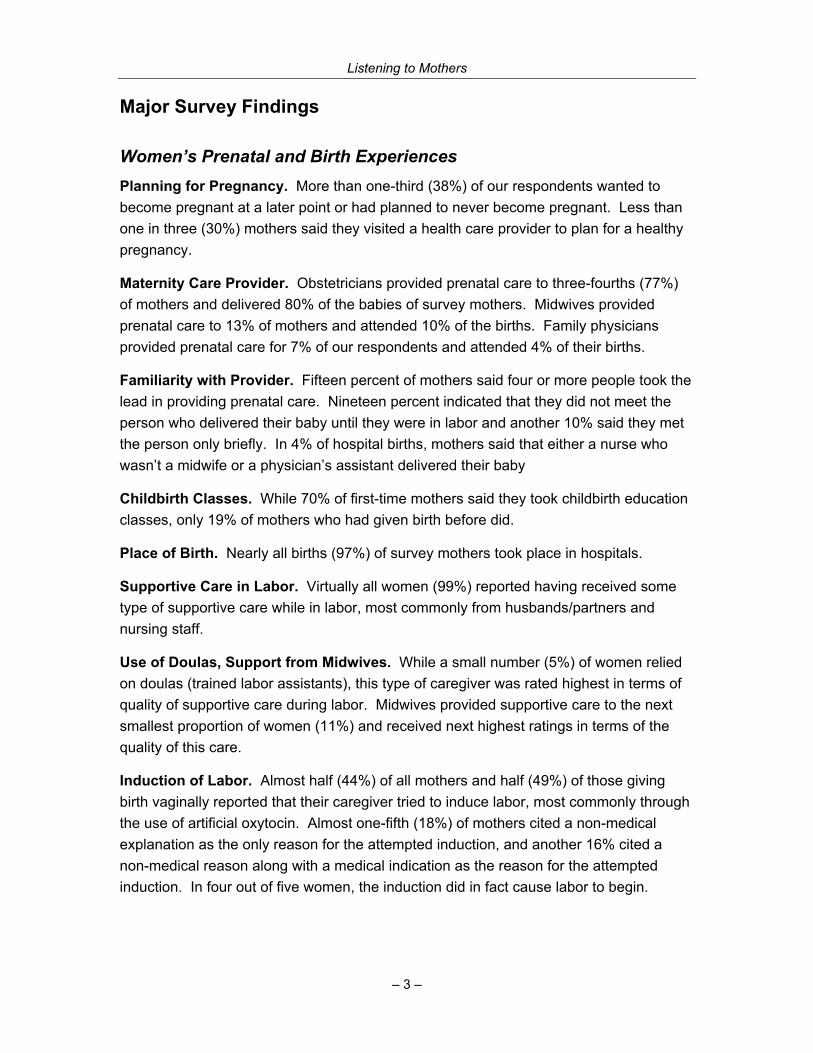
Women’s Prenatal and Birth Experiences Planning for Pregnancy. More than one-third (38%) of our respondents wanted to become pregnant at a later point or had planned to never become pregnant. Less than one in three (30%) mothers said they visited a health care provider to plan for a healthy pregnancy.
Maternity Care Provider. Obstetricians provided prenatal care to three-fourths (77%) of mothers and delivered 80% of the babies of survey mothers. Midwives provided prenatal care to 13% of mothers and attended 10% of the births. Family physicians provided prenatal care for 7% of our respondents and attended 4% of their births.
Familiarity with Provider. Fifteen percent of mothers said four or more people took the lead in providing prenatal care. Nineteen percent indicated that they did not meet the person who delivered their baby until they were in labor and another 10% said they met the person only briefly. In 4% of hospital births, mothers said that either a nurse who wasn’t a midwife or a physician’s assistant delivered their baby
Childbirth Classes. While 70% of first-time mothers said they took childbirth education classes, only 19% of mothers who had given birth before did.
Place of Birth. Nearly all births (97%) of survey mothers took place in hospitals.
Supportive Care in Labor. Virtually all women (99%) reported having received some type of supportive care while in labor, most commonly from husbands/partners and nursing staff.
Use of Doulas, Support from Midwives. While a small number (5%) of women relied on doulas (trained labor assistants), this type of caregiver was rated highest in terms of quality of supportive care during labor. Midwives provided supportive care to the next smallest proportion of women (11%) and received next highest ratings in terms of the quality of this care.
Induction of Labor. Almost half (44%) of all mothers and half (49%) of those giving birth vaginally reported that their caregiver tried to induce labor, most commonly through the use of artificial oxytocin. Almost one-fifth (18%) of mothers cited a non-medical explanation as the only reason for the attempted induction, and another 16% cited a non-medical reason along with a medical indication as the reason for the attempted induction. In four out of five women, the induction did in fact cause labor to begin.

Listening to Mothers
– 4 –
Fetal Monitoring During Labor. Nearly all women had electronic fetal monitoring (EFM) some time during labor (93%). Most women used EFM continuously, and most had only external monitoring around their bellies. Just 6% of the mothers reported that a handheld device, such as a “doppler” or stethoscope, was used exclusively to monitor their baby during labor.
Medical Interventions. While 20% of mothers indicated that they used no medications for pain relief, there were virtually no “natural childbirths” among the mothers we surveyed. Even mothers having a vaginal birth experienced a wide array of medical interventions including: being attached to an electronic fetal monitor continuously or nearly so throughout labor (93%); being connected to an IV line (85%); having their membranes artificially ruptured (67%); being given artificial oxytocin to start or stimulate labor (63%); having a gloved hand inserted into their uterus after birth (58%); using a catheter to remove urine (41%); getting an episiotomy (35%); and having pubic hair shaved (5%). Less than 1% of mothers gave birth without at least one of these interventions, and almost all of these came from the very small group (also less than 1%) of home births in our sample.
Use of Epidurals. Most mothers (63%) reported using epidural analgesia for pain relief during labor, including 59% of those having a vaginal birth and three-fourths (76%) of those with a cesarean birth. Mothers receiving an epidural generally rated them as very helpful (78%) in relieving pain. However, from 26% to 41% of the women were unable to respond to several statements about potential drawbacks of epidurals.
Use of Drug-Free Pain Relief Techniques. Mothers used a variety of “drug-free” methods for pain relief, most commonly breathing techniques (61%) and position changes (60%), but two infrequently cited techniques, immersion in a tub or pool (6%) and taking a shower (8%), were rated most helpful by their users.
Walking in Labor. Once contractions were well-established, most mothers (71%) did not walk around, primarily because they were hooked up to instruments, could not walk because of pain medications, or were told by their caregivers not to walk around.
Eating and Drinking During Labor. Just one woman out of eight (12%) had anything to eat during labor, and one in three (31%) had anything to drink at this time. Far more women expressed an interest in drinking and/or eating, and many reported that their caregivers did not permit eating and/or drinking, even in the case of vaginal births.
Position in a Vaginal Birth. Three out of four (74%) women who give birth vaginally reported that they were on their backs while pushing their baby out and giving birth. The remainder were either in an upright position (23%) (such as propped up, squatting or sitting) or lying on their side (3%).
Listening to Mothers
– 5 –
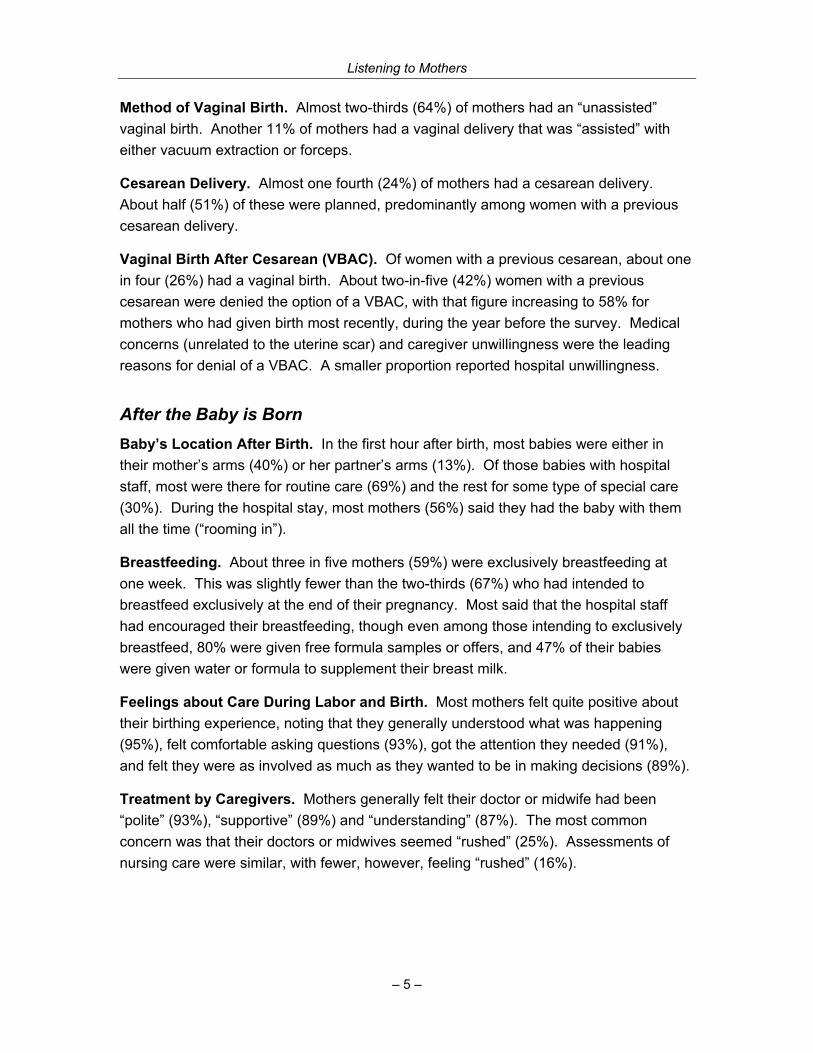
Method of Vaginal Birth. Almost two-thirds (64%) of mothers had an “unassisted” vaginal birth. Another 11% of mothers had a vaginal delivery that was “assisted” with either vacuum extraction or forceps.
Cesarean Delivery. Almost one fourth (24%) of mothers had a cesarean delivery. About half (51%) of these were planned, predominantly among women with a previous cesarean delivery.
Vaginal Birth After Cesarean (VBAC). Of women with a previous cesarean, about one in four (26%) had a vaginal birth. About two-in-five (42%) women with a previous cesarean were denied the option of a VBAC, with that figure increasing to 58% for mothers who had given birth most recently, during the year before the survey. Medical concerns (unrelated to the uterine scar) and caregiver unwillingness were the leading reasons for denial of a VBAC. A smaller proportion reported hospital unwillingness.
After the Baby is Born Baby’s Location After Birth. In the first hour after birth, most babies were either in their mother’s arms (40%) or her partner’s arms (13%). Of those babies with hospital staff, most were there for routine care (69%) and the rest for some type of special care (30%). During the hospital stay, most mothers (56%) said they had the baby with them all the time (“rooming in”).
Breastfeeding. About three in five mothers (59%) were exclusively breastfeeding at one week. This was slightly fewer than the two-thirds (67%) who had intended to breastfeed exclusively at the end of their pregnancy. Most said that the hospital staff had encouraged their breastfeeding, though even among those intending to exclusively breastfeed, 80% were given free formula samples or offers, and 47% of their babies were given water or formula to supplement their breast milk.
Feelings about Care During Labor and Birth. Most mothers felt quite positive about their birthing experience, noting that they generally understood what was happening (95%), felt comfortable asking questions (93%), got the attention they needed (91%), and felt they were as involved as much as they wanted to be in making decisions (89%).
Treatment by Caregivers. Mothers generally felt their doctor or midwife had been “polite” (93%), “supportive” (89%) and “understanding” (87%). The most common concern was that their doctors or midwives seemed “rushed” (25%). Assessments of nursing care were similar, with fewer, however, feeling “rushed” (16%).
Listening to Mothers
– 6 –
Descriptions of Labor and Birth Experiences. Mothers’ descriptions of how they felt during labor and birth ranged widely with most feeling “alert” (82%) and “capable” (77%), but many also said they felt “overwhelmed” (48%) and “weak” (41%). Experienced mothers were much more likely to express positive feelings about their birth experience than first-time mothers.
Cesarean Birth and Postpartum Health. Among women who had a cesarean, pain in the area of the incision was the most commonly identified health problem (83%) in the first two months after birth; 25% of these mothers cited this as a major problem, and another 58% cited it as a minor problem. For about 7% of mothers with a cesarean, this problem persisted at least 6 months after birth.
General Postpartum Health. Among all mothers, the most commonly cited postpartum problems were physical exhaustion (76%), sore nipples/breasts (74%), lack of sexual desire (59%), backache (51%), or painful perineum (44%). The problems most likely to persist for at least six months were lack of sexual desire (16%) and physical exhaustion (11%).
Emotional Health After Birth. The Edinburgh Postnatal Depression Scale was administered to the survey participants, and 19% scored 13 or higher, indicating that they were probably experiencing some degree of depression in the week preceding the survey. Just 43% of this group had consulted a professional about their mental health since giving birth.
Competence as a Mother. The overwhelming majority of respondents felt “very” (86%) or “somewhat” (12%) competent as a mother.
Feelings after Birth. Mothers, presented with a list of words describing positive and negative feelings in the weeks and months after birth, had mixed feelings about this period. Most felt “tired” (93%), but “rewarded” (85%), “supported” (84%), “contented” (74%), and “confident” (73%). Although positive feelings predominated overall, at least one woman out of four selected each of the seven negative feelings offered in a list, including “unsure” (39%) and “isolated” (35%).
Looking at Some Important Variations in Experience Differences in Vaginal and Cesarean Birth Experiences. Compared to women who gave birth vaginally, those with cesareans were less likely to “room-in” with their babies and be breastfeeding at one week, and more likely to experience several health concerns after the birth, including abdominal pain, bladder and bowel difficulties, headaches, or backaches.
Listening to Mothers
– 7 –
Differences Between First-Time and Experienced Mothers. Compared to first-time mothers, experienced mothers were less likely to: attend childbirth education classes, use pain medications and various other labor interventions, report negative feelings during labor, have a physician as birth attendant, or give birth by cesarean. Experienced mothers also reported feeling more confident as parents, despite being as likely to report feeling “fatigued” and “disorganized” as first time mothers.
Mothers’ Reliance on Personal Experience. Mothers who had given birth before relied primarily on their own experience as an information source on labor pain relief, while first-time mothers relied on a mix of sources, most frequently childbirth classes, their prenatal caregiver, and friends and family members.
Attitudes about Birth and Understanding of Maternity Rights Attitudes Toward Cesareans. When asked a hypothetical question about choosing a cesarean in the future, even if there were no medical reason, by a margin of more than 5 to 1 (83% to 16%) women preferred a vaginal birth. Women who had recently had a vaginal birth were much less likely to prefer a future cesarean (93% to 6%), while those who had most recently had a cesarean were evenly split.
Attitude Toward Medical Interventions in Birth. A plurality of women (45%) agreed that “giving birth is a natural process that should not be interfered with unless absolutely medically necessary,” while 31% disagreed with that statement and the remainder (24%) were undecided.
Maternity Rights. About one woman in three either had a limited understanding or none at all about her legal right to clear and full information about any offered procedure, test, or drug, and her right to accept or refuse such care. Over one in three reported that she would have liked to have known more about this and other legal rights when receiving maternity care.

Listening to Mothers
– 8 –
Procedures and Methods Listening to Mothers is the first national U.S. survey of women’s childbearing experiences. The survey explored women’s attitudes, feelings and knowledge about many aspects of their maternity experiences. It also systematically documented for the first time at the national level the frequency of many aspects of childbearing that have been recorded only at the clinical level, if at all, in the past. Entirely new data items include various practices (e.g., eating, drinking and walking in labor; use of drug-free methods of labor pain relief; birth position), information about maternity preparation and personnel (e.g., attendance at childbirth education classes, specialty of physician caregivers, and providers of supportive care in labor), and outcomes (postpartum morbidity, including depression). The survey also documented many data items that are collected in the federal vital and health statistics system, including some that have been shown in validation studies to be underenumerated on birth certificates and in hospital discharge data. The results of the Listening to Mothers survey thus enable an unprecedented level of understanding about many dimensions of the experience of childbearing in the United States.
The Listening to Mothers survey was developed through the collaborative efforts of core teams from the Maternity Center Association and Harris Interactive® with the support of the Listening to Mothers National Advisory Council. Harris Interactive administered the survey.
One hundred thirty-six mothers were interviewed by telephone, and 1,447 completed an online version of the survey. All 1,583 survey participants had given birth to a single baby (mothers with multiple births were excluded) within twenty-four months of the time of the survey. Apart from questions about reproductive history, the survey focused on the births that had taken place in this period. The interviews, averaging approximately 30 minutes in length, were conducted between May 15 and June 16, 2002. There were many indications that the mothers were exceptionally engaged in the survey and interested in having their voices heard, including their willingness to take more time answering questions than typical survey respondents. To develop a national profile of childbearing women, the data were adjusted with demographic and propensity score weightings using methodology developed and validated by Harris Interactive.
The Maternity Center Association has developed a set of recommendations that are based on these survey results. The recommendations, together with the full text of both the Listening to Mothers report and the survey questionnaire, are available on the Maternity Center Association’s Maternity Wise™ website at: www.maternitywise.org/listeningtomothers/.
Listening to Mothers
– 9 –
Introduction
This report is the culmination of a multi-year effort of the Maternity Center Association (MCA) to focus the discussion of maternity care in the U.S. on the people who care about it the most: mothers themselves. The Listening to Mothers survey is the first systematic national study of U.S. mothers’ perceptions of their childbearing experiences. The survey also documented for the first time at the national level the frequency of many childbirth practices (e.g., eating, drinking and walking in labor; use of drug-free methods of labor pain relief; birth position), information about maternity preparation and personnel (e.g., attendance at childbirth education classes, specialty of physician caregivers, providers of supportive care in labor), and outcomes (postpartum morbidities, including depression) that have been recorded only at the clinical level, if at all, in the past. The survey also documented many data items that are collected in the federal vital and health statistics system, including some that have been shown in validation studies to be underenumerated on birth certificates and in hospital discharge data. The results of the Listening to Mothers survey thus create the opportunity for an unprecedented level of understanding about many dimensions of the experience of childbearing in the United States.
The study was developed through the collaborative efforts of core teams from the Maternity Center Association (Maureen Corry, Carol Sakala, Eugene Declercq) and Harris Interactive® (Peter Risher, Sandra Applebaum), with the support of the Listening to Mothers National Advisory Council (see Appendix A for a list of council members). Harris Interactive administered the survey.
Who was Included in Our Sample, and How We Reached Them Between May 15 and June 16, 2002, 136 mothers were interviewed by telephone and 1,447 completed an online version of the survey. All 1,583 survey participants had given birth to a single baby (mothers with multiple births were excluded) within twenty-four months of the time of the survey. Apart from questions about reproductive history, the survey focused on the births that had taken place in this period. On average, the survey took approximately 30 minutes to complete.
The survey questionnaire included some questions relating to pre-pregnancy and the prenatal period, and gave greatest emphasis to many previously unexamined issues at the time of labor and birth and in the weeks and months after birth. The full

Listening to Mothers
– 10 –
questionnaire is available on the Maternity Center Association’s Maternity Wise™ website at: http://www.maternitywise.org/listeningtomothers/.
There were many indications that the mothers were exceptionally engaged in the survey and interested in having their voices heard, including their willingness in both the online and telephone components of the survey to take more time answering questions than typical survey respondents. Large numbers also took the opportunity to provide optional open-ended comments, and fully 91% indicated a willingness to participate in follow-up research.
To develop a national profile of childbearing women, the data were adjusted with demographic and propensity score weightings using methodology developed and validated by Harris Interactive. Appendix B provides an overview of the demographic profile of the unweighted and weighted samples. A detailed methodology of the survey, including discussion of the relationship between the phone and online samples and of processes for weighting the results, appears in Appendix C. Appendix D compares Listening to Mothers results to a comparable series of figures that have recently been reported in the federal vital and health statistics system.
A Note on Reading the Exhibits and Figures An asterisk (*) on a table signifies a value of less than one-half percent (0.5%). A dash (-) represents a value of zero. Percentages may not always add up to 100% because of rounding, the acceptance of multiple answers from respondents, or exclusion of some response categories from a table. The term “base” is used to identify the total number of respondents answering that question. Since many questions are only asked of a subgroup of the sample (e.g., only asking women who had a local anesthetic block about the effectiveness of this type of pain relief), some results may be based on small sample sizes. Caution should be used in drawing conclusions from results based on these small samples.
All Harris Interactive surveys are designed to comply with the code and standards of the Council of American Survey Research Organizations (CASRO) and the code of the National Council of Public Polls (NCPP).
A Note on the Selection of Quotations from Survey Participants Women who participated in the Listening to Mothers survey were offered three opportunities to provide fully open-ended comments. We welcomed their remarks “if there is anything else you would like to tell us about”: (1) “your labor and birth experiences”, (2) “your experiences or care since the birth of your baby”, or (3) “any aspect of your pregnancy, maternity care, labor and birth, or experiences as a mother.”

Listening to Mothers
– 11 –
Most participants (52%) took the time to respond to one or more of these invitations. We received many vivid and moving stories, observations, and opinions that bring the women’s experiences to life. Faced with the challenge of selecting comments for this report from among this large and important set of remarks, we gave priority to either contrasts that suggest the range of women’s experiences or those that illustrate notable survey results. The quotations in this report reproduce the women’s exact words, though we have in some cases corrected spelling and punctuation.
Project Responsibility The survey questionnaire was developed collaboratively by the MCA and Harris teams and the Listening to Mothers National Advisory Council. The Harris team responsible for management of the project and initial analysis of the results was led by Peter Risher, Senior Project Director, and Sandra Applebaum, Research Associate. The data presented in this report were reviewed and in many instances further analyzed by the MCA core team of Eugene Declercq, Chair, Listening to Mothers National Advisory Council, Carol Sakala, Director of Programs, and Maureen Corry, Executive Director. Harris Interactive has reviewed the entire report and finds it to be a fair and accurate depiction of the survey results.
Recommendations To address issues raised by the Listening to Mothers survey results, the Maternity Center Association has developed a set of recommendations. These recommendations and PDFs of this entire report and the survey questionnaire are available on MCA’s Maternity Wise™ website at: www.maternitywise.org/listeningtomothers/.
Acknowledgments We want to express our gratitude to the mothers across the United States who freely shared their maternity experiences with us at a time when, as they told us, relatively few were feeling rested and organized. We are grateful to members of the Listening to Mothers National Advisory Council, who attended a national planning meeting and provided interim support on the development, implementation, and reporting of the survey. Their multi-disciplinary perspectives have strengthened this project in many ways. Special thanks to the Board of Directors of the Maternity Center Association for its vision and commitment to MCA’s Listening to Mothers Initiative. Vincent Fitts and Kris Kolton at Harris Interactive provided exemplary programming and data analysis support. Robin Barrett provided outstanding support with formatting and layout of this report. Eugene Declercq’s work was partially supported by the Maternal and Child Health Department of the Boston University School of Public Health.

Listening to Mothers
– 12 –
Part One: Pre-Pregnancy and the Prenatal Period
Planning for a Healthy Pregnancy The Listening to Mothers survey examined two factors related to planning for a healthy pregnancy: whether or not the pregnancy was intended, and whether or not the women had a preconception visit with a health care provider. Most women who had given birth in the past two years wanted to become pregnant either prior to (18%) or at the time (45%) they became pregnant. However, for almost four out of ten women, this pregnancy was unplanned, that is, they did not want to become pregnant at the time they became pregnant, including about a third (32%) who had hoped to become pregnant at some time in the future, and one in twenty (6%) who indicated that they never wanted to become pregnant.
Even among just those women who wanted to become pregnant, a majority (60%) said they did not see a health care provider before they became pregnant to plan for a healthy pregnancy. Overall, only 3 in 10 women had a visit to a health care provider to plan their pregnancy.
Type of Prenatal Caregiver For a substantial majority of our respondents (77%), an obstetrician-gynecologist was the type of caregiver most directly involved with providing prenatal care. The women who took the Listening to Mothers survey indicated that in about 7% of cases, family physicians provided their prenatal care. For one out of eight (13%) women, a midwife was the primary provider of prenatal care, and for a fraction of women (4%) either a nurse (who is not a midwife) or a physician’s assistant was the primary provider of prenatal care.
“I chose my doctor very carefully. He understood what type of care I needed. The hospital I gave birth in was a very good choice. Having given birth in several other hospitals, I am glad I chose this doctor and this hospital.”

Listening to Mothers
– 13 –
Number of Prenatal Caregivers
The majority of women (70%) always or almost always saw the same maternity caregiver for their prenatal care. Three in ten (30%) women, however, reported that two or more people took the lead in providing their prenatal care, and one in six told us that four or more took the lead. (Figure 1)
Childbirth Education Only about one-third (36%) of women reported taking childbirth education classes, though this varied widely, with most new mothers (70%) taking classes while only one in five (19%) experienced mothers took classes. Of the women who did take childbirth education classes, more than four out of five (88%) attended classes at a hospital site or a doctor’s or midwife’s office, while a few took classes in a home (4%) or at a community site (7%).
“I had to go the women's clinic where there were 8 doctors, and the one who was on call was the one who delivered your baby, like it or not. The second pregnancy was much better. I had one doctor the whole time who was involved in helping me make the right decision for me and my baby. It gave me peace of mind knowing exactly who would be delivering my precious baby when the time came.”
Figure 1. Number of Prenatal Caregivers
Six or More4%
Five5%
Two8%
One*70%
Four7%
Three8%
*Always or almost always saw same caregiver

Listening to Mothers
– 14 –
Part Two: Women’s Experience of Birth
Note: Part Two primarily presents overall results of the Listening to Mothers survey. Labor and birth experiences, however, can vary substantially for individual mothers. Two factors that profoundly influence the nature of the birth experience — method of delivery (vaginal vs. cesarean birth) and parity (first-time mothers vs. experienced mothers) — are discussed in Part Four of the report.
Where Women Gave Birth An overwhelming majority of women gave birth in a hospital (97%), with only a tiny minority giving birth either at a birth center that was not located in a hospital (1%) or at home (1%).
Caregiver Who was the Primary Birth Attendant Obstetricians were the primary caregivers attending the births of most (80%) of our respondents while family physicians were birth attendants for another 4%. One out of ten women (10%) reported that a midwife attended their birth. Interestingly, mothers reported that in about one in twenty-five cases (4%) the primary birth attendant was a nurse (who wasn’t a midwife) (3%) or was a physician’s assistant (1%).
We also asked mothers if the person who was their primary birth attendant had been their primary prenatal provider, and in the clear majority of cases (70%), it was. For nearly one in three women, however, it was someone she had either met briefly (10%) or had never met (19%). Most (60%) of the cases of births attended by nurses who weren’t midwives or by physician assistants involved someone the mother was unfamiliar with.
“One doctor for prenatal care, one doctor for labor, and a different one for delivery. I couldn't pick the last two docs out of a police line-up.”

Listening to Mothers
– 15 –
Supportive Care During Labor Individuals Who Provided Supportive Care During Labor. While in labor and giving birth, virtually all women (99%) reported having received some type of supportive care, such as helping to make them more comfortable physically, providing emotional support, or providing information. This type of support is typically provided by a husband or partner (92%) or the nursing staff (83%). In about half the cases it was provided by a doctor (53%) or another family member or friend (50%), and much less frequently by a midwife (11%), a doula (trained labor assistant) (5%), or some other person (2%). (Figure 2)
Knowledge of Doulas (Trained Labor Assistants). Although only a small minority of women (5%) actually received supportive care from a doula (a trained labor assistant) during labor, three out of four of women (78%) who did not receive care from a doula had heard about this type of caregiver and care, including half (52%) who said that they had had a clear understanding of this type of caregiver and care during their last pregnancy.
“My husband was an EXCELLENT labor partner.” “The doctor and nurses were so helpful, and that made all the difference. I think if I would have had unsupportive people, I would not have gotten through it all as well as I did.” “The doula made all the difference. She was there from start to finish unlike the nursing staff and the doctor. She helped relax my husband and took the burden off of him to feel that he had to know what to do every minute.”
Figure 2. Providers of Supportive Care During Labor and Birth
1%
5%
11%
50%
53%
83%
92%
2%
Received No Support
Some Other Person
Doula or Trained Labor Assistant
Midwife
Another Family Member or Friend
Doctor
Nursing Staff
Partner/Husband

Listening to Mothers
– 16 –
Amount of Time Received Supportive Care. Women whose husbands or partners provided supportive care during labor and birth, on average, estimated having received direct, personal support from this person for almost nine-tenths of the time they were in labor (88% of the time). Women who received supportive care from another family member or friend or from a doula received this care, on average, about three-quarters of the time they were in labor. Those support persons with other responsibilities within the hospital not surprisingly were available to mothers in labor for a shorter period. These include nursing staff (59%), midwives (55%), and doctors (41% of the time). (Table 1)
Quality of Supportive Care. Overall, women tended to give high ratings to the quality of supportive care they received while in labor. Although doulas and midwives provided supportive care to the smallest proportions of women, they were most likely to be given an “excellent” rating (71% and 66%, respectively). The proportion of “excellent” ratings given to others were, in descending order: family member (other than partner/husband) or friend (60%), partner or husband (59%), doctor (52%), and nursing staff (48%). (Table 2)
Table 2. Quality of Supportive Care Provided
Base: Received Supportive Care from Specified Person
Excellent
% Good
% Fair %
Poor %
Doula or Trained Labor Assistant (n = 81) 71 15 8 6
Midwife (n = 163) 66 21 9 4 Another Family Member or Friend (n = 733) 60 24 7 9
Partner/Husband (n = 1469) 59 24 7 11
Doctor (n = 826) 52 30 10 7
Nursing Staff (n = 1337) 48 33 12 7
Table 1. Average Proportion of Time During Labor That Specified Person Provided Supportive Care
Base: Received Supportive Care
from Specified Person Mean %
Median%
Partner/Husband (n = 1469) 88 99
Another Family Member or Friend (n = 733) 77 91
Doula or Trained Labor Assistant (n = 81) 73 84
Nursing Staff (n = 1337) 59 60
Midwife (n = 163) 55 53
Doctor (n = 826) 41 28
“The doula/midwife partnership is one to be commended!”
Listening to Mothers
– 17 –
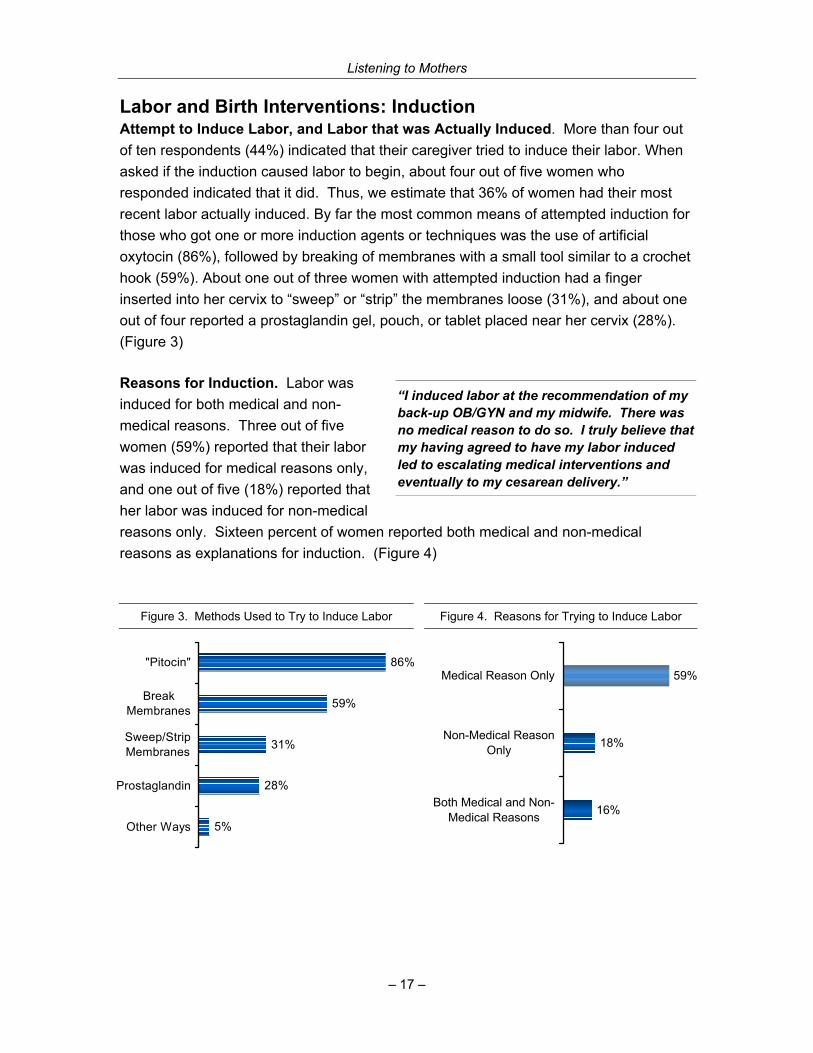
Labor and Birth Interventions: Induction Attempt to Induce Labor, and Labor that was Actually Induced. More than four out of ten respondents (44%) indicated that their caregiver tried to induce their labor. When asked if the induction caused labor to begin, about four out of five women who responded indicated that it did. Thus, we estimate that 36% of women had their most recent labor actually induced. By far the most common means of attempted induction for those who got one or more induction agents or techniques was the use of artificial oxytocin (86%), followed by breaking of membranes with a small tool similar to a crochet hook (59%). About one out of three women with attempted induction had a finger inserted into her cervix to “sweep” or “strip” the membranes loose (31%), and about one out of four reported a prostaglandin gel, pouch, or tablet placed near her cervix (28%). (Figure 3)
Reasons for Induction. Labor was induced for both medical and non-medical reasons. Three out of five women (59%) reported that their labor was induced for medical reasons only, and one out of five (18%) reported that her labor was induced for non-medical reasons only. Sixteen percent of women reported both medical and non-medical reasons as explanations for induction. (Figure 4)
Figure 3. Methods Used to Try to Induce Labor
5%
31%
59%
86%
28%
Other Ways
Prostaglandin
Sweep/StripMembranes
BreakMembranes
"Pitocin"
Figure 4. Reasons for Trying to Induce Labor
16%
18%
59%
Both Medical and Non-Medical Reasons
Non-Medical ReasonOnly
Medical Reason Only
“I induced labor at the recommendation of my back-up OB/GYN and my midwife. There was no medical reason to do so. I truly believe that my having agreed to have my labor induced led to escalating medical interventions and eventually to my cesarean delivery.”
Listening to Mothers
– 18 –
Of the women who reported that caregivers had tried to start their labors with an induction agent or technique, 19% identified the reason “I wanted to be done with my pregnancy and have my baby,” 11% selected “this helped ensure that my chosen caregiver would attend my birth,” 6% selected “I wanted to control the timing of birth to make work or personal plans,” and 11% provided other non-medical reasons. Therefore, we estimate among all respondents, 8% experienced attempted labor induction solely or in part because they wished to be done with their pregnancy, 5% solely or in part to try to have the birth attendant of their choice, 2% solely or in part for other schedule planning, and 5% solely or in part for other non-medical reasons.
Labor and Birth Interventions: Fetal Monitoring During Labor For more than nine out of ten of all women in labor (93%), electronic fetal monitoring (EFM) was used to record the baby’s heartbeat, either alone (73%) or in combination with a handheld device such as a “Doppler” or stethoscope (20%). Among women using EFM, 89% were monitored either continuously throughout labor (66%), or for most of the time during labor (23%). Only a small proportion were monitored intermittently (4%) or as a baseline measure (i.e., for only a short period of time) (7%).
Seven out of ten (70%) women whose baby’s heartbeat was monitored using EFM were monitored externally (i.e., around their belly only). One out of five (22%) were monitored both externally (around their belly) and internally (attached to the baby’s head), and a very small proportion (4%) were monitored internally only. Overall, only about one in twenty (6%) women were not attached to a fetal monitor and had their baby’s heartbeat monitored exclusively with a handheld device.
Labor and Birth Interventions: Methods of Labor Pain Relief Use of Pain Medications. The vast majority of women (80%) used some medication for pain relief for at least some of the time during labor, with epidural analgesia being, by far, the most common (63% of all women) form of medication utilized. Three out of ten women (30%) reported they were given narcotics such as Demerol or Stadol, while a small proportion underwent general
“They seemed to get me all set up in the room and on monitors, then left us there for long periods of time. Would have been nice to have a nurse or doctor stop in more often to check the status and be reassuring.”
“I gave birth both with and without epidural and found the use of an epidural to be safe and comfortable.” “I have given birth 3 times with epidurals and 4 times without. Sure labor is hard. But, my labors without drugs were so much more rewarding!”

Listening to Mothers
– 19 –
anesthesia (5%), were given nitrous oxide (2%), or were given pudendal or other local blocks (2%). Although we did not ask specifically about use of spinal (or “intrathecal”) analgesia, 3% of women named use of this method under “other” medications. (Figure 5)
Use of Drug-Free Methods for Labor Pain Relief. During labor, women used a variety of drug-free methods to increase comfort and relieve pain. Fully 88% used at least one non-pharmacological method of pain relief. At least six out of ten women in labor used breathing techniques (61%) or position changes and/or movement to relieve discomfort (60%). Three out of ten (32%) used hands-on techniques (such as massage, stroking, or acupressure) and a similar proportion (30%) used mental strategies such as relaxation, visualization or hypnosis. Less frequently used methods included application of hot or cold objects (15%), changes to the environment (such as music or aromatherapy) (12%), showering (8%), immersion in a tub or pool (6%), use of large “birth balls” (5%), and sterile water injections for lower back pain (1%). (Figure 6)
Figure 5. Pain Relief Medications Used During Labor
3%
5%
2%
2%
5%
30%
63%
Other
Used Medication But Not Sure What
Pudendal/Other Local Blocks
Nitrous Oxide
General Anesthesia
Narcotics
Epidural
“During my first labor I was able to relax in a whirlpool/tub, and it was wonderful.”
“Taking a shower during labor was extremely relaxing.”

Listening to Mothers
– 20 –
Figure 6. Drug-Free Methods Used For Labor Pain Relief
1%
5%
6%
8%
12%
15%
30%
32%
60%
61%
Sterile Water Injections
Birth Balls
Immersion in Pool or Tub
Shower
Changes to Environment
Application of Hot and Cold Objects
Mental Strategies
Hands-on Techniques
Position Changes and/or Movement
Breathing Techniques
Effectiveness of Methods for Labor Pain Relief. Some pain medications used during labor were seen as more helpful than others in relieving pain. Eight out of ten (78%) women who had an epidural considered it to be “very” helpful in making them more comfortable and relieving their pain. Two out of three (67%) women who were given general anesthesia (primarily women having a cesarean) considered it to be “very” helpful, and more than nine out of ten mothers who received either type of pain relief considered them to be at least “somewhat” helpful. Overall, other pain medications were less likely to be considered helpful for labor pain relief, including narcotics (e.g., Demerol or Stadol) (66%), pudendal or other local blocks (57%), and nitrous oxide (52%).
Mothers generally found the drug-free pain relief techniques they used to be effective, with at least two-thirds of those who used each of the listed techniques finding them to be either “somewhat” or “very” effective. Interestingly, mothers rated some of the less utilized methods as most effective, particularly two that involved water. Nine out of ten women (89%) who experienced “immersion in a tub or pool” (5% of all respondents) considered this method at least “somewhat” helpful (49% very helpful) at relieving pain, and 84% of women who used a shower considered that method to be at least “somewhat” helpful. Other positively rated drug-free methods included application of hot or cold objects (82%), hands-on techniques (81%), position changes (79%), and changes to the environment (76%). The technique that has been associated in popular culture with childbirth preparation, breathing techniques, though widely used, received mixed support with 69% finding it at least “somewhat” helpful, but more women found it

Listening to Mothers
– 21 –
“not very” helpful or “not helpful at all” (30%) than found it “very” helpful (22%). Though rarely used, birth balls were found to be “very” helpful by almost a third (32%) of those who used them. Too few women used sterile water injections for lower back pain to provide meaningful ratings of effectiveness.
Table 3 presents women’s ratings of the effectiveness of drug and drug-free methods for pain relief, in order of the percentage rating that method as “very” helpful. Epidural analgesia, rated highest for its pain relief was used by 63% of all women. Leaving aside general anesthesia, which is used in restricted circumstances, the next four highest-rated methods were all used by 8% or fewer women, including the drug-free methods of immersion in a pool or tub, showers, and use of “birth balls.” Conversely, four of the five lowest-rated methods were used by at least 30% of the women, including narcotics and breathing techniques. Narcotics, the most widely used type of pain medication after epidural analgesia, were less likely to be rated “very helpful” than five drug-free methods and several types of pain medication. (Table 3)
Table 3. Effectiveness of Methods for Labor Pain Relief
Base: Used Specified Method of Pain Relief
Pain Relief Method
Overall Number Using
%
Very Helpful
%
Some- what
Helpful %
Not Very Helpful
%
Not Helpful at All
%
Epidural 63 78 15 3 4
General anesthesia 5 67 26 4 2
Immersion in tub or pool 6 49 41 10 1
Pudendal block/other local blocks 2 47 10 29 5
Shower 8 32 52 13 2
Use of large “birth balls” 5 32 39 15 14
Hands-on techniques 32 30 52 13 6
Nitrous oxide 2 30 22 21 26
Changes to environment 12 26 50 18 5
Narcotics 30 24 42 20 9
Mental strategies 30 22 52 18 7
Application of hot or cold objects 15 21 62 14 3
Breathing techniques 61 21 48 21 10
Position changes and/or movement 60 19 60 16 5
Listening to Mothers
– 22 –
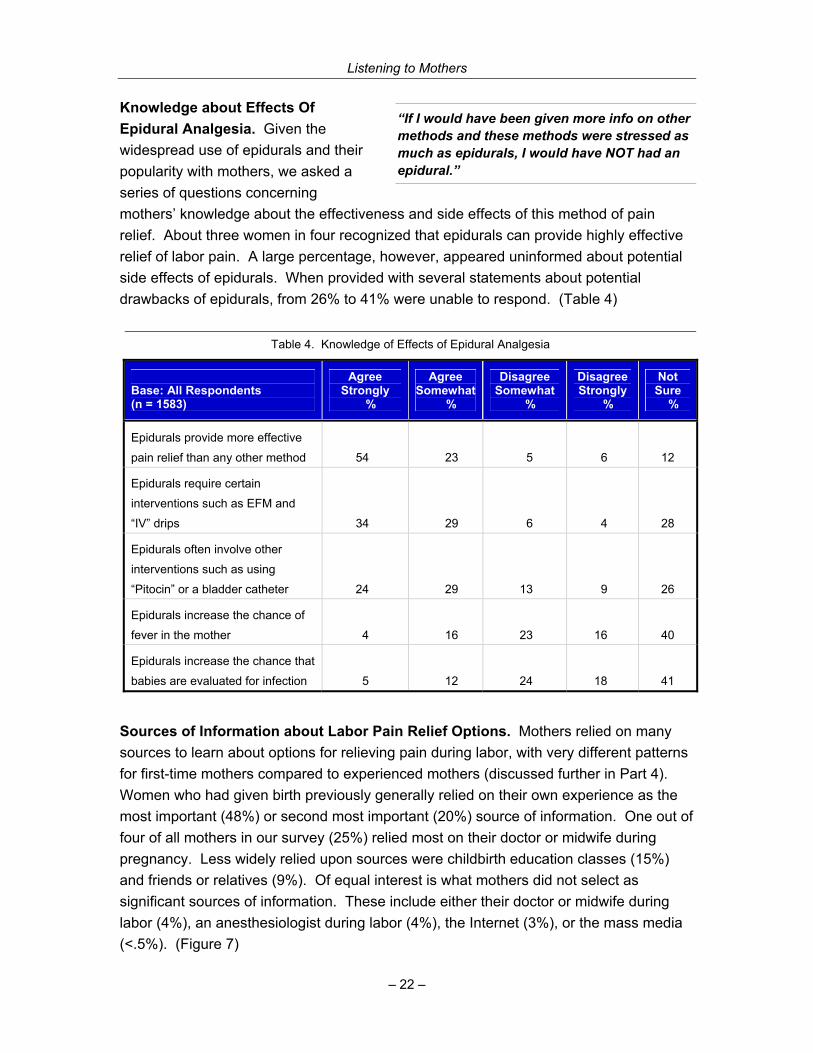
Knowledge about Effects Of Epidural Analgesia. Given the widespread use of epidurals and their popularity with mothers, we asked a series of questions concerning mothers’ knowledge about the effectiveness and side effects of this method of pain relief. About three women in four recognized that epidurals can provide highly effective relief of labor pain. A large percentage, however, appeared uninformed about potential side effects of epidurals. When provided with several statements about potential drawbacks of epidurals, from 26% to 41% were unable to respond. (Table 4)
Sources of Information about Labor Pain Relief Options. Mothers relied on many sources to learn about options for relieving pain during labor, with very different patterns for first-time mothers compared to experienced mothers (discussed further in Part 4). Women who had given birth previously generally relied on their own experience as the most important (48%) or second most important (20%) source of information. One out of four of all mothers in our survey (25%) relied most on their doctor or midwife during pregnancy. Less widely relied upon sources were childbirth education classes (15%) and friends or relatives (9%). Of equal interest is what mothers did not select as significant sources of information. These include either their doctor or midwife during labor (4%), an anesthesiologist during labor (4%), the Internet (3%), or the mass media (<.5%). (Figure 7)
“If I would have been given more info on other methods and these methods were stressed as much as epidurals, I would have NOT had an epidural.”
Table 4. Knowledge of Effects of Epidural Analgesia
Base: All Respondents (n = 1583)
Agree Strongly
%
Agree Somewhat
%
Disagree Somewhat
%
Disagree Strongly
%
Not Sure
%
Epidurals provide more effective
pain relief than any other method
54 23 5 6 12
Epidurals require certain
interventions such as EFM and
“IV” drips 34 29 6 4 28
Epidurals often involve other
interventions such as using
“Pitocin” or a bladder catheter 24 29 13 9 26
Epidurals increase the chance of
fever in the mother 4 16 23 16 40
Epidurals increase the chance that
babies are evaluated for infection 5 12 24 18 41

Listening to Mothers
– 23 –
Labor and Birth Interventions: Augmentation, Episiotomy, and Others Women typically experienced a variety of other interventions during labor and birth, with the vast majority given one or more vaginal exams (87%) or having intravenous fluids administered through a blood vessel in their arm (86%). Half of mothers reported having receiving the following interventions: membranes broken to release amniotic fluid after labor had begun (54%), artificial oxytocin to strengthen or speed up contractions after labor had begun (53%), stitches near the vagina to repair a tear or cut (52%), catheter to remove urine (52%), or checked in uterus with a gloved hand after birth (49%). One out of four women had an episiotomy (27%), and one out of five had her pubic hair shaved (19%), while a small proportion were given an enema or laxative (6%). The use of these
Figure 7. Sources of Information About Pain Relief Options
1%
3%
4%
8%
4%
12%
20%
11%
24%
20%
2%
3%
4%
4%
4%
9%
15%
25%
48%
.5%Mass Media
Anesthesiologist During Pregnancy
Internet
Doctor/Midwife During in Labor
Anesthesiologist During Labor
Books
Friends and/or Relatives
Childbirth Education Classes
Doctor/Midwife During Pregnancy
Past Personal Experience (experienced mothersonly)
Most Important Source
Second Most Important Source (Question Not Asked on Telephone)
“On my first go around, I was hooked to what seemed like every monitor or drip imaginable. I highly suggest going through labor as long as possible at home where you can be the most comfortable. My labor actually went quicker and was less painful.”

Listening to Mothers
– 24 –
interventions naturally varied widely in cases of vaginal and cesarean birth (see Part Four). Almost one-fourth of our respondents (24%) experienced a cesarean section, and 10% had an assisted vaginal birth, either with vacuum extraction (7%) or forceps (3%). The proportion of women whose membranes were ruptured either to induce labor or after labor was under way was 55%. (Figure 8)
Figure 8. Percentage of Women Who Experienced Selected Interventions During Labor
3%
6%
7%
19%
24%
27%
49%
52%
52%
53%
55%
86%
87%
Forceps
Enema or Laxative
Vacuum Extraction
Pubic Hair Shave
Cesarean Section
Episiotomy
Internal Check of Uterus After Birth
Stiching Near Vagina
Bladder Catheter
"Pitocin" (after labor began)
Broken Membranes
Intravenous Fluids
One or More Vaginal Exams
Freedom and Constraint in Labor Eating and Drinking During Labor. Just over half (56%) of mothers who took the Listening to Mothers survey said that they were interested in drinking something, and about a quarter (27%) stated that they were interested in eating something between the time their labor began and the time they actually gave birth. However, only about one in three (34%) indicated they were permitted to drink anything, and only about one in eight (13%) said that they were permitted to eat anything during this time. Even looking only at vaginal births, only one in three (35%) women said that they actually did drink something, and one out of seven that they actually did eat something (14%) between the time their labor began and the time they gave birth.
Number of Hospital Personnel Present During Labor and Birth. Women who had given birth in a hospital estimated that, on average, six
“When I was about to deliver, a whole crew of medical students came in and watched. I will never give birth in a teaching hospital again.”

Listening to Mothers
– 25 –
different hospital staff came into the room during labor and birth. While the majority of laboring women (62%) estimated that five or fewer different hospital staff had been present in the course of labor and birth, four out of ten (38%) estimated that more than five staff members had been present. Seven percent of women recalled that more than ten staff members had been present at one time or another during labor and birth. Mothers generally (83%) felt that the number of hospital personnel who came into their room while they were in labor and giving birth was “about the right amount.” However, this assessment was strongly related to the number of hospital personnel who had entered a mother’s room, with almost half (47%) of mothers who had at least nine people thinking it was too many.
Movement During Labor. Most (71%) women who gave birth in a hospital or birth center did not walk around once they were admitted and regular contractions had begun. The primary reason selected by women for not walking around was being connected to things (67%). Other reasons cited included being given pain medications that made them unable to support themselves (32%), being told by their caregivers not to walk around (28%), choosing on their own to stay in one place (21%), grogginess from pain medications (20%). (Figure 9)
Figure 9. Reasons for Not Walking Around During Labor
1%
21%
28%
32%
67%
20%
Don't Remember
Groggy Due to Pain Medication
Chose to Stay in One Place
Told Not to Walk Around
Unable to Support Self Due to Pain Medication
Connected to Things
“I felt less pain while I was sitting up in a chair, and the nurse insisted that I get in the bed. I did not like that, because it hurt much worse. I would also like to have had an opportunity to walk around during contractions, and not be hooked up to constant fetal monitoring.”

Listening to Mothers
– 26 –
Position Used in a Vaginal Birth. Three out of four (74%) women who gave birth vaginally reported that they lay on their backs while pushing their baby out and giving birth. Nearly one in four (23%) was in an upright position (such as propped up, squatting or sitting), while a tiny minority (3%) pushed and gave birth lying on their side. Fewer than 1% of the women indicated using a hands-and-knees position.
Average Duration of Labor. We asked women who did not have a scheduled cesarean to estimate the total amount of time they were in labor. The median length of labor cited by respondents was 8 hours, with an average length of 10.3 hours. Four out of ten (43%) women were in labor for one to six hours, and about one in fourteen (7%) were in labor for more than twenty-four hours.
Method of Delivery Types of vaginal and cesarean births. National data on method of delivery have generally classified births into either two categories, vaginal birth (76% in our survey) or cesarean (24%), or have subdivided those two based on whether or not a woman’s previous birth was vaginal or cesarean, resulting in four possible categories: vaginal birth with no previous cesarean (72% in our survey); vaginal birth after cesarean (VBAC, 4%); primary (or first) cesarean (14%) and repeat cesarean (10%). In addition to figures for these categories, the Listening to Mothers survey allows further breakdowns according to whether or not the vaginal birth involved vacuum extraction or forceps and whether or not the cesarean birth was planned or unplanned.
Almost two-thirds of mothers reported having an unassisted vaginal birth, with almost all of them (61%) having an unassisted vaginal birth without having had a previous cesarean, while the remainder (3%) had an unassisted vaginal birth after a previous cesarean. Overall, 11% of all mothers had an assisted vaginal birth, with about three-fourths of these by vacuum extraction (7%), and the remainder by forceps (3%). Of the almost one-quarter (24%) of births that were cesareans, most were either unplanned primary (or first) cesareans (10% of all births) or planned repeat cesareans (9% of all births). (Table 5)
“During labor, I was forced to lie on my back. This was my second normal delivery, and there were no complications. I felt very uncomfortable and found it difficult to push when the time came.”
“I just wish they had tried other things before they did the c-section.” “Both my children were delivered by c-section. Both were very pleasant experiences.”

Listening to Mothers
– 27 –
Vaginal Birth After Cesarean (VBAC). Of women who had had a cesarean in the past, 26% had a vaginal birth after cesarean for the most recent birth, while 74% had a repeat cesarean. We asked women with a previous cesarean about their decision-making relating to a VBAC. Overall, more than two out of five (42%) were not given the option of a VBAC. There was a strong annual trend in the data, with 25% of mothers who gave birth 1-2 years ago being denied the option of a VBAC, while 58% of those who had given birth in the previous year were denied the option. Of those women denied a VBAC, 38% indicated they were given a medical reason (not related to their uterine scar), while the remainder primarily cited caregiver unwillingness (36%) or hospital unwillingness (12%) to provide that option.
In the Hospital After the Birth Baby’s Location Just After Birth and For Remainder of Hospital Stay. Slightly more than half of women who responded said that during the first hour after birth, their newborn was either mainly in their arms (40%) or mainly in their husband’s or partner’s arms (13%). Almost half of all babies were primarily with hospital staff during this period, some because of the need for special care (14%), but most for routine care (31%). (Figure 10)
“My first child was a c-section, the next two were VBAC. This IS the best way to go. C-sections are MUCH harder to 'bounce' back from.”
Table 5. Method of Delivery: Types of Vaginal and Cesarean Births
Vaginal 76%
Vaginal/No Previous Cesarean
72%
Vaginal Birth After Cesarean (VBAC)
4%
Unassisted 61% 3%
Vacuum or Forceps Assisted 10% 1% Cesarean 24%
Primary (First) Cesarean
14%
Repeat Cesarean
10%
Unplanned 10% 2%
Planned 3% 9%
“I loved the fact that after my son was born and they weighed him and all, they handed him to me, and then everyone left the room for nearly 2 hours.”
“After the birth, they would not let me hold my son. They repeatedly told me just a minute, one more minute, without telling me why.”

Listening to Mothers
– 28 –
Over half (56%) of women whose babies were born in a hospital said that after the first hour of birth, their baby stayed with them “all of the time” (typically termed “rooming in”) for the rest of the hospital stay. One out of four women (27%) said that her baby stayed with her during the day, but was returned to the nursery at night, one out of eleven (9%) that her baby stayed in the special baby care unit (NICU), and one out of fourteen (7%) that her baby was with her mainly for feedings. Of the women whose babies were not in special care units, 62% had rooming-in. (Figure 11)
Newborn Feeding. As women neared the end of their pregnancies, two out of three (67%) hoped to breastfeed exclusively, while one out of six (17%) planned to use a combination of breastfeeding and formula, and an equal proportion (17%) planned to use formula only.
Two out of three (65%) of women who gave birth in either a hospital or birth center reported that the staff, on the whole, encouraged breastfeeding, and a third (33%) that the staff expressed no preference for either breastfeeding or formula feeding. A tiny proportion (2%) reported that the staff encouraged formula feeding. Of those mothers who intended to exclusively breastfeed, fully 80% were given free formula samples or offers, and nearly half (47%) were given formula or water to supplement their breast milk. (Table 6)
Figure 10. Primary Location of Baby in First Hour After Birth
13%
14%
31%
40%
Partner'sArms
Staff forSpecial Care
Staff forRoutine Care
Mother'sArms
Figure 11. Where Baby Stayed in the Hospital
1%
7%
9%
27%
56%
Nursery (not NICU)
Mother for Feedings
Special Care Unit (NICU)
Mother During Day/Nursery at Night
With Mother (Rooming-In)
“I was frustrated by the staff at the hospital because they all wanted me to supplement with formula. I wanted to only breastfeed my son. I stuck to my guns, and my son gained plenty of weight and was very healthy!”

Listening to Mothers
– 29 –
Table 6. Breastfeeding-Related Practices Provided by Hospital or Birth Center Staff
Gave Birth in a Hospital or Birth Center and Planned to do at Least Some Breastfeeding
(n = 1296)
Exclusive Breast-feeding
%
Breast & formula Feeding
%
Helped you get started breastfeeding when you and your baby were ready 83 85
Gave you free formula samples or offers 80 89
Showed you how to position your baby to limit nipple soreness 77 78
Encouraged you to feed “on demand” 74 67
Told you about community breastfeeding support resources for ongoing help 72 75
Provided formula or water to supplement your breast milk 47 66
One week after giving birth, almost six out of ten (59%) women fed their babies breast milk only, or about nine out of ten mothers that had hoped to feed their baby breast milk only as they came to the end of their pregnancy. (Figure 12)
Length of Newborn Hospital Stay. According to mothers, one in three (36%) newborns was discharged from the hospital within 48 hours of birth. One in ten (10%) newborns spent at least five days in the hospital. (Figure 13)
Figure 12. Feeding Method Planned Prior to Birth vs. Feeding Method Used One Week After Birth
67%
22% 19%17%17%
59%
BreastfeedingOnly
Formula Only Both
Expectation Prior to Birth
Feeding Method One Week After Birth

Listening to Mothers
– 30 –
Figure 13. Length of Newborn Hospital Stay
6%4%
7%
27%
8%
16%
31%
Less than 1 day 1 day 2 days 3 days 4 days 5 days 6 days or more
Women’s Evaluation of Their Care During Labor and Birth Overall evaluation of care during labor and birth. On the whole, mothers had very positive views about most aspects of their labor and birth care. Most agreed “strongly” that during the time they were in labor and giving birth they were given information in a way that they could understand (73%); understood what was done to them and why it was done (72%); were treated with kindness and understanding (70%); were comfortable discussing their concerns and asking questions (67%); got the attention they needed (63%); were not hurried and were free to take the time they needed to get through labor and birth (65%); were as involved in making decisions as they wanted to be (64%); and were free to make their own decisions about their care, rather than those favored by staff (56%). (Table 7) These findings were generally consistent across caregivers (OB/GYN, midwives or family doctors) though mothers attended by midwives were more likely to indicate they didn’t feel hurried.
“I believe that caregivers who respect the family unit and the woman's needs go a long way to setting the stage for the baby to enter their family with dignity and purpose.”

Listening to Mothers
– 31 –
Table 7. Overall Evaluation of Care During Labor and Birth
Base: All Respondents (n = 1583)
Agree Strongly
%
Agree Somewhat
%
Disagree Somewhat
%
Disagree Strongly
%
Was given information in a way that I could
understand 73 23 3 1
Understood what was done to me and why it
was done 72 23 4 2
Was treated with kindness and understanding 70 24 4 2
Was comfortable discussing my concerns and
asking questions 67 26 5 2
Was not hurried and was free to take the time I
needed to get through labor and birth 65 25 6 4
Was as involved in making decisions as I
wanted to be 64 25 7 4
Got the attention I needed 63 28 6 3
Was free to make my own decisions about my
care, rather that those favored by staff 56 31 8 4
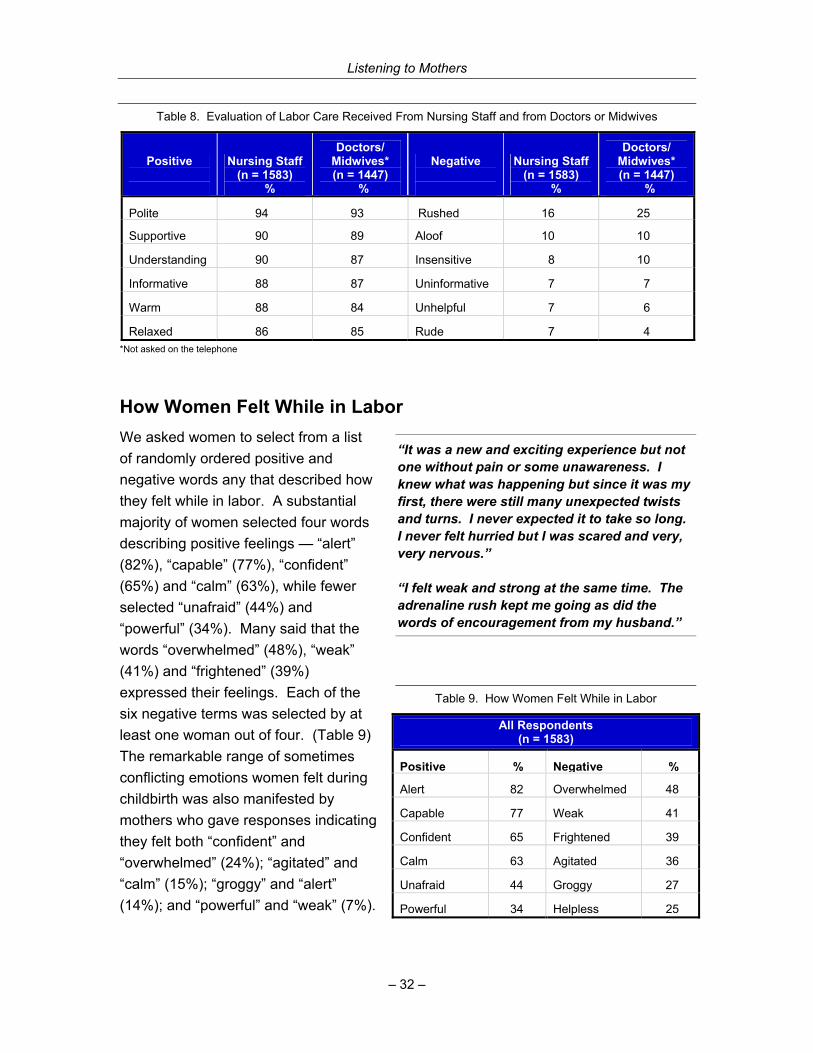
Evaluation of Care by Nursing Staff and by Doctor or Midwife. Respondents were given a randomly ordered list of both positive and negative words and asked whether or not the words described the type of care they had received from the nursing staff and from their doctor or midwife during labor. Overall, women responded very positively about the quality of labor care they received, with about nine in ten indicating that their caregivers had been polite, supportive, and understanding. The most common negative term cited was a perception that their nurses (16%) and doctors or midwives (25%) were rushed. (Table 8)
“I had a wonderful nurse who stayed with us most of the day. She was attentive with a great sense of humor.” “I have the best OB/GYN who supported me and encouraged me.” “Very open and supportive family doctor who understood my birth wishes and helped me coordinate care when the birth didn't go as planned.” “Using a midwife helped me to feel more cared for, more understood. I felt more like a human than a number.”
Listening to Mothers
– 32 –
Table 8. Evaluation of Labor Care Received From Nursing Staff and from Doctors or Midwives
Positive
Nursing Staff (n = 1583)
%
Doctors/ Midwives* (n = 1447)
%
Negative
Nursing Staff (n = 1583)
%
Doctors/ Midwives* (n = 1447)
%
Polite 94 93 Rushed 16 25
Supportive 90 89 Aloof 10 10
Understanding 90 87 Insensitive 8 10
Informative 88 87 Uninformative 7 7
Warm 88 84 Unhelpful 7 6
Relaxed 86 85 Rude 7 4 *Not asked on the telephone
How Women Felt While in Labor We asked women to select from a list of randomly ordered positive and negative words any that described how they felt while in labor. A substantial majority of women selected four words describing positive feelings — “alert” (82%), “capable” (77%), “confident” (65%) and “calm” (63%), while fewer selected “unafraid” (44%) and “powerful” (34%). Many said that the words “overwhelmed” (48%), “weak” (41%) and “frightened” (39%) expressed their feelings. Each of the six negative terms was selected by at least one woman out of four. (Table 9) The remarkable range of sometimes conflicting emotions women felt during childbirth was also manifested by mothers who gave responses indicating they felt both “confident” and “overwhelmed” (24%); “agitated” and “calm” (15%); “groggy” and “alert” (14%); and “powerful” and “weak” (7%).
“It was a new and exciting experience but not one without pain or some unawareness. I knew what was happening but since it was my first, there were still many unexpected twists and turns. I never expected it to take so long. I never felt hurried but I was scared and very, very nervous.” “I felt weak and strong at the same time. The adrenaline rush kept me going as did the words of encouragement from my husband.”
Table 9. How Women Felt While in Labor
All Respondents (n = 1583)
Positive % Negative %
Alert 82 Overwhelmed 48
Capable 77 Weak 41
Confident 65 Frightened 39
Calm 63 Agitated 36
Unafraid 44 Groggy 27
Powerful 34 Helpless 25

Listening to Mothers
– 33 –
Part Three: After the Baby is Born
Maternity Care in the Postpartum Period Home and Office Visits. About one mother and newborn in five (19%) received either one (11%) or two or more (8%) home visits from a health care worker. Virtually all women had at least one office visit with their maternity caregiver after the birth of their child. Just over four out of ten (43%) had just one office visit, approximately one out of three (30%) had two visits, and one out of five (20%) had three or more visits.
One out of three of women (33%) who had an office visit felt that her questions or concerns about her health were not fully addressed by her maternity caregiver during these visits.
Baby’s Health. The average weight mothers reported for their newborns was 7 pounds, 6 ounces. Five percent of the newborns were in the low birthweight range (less than five pounds, 9 ounces), and 14% weighed 8 pounds, 14 ounces or more at birth. An overwhelming majority of women rated their child’s health since birth as either “excellent” (76%) or “good” (20%).
Payment Source for Maternity Care. Three out of four women (74%) said that their maternity care was paid for by their health insurance or HMO. One out of four (24%) said their care was paid for by Medicaid or a similar government program. One out of ten women (10%) incurred at least some out-of-pocket costs.
“After the baby was born, all the attention to my health prior to the birth was gone and it seemed that no one was there to address any concerns for my physical or emotional/mental health.” “It seems that everyone assumes that as a woman I know all about children. I DON'T. I need help!”

Listening to Mothers
– 34 –
Physical Well-being in the Postpartum Period Burden of Physical Morbidity in First Two Months after Birth. The Listening to Mothers survey asked women about their postpartum physical and mental health following the birth of their child. We first asked whether or not they had experienced any of a list of postpartum health concerns within the first two months after birth. The problem cited by the greatest proportion of women was among those women who had experienced a cesarean section: five out of six of women with cesareans (83%) considered pain at the site of the incision to have been a problem in this period, with one fourth (25%) citing it as a major problem.
Three out of four of all women said that physical exhaustion had been a problem (23% said it was a “major problem,” and 52% said it was a “minor problem”) and a similar proportion that sore nipples/breast tenderness had been a problem (20% “major,” 54% “minor”). More than half of women in our survey said that lack of sexual desire (24% “major,” 35% “minor”) and backache (11% “major,” 40% “minor”) had been problems in that time frame. At least one in five women identified painful perineum, painful intercourse, bowel problems, urinary problems, infection at the site of a cesarean section, and frequent headaches as problems in the first two months following the birth. (Table 10)
Mothers were asked to identify any other postpartum health problems that they had experienced in the first two months after birth, in addition to those listed in Table 10. One percent or more wrote in the following problems: excessive bleeding, weight control, other breastfeeding problems, hemorrhoids, high blood pressure, other cesarean healing problems, and aching muscles and joints. Fewer women named many additional problems, including cramping, gall bladder problems, pelvic pain, blood clots, and dizziness.
Problems that Began After Birth, Their Duration, and Whether a Health Provider was Consulted. Since some of the post-birth conditions noted by mothers could be ongoing chronic problems (e.g., headaches) or conditions that began in pregnancy (e.g., backache), we asked mothers if they had experienced the condition before the birth so we could identify those who experienced these problems as a new condition after birth. Among these new problems were sore nipples/breast tenderness and a painful perineum for approximately six out of ten (58%) and four out of ten (43%) women, respectively. Other problems that mothers frequently noted as newly occurring after birth were
“The recovery from the scheduled c-section was much easier than the recovery from the unplanned c-section, although the recovery from the vaginal birth was the easiest of all.”
Listening to Mothers
– 35 –
physical exhaustion (33%), lack of sexual desire (33%), painful intercourse (29%), and bowel problems (20%), and urinary problems (18%). (Table 10)
We asked mothers if they continued to experience the new-onset problems to determine whether these problems were persistent. Some of these postpartum problems were more persistent than others. The final column in Table 10 lists the proportion of mothers who at the time of the survey continued to experience problems that had arisen after the birth, focusing only on women who given birth at least six months before taking the survey. The most common persistent problems were lack of sexual desire (16%), physical exhaustion (11%), pain from a cesarean incision (7%), urinary problems (7%), backache (4%), painful intercourse (4%), and frequent headaches (4%). (Table 10)
Even though many of these newly occurring physical problems persisted for months after giving birth, the majority of women who had experienced these problems had not typically consulted a health care professional about them. Except in the case of infections, more than seven out of ten mothers never consulted a health professional to get help for their problem. Notably, for four of the five conditions, for which at least half of the mothers classified the condition as a major or minor problem (lack of sexual desire, exhaustion, sore nipples/breasts, backache), almost 90% of mothers never sought professional help. Only in the case of pain at the cesarean site were mothers slightly more likely to seek help, and in this case fully 72% never consulted a health professional. (Table 10)
“I have experienced extreme lack of sexual desire since the birth of my first child.”

Listening to Mothers
– 36 –
Table 10. Physical Health Problems in First Two Months after Birth, and New-Onset Physical Problems
Problems After Birth “New” Problems After Birth
Base: All Internet Respondents (unless otherwise specified)
Major
% Minor
%
Major or
Minor%
Experi-enced as
New Problem
%
Health Profes-sional Never
Consulted* %
Persisting to at Least Six Months
Post-partum**
%
Cesarean Births Only
Pain at site of cesarean incision 25 58 83 79 72 7
Infection at site of cesarean incision 5 15 21 20 42 *
Vaginal Births Only
Infection from cut or torn perineum 1 3 4 4 77 *
All Births
Lack of sexual desire 24 35 59 33 88 16
Physical exhaustion 23 52 76 33 88 11
Sore nipples/Breast tenderness 20 54 74 58 90 3
Backache 11 40 51 13 86 4
Painful intercourse 10 27 37 29 90 4
Painful perineum 9 35 44 43 89 2
Bowel problems 7 23 31 20 86 2
Frequent headaches 6 14 20 7 75 4
Urinary problems 5 22 27 18 82 7
Breast infection 4 5 9 9 49 *
Infection in uterus 1 1 2 2 76 -
Urinary tract infection 1 7 8 5 43 *
*Base: those mothers for whom the problem did not exist prior to birth **Elapsed time between giving birth and participating in survey ranges from 0 to 24 months

Listening to Mothers
– 37 –
Mental Health in the Postpartum Period We asked mothers who participated in the Listening to Mothers survey to answer all ten questions from the validated Edinburgh Postnatal Depression Scale, using a version that has been slightly adapted to be consistent with conventions of U.S. English. (For details of the original and adapted scales, see Appendix C. Methodology.) Due to greater time constraints with the phone portion of the survey, these questions were only asked of the 1,447 women who participated online (and whose responses were then carefully weighted to develop a national profile). The questions asked mothers about their feelings during the past seven days, and it is important to note that our respondents had given birth anywhere from a few weeks to 24 months earlier.
One out of five (19%) women who had given birth in the past two years scored 13 or above on the Edinburgh Postnatal Depression Scale, indicating that this considerable segment was likely to be suffering some degree of depression in the week preceding the survey. One out of five (19%) respondents also said that they had consulted a health care or mental health professional with concerns about their emotional or mental well-being since giving birth. However, nearly six out of ten women (57%) scoring 13 or higher had not seen a professional for concerns about their mental health since giving birth.
We examined the depression scores from the perspective of time elapsed since giving birth, for four six-month periods. Interestingly, the proportion scoring 13 or higher did not vary in a clear pattern, with mothers who had given birth within the past six months and those who had given birth from 19 to 24 months earlier being slightly more likely to score above 13 (23% and 20%, respectively) than those within the two intervening six-month periods. (Figure 14).
“I do not understand why I feel so bad. I would like help but can't even find the energy to take care of it. Not from lack of sleep. I am just so ... gone.” “My midwife saved my bacon by ferreting out my feelings of depression and getting me medical treatment without delay. Also, she made me understand that I was not 'weak' for taking medication to assist me.” “More information should be given to mothers, along with some resources, on post partum depression. My OB-GYN was not helpful at all. I had to find resources and caregivers on my own. PPD seems to be the 'big secret' no one talks about.”

Listening to Mothers
– 38 –
Figure 14. Proportion of Women Scoring 13 or Higher on Edinburgh Postnatal Depression Scale, by Time Elapsed Since Birth
20%
17%
17%
23%
19-24 months
13-18 months
7-12 months
6 months or less
How Women Felt in the Weeks and Months after Birth In the period after birth, mothers experience a wide range of emotions. We asked the women who participated in the Listening to Mothers survey to select from a list of randomly ordered positive and negative words those that best described their feelings in the weeks and months following birth. On the whole, mothers more commonly chose the positive responses, though fatigue was the leading theme, as the most common response was “tired” (93%) and the least common response (14%) was “rested.” The next five most common responses were all positive with more than three out of five choosing “rewarded” (85%), “supported” (84%), “contented” (74%), “confident” (73%), or “clear-headed” (63%). The only other response with a majority was “messy” (60%). Despite the overall strength of the positive responses, each of the negative feelings was selected by at least one mother in four. (Table 11)
We also asked the women in our survey how competent they felt as mothers, and virtually all women who give birth (98%) felt at least somewhat competent as a mother, with 86% feeling “very” competent and 12% feeling “somewhat” competent. (Figure 15)
“I never realized how much support a birth mother needs before, during and after delivery. I wish there were organizations that offered more support like that, i.e., volunteers that come to your home and help you care for the baby, or watch the baby so you can sleep.” “Life seems to have been a roller coaster! So many ups and downs. I feel like I am a happier person, but sometimes knowing that I am responsible for my son is overwhelming.” “Even though the first 3 months were really difficult, having a child is the most rewarding thing I've ever done. It gave me a sense of power I never knew existed.”

Listening to Mothers
– 39 –
Table 11. How Women Felt in Weeks and Months After Birth
All Respondents (n = 1583)
Positive % Negative %
Rewarded 85 Tired 93
Supported 84 Messy 60
Contented 74 Unsure 39
Confident 73 Isolated 35
Clear-headed 63 Sad 35
Organized 26 Discouraged 26
Rested 14 Confused 25
Figure 15. How Competent Women Felt as Mothers
Not Sure1%
Somewhat Competent
12%
Very Competent
86%
Not at All Competent
0%
Not Very Competent
1%

Listening to Mothers
– 40 –
Part Four: Looking at Some Important Variations in Experience
Earlier sections in this report look largely at the overall experiences of the women who participated in the Listening to Mothers survey. Women’s childbearing experiences, however, vary considerably depending on the circumstances of their birth. In this section, we look at two dimensions that are in many respects associated with quite different experiences: whether the birth was vaginal or cesarean, and whether the woman was a first-time or experienced mother.
Comparing Vaginal and Cesarean Births Mothers generally reported substantially different birth experiences depending on whether they had a vaginal or cesarean birth. Table 12 summarizes a number of these differences from throughout the survey. There are many ways cesarean and vaginal birth data could be compared (e.g., primary cesareans versus repeat cesareans versus vaginal births after cesareans versus vaginal births with no previous cesarean), but in this section we are simply comparing those mothers whose most recent birth was vaginal with those whose most recent birth was a cesarean.
In some areas no major differences were found, such as the frequency of taking childbirth education classes or of having the support of one’s partner in labor. However, in most cases the differences were quite pronounced, usually in expected directions. Not surprisingly, a mother who had had a cesarean was much more likely to have preoperative interventions such as shaving of public hair, denial of food, and medications such as an epidural (76%) or general (14%) anesthesia. What is perhaps surprising is the level of use of certain practices in vaginal birth such as pubic shaving (5%); rupture of membranes (67%); failure to drink anything (65%); bladder catheterization (41%); and manual exploration of the uterus after the birth (58%). Mothers who experienced a vaginal birth were more likely to have their baby with them at all times after birth (60%); and be breastfeeding at one week (61%).

Listening to Mothers
– 41 –
Table 12. Experiences of Women Who Had Vaginal and Cesarean Births
Specific Experience
Vaginal (n=1202)
%
Cesarean (n=381)
%
Prenatal
Prenatal provider was a midwife 14 7
Took childbirth classes 35 38
During labor
Partner assisted in labor 92 90
Attempted to induce labor 49 29
Broke membranes to start or speed labor 67 32
Shaved public hair 5 63
Received artificial oxytocin to speed labor 60 32
Catheterized to remove urine 41 85
Given episiotomy 35 2
Checked inside uterus with gloved hand after birth 58 22
Drank anything in labor 35 22
Ate anything during labor 14 6
Received epidural 59 76
Received general anesthesia 2 14
Used position changes to relieve discomfort in labor 67 39
Used breathing techniques 68 39
After the Baby was born
Had “rooming in” with baby 60 45
Intended to breastfeed 68 63
Was breastfeeding at one week 61 52
Painful perineum a major problem 12 1
Urinary tract Infection a major problem 1 3
Major urinary problems (e.g., loss of bladder control) 4 7
Bowel problems a major problem 6 11
Frequent headaches a major problem 5 10
Backache a major problem 10 14

Listening to Mothers
– 42 –
After the birth, experiences of mothers in the two groups differ, though comparisons must be made with caution because the identified condition may be the result of factors that led to a cesarean rather than the cesarean itself. Mothers having a vaginal birth more often reported that a painful perineum was a major problem within the first two months (12%), while mothers who had a cesarean more frequently reported bowel (11%) and urinary (7%) problems, as well as backache (14%) and headaches (10%), as a major problem within the first two months.
Comparing First-Time and Experienced Mothers Mothers who had given birth before reported profound differences in their experiences when compared to mothers having a baby for the first time, though there are also several similarities of note. Almost four in ten experienced and new mothers (38% each) indicated that their pregnancy was unplanned (occurred sooner than desired or was not desired at all). The major difference between the groups in the prenatal period involved where mothers got their information. Experienced mothers relied primarily on their own previous experience(s) as their primary or secondary source of information on pain relief options in preparing for this birth, and few attended childbirth preparation classes. Seven out of ten (70%) new mothers attended classes and described them as their primary source of information on pain relief. New mothers also relied much more heavily on friends and family (41%), books (26%), and the Internet (11%) than did experienced mothers (23% friends/family; 12% books; 5% Internet).
First-time mothers who participated in the Listening to Mothers survey were somewhat more likely to have an attempt made to induce their labor (50% versus 42%) and much more likely to have an epidural (74% to 57%). First-time mothers were much more likely to have a cesarean birth (31% versus 21%). If experienced mothers had not had a cesarean in a previous birth, they rarely had one for the most recent birth (5% primary cesarean rate for experienced mothers versus 31% for first-time mothers). Experienced mothers were about twice as likely (11% to 6%) to have a midwife as their birth attendant, and experienced mothers’ perceptions of the experience of labor were much more positive. While about two-thirds of both new and experienced mothers anticipated breastfeeding, 63% of experienced mothers were breastfeeding at one week compared to 52% of new mothers. Experience was not protective from some postpartum
“My most recent labor was a much more positive experience than my first labor. I believe the midwife and the lack of medical interventions made all the difference. During my first labor I had Pitocin, internal monitors, and an IV and was made to feel helpless.” “I wish that I had been as informed during my first child's birth as my second. It was very much to my detriment (and my son's) the things I didn't know.”

Listening to Mothers
– 43 –
difficulties, as both sets of mothers who had cesareans experienced pain from the incision at about the same rate. After the baby came home, experienced mothers and new mothers expressed similar rates of identification with the terms “tired” and “organized,” even though experienced mothers had responsibility for more than one child. Experienced mothers selected the term “confident” (79%) to describe the weeks and months after giving birth at a much higher rate than new mothers (61%). (Table 13)
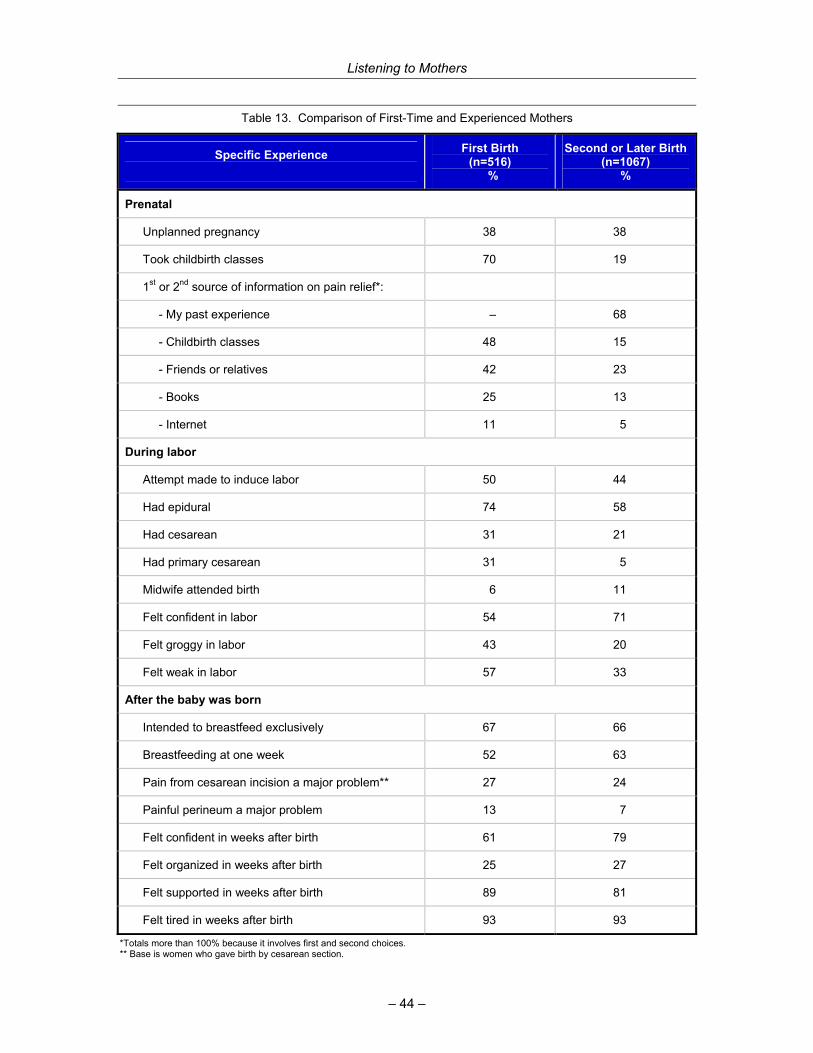
Listening to Mothers
– 44 –
Table 13. Comparison of First-Time and Experienced Mothers
*Totals more than 100% because it involves first and second choices. ** Base is women who gave birth by cesarean section.
Specific Experience
First Birth (n=516)
%
Second or Later Birth(n=1067)
%
Prenatal
Unplanned pregnancy 38 38
Took childbirth classes 70 19
1st or 2nd source of information on pain relief*:
- My past experience – 68
- Childbirth classes 48 15
- Friends or relatives 42 23
- Books 25 13
- Internet 11 5
During labor
Attempt made to induce labor 50 44
Had epidural 74 58
Had cesarean 31 21
Had primary cesarean 31 5
Midwife attended birth 6 11
Felt confident in labor 54 71
Felt groggy in labor 43 20
Felt weak in labor 57 33
After the baby was born
Intended to breastfeed exclusively 67 66
Breastfeeding at one week 52 63
Pain from cesarean incision a major problem** 27 24
Painful perineum a major problem 13 7
Felt confident in weeks after birth 61 79
Felt organized in weeks after birth 25 27
Felt supported in weeks after birth 89 81
Felt tired in weeks after birth 93 93
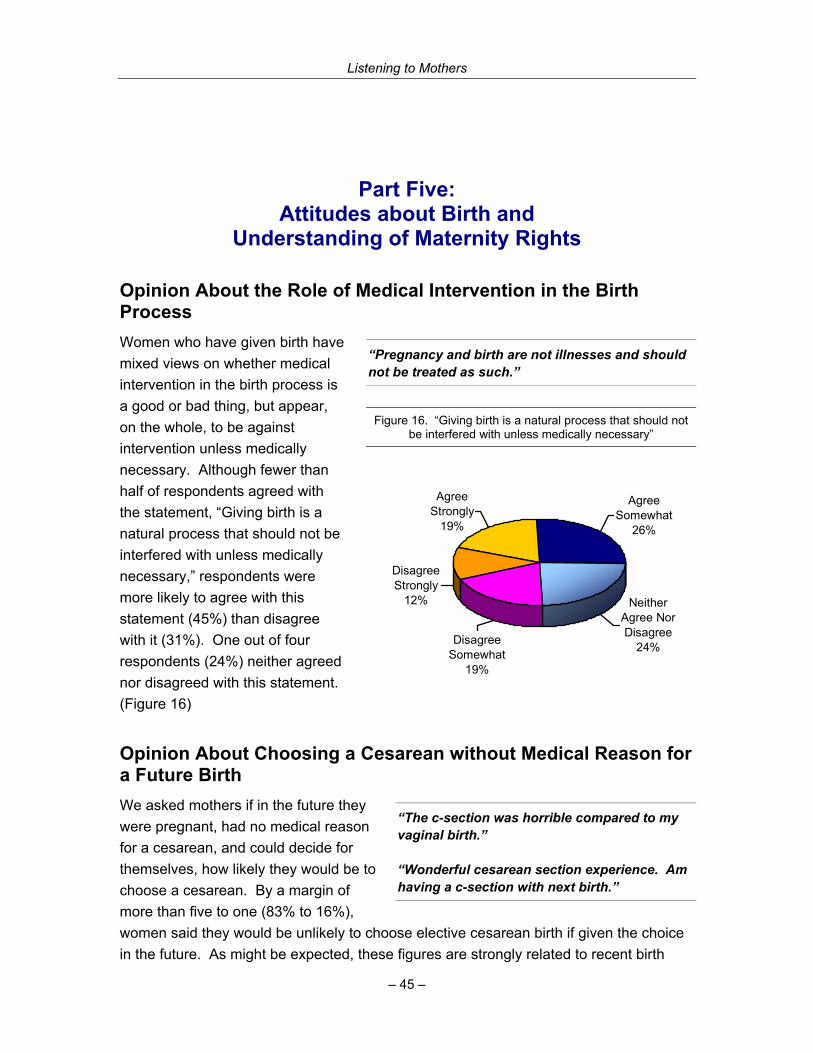
Listening to Mothers
– 45 –
Part Five: Attitudes about Birth and
Understanding of Maternity Rights
Opinion About the Role of Medical Intervention in the Birth Process Women who have given birth have mixed views on whether medical intervention in the birth process is a good or bad thing, but appear, on the whole, to be against intervention unless medically necessary. Although fewer than half of respondents agreed with the statement, “Giving birth is a natural process that should not be interfered with unless medically necessary,” respondents were more likely to agree with this statement (45%) than disagree with it (31%). One out of four respondents (24%) neither agreed nor disagreed with this statement. (Figure 16)
Opinion About Choosing a Cesarean without Medical Reason for a Future Birth We asked mothers if in the future they were pregnant, had no medical reason for a cesarean, and could decide for themselves, how likely they would be to choose a cesarean. By a margin of more than five to one (83% to 16%), women said they would be unlikely to choose elective cesarean birth if given the choice in the future. As might be expected, these figures are strongly related to recent birth
“Pregnancy and birth are not illnesses and should not be treated as such.”
Figure 16. “Giving birth is a natural process that should not be interfered with unless medically necessary”
Disagree Strongly
12%
Agree Somewhat
26%
Agree Strongly
19%
Disagree Somewhat
19%
Neither Agree Nor Disagree
24%
“The c-section was horrible compared to my vaginal birth.” “Wonderful cesarean section experience. Am having a c-section with next birth.”

Listening to Mothers
– 46 –
experience. Women who had recently experienced a vaginal birth were 16 times less likely (93% to 6%) to choose a cesarean, while women who had experienced a cesarean in their last birth were evenly split (51% unlikely; 47% likely) in their preference.
Knowledge of Legal Rights, Interest in Knowing More We asked about knowledge of specific dimensions of women’s legal rights to fully informed consent, and most women reported that while they were pregnant and giving birth they had been aware of certain rights. Six out of ten (62%) respondents said that during that period they had fully understood their right to receive clear and full explanations of any procedure, drug, or test offered to them – including benefits, risks, and alternatives. Three out of ten (30%) said that they had had some knowledge of these rights but did not know the details. Eight percent said that they had not known that they had these legal rights.
Two out of three women (66%) said that at the time they were pregnant and giving birth, they had fully understood that they had the right to accept or refuse any procedure, drug, or test offered. Almost three out of ten (27%) reported having had some knowledge of this right, but did not know the details, and seven percent said that they had not known that they had this legal right. Slightly more than a third (37%) of the women reported they would have liked to have known more about these and other legal rights when they were receiving maternity care.
“Empower yourself with knowledge. You can't possibly make the best decisions for yourself if you don't have every scrap of information available.” “It is important to know what your options are prior to going into the hospital and to have a plan and a clear understanding of what you want with your husband so that when issues do arise they are already answered and you can concentrate on the birthing process and the baby when it is born and not have to worry about making decisions.” “I was extremely offended, by the attitude that my consent or understanding was not needed. I was not completely aware at that time that I had the right to refuse treatment.”
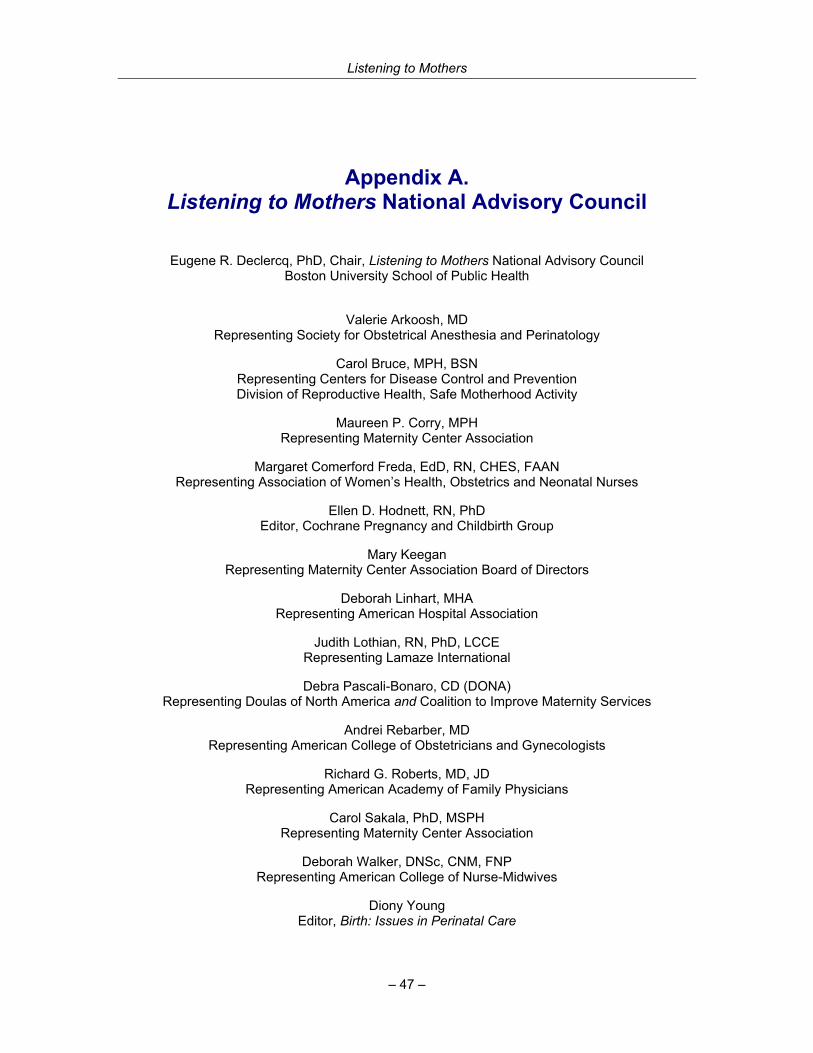
Listening to Mothers
– 47 –
Appendix A. Listening to Mothers National Advisory Council
Eugene R. Declercq, PhD, Chair, Listening to Mothers National Advisory Council
Boston University School of Public Health
Valerie Arkoosh, MD Representing Society for Obstetrical Anesthesia and Perinatology
Carol Bruce, MPH, BSN Representing Centers for Disease Control and Prevention Division of Reproductive Health, Safe Motherhood Activity
Maureen P. Corry, MPH Representing Maternity Center Association
Margaret Comerford Freda, EdD, RN, CHES, FAAN Representing Association of Women’s Health, Obstetrics and Neonatal Nurses
Ellen D. Hodnett, RN, PhD Editor, Cochrane Pregnancy and Childbirth Group
Mary Keegan Representing Maternity Center Association Board of Directors
Deborah Linhart, MHA Representing American Hospital Association
Judith Lothian, RN, PhD, LCCE Representing Lamaze International
Debra Pascali-Bonaro, CD (DONA) Representing Doulas of North America and Coalition to Improve Maternity Services
Andrei Rebarber, MD Representing American College of Obstetricians and Gynecologists
Richard G. Roberts, MD, JD Representing American Academy of Family Physicians
Carol Sakala, PhD, MSPH Representing Maternity Center Association
Deborah Walker, DNSc, CNM, FNP Representing American College of Nurse-Midwives
Diony Young Editor, Birth: Issues in Perinatal Care

Listening to Mothers
– 48 –
Appendix B. Demographic Overview of Survey Participants
Table 14. Unweighted and Weighted* Demographic Profile of Survey Participants
Base: All Respondents Unweighted
Number Unweighted
% Weighted
% Age
18 - 24 263 17 27
25 - 29 438 28 24
30 - 34 554 35 26
35 - 39 274 17 16
40 - 44 54 3 7
Education
High School or Less 236 15 44
Some College 642 41 30
College Graduate 471 30 19
Post Graduate 228 14 6
Income
< $25,000 182 11 19
$25,000 - $34,999 192 12 10
$35,000 - $49,999 279 18 15
$50,000 - $74,999 335 21 19
$75,000+ 347 22 21
Race/Ethnicity
White 1392 88 77
Black 50 3 9
Hispanic 47 3 8
Maternal birth place
United States 1522 96 95
Foreign 61 4 5
Number of times has given birth
One 551 35 33
Two 642 41 38
Three or more 390 25 30 * See Appendix C for a description of weighting procedures

Listening to Mothers
– 49 –
Appendix C. Methodology
Harris Interactive® conducted Listening to Mothers : The First National U.S. Survey of Women’s Childbearing Experiences on behalf of the Maternity Center Association. The survey consisted of 1,447 online participants and 136 telephone interviews with women who had given birth within two years of the time when they completed the survey. The women were reached between May 15 and June 16, 2002, and the survey took approximately 30 minutes to complete. A subset of online respondents was recontacted and asked a short series of follow-up questions during August 2002.
The Survey Questionnaire All interviews were conducted in English. The questionnaires used for the online and telephone interviews differed slightly in wording to reflect the specific requirements of these two different modes of interviewing. In addition, the telephone questionnaire contained fewer questions than the online version in order to limit fatigue among telephone respondents. On average, however, online and telephone interviews took about the same amount of time to complete, since respondents can typically complete a questionnaire faster online than by phone. The full survey questionnaire is available at: www.maternitywise.org/listeningtomothers/.
Eligibility Requirements All respondents were asked a series of preliminary questions to determine their eligibility for the survey. In order to be eligible, respondents had to have given birth: within the past two years, to a singleton (multiple births were excluded), and to a child who was still living at the time the survey was conducted. We decided to examine only singleton births because the relatively small proportion of multiple births in the U.S. is distinct from all births (for example, 60% of babies born in multiple births were delivered by cesarean in 2000), and would yield too few participants for us to examine separately. We eliminated births to mothers whose babies were not living at the time of the survey for two reasons. From an ethical perspective we felt that survey participation could be distressing to this group of mothers, and from the perspective of data analysis they are another distinctive and small group. To minimize bias, the screening questions were designed so that the eligibility criteria were not readily apparent.

Listening to Mothers
– 50 –
The Online Sample Potential respondents for the online survey were drawn from the Harris Poll Online (HPOL) panel of U. S. adults. Respondents in this panel have been recruited from a variety of sources, including the HPOL registration website and offerings made in conjunction with a number of organizations that include CBS Sportsline, Empire Page, Epinions, Excite@Home, FansOnly, get2net, Homework Central/Big Chalk, KGWN (Cheyenne, WY), Kyodo News, Live Broadway, MEAC Sports, MTV, NBC, Net Creations, Netscape, Nickelodeon, Plus94, The Black World Today, The Supershow, U.S. Olympic Committee, USA Swimming, Venture Direct, WCAU (Philadelphia, PA), WebMD, WOKR-13 (Rochester, NY,) and ZDNet.
Online Interviewing An email was sent to a sample of women age 18-44 drawn from the HPOL panel inviting them to participate in the survey. Embedded in this invitation was a direct link to the survey website enabling recipients to proceed to the survey immediately or at a later time more convenient to them. The survey was hosted on a Harris server and utilized advanced web-assisted interviewing technology.
After proceeding to the survey website, respondents were screened to determine their eligibility. Respondents satisfying the eligibility requirements were able to proceed into the actual survey. Once in the survey, respondents could complete the entire questionnaire in one session, or could choose to complete it in multiple sessions.
A number of steps were taken to maintain the integrity of the online sample and to maximize response to the survey. Among these measures was the use of password protection, whereby each email invitation contained a password that was uniquely assigned to the email address to which it was sent. Respondents were required to enter this password to gain access into the survey, ensuring that only one survey could be completed for each email invitation sent.
Additional steps taken to maximize response included offering respondents a brief summary of survey results, and sending “reminder” invitations to respondents who did not respond to the initial invitation within four days of receiving it.
We used the access afforded by the Internet to reinterview Internet respondents about two questions. First, for those mothers who had indicated that their vaginal birth had been “assisted,” we asked in the follow-up whether forceps or vacuum extraction had been used. In the second case, for those mothers who had indicated that an attempt had been made to induce labor, we asked if this effort had actually caused labor to begin. We reached 81% of the women who had originally indicated having had an

Listening to Mothers
– 51 –
“assisted” birth, and 67% of those who originally told us that caregivers had attempted to induce labor.
1
Telephone Sample The telephone sample consisted of respondents who had been “pre-identified” from recent monthly Harris national telephone surveys (August 2000 through May 2002) as either pregnant or having recently given birth. The Harris national telephone surveys from which telephone respondents were pre-identified used a methodology designed to produce a representative sample of English-speaking adults in telephone households in the continental United States. These surveys utilized a random-digit-dial (RDD) selection procedure that assured representation of adults in all telephone households – both “listed” and “unlisted”.
Telephone Interviewing All telephone interviewing was conducted from The Telephone Center (TTC) in Long Island City, New York. Households at which respondents had been pre-identified from previous Harris national telephone surveys were recontacted for the Listening to Mothers Survey and screened to confirm that a woman resided at the household who had given birth within the previous two years. Up to eight attempts were made over a two-week period to complete an interview with each of these pre-identified respondents. Interviewing staff was monitored on an ongoing basis to maintain interviewing quality. Due to the sensitive nature of many of the questions, all interviewing was conducted by female interviewers.
Data Processing All data were tabulated, checked for internal consistency and processed by computer. A series of computer-generated tables was then produced showing the results of each survey question, both by the total number of respondents and by key subgroups.
Weighting In order to more accurately reflect the target population, the data were weighted by key demographic variables, as well as by a composite variable known as a propensity score, intended to reflect a respondent’s propensity to be online. Demographic variables used for weighting included educational attainment, age, race/ethnicity, geographic region, household income, and time elapsed since last giving birth, using data from the March 2001 Supplement of the U.S. Census Bureau’s Current Population Survey and national natality data. The propensity score took into account selection biases that occur when

Listening to Mothers
– 52 –
conducting research using an online panel, and included measures of demographic, attitudinal, and behavioral factors that are components of the selection bias. A series of articles describe this methodology and report experiences with validating applications of the methodology.2
As a consequence of the methodology described, the Listening to Mothers survey was designed to be representative of the national population of women giving birth from mid-2000 through mid-2002, with the following exclusions: teens younger than 18 and new mothers older than 44, women with multiple births and with babies who had died, women in households without telephones, and women who do not speak English as a primary or secondary language.
Note about the Edinburgh Postnatal Depression Scale The ten-question Edinburgh Postnatal Depression Scale (EPDS) was initially published by Cox and colleagues in 1987.3 According to developers’ recommendation, the Listening to Mothers survey used the score cut-point of 12/13 as indicating that a woman was probably depressed in the week preceding the survey. In clinical settings using this screening tool, it is recommended that women scoring 13 or higher be referred for professional evaluation. The Listening to Mothers survey used a version of EPDS that has been slightly adapted for consistency with conventions of U.S. English, with permission of the Center for Disabilities and Development, University of Iowa.4
Reliability of Survey Percentages The results from any sample survey are subject to sampling variation. The magnitude of this variation is measurable and is affected both by the number of interviews involved and by the level of the percentages expressed in the results.
Table 15 shows the range of sampling variation that applies to percentage results for this survey. The chances are 95 in 100 that the survey results do not vary, plus or minus, by more than the indicated number of percentage points from the results that would have been obtained had interviews been conducted with all persons in the universe represented by the sample.
For example, if the response for a sample size of 200 is 30%, then in 95 out of 100 cases the response of the total population would be between 24% and 36%. Note that survey results based on subgroups of a small size can be subject to large sampling error.

Listening to Mothers
– 53 –
Table 15. Approximate Sampling Tolerances (at 95% Confidence) to Use In Evaluating Percentage Results Appearing in This Report
Number Asked Question on Which
Survey Result Is Based
Survey Percentage
Result at 10% or 90%
Survey Percentage
Result at 20% or 80%
Survey Percentage
Result at 30% or 70%
Survey Percentage
Result at 40% or 60%
Survey Percentage
Result at 50%
2,000 1 2 2 2 2
1,000 2 2 3 3 3
900 2 3 3 3 3
800 2 3 3 3 3
700 2 3 3 4 4
600 2 3 4 4 4
500 3 4 4 4 4
400 3 4 4 5 5
300 3 5 5 6 6
200 4 6 6 7 7
100 6 8 9 10 10
50 8 11 13 14 14
Sampling tolerances are also involved in the comparison of results from different surveys or from different parts of a sample (subgroup analysis). Table 16 shows the percentage difference that must be obtained before a difference can be considered statistically significant. These figures, too, represent the 95% confidence level.
For example, suppose one group of 100 has a response of 34% “yes” to a question, and an independent group of 50 has a response of 28% “yes” to the same question, for an observed difference of 6 percentage points. According to the table, this difference is subject to a potential sampling error of 16 percentage points. Since the observed difference is smaller than the sampling error, the observed difference is not significant.
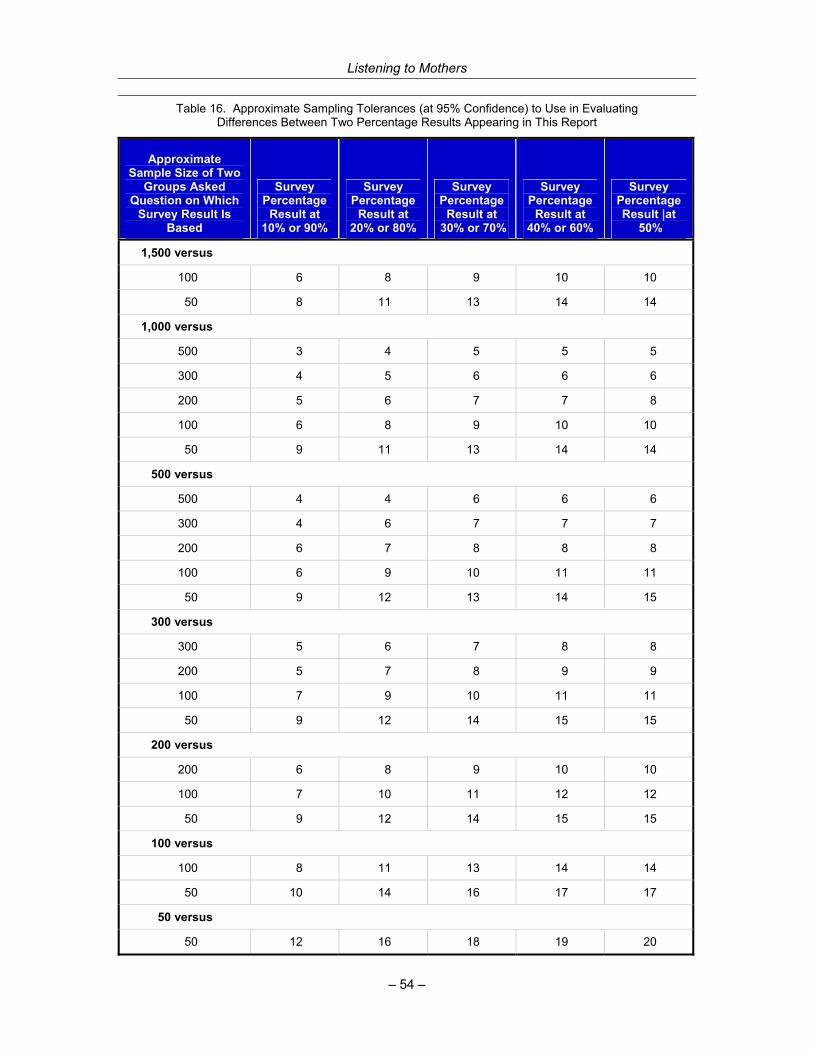
Listening to Mothers
– 54 –
Table 16. Approximate Sampling Tolerances (at 95% Confidence) to Use in Evaluating Differences Between Two Percentage Results Appearing in This Report
Approximate Sample Size of Two
Groups Asked Question on Which
Survey Result Is Based
Survey Percentage
Result at 10% or 90%
Survey Percentage
Result at 20% or 80%
Survey Percentage
Result at 30% or 70%
Survey Percentage
Result at 40% or 60%
Survey Percentage Result |at
50%
1,500 versus
100 6 8 9 10 10
50 8 11 13 14 14
1,000 versus
500 3 4 5 5 5
300 4 5 6 6 6
200 5 6 7 7 8
100 6 8 9 10 10
50 9 11 13 14 14
500 versus
500 4 4 6 6 6
300 4 6 7 7 7
200 6 7 8 8 8
100 6 9 10 11 11
50 9 12 13 14 15
300 versus
300 5 6 7 8 8
200 5 7 8 9 9
100 7 9 10 11 11
50 9 12 14 15 15
200 versus
200 6 8 9 10 10
100 7 10 11 12 12
50 9 12 14 15 15
100 versus
100 8 11 13 14 14
50 10 14 16 17 17
50 versus
50 12 16 18 19 20

Listening to Mothers
– 55 –
Non-Sampling Error Sampling error is only one type of error encountered in survey research. Survey research is also susceptible to other types of error, such as data handling error and interviewer recording error. The procedures followed by Harris Interactive, however, are designed to keep errors of these kinds to a minimum.
Notes 1 To simplify the presentation of the estimates based on these two reinterview questions, we apportioned the nonrespondents to the categories in the same proportion as the respondents. For example, 10% of mothers had “assisted” vaginal birth. When we followed up with those mothers asking if vacuum or forceps had been used, the results were vacuum 5.7%; forceps 2.5%, with 1.9% not recontacted. If the “not recontacted” mothers had vacuum or forceps deliveries in the same proportions as those we did reach, then the overall estimate of mothers having a vacuum assisted delivery would be 7.0% and forceps delivery would be 3.0%. Likewise in the case of induction, 44% of women indicated that their caregivers tried to cause their labor to begin. When we followed up with those mothers asking whether or not the drugs or other techniques had actually caused their labor to begin, the results were “yes, the drugs or other techniques caused my labor to begin” (24%), and “no, the drugs or other techniques did not cause my labor to begin” (6%), with 15% not recontacted. If the “not recontacted” mothers’ labor began in the same proportions as those we did reach, then the overall estimate of the proportion of all mothers whose labor was induced by drugs or some other technique would be 36%. The overall estimate of mothers who had an attempted induction that did not cause labor to begin would be 9% of all mothers. 2 Terhanian G, Bremer J. Confronting the selection-bias and learning effects problems associated with Internet research. Harris Interactive White Paper, August 16, 2000; Terhanian G, Bremer J, Smith R, Thomas R. Correcting data from online surveys for the effects of nonrandom selection and nonrandom assignment. Harris Interactive White Paper, 2000; Taylor H, Bremer J, Overmeyer C, Siegel JW, Terhanian G. Touchdown! Online polling scores big in November 2000. Public Perspective 2001 March/April;12(2):38-39; Taylor H, Terhanian G. Heady days are here again. Public Perspective 1999 June/July;10(4):20-23 (available online at: www.ropercenter.uconn.edu/pp_curr.html). Additional information about Harris Interactive methodology is available at: www.harrisinteractive.com/tech/interviews.asp. 3 Cox JL, Holden JM, Sagovsky R. Detection of postnatal depression: development of the 10-item Edinburgh Postnatal Depression Scale. British Journal of Psychiatry 1987 June;150:782-6. 4 Evaluating maternal mental health. EPSDT Care for Kids Newsletter 2000 Spring (available online at: www.medicine.uiowa.edu/uhs/EPSDT/spr00/index.cfm).

Listening to Mothers
– 56 –
Appendix D. Comparing Listening to Mothers Results and Federal
Vital and Health Statistics
The Listening to Mothers survey collected data on many maternity practices and interventions that have not been examined nationally within the U.S. vital and health statistics system. For example, the survey provides new national-level data about the extent of attempted induction (versus labor that was actually induced), induction agents and techniques, epidural analgesia and other pain medications, drug-free measures for labor pain relief, bladder catheterization in labor, manual exploration of the uterus after birth, eating and drinking in labor, mobility in labor, position used for giving birth, use of doulas and other providers of supportive care during labor, specialty of physician caregiver, and nurse who is not a midwife and physician assistant as primary birth attendants. In addition, the survey collected data on a series of items that are included on birth certificates and/or in federal hospital discharge data.
Table 17 compares many of these duplicative data items using federal data from 2000, the most recent year for which final federal data are available. To better assess comparability, we present national natality data exclusive of mothers below 18 years of age and mothers who had multiple births, two groups that were not included in the Listening to Mothers survey (see Appendix C). As there are some discrepancies in the figures from the two sources, we discuss possible explanations here.
In addressing discrepancies, it must be noted that the time frame for the births described is somewhat different in the two sources. The federal figures reflect data from calendar year 2000, whereas Listening to Mothers births took place over a two-year period beginning in May 2000. As the recent trend of some items in the federal data system is for progressive increase of rates (e.g., induced labor, electronic fetal monitoring, cesarean section, midwife-attended births) or for progressive decrease (e.g., vaginal birth after cesarean, episiotomy), it is likely that some discrepancies would be altered by comparing Listening to Mothers results to final federal data from 2001, a more optimal time frame.

Listening to Mothers
– 57 –
Table 17. Comparison of Listening to Mothers Survey Results and Federal Vital and Health Statistics
Data Item
Listening to Mothers
%
Singleton Births to Mothers 18
and Above** %
Place of birth
Hospital 97 99
Out-of-hospital birth center 1 *
Home 1 1
Birth attendant
Doctor 85 92
Midwife 10 8
Parity
Primiparous Mother 33 37
Multiparous Mother 67 63
Method of delivery
Vaginal 76 78
- Vaginal, vacuum extraction or forceps 11 9
- Vaginal birth after cesarean 4 2
Cesarean 24 22
- Primary Cesarean 14 15
- Repeat Cesarean 10 9
Procedures
“Stimulation” of labor (artificial oxytocin) (2000) 53 18
Electronic fetal monitoring (2000) 93 83
Induced labor 36 20
Episiotomy (% of vaginal births) 35 33 **All figures from annual reporting of birth certificate data, except episiotomy is from National Hospital Discharge Survey and is based on all women giving birth.
Some discrepancies may be explained by our use of a broader range of categories than the federal system. For example, we found that nurses who are not midwives were the primary attendants at 3% of births to Listening to Mothers respondents, and physician assistants at 1% of these births. As these categories are not available on birth certificates, these births probably appear as physician-attended births in the federal system. Physicians may also sign birth certificates for some births that are actually attended by midwives.1

Listening to Mothers
– 58 –
Another possibility is that the information that the women provided was less accurate than information organized by people who may have greater understanding of clinical matters. To limit this, we worked carefully to use clear and unambiguous language in the survey. For example, instead of asking whether a woman had experienced “manual exploration,” we asked whether a caregiver had checked inside her uterus with a gloved hand after birth. A series of validation studies have examined the accuracy of women’s recall and reporting about pregnancy and childbirth. They find that it is inappropriate to assume that medical records are consistently more accurate, that mothers may be more reliable sources for many data items, that maternal reporting can provide more complete information than medical records, that sensitive topics may be more accurately reported with data collection that is not face to face, and that the accuracy of maternal recall can persist over many years.2
Perhaps the most important consideration for understanding the disparate figures is considerable evidence about underenumeration in the federal natality reporting system, as acknowledged in official reports.3 A series of studies have examined the accuracy of birth certificate data when compared to medical records, hospital discharge summaries, and maternal reporting. Reports addressing our duplicative data items find that many of these appear to be underreported in federal sources, with some considerably underreported.4 These studies were conducted at state and local levels involving from fewer than 1,000 women to more than 100,000 women. They identify considerable variation in accuracy of reporting across hospitals and other units, and in some instances clarify that procedures for compiling the data differ in ways that could influence the accuracy and completeness of reporting.
Although the results of these studies thus cannot be used to specify the magnitude of underreporting nationally, they nonetheless identify some data items for which a considerable proportion of actual occurrences do not seem to be picked up in the federal reporting system. The most serious underreporting in the studies we examined was for labor that was “stimulated” or “augmented” with artificial oxytocin. In their comparison study, Piper and colleagues found that birth certificates identified just 26% of the women who had experienced this intervention. Other areas of notable concern include episiotomy (Parrish and colleagues found that discharge data in their sample identified only 56% of women who had had this procedure), vaginal birth after cesarean (several studies found from under 50% to 70% pick-up), and induced labor (Parrish and colleagues found that 56% of induced labors were identified, and Piper and colleagues found 61%). Somewhat better rates of enumeration have been reported for electronic fetal monitoring (Piper and colleagues: 74%, Dobie and colleagues: 78%) and for birth “assisted” with vacuum extraction or forceps (Parrish and colleagues: 70%, Piper and colleagues: 71%). These studies find even better rates of reporting, yet clear underenumeration, for primary and repeat cesareans. There have been special

Listening to Mothers
– 59 –
concerns with underreporting of historical data on birth certificates, which could account for results showing that records accurately picked up 91% (Dobie and colleagues) or 95% (DiGiuseppe and colleagues) of multiparous women.
Although the Listening to Mothers results have some limitations that are based on the methodology used and decisions followed, as explicitly described in Appendix C, we believe that our data also have important strengths relative to other sources. Mothers have been shown to provide accurate information about many dimensions of their childbearing experiences, our data items are more extensive and in some cases more finely nuanced than other national data and, of considerable importance, we believe that the Listening to Mothers survey begins to clarify the magnitude of underenumeration in some leading sources of national maternity data.
Notes 1 National comparison data are not available for specialty of physician birth attendant. In light of the many women who had never or had only briefly met their birth attendant (nearly three out of ten), we note that some respondents may have assumed that birth attendants who were in fact family physicians were obstetrician-gynecologists. 2 Yawn BP, Suman VJ, Jacobsen SJ. Maternal recall of distant pregnancy events. J Clin Epidemiol 1998 May;51(5):399-405; Lederman SA, Paxton A. Maternal reporting of prepregnancy weight and birth outcome: consistency and completeness compared with the clinical record. Matern Child Health J 1998 Jun;2(2):123-6; Oakley A, Rajan L, Robertson P. A comparison of different sources of information about pregnancy and childbirth. J Biosoc Sci 1990 Oct;22(4):477-87; Martin CJ. Monitoring maternity services by postal questionnaire: congruity between mothers’ reports and their obstetric records. Stat Med 1987 Jul-Aug;6(5):613-27; Hewson D, Bennett A. Childbirth research data: medical records or women’s reports? Am J Epidemiol 1987 Mar;125(3):484-91. 3 Martin JA, Hamilton BE, Ventura SJ, Menacker F, Park MM. Births: Final data for 2000. National Vital Statistics Reports; vol 50 no. 5. Hyattsville, Maryland: National Center for Health Statistics, 2002.
4 DiGiuseppe DL, Aron DC et al. Reliability of birth certificate data: a multi-hospital comparison to medical records information. Matern Child Health J 2002 Sep;6(3):169-79; Reichman NE, Hade EM. Validation of birth certificate data: a study of women in New Jersey’s HealthStart Program. Ann Epidemiol 2001 11(3):186-93; Dobie SA, Baldwin L-M et al. How well do birth certificates describe the pregnancies they report? The Washington State experience with low-risk pregnancies. Matern Child Health J 1998 2(3):145-54; Green DC, Moore JM et al. Are we underestimating rates of vaginal birth after previous cesarean birth? The validity of delivery methods from birth certificates. Am J Epidemiol 1998;147(6):581-6; Parrish KM, Holt VL et al. Variations in the accuracy of obstetric procedures and diagnoses on birth records in Washington State, 1989. Am J Epidemiol 1993;138(2):119-27; Piper JM, Mitchel EF et al. Validation of 1989 Tennessee birth certificates using maternal and newborn hospital records. Am J Epidemiol 1993;137(7):758-68.

About the Maternity Center Association The Maternity Center Association (MCA) is a national not-for-profit health organization dedicated to the needs and interests of childbearing women and their families. Since 1918, MCA has been a leader in identifying and demonstrating innovations to improve maternity care. Maternity Wise, MCA’s newest long-term program,
promotes evidence-based maternity care. This program helps childbearing women and maternity caregivers understand results of the best available research about effects of maternity practices, make informed decisions, and obtain or provide safe and effective care. The program also brings these issues to the attention of policy-makers and the media. Major program areas include the Listening to Mothers Initiative, the Labor Pain Initiative, and the Maternity Wise website (www.maternitywise.org).
About Harris Interactive Inc. Harris Interactive (www.harrisinteractive.com) is a worldwide market research and consulting firm best known for The Harris Poll
®, and for pioneering the
Internet method to conduct scientifically accurate market research. Headquartered in Rochester,
New York, Harris Interactive combines proprietary methodologies and technology with expertise in predictive, custom and strategic research. The Company conducts international research through wholly owned subsidiaries — London-based HI Europe (www.hieurope.com) and Tokyo-based Harris Interactive Japan — as well as through its network of local market- and opinion- research firms, and various U.S. offices.