Embed Size (px)
Citation preview


LIST OF TABLES i
LIST OF FIGURES i
ACKNOWLEDGEMENTS ii
EXECUTIVE SUMMARY iii
BACKGROUND TO THIS REPORT 1
Epidemiological studies of sport/leisure injury in Australia 2
ABOUT THIS REPORT 6
ABOUT THE DATA SOURCES USED 7
The Australian Bureau of Statistics Death Unit Record File 7
The NSW Inpatient Statistics Collection 7
Calculation of incidence rates 8
DEATHS IN NSW RESIDENTS, 2000-2002 9
HOSPITALISATIONS IN NSW RESIDENTS, 2003-2004 11
SPORT/LEISURE INJURY PREVENTION PRIORITIES FOR NSW 21
Injury rates 21
Gender 21
Young people 21
Type of sport/leisure activity 22
Injury mechanisms 23
Injury type 23
Injury severity 23
DATA IMPROVEMENT PRIORITIES 25
REFERENCES 27
Appendix 1:
Summary of epidemiological studies of sport/leisure injury in Australia 29
Appendix 2: ICD-10-AM codes 33
Appendix 3: Data from the ERASS 45
ISBN 0-9580633-4-6
Published by: NSW INJURY RISK MANAGEMENT RESEARCH CENTREUNSW, SYDNEY NSW 2052, AUSTRALIATelephone: +61 (2) 9385 4207 Facsimile: +61 (2) 9385 6040 http://www.irmrc.unsw.edu.au
Design and Production: Lawton Design pty ltd
Co
nte
nts


i
Lis
t of fig
ure
s
Table 1 The 10 most common sport/leisure activities related to hospitalisations in NSW within each age group iii
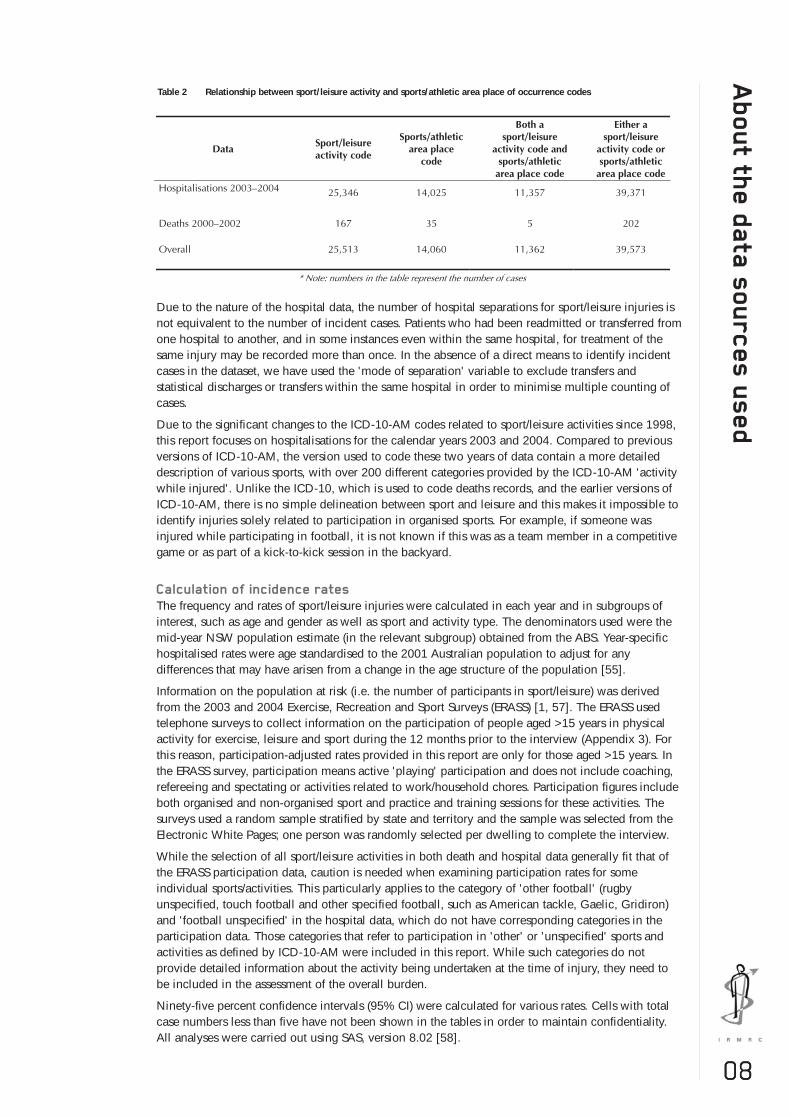
Table 2 Relationship between sport/leisure activity and sports/athletic area place of occurrence codes 8
Table 3 Number and rate, per 100,000 population, of deaths related to sport/leisure activities by gender and activity type, NSW, 2000-2002 9
Table 4 Number and rate, per 100,000 population, of deaths related to sport/leisure activities by age group and activity type, NSW, 2000-2002 9
Table 5 The four most common mechanisms of death related to sport/leisure activities by activity type, NSW, 2000-2002 10
Table 6 Nature of deaths related to sport/leisure activities by activity type, NSW, 2000-2002 10
Table 7 Number and rate, per 100,000 population, of sport/leisure injury hospitalisations, NSW, 2003-2004 11
Table 8 Number and rate, per 100,000 participants and 100,000 population, of sport/leisure injury hospitalisations, NSW, 2003-2004 11
Table 9 Number and rate, per 100,000 population, of sport/leisure injury hospitalisations by gender and ICD-10-AM version 3 sport/leisure categories, NSW, 2003-2004 12
Table 10 Number and rate, per 100,000 population, of sport/leisure injury hospitalisations by year and ICD sport/leisure categories, NSW, 2003-2004 13
Table 11 Number and rate, per 100,000 participants aged >15 years, of sport/leisure injury hospitalisations by year and ICD sport/leisure, NSW, 2003-2004 14
Table 12 Number and rate, per 100,000 population, of sport/leisure injury hospitalisations by age group and ICD sport/leisure categories, NSW, 2003-2004 15
Table 13 Most common external causes (mechanisms) of sport/leisure injuries resulting in hospitalisations, NSW, 2003-2004 17
Table 14 Most common principal diagnoses of sport/leisure injuries resulting in hospitalisation, NSW, 2003-2004 19
Table 15 The length of stay, in days, of sport/leisure injury hospitalisations by selected sport/leisure types, NSW, 2003-2004 20
Figure 1 Age-standardised rates, per 100,000 population, of deaths related to sport/leisure activities by gender and year, NSW, 2000-2002 9
Figure 2 Mechanisms of sport/leisure injuries resulting in hospitalisations, NSW, 2003-2004 16
Figure 3 Nature of injury (according to principal diagnosis) of hospital separations resulting from sport/leisure injury, NSW, 2003-2004 18
Figure 4 Body region (according to principal diagnosis) of sport/leisure injuries resulting in hospitalisation, NSW, 2003-2004 18
Figure 5 Location where the events leading to hospitalised sport/leisure injuries occurred, NSW, 2003-2004 19
Lis
t of ta
ble
s
ii
Ac
kn
ow
led
ge
me
nts
ACKNOWLEDGEMENTS
This project was funded by the NSW Sporting Injuries Committee (NSWSIC) under its Research andInjury Prevention Scheme.
Soufiane Boufous was supported by the NSWSIC Grant and the NSW Injury Risk ManagementResearch Centre (IRMRC) Core Funding, which is provided by the NSW Department of Health, theNSW Roads and Traffic Authority and the NSW Motor Accidents Authority. Rebecca Dennis wassupported by an NHMRC Population Health Capacity Building Grant in Injury Prevention, Traumaand Rehabilitation. Caroline Finch was supported by an NHMRC Principal Research Fellowship.
The hospitalisations and deaths data analysed in this study were accessed via the NSW Departmentof Health's Health Outcomes Information Statistical Toolkit (HOIST), maintained by the Centre forEpidemiology and Research.
Data regarding participation in sport and recreation activities were obtained from the Exercise,Recreation and Sport Survey (ERASS). The ERASS is a joint initiative of the Australian SportsCommission and the state and territory agencies responsible for sport and recreation.
The National Centre for Classification in Health provided the list of ICD-10-AM Third Editionexternal causes of injury codes reproduced in this report.
Development of this project and the resultant report benefited from the advice of the ProjectAdvisory Committee (PAC). This PAC also provided constructive comments on draft versions of thisreport. The members of the PAC were:
> Professor William Dunsmuir - School of Mathematics, UNSW
> Ms Sonya Jenkins - NSW Sporting Injuries Committee
> Dr Andrew McIntosh - School of Safety Science, UNSW
> Ms Claire Monger - Injury Prevention and Policy Branch, NSW Health
> Ms Rosemary Perry - NSW Department of Sport and Recreation
> Dr Shauna Sherker - NSW Injury Risk Management Research Centre, UNSW.
Comments on the draft report were received with thanks from Associate Professor Ann Williamsonand Ms Claire Monger.
iii
Exe
cu
tive
su
mm
ary
EXECUTIVE SUMMARY
Participation in sport and physical activity provides a range of health-related benefits. However,increased participation increases exposure to the risk factors associated with injury, with sport andleisure (hereafter referred to as sport/leisure) injury being recognised as a significant public healthissue in Australia. All physical activity promotion strategies therefore need to be based on thedelivery of safe activities. Planning for safety policy and injury prevention initiatives needs to beinformed by high-quality, relevant data.
This report provides an overview of hospitalisations and deaths due to sport and leisure injury inNSW to help guide policy development and priority setting in this state. Injury data were obtainedfrom existing routine databases that contain information on sport/leisure related deaths andhospitalisations in NSW. Mortality data were obtained from the Australian Bureau of Statistics'Deaths dataset for the three-year period 2000-2002 and information pertaining to hospitalisationswas retrieved from the NSW Inpatient Statistics Collection for the two calendar-year period 2003-2004.
During 2000-2002, there was a total of 167 sport/leisure-related deaths in NSW, corresponding to arate of 0.85 deaths per 100,000 population during the three year period. The death rate for maleswas almost four times higher than in females. Those aged 15-24 years had the highest age-specificrate of death in sport and those aged over 35 years had the highest age-specific rate of death inleisure activities.
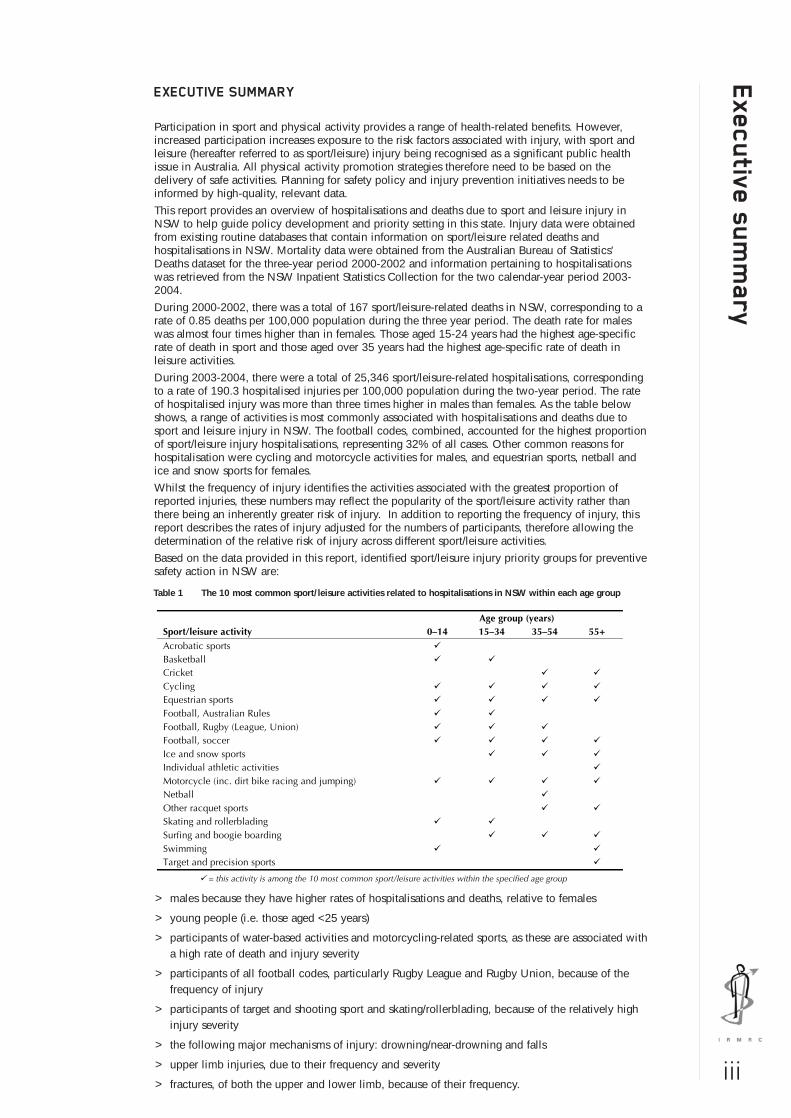
During 2003-2004, there were a total of 25,346 sport/leisure-related hospitalisations, correspondingto a rate of 190.3 hospitalised injuries per 100,000 population during the two-year period. The rateof hospitalised injury was more than three times higher in males than females. As the table belowshows, a range of activities is most commonly associated with hospitalisations and deaths due tosport and leisure injury in NSW. The football codes, combined, accounted for the highest proportionof sport/leisure injury hospitalisations, representing 32% of all cases. Other common reasons forhospitalisation were cycling and motorcycle activities for males, and equestrian sports, netball andice and snow sports for females.
Whilst the frequency of injury identifies the activities associated with the greatest proportion ofreported injuries, these numbers may reflect the popularity of the sport/leisure activity rather thanthere being an inherently greater risk of injury. In addition to reporting the frequency of injury, thisreport describes the rates of injury adjusted for the numbers of participants, therefore allowing thedetermination of the relative risk of injury across different sport/leisure activities.
Based on the data provided in this report, identified sport/leisure injury priority groups for preventivesafety action in NSW are:
> males because they have higher rates of hospitalisations and deaths, relative to females
> young people (i.e. those aged <25 years)
> participants of water-based activities and motorcycling-related sports, as these are associated witha high rate of death and injury severity
> participants of all football codes, particularly Rugby League and Rugby Union, because of thefrequency of injury
> participants of target and shooting sport and skating/rollerblading, because of the relatively highinjury severity
> the following major mechanisms of injury: drowning/near-drowning and falls
> upper limb injuries, due to their frequency and severity
> fractures, of both the upper and lower limb, because of their frequency.
Table 1 The 10 most common sport/leisure activities related to hospitalisations in NSW within each age group
Age group (years) Sport/leisure activity 0–14 15–34 35–54 55+ Acrobatic sports Basketball Cricket Cycling Equestrian sports Football, Australian Rules Football, Rugby (League, Union) Football, soccer Ice and snow sports Individual athletic activities Motorcycle (inc. dirt bike racing and jumping) Netball Other racquet sports Skating and rollerblading Surfing and boogie boarding Swimming Target and precision sports
= this activity is among the 10 most common sport/leisure activities within the specified age group
01
Ba
ckg
ro
un
d t
o t
his
re
po
rt BACKGROUND TO THIS REPORT
A large number of Australians take part in sport and leisure activities, with children and adultsparticipating in a wide variety of organised and non-organised activities. This has beenestablished by a number of surveys that collect information about the types and frequency ofactivities participated in by Australians. The Exercise, Recreation and Sport Survey (ERASS)collects information about participation in physical activity for exercise, recreation and sportfor people aged >15 years throughout Australia [1]. During the 12 months prior to the mostrecently reported survey conducted in 2004, it was estimated that 13.1 million people aged>15 years participated in at least one physical activity for exercise, recreation or sport. Thisrepresents 82.8% of the Australian population aged >15 years. More than half of these peopleparticipated in at least one activity that was organised by a club, association, fitness centre orother type of organisation. Similarly, the General Social Survey conducted by the AustralianBureau of Statistics (ABS) reported that nearly two-thirds of Australians aged >18 years hadparticipated in sports and physical activities in the 12 months prior to interview in 2002 [2].Participation for children is also common, with nearly 60% of children aged 5-14 yearsparticipating in organised sport outside of school hours in 1999-2000 [3] and more than 90%of children participating in at least one form of physical activity [4].
Participation in sport/leisure is encouraged by government agencies and physical activityexperts, based on research findings that participation provides health, physical, mental, socialand economic benefits to the individual and the community [5-7]. However, an increased levelof participation increases exposure to the risk factors associated with injury [8]. Sport/leisureinjury has been recognised as being a considerable problem by government agencies [9-11]. Itwas one of the 10 priorities chosen for the development of national goals and targets for injuryprevention and control, as it was significant in terms of mortality and morbidity and thereappeared to be good opportunities for action to reduce injury rates in the short or long term [9,10].
The SportSafe Australia framework recognised the economic burden of sport/leisure injuries forboth individuals and society with respect to the duration and nature of treatment, the amountof sport and/or working time lost, permanent damage or disability, reduced quality of life andother monetary costs [11]. This burden was quantified in a study of the cost of injury inVictoria, with sport being responsible for the greatest number of non-fatal injuries andassociated costs [12]. A report of the cost of injury in NSW estimated that sport/leisure injuriescost $92 million during the 1998-1999 financial year, of which $40 million was attributable todirect costs and $52 million to mortality and morbidity costs [13]. Compared with othermechanisms of injury in NSW, sport/leisure injury was ranked seventh in terms of lifetime cost,but third in terms of direct costs, after falls and road traffic accidents [13]. These calculationsdemonstrate that sport/leisure injury is a significant public health issue in NSW and Australia.
Although there are inherent risks in most activities, like all other injuries, sport/leisure injuriescan be prevented or controlled through implementing appropriate interventions [11]. This isbecause injury is not a random event, but a result of the interaction between several factors(the person, the activity being undertaken and the immediate environment) and can beprevented and controlled by implementing effective prevention strategies [10, 14].
As identified in a recent review of epidemiological studies in Australia [16], there has been asignificant increase in knowledge in some aspects of sport/leisure injury and sport/leisure safetyover the past decade, but many facets remain quite limited. While few broad epidemiologicalstudies of the incidence of sport/leisure injury have been conducted, there is sufficientevidence to identify sport/leisure injury as a substantial problem for both adults and children.Some of the studies that have used population-based data to investigate the range ofsport/leisure injuries sustained in a variety of activities are discussed below.
In addition to the population-based studies investigating the broad range of sport/leisureinjuries, there have been studies of individual sports and/or particular subgroups of participantsin activities such as Australian football [15-18], cricket [19-21], squash [22], snowboarding[23], boxing [24], gymnastics [25], rugby league [26, 27], rugby union [28] and equestrianactivities [29]. Limited information relating to injuries sustained at particular sport events orpresenting to specific institutions or clinics has been provided by several other Australianstudies [30-32]. However, these studies are limited in their ability to provide information thatcan be extrapolated to a broad population level, as they have focused solely on elite-levelsport or other specific contexts of activity, injuries to certain playing positions or specific injurydiagnoses. On a frequency basis, most injuries occur to community sport/leisure participants asthey account for the vast majority of all participants. Data relating to elite athletes may not be
02
Ba
ckg
ro
un
d to
this
re
po
rt
applicable to all participants because the injury risk factors and injury profiles can be different.Nevertheless, these studies do provide some information that can be used to inform thedevelopment of injury prevention efforts. Further research is needed to extend currentknowledge so that evidence-based strategies to prevent sport/leisure injuries can be developedfor participants across all age groups and abilities [33]. High-quality, routinely collectedsport/leisure injury data are required to inform this [34].
Currently, there is no comprehensive national, or even statewide, data collection of allmedically treated sport/leisure injuries in Australia. The feasibility of a national sport/leisureinjury data and information system was identified as a priority in 1997 by the Australian SportsInjury Prevention Taskforce [11], following a previous report by Finch et al. in 1995 [8]. Bothreports recommended a standardised approach to the collection of injury data across a varietyof sport/leisure settings. This led to the establishment of the Australian Sports Injury DataWorking Party which developed the Australian sports injury data dictionary [35]. Although thiswas a significant step towards standardising the collection of national sport/leisure injury data,there is still no national data source to provide a comprehensive view on the magnitude ofsport-related injuries. The same is true for all Australian states and territories individually.
The main sources of routinely collected population-based sport/leisure injury data continue tobe general data collections, such as those relating to hospital admissions, emergencydepartment presentations and coronial records. However, together these sources have rarelybeen used to their full potential in the sport/leisure injury context [36]. Furthermore, manyhave not been examined in conjunction with participation figures and the value of manyprevious sport/leisure injury studies has been hampered by a lack of participation-adjustedincidence rates. Another limitation of research conducted to date is that it is difficult todetermine the true extent of the sport/leisure injury problem, as injury surveillance systemshave adopted differing definitions of sport. Some studies have incorporated active recreation,physical activity, leisure and play activities with more formal, competitive sport; others havefocused on specific formal sport groups. Differing definitions of injury have also been used,with some only monitoring those that require admission to hospital, whereas others includethose that require any sort of medical attention, including self-treatment.
A number of population-based epidemiological studies have been conducted in Australia,providing a range of information regarding the occurrence of sport/leisure injury. Some studieshave used population and/or participation rates to calculate adjusted rates of injury incidence,while others have simply reported the frequency of injury across broad populations. Otherstudies have been focused at specific subgroups, such as participants in a particular sport.Ideally, participation and exposure data should be gathered as this allows the calculation of therelative risk of injury across different sport/leisure activities. Unfortunately, this has not beenthe case for all studies of sport/leisure injury.
Epidemiological studies of sport/leisure injury in Australia
Epidemiological studies of sport/leisure injury in Australia are described below, highlighting thefrequency/incidence of sport/leisure injury, the age and gender most often affected and theactivities most often associated with injury. A summary of the methods and findings of thesestudies is presented in Appendix 1.
The most recent study was a description of hospitalisations in Australia due to sport/leisureinjury, which was released in 2006 by the Australian Institute of Health and Welfare [37]. Thereport used data from the National Hospital Morbidity Database. Data pertaining tohospitalisations during the period July 2002 to June 2003 were extracted and those casesrelating to sport/leisure injury, as identified by the ICD-10-AM activity codes (U50-U72), wereselected for inclusion in the report. Participation-adjusted rates of injury were calculated usingparticipation data from the ERASS 2003 annual report. As the participation data did not coverall age groups, rates were only calculated for those aged >15 years. During the study period,there were 45,452 sport/leisure-related hospitalisations in Australia, which represented 0.7% ofall hospitalisations. This corresponded with an injury incidence of 231.4 hospitalisations per100,000 population. As with previous studies, the majority of sport/leisure injury cases weremales (73.9%) and more than half of all sport/leisure injury hospitalisations were for a fracture(52.8%). The injury rate was 243 injuries per 100,000 participants (aged >15 years).
In the same study, the highest rate of hospitalised sport/leisure injury was in the age group 15-24 years, with 517 injuries/100,000 participants [37]. The rate of injury was more than threetimes greater for males (373 injuries/100,000 participants) than for females (115injuries/100,000 participants). Australian football was associated with the greatest number ofhospitalisations with 3944 cases (8.7% of all cases). When all football codes (Australian

03
Ba
ckg
ro
un
d t
o t
his
re
po
rt football, Rugby League, Rugby Union, soccer, touch football and other unspecified football
activities) were combined, there were 12,600 cases, accounting for 27.7% of allhospitalisations for sport/leisure injury. Following the football codes, the activities associatedwith the greatest number of hospitalisations were water sports (6.2% of all cases), cycling(6.0%), roller sports (5.0%) and wheeled motor sports (4.6%). When considering the sport-specific injury rate after adjusting for the number of participants (for those aged >15 years), thehighest ranking activities for hospitalisation were wheeled motor sports (rate of 942.7hospitalisations/100,000 participants), roller sports (738.6 hospitalisations/100,000participants), Australian football (734.3 hospitalisations/100,000 participants), equestrianactivities (692.7 hospitalisations/100,000 participants) and Rugby League (677.9hospitalisations/100,000 participants).
One of the first studies to investigate sport and recreation injury across a general populationusing routinely collected injury data, as well as to use participation and population data tocalculate adjusted rates of injury, was conducted by Gabbe and colleagues [38]. Routinelycollected data was used to describe the epidemiology of serious injuries and deaths sustainedby adults (aged =15 years) in sport and recreation activities statewide across Victoria over theperiod July 2001 to June 2003. A total of 150 cases of serious injury and 48 deaths wereidentified from both the Victorian State Trauma Registry and the National Coronial InformationService (NCIS). After adjusting for the numbers of participants based on the ERASS participationdata, this equated to 1.8 cases of serious injury, and 0.6 deaths, per 100,000 participants peryear. Motor sports accounted for the majority of the total number of serious injury and deathsrecorded, with 63 (31.8%) cases of injury/death. After adjusting for participation, motor sportsremained the highest-ranking activity, with 113.3 injuries/deaths per 100,000 participants.Waterskiing and power boating had an injury/death rate of 31.5 cases per 100,000participants, followed by horse riding with 29.7 cases per 100,000 participants. AlthoughAustralian football was the third highest sport when considering the number of cases (n = 17),after adjusting for participation it was ranked sixth, with 5.5 cases per 100,000 participants.While the age-adjusted rates of serious injury and death were overall quite low, the rates were12 times higher for men than for women.
Cassell and colleagues [39] conducted a study using population-based injury data in Victoria,describing the epidemiology of medically treated sport/leisure injuries to people aged over 4years during a 12-month period in 1994-95. This study was restricted to a geographicallydefined region of Victoria, the Latrobe Valley. The injury data related to emergency departmentpresentations, hospital admissions, and presentations to general practitioners (GPs). Over the12 months, there were 112 hospital admissions for sport/leisure injury (an annual injuryincidence of 16 admissions/10,000 residents aged >4 years). There were also 1179 emergencydepartment presentations (197/10,000 residents) and 1003 presentations to GPs (187/10,000residents). For hospital admissions, emergency department presentations and GP visits themajority of cases were male (70%, 73% and 67%, respectively). For both emergencydepartment and GP data, Australian football was the highest-ranking activity in terms of theproportion of injury presentations, with 24.0% and 22.0% of all cases respectively. Othersports and active recreation activities commonly associated with injury were cycling (15.7%and 12.6% of all emergency department presentations and all GP presentations, respectively),basketball (13.8% and 17.5%), netball (6.9% and 6.7%), cricket (6.4% and 5.5%) and soccer(5.4% and 5.9%).
A telephone survey was conducted with a total of 1,337 respondents in Queensland in 2000,to determine the incidence of sport/leisure injuries to adults aged 18 years that were treated bya healthcare professional [40]. A total of 191 respondents reported that they had sustained asport or recreation injury that required medical attention in the 12 months prior to interview,representing a rate of 1,660 injuries per 10,000 population. The injury rate in males wasalmost twice that in females. Those in the 18-30 years age group had the highest population-adjusted rate of injury. Respondents were asked about their regular participation (at least oncea week) in sport or a recreational activity in the 12 months prior to interview to allow thecalculation of injury incidence rates adjusted for participation. In terms of the frequency ofinjury, the activities with the greatest number of injuries that were medically treated werewalking, recreational swimming, recreational bicycling and golf. However, after adjusting forthe numbers of participants, these activities had the lowest injury rates per 1,000 participants.Rugby League had the highest injury rate, with 585 injuries per 1,000 participants. This wasfollowed by basketball (579 injuries), martial arts (565 injuries) and netball (323 injuries). Justunder half (44.1%) of the injuries were first seen by a GP, 23.1% were first seen by anemergency department and 20.9% were first seen by a physiotherapist.
04
Ba
ckg
ro
un
d to
this
re
po
rt
In addition to studies investigating sport/leisure injury using routinely collected data, a limitednumber of other Australian studies have developed their own project-specific injurysurveillance systems. One such study, conducted in Western Australia, investigated theincidence of sport/leisure injury among community-level players participating in Australianfootball, field hockey, basketball and netball [41]. During a five-month season, 51% of theparticipants sustained one or more injuries but only 3% required treatment at an emergencydepartment or admission to hospital. The highest injury incidence rate was in Australianfootball (20.3 injuries/1,000 hours of participation), followed by field hockey (15.2injuries/1,000 hours of participation), basketball (15.1 injuries/1,000 hours of participation) andnetball (12.1 injuries/1,000 hours of participation).
Overall, the studies that have used broadly encompassing definitions of sport/leisure injurieshave found the most severe and frequent injuries to be associated with motorcycling, othermotor sports and water-based activities. Studies that have used a more conventional definitionof sport have found team ball sports, particularly the football codes, to be most commonlyassociated with injury.
In addition to those using routinely collected data sources, there have been several otherAustralian reports that have used population-based, retrospective survey data to investigate theoccurrence of sport/leisure injury to adults and children. These studies have generally not beenexposure-adjusted and hence do not report injury rates; in the main, they just report thefrequency of cases. One such study used data from the National Health Survey (NHS), which isconducted by the Australian Bureau of Statistics (ABS) [42]. By extrapolating the survey sampledata to the entire Australian population, it was estimated that 367,200 people with a currentinjury or injury-related condition had sustained their most recent injury (in the previous month)during organised sport. This represented 16.3% of all injured persons and 1.9% of the totalAustralian population. A further 616,800 people reported that their recent injury wasattributable to a leisure activity, representing 27.4% of all injured persons and 3.3% of the totalAustralian population. With specific reference to sport/leisure injury, this was the fourthhighest-ranking activity at the time of injury for all persons after leisure activities, working foran income and domestic activities. However, sport was the second highest-ranking activity atthe time of injury for those aged 15-24 years and the majority of people reporting asport/leisure injury were male (66.3%). With respect to the action taken after injury, 35.5% ofinjured persons visited a doctor or other health professional for treatment, and 10.0% attendedhospital.
Another survey was conducted by Medibank Private, a private health insurance company, of650 of its members to determine their frequency of injury [43]. Of the members surveyed, 10%reported that they had been injured while participating in a sport activity in the 12 monthsprior to interview and 16% had been injured in the 24 months prior. Younger participants werethe most likely to sustain a sport/leisure injury, with one in four 18-24 year olds surveyedreporting an injury in the 12 months prior to interview. The football codes accounted for thegreatest number of sport/leisure injuries, but the figures were not adjusted for the numbers ofpeople participating in these sports.
While survey data are able to contribute information about the potential extent of thesport/leisure injury problem, these data are hindered by several factors, such as relying on self-reported injury data and potential sampling bias. Population-based injury data routinelycollected by medical institutions (such as hospital inpatient records and emergency departmentpresentations) are able to provide more comprehensive information. However, they are stilllimited by not being exposure-adjusted and so the rankings of the most common categoriesmay reflect the most popular activities, rather than the riskiest.
One of the first studies to use routinely collected, population-based injury data to investigatesport and active recreation injuries was conducted by Finch and colleagues, who examinedinjuries presenting to emergency departments throughout Australia during the period 1989-1993 [36]. Of the total number of injuries treated at the National Injury Surveillance Unit(NISU) emergency departments, 20% of all injuries to children (aged <15 years) and 18% of allinjuries to adults (aged 15 years) were a sport or active recreation injury. For children, cyclingwas the activity resulting in the greatest number of injuries presenting to emergencydepartments, accounting for 26.2% of all sport/leisure injury presentations. This was followedby Australian football (11.3%), rollerskating/rollerblading (6.5%), basketball (6.3%), soccer(6.0%) and trampolining (6.0%). For adults, the top-ranking activities were Australian football(21.6%), cycling (10.0%), soccer (8.1%), rugby (union, league and unspecified) (7.8%) andcricket (7.3%). This study was one of the first to provide descriptive information about the
≥

05
Ba
ckg
ro
un
d t
o t
his
re
po
rt range of injuries sustained across a variety of sports and active recreation activities Australia-
wide. It was limited in that not all of the emergency departments around Australia contributeddata and the injury rates were not adjusted for participation.
Other studies have investigated the role of socioeconomic status (SES) and geographicaldifferences in the occurrence of sport/leisure injury in NSW, showing some differencesbetween urban and rural residents with respect to the occurrence, nature and location ofsport/leisure injuries treated at hospital settings [44, 45]. There have also been several studiesconducted in Australia that have used routinely collected injury data (such as hospitaladmissions and emergency department presentations) to investigate injuries in particular sports,specific injury diagnoses or admissions to specific institutions. These have included studies ofpatients admitted to a hospital for renal trauma sustained in Australian football [46]; patientsadmitted to a hospital for mandibular fractures [47]; patients admitted Australia-wide withacute spinal cord injuries sustained in all Australian codes of football [48]; fatalities, hospitaladmissions and emergency department presentations for boating-related sport and recreationalinjury [49]; sport/leisure injury presentations to one general practice [50]; and presentations tosports medicine clinics [31, 51, 52].
The preceding section has shown that across NSW, as well as Australia, there is generally alack of good-quality, consistent information on exposure-adjusted sport/leisure injury rates. Inorder to assess the impact of safety initiatives and other developments that could influenceinjury rates, such data is needed over time. None of the published studies has conducted atime series analysis of sport/leisure injury rates. This is an area requiring further attention.

06
Ab
ou
t this
re
po
rt
Planning for sports safety policy and injury prevention initiatives (both statewide and at themore local level) needs to be informed by high-quality, relevant data. Like most otherjurisdictions across Australia, NSW does not currently have a systematic reporting ofsport/leisure injury trends across the broad community level. This means that there are nooverarching estimates of sport/leisure injury rates across the state or any reliable indications oftrends in injury incidence or identification of sport/leisure injury priority attention areas, from apopulation perspective. Furthermore, there is no baseline against which to measure theeffectiveness of any implemented safety strategies. Policy decisions need to be based oncompelling arguments about the public health burden of health conditions (generally in termsof mortality and hospitalisations) and the lack of this information for NSW has meant thatsport/leisure injuries have not received the level of attention they perhaps deserve.
At present, in NSW, as in other Australian states and territories, only deaths andhospitalisations relating to sport/leisure can be routinely identified and monitored over time toprovide population estimates of the incidence of sport/leisure injuries. However, thisinformation has not been previously reported on in NSW in detail. The purpose of this report isto provide information on the distribution and characteristics of deaths and hospitalisations,after adjusting for participation levels, in sport/leisure in NSW. In doing so, it provides anevidence-base for priority setting and the targeting of sport/leisure injury prevention activities inNSW.
The objective of this report is therefore to present a baseline epidemiological profile ofhospitalisations and deaths related to participation in sport/leisure activities in NSW. Thespecific aims are to:
> estimate the rate of sport/leisure injury incidence in NSW, both per 100,000 head ofpopulation and per 100,000 participants
> compare sport/leisure injury rates in particular subgroups of interest, such as males versusfemales and different age groups
> provide a baseline against which future trends in both incidence rates and characteristics ofinjured cases can be monitored.
Because of the small number of data points at this stage, formal trend analyses are notpresented in this report, but are expected to feature in future reports. Subject to adequate data,subsequent reports will also include analyses stratified by geographical regions, indigenousstatus and socioeconomic status to identify both spatial and temporal patterns in sport/leisureinjury incidence.
Future reports will also include presentation of data from additional sources of data, includingthe NCIS and emergency department data. Future reports will also estimate the overall rate ofdeath and hospitalisation related to participation in sport/leisure activities in NSW on a percalendar year basis. This was not possible in this report, as death and hospitalisation data werenot available for matching periods.

02
Ab
ou
t th
e d
ata
so
urc
es u
se
d In this report, injuries are defined as those associated with death or admission to hospital. While it isrecognised that such injuries may only represent less than 30% of all relevant injuries [39], these arethe most serious of all sport/leisure injuries and should therefore be the target of injury preventionstrategies, at least in the first instance.
Injury hospitalisations and deaths data were extracted from routinely collected datasets via the NSWDepartment of Health's Health Outcomes Information Statistical Toolkit (HOIST). Mortality data wereobtained for the three-year period 2000-2002 and information pertaining to hospitalisations wasretrieved for the two-year period 2003-2004. The major data sources used in this report, as well asthe procedures used, are described below.
The Australian Bureau of Statistics Death Unit Record File
The Australian Bureau of Statistics Death Unit Record File database contains information on alldeaths in NSW supplied by the State Registrar of Births, Deaths and Marriages. This information usesthe causes of death as recorded by medical practitioners and coroners. Other information about thedeceased is supplied by a relative or another person acquainted with the deceased, or by the officialinstitution where the death occurred [53].
Each death registered in NSW is classified by the ABS according to the World Health Organisation(WHO) International Classification of Diseases (ICD) coding system [54]. In all versions of ICD, theinjury and poisoning diagnosis codes are found in Chapter IX and mechanisms of injury (externalcauses) are coded using Chapter XX of the Classification (note: the deaths data is only coded to theoriginal WHO version of ICD-10, not any of the ICD-10-AM versions). The use of ICD-10 came twoyears after Australia introduced automated mortality coding for deaths registered from 1 January1997, using the Mortality Medical Data System (MMDS). The use of the MMDS for mortality dataprocessing allowed the identification of multiple causes of death, thereby improving the consistencyof coding and enhancing international comparability in mortality statistics [39].
Cases selected for this report included all deaths of NSW residents, of any age, with an ICD-10activity code indicating sport (activity code = 0) or leisure activity (activity code = 1), during thethree calendar year period January 2000 to December 2002. These were the most recent dataavailable at the time of conducting the analysis for this report.
The NSW Inpatient Statistics Collection
The NSW Inpatient Statistics Collection (ISC) includes details of all hospitalisations in NSW. Itrecords all inpatient separations (discharges, transfers and deaths) from all public, private andrepatriation hospitals, private day procedures centres and public nursing homes in NSW. Hospitalsare required to submit details for every inpatient and for every episode of care. An episode of careeither ends by the patient ending a period of stay in hospital (by discharge, transfer or death) or bythe patient becoming a different type of patient within the same period of stay in hospital (e.g. thepatient is admitted for an acute injury then later becomes a rehabilitation patient) [55].
The ICD-10-AM third edition was used to select the appropriate cases for these analyses. Casesselected for this report included all hospital separations in NSW, of NSW residents of any age, withan ICD-10-AM principal diagnosis indicating an injury (S00-T35, T66-T71, T73, T75, T99-T95 andT98) and an 'Activity at the time of injury' code referring to sport/leisure activity (U50-U72) [56]during the two calendar year period of 2003-2004. A detailed list of all ICD-10-AM, third editionactivity codes included is provided in Appendix 2. These codes were included on the assumptionthat the majority of cases selected would be related to participation in a sport or leisure activity. Forexample, cycling was included, as it was assumed the majority of cases would be related toparticipation in cycling as a sport or leisure activity, rather than transportation to work. Sport/leisureactivities have been classified in this report according to the ICD-10-AM groupings.
The ICD-10-AM allows for the coding of place of occurrence of injury, which includes, among othercategories, sports/athletics areas. However, as with the deaths data, we chose not to select our casesbased on this criterion because some cases injured in a sport ground might not necessarily havebeen actually participating in a sport at the time; they may have been spectators, coaches, refereesor passers-by, for example. Also, it is not necessarily true that all sport/leisure injuries will occur onlyin sports/athletics areas, and may also occur in schools, natural settings etc. It is not possible, withthe current data, to estimate the extent to which this occurs. The relationship between the activitycodes indicating sport/leisure activities and place of occurrence codes indicating sports and athleticsareas is shown in Table 2. This shows that, overall, 45% of cases indicated as sport/leisure based onthe activity code also had a sports/athletics area place of injury code. Given the higher specificity ofthe activity code for indicating sport/leisure activity associated with injury, we selected cases basedon this variable.
07
03
Ab
ou
t the
da
ta s
ou
rc
es u
se
d
08
Due to the nature of the hospital data, the number of hospital separations for sport/leisure injuries isnot equivalent to the number of incident cases. Patients who had been readmitted or transferred fromone hospital to another, and in some instances even within the same hospital, for treatment of thesame injury may be recorded more than once. In the absence of a direct means to identify incidentcases in the dataset, we have used the 'mode of separation' variable to exclude transfers andstatistical discharges or transfers within the same hospital in order to minimise multiple counting ofcases.
Due to the significant changes to the ICD-10-AM codes related to sport/leisure activities since 1998,this report focuses on hospitalisations for the calendar years 2003 and 2004. Compared to previousversions of ICD-10-AM, the version used to code these two years of data contain a more detaileddescription of various sports, with over 200 different categories provided by the ICD-10-AM 'activitywhile injured'. Unlike the ICD-10, which is used to code deaths records, and the earlier versions ofICD-10-AM, there is no simple delineation between sport and leisure and this makes it impossible toidentify injuries solely related to participation in organised sports. For example, if someone wasinjured while participating in football, it is not known if this was as a team member in a competitivegame or as part of a kick-to-kick session in the backyard.
Calculation of incidence rates
The frequency and rates of sport/leisure injuries were calculated in each year and in subgroups ofinterest, such as age and gender as well as sport and activity type. The denominators used were themid-year NSW population estimate (in the relevant subgroup) obtained from the ABS. Year-specifichospitalised rates were age standardised to the 2001 Australian population to adjust for anydifferences that may have arisen from a change in the age structure of the population [55].
Information on the population at risk (i.e. the number of participants in sport/leisure) was derivedfrom the 2003 and 2004 Exercise, Recreation and Sport Surveys (ERASS) [1, 57]. The ERASS usedtelephone surveys to collect information on the participation of people aged >15 years in physicalactivity for exercise, leisure and sport during the 12 months prior to the interview (Appendix 3). Forthis reason, participation-adjusted rates provided in this report are only for those aged >15 years. Inthe ERASS survey, participation means active 'playing' participation and does not include coaching,refereeing and spectating or activities related to work/household chores. Participation figures includeboth organised and non-organised sport and practice and training sessions for these activities. Thesurveys used a random sample stratified by state and territory and the sample was selected from theElectronic White Pages; one person was randomly selected per dwelling to complete the interview.
While the selection of all sport/leisure activities in both death and hospital data generally fit that ofthe ERASS participation data, caution is needed when examining participation rates for someindividual sports/activities. This particularly applies to the category of 'other football' (rugbyunspecified, touch football and other specified football, such as American tackle, Gaelic, Gridiron)and 'football unspecified' in the hospital data, which do not have corresponding categories in theparticipation data. Those categories that refer to participation in 'other' or 'unspecified' sports andactivities as defined by ICD-10-AM were included in this report. While such categories do notprovide detailed information about the activity being undertaken at the time of injury, they need tobe included in the assessment of the overall burden.
Ninety-five percent confidence intervals (95% CI) were calculated for various rates. Cells with totalcase numbers less than five have not been shown in the tables in order to maintain confidentiality.All analyses were carried out using SAS, version 8.02 [58].
Table 2 Relationship between sport/leisure activity and sports/athletic area place of occurrence codes

09
De
ath
s i
n N
SW
re
sid
en
ts,
20
00
-20
02 During the three-year period 2000-2002, there were 132 deaths of NSW residents related to
leisure activities and 35 deaths occurring while engaged in sport. As shown in Table 3, the vastmajority of deaths were in males (76.7%), with the male to female ratio being 3.3:1. Thehighest number and rate (per 100,000 population) of deaths while involved in sport was inthose aged 15-24 years. Those aged >35 years had the highest rate of deaths related to leisureactivities, as illustrated in Table 3.
Table 3 Number and rate, per 100,000 population, of deaths related to sport/leisure activities by gender and activity type, NSW, 2000-2002
Figure 1 Age-standardised rates, per 100,000 population, of deaths related to sport/leisure activities by gender and year, NSW, 2000-2002
Table 4 Number and rate, per 100,000 population, of deaths related to sport/leisure activities by age group and activity type, NSW, 2000-2002
Gender Leisure Sport All
n Rate 95% CI n Rate 95% CI n Rate 95% CI
Male # 0.98 0.79, 1.18 # 0.33 0.21, 0.44 128 1.31 1.08, 1.54
Female # 0.36 0.24, 0.48 # 0.03 0.001, 0.06 39 0.39 0.27, 0.52
Total 132 0.67 0.56, 0.78 35 0.18 0.12, 0.24 167 0.85 0.72, 0.98
#Fewer than five sport-related deaths in females
As shown in Figure 1, death rates related to sport/leisure activities in males increased from0.68 (95% CI, 0.40-0.97) per 100,000 in 2000 to 2.02 (95% CI, 1.53-2.51) in 2001, then fellto 1.21 (0.84-1.59) per 100,000 in 2002. A similar pattern was observed in females wheredeath rates per 100,000 population increased from 0.12 (95% CI, 0.01-0.20) in 2000 to 0.60(0.34-0.87) in 2001 and then fell to 0.44 (0.27-0.82) in 2002.
0
0.5
1
1.5
2
2.5
2000 2001 2002
Rat
e MalesFemalesPersons
Leisure Sport All
Age group (years)
n Rate 95% CI n Rate 95% CI n Rate 95% CI
0–14 22 0.55 0.32, 0.78 7 0.17 0.05, 0.30 29 0.72 0.57, 1.73
15–24 14 0.53 0.25, 0.81 10 0.38 0.14, 0.61 24 0.91 1.14, 2.12
25–34 20 0.69 0.38, 0.99 9 0.31 0.11, 0.51 29 0.99 1.39, 2.38
>35 76 0.75 0.58, 0.92 9 0.09 0.03, 0.15 85 0.84 1.17, 2.08
Total 132 0.67 0.56, 0.78 35 0.18 0.12, 0.24 167 0.85 0.72, 0.98

10
De
ath
s in
NS
W r
esid
en
ts, 2
00
0-2
00
2
The four most common causes/mechanisms of deaths related to sport/leisure includeddrowning, falls, transport accidents, and struck by and struck against incidents. Collectively,these accounted for 88% of all leisure deaths and 100% of all sport deaths. Drowning was theleading cause for both leisure (44.7 %) and sport deaths (57.1%), as presented in Table 5. Thedata in this data were coded using the ICD-10 external cause of injury codes.
A limitation of the deaths data is that a detailed breakdown by sport/leisure activity is notpossible. Nonetheless, the above analyses highlight drowning, transport incidents, falls andhead injuries as priorities for prevention.
The effects of drowning were the most common nature of injury deaths for both sport andleisure activities followed by head injuries, as shown in Table 6. The data in this table werecoded using the ICD-10 diagnosis codes.
Table 5 The four most common mechanisms of death related to sport/leisure activities by activity type, NSW, 2000-2002
Table 6 Nature of deaths related to sport/leisure activities by activity type, NSW, 2000-2002
Leisure Sport All Mechanism of death
n % n % n %
Drowning 59 44.7 20 57.1 79 47.3
Transport* incident 32 24.2 10 28.6 42 25.1
Fall 20 15.2 5 14.3 25 20.0
Struck by/against 5 3.8 0 0.0 5 3.0
Total 116 87.9 35 100 151 95.4
*Transport includes activities such as cycling, walking and motorised activities
Nature of death Leisure Sport All
n % n % n %
Effects of drowning 60 45.5 19 54.2 79 47.4
Head injuries 35 26.5 8 22.9 43 25.7
Others* 37 28.0 8 22.9 45 26.9
Total 132 100.0 35 100 167 100.0
*Includes multiple injuries and fractures of the neck

11
Ho
sp
ita
lisa
tio
ns i
n N
SW
re
sid
en
ts,
20
03
-20
04 HOSPITALISATIONS IN NSW RESIDENTS, 2003-2004
There were 25,346 hospital separations of NSW residents due to sport/leisure for the years 2003and 2004. This represents an age-standardised rate of 190.3 per 100,000 population per year.Men had a three-fold higher rate of hospitalisation for sport/leisure injuries (290.6 per 100,000population) than females (91.1 per 100,000 population).
The greatest number and rate of hospitalised injuries due to sport/leisure were among thoseaged 10-14 years, followed by those aged 15-19 years, as shown in Table 7.
The age-standardised rate per 100,000 population decreased slightly in females from 92.3 (95%CI, 85.9-98.1) in 2003 to 89.9 (95% CI, 84.7-94.9) in 2004 but increased in males from 286.5(95% CI, 281.2-292.2) in 2003 to 294.8 (95% CI, 289.1-300.9) in 2004.
Rates were also calculated, using the number of persons participating as the denominator, as noteveryone in the population participates in sport/leisure. These rates are presented in Table 8. Asparticipation data are only available for those aged >15 years, the data in Table 8 are restrictedto these age groups. The rates of hospitalisation for sport/leisure injuries per 100,000participants were 316.3 per 100,000 participants in males and 83.5 per 100,000 participants infemales. For both males and females, those aged 15-24 years old had the highest hospitalisationrate due to sport/leisure injury per 100,000 participants. These rates generally decreased withage (Table 8).
Table 7 Number and rate, per 100,000 population, of sport/leisure injury hospitalisations, NSW, 2003-2004
Table 8 Number and rate, per 100,000 participants and 100,000 population, of sport/leisure injury hospitalisations, NSW, 2003-2004
12
Ho
sp
italis
atio
ns in
NS
W r
esid
en
ts, 2
00
3-2
00
4
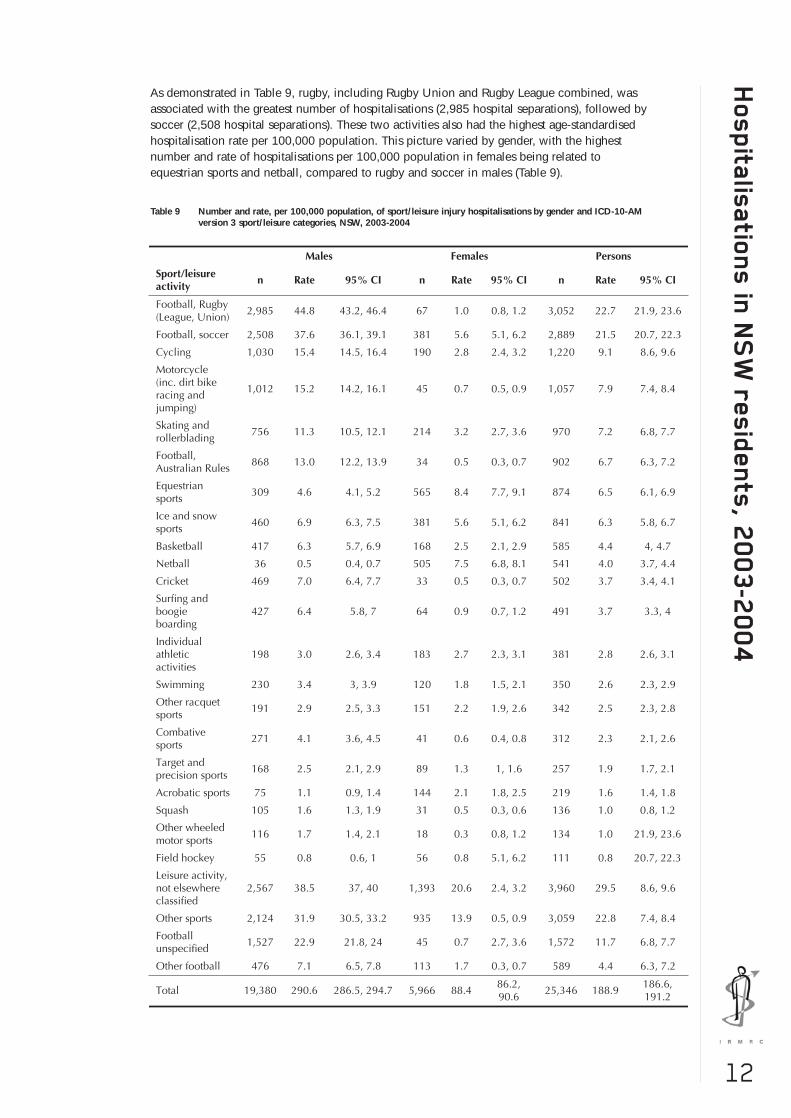
As demonstrated in Table 9, rugby, including Rugby Union and Rugby League combined, wasassociated with the greatest number of hospitalisations (2,985 hospital separations), followed bysoccer (2,508 hospital separations). These two activities also had the highest age-standardisedhospitalisation rate per 100,000 population. This picture varied by gender, with the highestnumber and rate of hospitalisations per 100,000 population in females being related toequestrian sports and netball, compared to rugby and soccer in males (Table 9).
Table 9 Number and rate, per 100,000 population, of sport/leisure injury hospitalisations by gender and ICD-10-AMversion 3 sport/leisure categories, NSW, 2003-2004

13
Ho
sp
ita
lisa
tio
ns i
n N
SW
re
sid
en
ts,
20
03
-20
04 The total number of hospital separations due to sport/leisure activities increased slightly, but not
significantly, from 12,557 in 2003 to 12,789 in 2004. Similarly, the hospitalisation rate, per100,000 people, also increased from 187.8 to 190.0. This, however, varied according to thesport/leisure type (Table 10).
When examining participation-adjusted rates, motor sports had the highest hospitalisation rateper 100,000 participants aged >15 years, followed by Rugby Football (League and Union),skating and rollerblading (Table 10).
Table 10 Number and rate, per 100,000 population, of sport/leisure injury hospitalisations by year and ICD sport/leisure categories, NSW, 2003-2004

14
Ho
sp
italis
atio
ns in
NS
W r
esid
en
ts, 2
00
3-2
00
4
Table 11 Number and rate, per 100,000 participants aged >15 years, of sport/leisure injury hospitalisations by year and ICD sport/leisure categories, NSW, 2003-2004
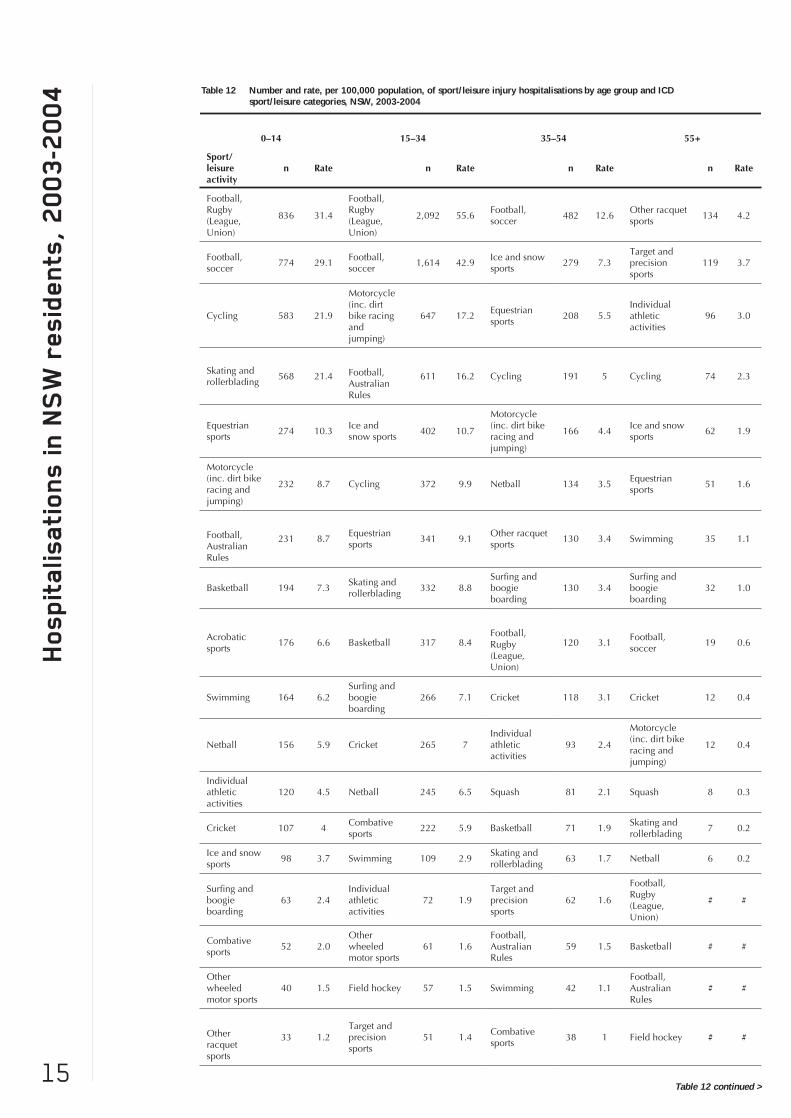
As shown in Table 12, the football codes ranked highly in terms of the rate of injury per100,000 population for younger people. For 15-24 year olds, the top three ranking activitieswere Rugby Football (League and Union), soccer and cycling. For those aged 15-34 years, thetop-ranking sports were Rugby Football (League and Union), soccer and motorcycle riding. Incontrast, the picture was quite different for older people. For those aged 35-54 years, the top-ranking activities were soccer, ice and snow sports and equestrian sports. For those aged >55years, racquet sports, target and precision sports and individual athletic activities wereassociated with the highest rates of injury.
15
Ho
sp
ita
lisa
tio
ns i
n N
SW
re
sid
en
ts,
20
03
-20
04 Table 12 Number and rate, per 100,000 population, of sport/leisure injury hospitalisations by age group and ICD
sport/leisure categories, NSW, 2003-2004
Table 12 continued >

16
Ho
sp
italis
atio
ns in
NS
W r
esid
en
ts, 2
00
3-2
00
4
There was no significant difference in the reported mechanisms of injury in 2003 and 2004.Overall, falls were the most common mechanism of injury and accounted for 41.0% of hospitalseparations due to sport/leisure activities (Figure 2). The second most common mechanism wasrepresented by transport accidents (17.0%) followed by struck by or struck against cases(15.0%). Apart from drowning, this is similar to the pattern for deaths.
Figure 2 Mechanisms of sport/leisure injuries resulting in hospitalisations, NSW, 2003-2004
When looking at more specific ICD-10 external cause sub-categories, falls on same level due tocollision with, or pushing by, another person, were the most common single known mechanism ofinjury (14.4%) followed by overexertion and strenuous or repetitive movements (7.6%) (Table 13).

17
Ho
sp
ita
lisa
tio
ns i
n N
SW
re
sid
en
ts,
20
03
-20
04
There was little change in the distribution of nature of injury in 2003 and 2004. Overall, morethan half of the hospital separations resulting from sport/leisure activities (55.4%) werefractures, reflecting the serious nature of these injuries. Sprains and strains were the secondmost common condition/nature of injury followed by dislocations (Figure 3).
Table 13 Most common external causes (mechanisms) of sport/leisure injuries resulting in hospitalisations, NSW, 2003-2004

18
Ho
sp
italis
atio
ns in
NS
W r
esid
en
ts, 2
00
3-2
00
4
Figure 3 Nature of injury (according to principal diagnosis) of hospital separations resulting from sport/leisure injury, NSW, 2003-2004
Figure 4 Body region (according to principal diagnosis) of sport/leisure injuries resulting in hospitalisation, NSW, 2003-2004
Overall, the most common body region sustaining injury as a result of sport/leisure activities resultingin hospitalisation was the upper limb (40.9%) followed by the lower limb (30.2%) and the head(17.3%) (Figure 4). There was no difference across the two years.
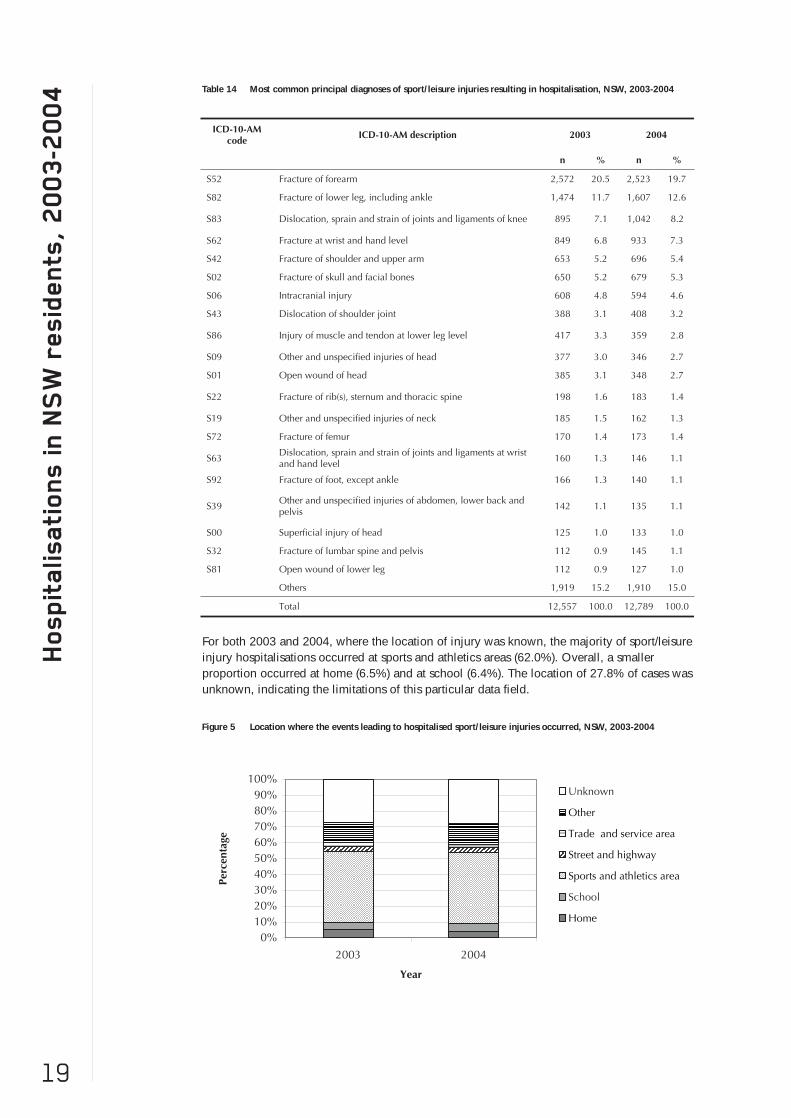
When examining specific ICD-10 codes, the most common principal injury diagnosisassociated with sport/leisure activities overall was a fracture of the forearm (20.1%) followed byfracture of the lower leg (12.2%) and dislocation, sprain and strain of joints and ligaments ofthe knee (7.6%). Head injuries, including intracranial injuries and fracture of skull and facialbones, accounted for 10% of cases (Table 14). There were no major differences across years.
19
Ho
sp
ita
lisa
tio
ns i
n N
SW
re
sid
en
ts,
20
03
-20
04 Table 14 Most common principal diagnoses of sport/leisure injuries resulting in hospitalisation, NSW, 2003-2004
Figure 5 Location where the events leading to hospitalised sport/leisure injuries occurred, NSW, 2003-2004
For both 2003 and 2004, where the location of injury was known, the majority of sport/leisureinjury hospitalisations occurred at sports and athletics areas (62.0%). Overall, a smallerproportion occurred at home (6.5%) and at school (6.4%). The location of 27.8% of cases wasunknown, indicating the limitations of this particular data field.

20
Ho
sp
italis
atio
ns in
NS
W r
esid
en
ts, 2
00
3-2
00
4
The median length of hospital stay for all hospital separations related to sport/leisure activities wasone day. However, there was a wide range across the sports, with some injuries requiring lengthystays in hospital, as shown in Table 15. Please note that median length of stay is not necessarily agood proxy for injury severity. This is because there may be multiple episodes of care or in the caseof in-hospital deaths, that the death occurs after a short period of time in hospital. However thelimitations of the data prevent a more detailed assessment of injury severity.
There were 34 in-hospital deaths resulting from a sport/leisure injury during the two years (19 in2003, and 15 in 2004). Most (76%) were males and the highest number occurred in those aged 15-34 years (14 cases). Swimming was the activity with the highest number of in-hospital deaths (6cases), followed by motorcycle riding (5 cases).
Table 15 The length of stay, in days, of sport/leisure injury hospitalisations by selected sport/leisure types, NSW, 2003-2004

21
Sp
orts
/le
isu
re
in
jury p
re
ve
nti
on
prio
rit
ies f
or N
SW SPORT/LEISURE INJURY PREVENTION PRIORITIES FOR NSW
To date, there have been few reports of the occurrence of sport/leisure injury at the broadpopulation level in NSW. This has meant that there has been little information available toenable the identification of sport/leisure injury priority areas from a population perspective.These data are essential for the development of appropriate injury prevention strategies andpolicies in this state and this report is an attempt to provide this information.
This report is one of the few to describe deaths and hospitalisations due to sport/leisure activityin NSW. Previous research has investigated emergency department presentations [36] andhospitalisations [37] on a national scale, but this report is the first to consider bothhospitalisations and deaths related to sport/leisure activities solely in the state of NSW. While itwas not possible to estimate the overall rate of death and hospitalisation in this report due tolimitations in the available data, future reports using death and hospitalisation data from thesame time periods will allow this estimate to be determined.
Injury rates
In NSW residents, during the three-year period 2000-2002, there were a total of 167 deathsrelated to participation in a sport/leisure activity (35 deaths related to sport and 132 deathsrelated to leisure activities). For sport, this corresponded to a death rate of 0.18 deaths per100,000 population, and for leisure activities it corresponded to 0.67 deaths per 100,000population.
Over the two-year period 2003-2004, there were a total of 25,346 hospital separations relatedto participation in a sport or leisure activity. This corresponded to a rate of 190.3 hospitalisedinjuries per 100,000 population. This was slightly lower than the national rate ofhospitalisation for a sport/leisure-related injury reported by Flood and Harrison [37], whichwas 231.4 per 100,000 population over the period 2002-2003. This may be partially explainedby the fact that we have reported by calendar year and Flood and Harrison reported byfinancial year. It also related to the selection of cases in our study, which was restricted tospecific ICD-10-AM codes indicating injury resulting from sports and recreational activities(methods section).
Gender
As was the case in the study conducted in Victoria [38], the rate of death in this report wassignificantly higher in males than in females. This male excess was also apparent in thehospitalisation data. Males accounted for the greatest proportion of all hospitalisations, as wasthe case in the national study [37] and the study conducted in the Latrobe Valley [39].Accordingly, the rate of hospitalised injury was more than three times greater for males than forfemales in NSW. Males also had a substantially greater hospitalised injury rate per 100,000participants than females.
The reason for this is not fully clear but may reflect a difference in the types of activitieschosen by males and females. Males may participate in activities with a higher risk of injury,including contact sports (such as Rugby League, Rugby Union, Australian football and soccer)or motorised activities (such as motorcycle racing and jumping). Males may also participate inthose higher-risk activities on a more frequent basis, therefore increasing their time at risk.While the ERASS is able to provide information about the distribution of male and femaleparticipants across a range of sport/leisure activities [1], it is not able to provide informationabout the actual amount of exposure (time at risk). An area for future investigation couldinclude the actual amount of time that males and females participate in sport/leisure activitiesand its impact on injury risk. Nevertheless, the results of this report demonstrate theimportance of developing injury prevention strategies that are targeted to male participants.
Young people
When examining the death rates according to age, the highest rate of death in sport was forthose aged 15-24 years, with a rate of 0.38 deaths per 100,000 population. As with the genderdifferences, the age finding may reflect the types of activities that people of different agesparticipate in and/or differences in participation levels across age groups. When coupled withthe hospitalisation data, which showed a preponderance of cases aged 10-14 and 15-19 years,this indicates that priority attention should be given to people aged under 25 years.
Previous population-based studies investigating sport/leisure injuries have reported that theyoung constitute the majority of cases [37-39]. This was also the case in NSW, with childrenaged 10-14 years having the highest rate of hospitalised injury. Unfortunately, it was not

22
Sp
orts
/le
isu
re
inju
ry p
re
ve
ntio
n p
rio
ritie
s fo
r N
SW
possible to determine a participation-adjusted rate of hospitalisation for this age group, or forchildren younger than this, because the ERASS data only relate to those aged >15 years.Among those groups for which the participation data were available, the age category with thehighest rate of injury was the 15-24 year age group. This was consistent with the findings ofthe study by Flood and Harrison [37]. In their report of sport/leisure injuries, Medibank Privateidentified those aged 18-24 years as the group with the highest frequency of injury [43]. Aswith the national study of hospitalised injuries for sport/leisure, the participation- adjustedinjury rate generally decreased with age. Therefore, as the greatest burden of hospitalisedsport/leisure lies with those aged <25 years, it is vital that injury prevention strategies aredeveloped specifically for the young.
Type of sport/leisure activity
There were 167 deaths attributable to injury in sport/leisure activities. This highlights theburden of sport/leisure injuries in NSW and the need for the continued development of injuryprevention strategies targeted to participation in sport/leisure. For both leisure and sportsactivities, the most common nature of injury-related deaths was the effects of drowning. Thisreiterates the importance of the continued development and broad distribution of water safetyinitiatives in NSW.
Consistent with the findings of previous reports [37], the activities accounting for the greatestnumber of sport-related hospitalisations were the football codes of Rugby League, RugbyUnion, Australian football and soccer. The four main football codes, as well as the two lessspecific football categories, together accounted for nearly one-third of all sport/leisurehospitalisations. Rugby League and Rugby Union were the activities accounting for the greatestnumber of cases, as well as the highest rate of injury for males, with 44.8 hospitalised injuriesper 100,000 population. Among the football codes, the highest rate of injury for females was insoccer, with 5.6 hospitalised injuries per 100,000 population. While the majority of thefootball-related injuries were coded according to the type of football being played at the timeof injury, there were also a substantial number of injuries within the activities of 'other football'and 'football unspecified'. Improvement in the specificity of reporting of football codes,particularly the rugby codes in a state like NSW, would enhance the ability of ICD-coded datato identify particular priority groups.
Apart from football, the other activities accounting for the greatest number of sport/leisurehospitalisations for males were cycling, motorcycling (including dirt bike racing and jumping),and skating and rollerblading. The injury profile for females was considerably different, withthe most common activities leading to hospitalisation being equestrian sports, netball and iceand snow sports.
In addition to investigating the frequency of injury cases, it is also important to consider theparticipation-adjusted rate of injury. While the frequency of injury identifies the activitiesassociated with the greatest proportion of reported injuries, these numbers may reflect thepopularity of the sport/leisure activity rather than an inherently greater risk of injury. Byadjusting for the numbers of participants, it is possible to determine the relative risk of injuryacross different sport/leisure activities. The 10 highest-ranking sport/leisure activities accordingto frequency of injury in NSW during 2003 and 2004 were Rugby Football (League andUnion), soccer, cycling, motorcycling, skating and rollerblading, Australian football, equestriansports, ice and snow sports, basketball and netball. These activities were similar to thoseidentified elsewhere in Australia [39] as requiring further attention. However, after adjusting forthe numbers of participants in each activity (for those aged over 15 years), the 10 top-rankingsports according to the rate of injury were motor sports, Rugby Football (League and Union),Australian football, skating and rollerblading, equestrian sports, ice and snow sports, soccer,netball, basketball and surfing and boogie boarding. Acrobatic sports also had a high rate ofinjury in 2004, but the number of participants in 2003 was not available and therefore a rate ofinjury could not be calculated.
Many of the sports accounting for the greatest number of cases also ranked highly afteradjusting for the number of participants. These sport/leisure activities should be the focus ofinjury prevention efforts. Particular focus should be on the football codes, particularly RugbyUnion and Rugby League, as well as the motor sports, and skating and rollerblading. Incomparing these findings with previous research, Gabbe and colleagues also identified motorsports as a priority area for further research [38], and Rugby League was identified byMummery et al [40].
There was little change in the hospitalised injury rates between 2003 and 2004, andmotorcycling was the only sports/leisure activity for which the rate of injury increased per
23
Sp
orts
/le
isu
re
in
jury p
re
ve
nti
on
prio
rit
ies f
or N
SW
100,000 population (the 95% confidence intervals around the rates in 2003 and 2004 did notoverlap). When considering the injury rates per 100,000 participants, six of the top 10 sportshad a significant change in injury rate between 2003 and 2004. The rate of injury decreasedfor motor sports, Rugby Football (League and Union), equestrian sports, ice and snow sports,and surfing and boogie boarding; in contrast, the rate of injury increased for Australianfootball. Future annual updates of this report will be able to determine if these are consistenttrends.
Injury mechanisms
The leading mechanism of death for sport/leisure activities in NSW was drowning, accountingfor 47.3% of all sport/leisure deaths. This is in accordance with the results reported for thestudy conducted in Victoria, where 69% of all sport/leisure deaths were attributable todrowning [38]. This demonstrates the need for the continued development of water safetystrategies in NSW. The second highest mechanism of death for both sport and leisure activitiesin NSW was a transport incident. This category includes deaths occurring to peopleparticipating in cycling, walking and motorised activities. It must be noted that while theassumption was made that the majority of these cases related to participation in an activityassociated with sport or leisure, some people may have been travelling to and from work. Assuch, it is possible that the rate of death attributable to participation in sport/leisure activitieshas been overestimated in this report. It is difficult to compare these results with the Victorianstudy, as Gabbe and colleagues [38] excluded deaths that occurred on a road, street orhighway involving motorcycle and pedal cyclists, due to the concern that the deaths were notrelated to participation in sport or leisure, but rather transport activities.
Flood and Harrison reported that falls were the most common mechanism of hospitalisedsport/leisure injuries in a national study, accounting for 36% of all cases [37]. This was also thecase in our study in NSW. Falls were followed by transport incidents and struck by or struckagainst cases. With respect to the more specific mechanisms of injury identified by the ICD-10-AM codes, the leading cause of injury was a fall on the same level due to collision with, orpushing by, another person, followed by overexertion and strenuous or repetitive movements.
For those cases where the location of the injury event leading to hospitalisation was known,62.0% occurred at sports/athletics areas. Unfortunately, for almost one-third of all cases, thelocation of injury was unknown. This lack of detail hinders the ability to identify priority areasfor injury prevention strategies and reiterates the need for the recording of more detailedclinical information and the improved coding of hospitalisations data.
Injury type
For more than half of the hospitalised injury cases, the nature of injury was a fracture and thisranking is consistent with previous reports from cases treated in hospital settings [37-39]. InNSW, the most commonly injured body regions were the upper limb, lower limb and head.This is similar to other studies of sport/leisure injuries requiring hospital admission. Thepreponderance of upper limb injuries in hospitalised case series studies, like this one, iscontrary to field-based studies of sport/leisure injuries. While lower limb injuries may be morecommon overall, they are generally less severe than upper limb injuries and hence do notrequire hospitalisation [36]. Given the substantial number of hospitalised upper limb injuries, afocus of future studies should be on identifying risk factors and preventive strategies for theseinjuries.
At the ICD-10-AM third character level the single most common hospitalised injury reported inNSW was a fracture of the forearm. However, without knowing which particular activity theinjured person was participating in at the time (eg. In rugby union the injured person may havebeen injured as a result of being tackled, or because they slipped over whilst running), it is notpossible to suggest sports-specific injury prevention strategies. Fractures of the lower leg werealso common. There were also a substantial number of injuries to the knee, with dislocation,sprain and strain of joints and ligaments of the knee representing 7.6% of all cases.
Injury severity
Overall, hospitalised sport/leisure injuries in NSW tended not to be severe, with a medianlength of stay in hospital of one day for all sports and activities in 2003 and 2004. There werea number of cases with much longer lengths of stay and, when examining the 90th percentileof length of stay across all activities, injuries tended to be more severe for target and precisionsports, other wheeled motor sports, equestrian sports, motorcycle activities (including dirt bike

24
Sp
orts
/le
isu
re
inju
ry p
re
ve
ntio
n p
rio
ritie
s fo
r N
SW
racing and jumping), individual athletic activities and cycling.
This is an interesting comparison with the list of activities associated with the highest numbersand rates of injury. While target and precision sports, and individual athletic activities did notpresent a large burden with respect to the number of cases or rates of injury, they deserveattention, as the injuries that do occur in these activities are the most severe. Motorcycle sportsrelated injuries ranked highly both in terms of frequency and severity. However, as notedearlier in the report, length of stay is not always a good proxy for the severity of injury;however the limitations of the data prevent a more detailed assessment of injury severity.
Injury prevention efforts should be directed to activities with substantial direct and indirectcosts. Although, the football codes accounted for the greatest number of cases, the medianlength of stay for injuries associated with these codes was quite low, with a median of one dayand a 90th percentile of three days across all football codes.

25
Da
ta i
mp
ro
ve
me
nt
prio
rit
ies DATA IMPROVEMENT PRIORITIES
This report provides information about the profile of hospitalisations and deaths due tosport/leisure injuries in the state of NSW. Injuries were identified from a number of the existingdata sources able to be accessed by the NSW Injury Risk Management Research Centre. Oneof the primary advantages of using this approach is its use of routine data sources. Sport/leisureinjury surveillance data collection activities, if conducted properly and with a guaranteed highcase capture rate, are a very costly exercise. This report did not require the collection of newdata, but has instead used existing routine data sources that, to date, have not been used totheir full potential for analysis of sport/leisure injury in NSW. This provided a cost-effectivemeans of extracting relevant data. Another advantage was that the data were all routinelycollected in NSW, under very strict standardised data collection procedures and protocols forsubsequent data coding and management.
Unfortunately, there were several limitations in the data used for this report. While themortality database used constitutes a generally consistent series based on widely acceptedclassifications [59], it has some limitations in terms of injury-related information. The reliabilityof the ABS death data is uncertain, with insufficient validation studies to assess the quality ofthe information. This is particularly the case for external causes of injury codes and the activitycodes used to select cases in this report. In addition, unlike hospital data, the Australianclinical modifications of the ICD have not, to date, been applied to mortality data, limiting theusefulness of mechanism of injury codes [59]. Therefore, due to these coding differences, itwas not possible to compare the deaths data with the hospitalisations data. Furthermore, it wasnot possible to identify specific sport/leisure activities associated with the deaths.
With respect to the hospitalised injuries, the quality of the ICD-10-AM sports/leisure activitycoding is unknown, as previous studies have investigated the validity of the principal injuryand external cause codes, but not activity codes. It should also be acknowledged that there isthe potential for double counting of hospitalised cases, as patients may be transferred from onehospital to another or to a different department within the same hospital, which would lead toan overestimation of the number of incident cases. Efforts were made to reduce this doublecounting by using the mode of separation variable to exclude transfers and statisticaldischarges. However, in the absence of identifiable fields or linked datasets, there still may becases that have been counted twice in this report. It is also important to note that more than aquarter of hospital separations (27.8%) did not have an activity code, which means that anumber of hospitalised cases related to sport or leisure activity are not included in this report.
There were a large number of hospitalised injuries for which the specific leisure activity beingundertaken at the time of injury was unknown. As shown in Table 9, there were 3960 casesthat had been coded as a leisure activity not elsewhere classified. There were also more than2000 hospitalisations that were coded to 'other football' or 'football unspecified' rather thanbeing allocated to one of the more specific football codes. This severely limits the ability toidentify priority sports and activities for the development of injury prevention strategies forthese cases. It is hoped that continued development of the ICD-10 codes will allow thosecoding the hospitalisations data to more easily classify the activity being undertaken at the timeof injury. This highlights the importance of the continued training of those recording andcoding the hospitalisations data so that more detail is obtained.
More needs to be done in order to improve the coding of sport-related cases routinelycollected in large administrative databases, such as hospital and death data. While the validityof the ICD-10 diagnosis codes is well established due to their value in health service utilisationapplications, very little is known of the validity of external causes of injury codes. These latterare vital to the identification of the sport/leisure cases and to the overall injury preventionefforts as they indicate the mechanism and the circumstances in which injury occurs. Inaddition, the relatively high number of missing cases (i.e. activity and place of injury codes)and unspecified codes suggest that more effort is needed, in close collaboration with healthinformation stakeholders, in order to ensure the appropriate training of coders regarding theuse of injury-related codes, including those specific to sport and physical activity.
The exposure data used in this report do not take into account the frequency of participationduring the 12 months prior to the ERASS and is therefore a limitation of these data. In addition,injury rates related to participation figures are based on the general question of participation inat least one physical activity for exercise, recreation or sport (see Appendix 3) and are likely tobe similar to population rates. This is because overall sport/leisure participation in thepopulation is high. This is different for participation rates related to specific sport/leisure

26
activities. It is also important to point out that injury rates for specific sport and physicalactivities based on participation in this report include only people aged >15 years. Therefore,caution is warranted when comparing them to those based on population denominators thatinclude all ages.
This report is limited to the deaths and hospitalisations associated with sport/leisure activities. Itis acknowledged that there is a wide range of settings in which a sport/leisure injury may betreated and, therefore, the surveillance systems used for this report only capture the mostsevere and catastrophic injuries sustained. Previous research has demonstrated that the vastmajority of such injuries are treated in emergency departments by general practitioners or insport/leisure injury clinics. Cassell and colleagues [39] established that for each hospitaladmission for a sport and active recreation injury there would be 10.6 emergency departmentpresentations and 11.7 GP presentations, for every 10,000 residents in the Latrobe Valleyregion. Therefore, the ratio of hospital admissions to emergency department presentations toGP presentations is 1:11:12. This demonstrates that the number of cases admitted to hospitalrepresent the tip of the iceberg for sport/leisure injuries. However, hospitalised injuries accountfor the greatest burden with respect to cost of treatment, time lost from work and time lost fromparticipation in sport/leisure. Therefore, these injuries remain the priority for injury preventioninitiatives.
An issue that has been commonly discussed in the literature is related to the definition of sport.Studies have adopted differing definitions of sport, with some including recreation, leisure andplay activities. The definitions are largely dependent on the injury surveillance system beingused. However, it should be noted that direct comparison of injury rates between studies isoften difficult due to different definitions of sport/leisure and injury.
Although this report can identify some sport/leisure activities for priority attention, it is notpossible to directly identify or recommend specific preventive measures. To do this, a detailedunderstanding of the causal mechanisms leading to the injuries would be needed, and thisdetail is not available in the ICD-10 codes.
This report has been strengthened by the inclusion of participation-adjusted rates of injury.However, there are still limitations associated with the approach taken. The rates were adjustedaccording to the number of participants, rather than the actual amount of exposure time (timeat risk) per participant. Unless sport/leisure-specific studies are conducted to calculate theactual exposure time, it will not be possible to determine the amount of time that people spendparticipating in a sport/leisure activity from the population-based data currently available.
In summary, this report has identified key areas of concern relating to sport/leisure-relateddeaths and hospitalised injuries in NSW. It is the first of three planned annual reports, andestablishes the baseline for which future reports will compare.
Da
ta im
pro
ve
me
nt p
rio
ritie
s

27
Re
fere
nc
es REFERENCES
1. Standing Committee on Recreation andSport. (2005). Participation in exercise,recreation and sport annual report 2004,from http://www.ausport.gov.au/full-text/2005/scors/ERASS2004.pdf
2. Australian Bureau of Statistics. (2003).Participation in sport and physical activi-ties, Australia 2002. Canberra, Australia:Australian Bureau of Statistics.
3. Australian Bureau of Statistics. (2003).Sport and recreation: A statisticaloverview. Canberra, Australia: AustralianBureau of Statistics.
4. Boufous, S., Finch, C. and Bauman, A.(2004). Parental safety concerns - a barrierto sport and physical activity in children?Australian & New Zealand Journal ofPublic Health, 28(5), 482-486.
5. Australian Sports Commission. (1997).Active Australia: a national participationframework. Canberra, Australia: AustralianSports Commission.
6. Bauman, A. and Owen, N. (1999).Physical activity of adult Australians: epi-demiological evidence and potentialstrategies for health gain. Journal ofScience & Medicine in Sport, 2(1), 30-41.
7. Commonwealth Department of Healthand Ageing. (1999). National PhysicalActivity Guidelines for Australians.Canberra, Australia: Commonwealth ofAustralia.
8. Finch, C., Ozanne-Smith, J. and Williams,F. (1995). The feasibility of improved datacollection methodologies for sportsinjuries. Melbourne, Australia: MonashUniversity Accident Research Centre.
9. Strategic Injury Prevention Partnership.(2001). National injury prevention plan:Priorities for 2001-2003. Canberra,Australia: Commonwealth of Australia.
10.Commonwealth Department of HumanServices and Health. (1994). Better healthoutcomes for Australians. National goals,targets and strategies for better health out-comes into the next century. Canberra,Australia: Commonwealth of Australia.
11.Finch, C. and McGrath, A. (1997).SportSafe Australia: A national sports safe-ty framework. A report prepared for theAustralian Sports Injury PreventionTaskforce. Canberra: Australian SportsCommission.
12.Watson, W.L. and Ozanne-Smith, J.(1998). The cost of injury in Victoria.Melbourne: Monash University AccidentResearch Centre.
13.Potter Forbes, M. and Aisbett, C. (2003).Injury costs! A valuation of the burden ofinjury in New South Wales 1998-1999.Sydney, Australia: NSW Injury RiskManagement Research Centre.
14.Commonwealth Department of Health andFamily Services and Australian Institute ofHealth and Welfare. (1998). NationalHealth Priority Areas Report: InjuryPrevention and Control 1997. Canberra,Australia: Commonwealth Department ofHealth and Family Services and AustralianInstitute of Health and Welfare.
15.Orchard, J. and Seward, H. (2002).Epidemiology of injuries in the AustralianFootball League, seasons 1997-2000.British Journal of Sports Medicine, 36(1),39-44.
16.Gabbe, B., Finch, C., Wajswelner, H. andBennell, K. (2002). Australian football:injury profile at the community level.Journal of Science & Medicine in Sport,5(2), 149-160.
17.Braham, R., Finch, C.F. and McCrory, P.(2004). The incidence of head/neck/orofa-cial injuries in non-elite Australian foot-ball. Journal of Science & Medicine inSport, 7(4), 451-453.
18.Braham, R., Finch, C., McIntosh, A. andMcCrory, P. (2004). Community levelAustralian football - a profile of injuries.Journal of Science & Medicine in Sport,7(1), 96-105.
19.Orchard, J., James, T., Alcott, E., Carter, S.and Farhart, P. (2002). Injuries inAustralian cricket at first class level1995/1996 to 2000/2001. British Journal ofSports Medicine, 36(4), 270-274.
20.Dennis, R., Farhart, P., Goumas, C. andOrchard, J. (2003). Bowling workload andthe risk of injury in elite cricket fastbowlers. Journal of Science & Medicine inSport, 6(3), 359-367.
21.Dennis, R.J., Finch, C.F. and Farhart, P.J.(2005). Is bowling workload a risk factorfor injury to Australian junior cricket fastbowlers? British Journal of SportsMedicine, 39(11), 843-846.
22.Eime, R., Zazryn, T. and Finch, C. (2003).Epidemiology of squash injuries requiringhospital treatment. Injury Control & SafetyPromotion, 10(4), 243-245.

28
23.Bladin, C., Giddings, P. and Robinson, M.(1993). Australian snowboard injury database study. A four-year prospective study.American Journal of Sports Medicine,21(5), 701-704.
24.Zazryn, T.R., Finch, C.F. and McCrory, P.(2003). A 16 year study of injuries to pro-fessional boxers in the state of Victoria,Australia. British Journal of SportsMedicine, 37(4), 321-324.
25.Kolt, G.S. and Kirkby, R.J. (1999).Epidemiology of injury in elite and sube-lite female gymnasts: a comparison of ret-rospective and prospective findings.British Journal of Sports Medicine, 33(5),312-318.
26.Gabbett, T.J. (2000). Incidence, site, andnature of injuries in amateur rugby leagueover three consecutive seasons. BritishJournal of Sports Medicine, 34(2), 98-103.
27.Gabbett, T.J. (2004). Incidence of injury injunior and senior rugby league players.Sports Medicine, 34(12), 849-859.
28.Bathgate, A., Best, J.P., Craig, G. andJamieson, M. (2002). A prospective studyof injuries to elite Australian rugby unionplayers. British Journal of Sports Medicine,36(4), 265-269.
29.Paix, B.R. (1999). Rider injury rates andemergency medical services at equestrianevents. British Journal of Sports Medicine,33(1), 46-48.
30.Cunningham, C. and Cunningham, S.(1996). Injury surveillance at a nationalmulti-sport event. Australian Journal ofScience & Medicine in Sport, 28(2), 50-56.
31.Baquie, P. and Brukner, P. (1997). Injuriespresenting to an Australian sports medi-cine centre: a 12-month study. ClinicalJournal of Sport Medicine, 7(1), 28-31.
32.Wong, A.S., Simpson, D.A., Jones, N.R.and Gilligan, J.E. (2002). Camel racing: anew cause of extradural haemorrhage inAustralia. Journal of ClinicalNeuroscience, 9(6), 719-721.
33.Finch, C. (2006). A new framework forresearch leading to sports injury preven-tion. Journal of Science & Medicine inSport, 9(1-2), 3-9.
34.Finch, C.F. (1997). An overview of somedefinitional issues for sports injury surveil-lance. Sports Medicine, 24(3), 157-163.
35.Australian Sports Injury Data WorkingParty. (1998). Australian Sports Injury DataDictionary: guidelines for injury data col-lection and classification for the preventionand control of injury in sport and recre-ation. Canberra: SportSafe Australia(Australian Sports Commission) and SportsMedicine Australia.
36.Finch, C., Valuri, G. and Ozanne-Smith, J.(1998). Sport and active recreation injuriesin Australia: evidence from emergencydepartment presentations. British Journal ofSports Medicine, 32(3), 220-225.
37.Flood, L. and Harrison, J.E. (2004).Hospitalised sports injury, Australia 2002-03. Adelaide, Australia: Australian Instituteof Health and Welfare.
38.Gabbe, B.J., Finch, C.F., Cameron, P.A.and Williamson, O.D. (2005). Incidence ofserious injury and death during sport andrecreation activities in Victoria, Australia.British Journal of Sports Medicine, 39(8),573-577.
39.Cassell, E.P., Finch, C.F. and Stathakis, V.Z.(2003). Epidemiology of medically treatedsport and active recreation injuries in theLatrobe Valley, Victoria, Australia. BritishJournal of Sports Medicine, 37(5), 405-409.
40.Mummery, W.K., Schofield, G. andSpence, J.C. (2002). The epidemiology ofmedically attended sport and recreationalinjuries in Queensland. Journal of Science& Medicine in Sport, 5(4), 307-320.
41.Stevenson, M.R., Hamer, P., Finch, C.F.,Elliott, B. and Kresnow, M. (2000). Sport,age, and sex specific incidence of sportsinjuries in Western Australia. BritishJournal of Sports Medicine, 34(3), 188-194.
42.Australian Bureau of Statistics. (2003).National Health Survey: Injuries, Australia2001. Canberra, Australia: AustralianBureau of Statistics.
43.Medibank Private. (2004). Sports injuriesreport 2004. Melbourne, Australia:Medibank Private.
44.Lower, T. (1996). Sport injury patterns inurban and rural accident and emergencyunits. Australian Journal of Rural Health,4(1), 28-32.
Re
fere
nc
es
29
Re
fere
nc
es 45.Lam, L.T. (2005). Hospitalisation due to
sports-related injuries among children andadolescents in New South Wales,Australia: an analysis on socioeconomicand geographic differences. Journal ofScience & Medicine in Sport, 8(4), 433-440.
46.Lee, S., Thavaseelan, J. and Low, V. (2004).Renal trauma in Australian Rules Football:An institutional experience. Australian andNew Zealand Journal of Surgery, 74(9),766-768.
47.Dongas, P. and Hall, G.M. (2002).Mandibular fracture patterns in Tasmania,Australia. Australian Dental Journal, 47(2),131-137.
48.Carmody, D.J., Taylor, T.K.F., Parker, D.A.,Coolican, M.R.J. and Cumming, R.G.(2005). Spinal cord injuries in Australianfootballers 1997-2002. Medical Journal ofAustralia, 182(11), 561-564.
49.Ashby, K.C.E. (2004). Boating-relatedsports and recreational injury, Victoria July2000 to June 2002. Melbourne, Australia:Monash University Accident ResearchCentre.
50.Jago, D. and Finch, C. (1998). Sportingand recreational injuries. In a generalpractice setting. Australian FamilyPhysician, 27(5), 389-395.
51.Finch, C.F. and Kenihan, M.A. (2001). Aprofile of patients attending sports medi-cine clinics. British Journal of SportsMedicine, 35(4), 251-256.
52.Gabbe, B. and Finch, C. (2001). A profileof Australian football injuries presenting tosports medicine clinics. Journal of Science& Medicine in Sport, 4(4), 386-395.
53.Australian Bureau of Statistics. (2003).Multiple Cause of Death Analysis, 1997-2001. Canberra, Australia: AustralianBureau of Statistics.
54.World Health Organization. (1998).International Classification of Diseases andrelated health problems: Tenth revision.Geneva, Switzerland: WHO.
55.Centre for Epidemiology and Research.(2006). Health Outcomes and InformationStatistical Toolkit (HOIST). InpatientStatistics Collection. Sydney, Australia:NSW Department of Health.
56.National Centre for Classification inHealth. (2002). The International StatisticalClassification of Diseases and RelatedHealth Problems, 10th Revision, AustralianModification (ICD-10-AM). 3rd Edition.Sydney, Australia: National Centre forClassification in Health.
57.Standing Committee on Recreation andSport. (2004). Participation in exercise,recreation and sport annual report 2003,from http://www.ausport.gov.au/scorsre-search/erass2003.asp
58.SAS Institute. (2000). SAS: statistical soft-ware. Version 8.02. . Cary, USA: SASInstitute.
59.Harrison, J.E. and Steenkamp, M. (2002).Technical review and documentation ofcurrent NHPA injury indicators and datasources. Adelaide, Australia: AustralianInstitute of Health and Welfare.

30
Ap
pe
nd
ix 1
: Su
mm
ary o
f ep
ide
mio
log
ica
l stu
die
s o
f sp
ort/
leis
ure
inju
ry in
Au
str
alia

Ap
pe
nd
ix 1
: S
um
ma
ry o
f e
pid
em
iolo
gic
al
stu
die
s o
f sp
ort/
leis
ure
in
jury i
n A
ustr
alia
31

32
Ap
pe
nd
ix 1
: Su
mm
ary o
f ep
ide
mio
log
ica
l stu
die
s o
f sp
ort/
leis
ure
inju
ry in
Au
str
alia
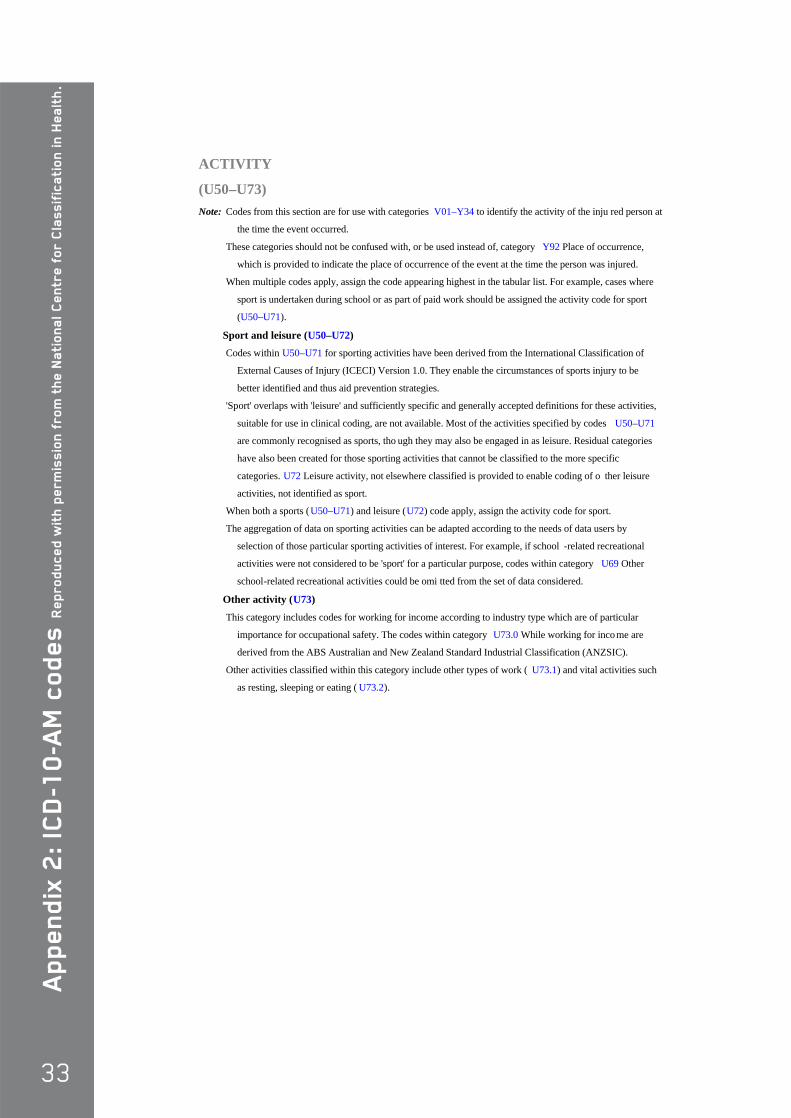
33
Ap
pe
nd
ix 2
: IC
D-1
0-A
M c
od
es R
ep
ro
du
ce
d w
ith
pe
rm
issio
n f
ro
m t
he
Na
tio
na
l C
en
tre
fo
r C
lassif
ica
tio
n i
n H
ea
lth
.
ACTIVITY
(U50–U73) Note: Codes from this section are for use with categories V01–Y34 to identify the activity of the inju red person at
the time the event occurred.
These categories should not be confused with, or be used instead of, category Y92 Place of occurrence,
which is provided to indicate the place of occurrence of the event at the time the person was injured.
When multiple codes apply, assign the code appearing highest in the tabular list. For example, cases where
sport is undertaken during school or as part of paid work should be assigned the activity code for sport
(U50–U71).
Sport and leisure (U50–U72) Codes within U50–U71 for sporting activities have been derived from the International Classification of
External Causes of Injury (ICECI) Version 1.0. They enable the circumstances of sports injury to be
better identified and thus aid prevention strategies.
'Sport' overlaps with 'leisure' and sufficiently specific and generally accepted definitions for these activities,
suitable for use in clinical coding, are not available. Most of the activities specified by codes U50–U71
are commonly recognised as sports, tho ugh they may also be engaged in as leisure. Residual categories
have also been created for those sporting activities that cannot be classified to the more specific
categories. U72 Leisure activity, not elsewhere classified is provided to enable coding of o ther leisure
activities, not identified as sport.
When both a sports (U50–U71) and leisure (U72) code apply, assign the activity code for sport.
The aggregation of data on sporting activities can be adapted according to the needs of data users by
selection of those particular sporting activities of interest. For example, if school -related recreational
activities were not considered to be 'sport' for a particular purpose, codes within category U69 Other
school-related recreational activities could be omi tted from the set of data considered.
Other activity (U73) This category includes codes for working for income according to industry type which are of particular
importance for occupational safety. The codes within category U73.0 While working for inco me are
derived from the ABS Australian and New Zealand Standard Industrial Classification (ANZSIC).
Other activities classified within this category include other types of work ( U73.1) and vital activities such
as resting, sleeping or eating ( U73.2).

34
Ap
pe
nd
ix 2
: ICD
-10
-AM
co
de
s
Re
pro
du
ce
d w
ith p
erm
issio
n fr
om
the
Na
tion
al C
en
tre
for C
lassific
atio
n in
He
alth
.
WHILE ENGAGED IN SPORT S OR LEISURE
(U50–U72)
⊗⊗U50 Team ball sports
⊗⊗U50.0 Football
⊗U50.00 Australian Rules
⊗U50.01 Rugby Union
⊗U50.02 Rugby League
⊗U50.03 Rugby, unspecified
⊗U50.04 Soccer
⊗U50.05 Touch football
American touch or flag
Touch rugby
⊗U50.08 Other specified football
American tackle
Gaelic
Gridiron
⊗U50.09 Football, unspecified
⊗U50.1 Basketball
⊗U50.2 Handball, team
⊗⊗U50.3 Netball
⊗U50.30 Indoor
6 player
Excludes: traditional netball played indoors ( U50.39)
⊗U50.39 Netball, other and unspecified
Netball NOS
⊗U50.4 Korfball
⊗U50.5 Volleyball
Volleyball (2, 4 or 6 player):
• beach
• indoor
• outdoor
⊗U50.8 Other specified team ball sport
⊗U50.9 Unspecified team ball sport

35
Ap
pe
nd
ix 2
: IC
D-1
0-A
M c
od
es R
ep
ro
du
ce
d w
ith
pe
rm
issio
n f
ro
m t
he
Na
tio
na
l C
en
tre
fo
r C
lassif
ica
tio
n i
n H
ea
lth
.
⊗⊗U51 Team bat or stick sports
⊗U51.0 Baseball
⊗U51.1 Cricket
⊗⊗U51.2 Hockey
⊗U51.20 Ice
Ice hockey:
• indoor
• outdoor
⊗U51.21 Street and ball
Outdoor hockey played on in -line or roller skates
⊗U51.22 Field
Outdoor hockey played on turf or grass
⊗U51.23 Floor
Indoor hockey played on hard surface with or without in -line or roller skates
⊗U51.28 Other specified hockey
Underwater hockey
⊗U51.29 Hockey, unspecified
⊗U51.3 Softball
⊗U51.4 T-ball
⊗U51.8 Other specified team bat or stick sport
Lacrosse
⊗U51.9 Unspecified team bat or stick sport
⊗⊗U52 Team water sports
Excludes: competitive and recreational swimming ( U54.5-)
individual water sports (U54.-)
⊗U52.0 Synchronised swimming
⊗U52.1 Water polo
⊗U52.8 Other specified team water sport
⊗U52.9 Unspecified team water sport
⊗⊗U53 Boating sports
⊗U53.0 Canoeing
⊗U53.1 Jet skiing
⊗U53.2 Kayaking
⊗U53.3 Power boat racing
Jet boat racing
⊗U53.4 Rowing and sculling
⊗U53.5 Surf boating
⊗U53.6 Yachting and sailing

36
Ap
pe
nd
ix 2
: ICD
-10
-AM
co
de
s
Re
pro
du
ce
d w
ith p
erm
issio
n fr
om
the
Na
tion
al C
en
tre
for C
lassific
atio
n in
He
alth
.
⊗U53.7 Surf skiing
⊗U53.8 Other specified boating sport
⊗U53.9 Unspecified boating sport
Recreational boating NOS
⊗⊗U54 Individual water sports
⊗⊗U54.0 Diving
Excludes: scuba diving (U54.2)
⊗U54.00 Cliff
⊗U54.01 Springboard
⊗U54.02 Platform
⊗U54.08 Other specified diving
⊗U54.09 Diving, unspecified
⊗⊗U54.1 Fishing
⊗U54.10 Rock fishing
⊗U54.18 Other specified fishing
Ice fishing
Spear fishing
⊗U54.19 Fishing, unspecified
⊗U54.2 Scuba diving
⊗U54.3 Snorkelling
⊗U54.4 Surfing and boogie boarding
Excludes: wind surfing (U54.7)
⊗⊗U54.5 Swimming
⊗U54.50 Competitive
⊗U54.51 Recreational
⊗U54.59 Swimming, unspecified
⊗U54.6 Water skiing
Wake boarding
Water ski jumping
⊗U54.7 Wind surfing
Excludes: surfing and boogie boarding ( U54.4)
⊗U54.8 Other specified individual water sport
Water:
• sliding
• tubing
⊗U54.9 Unspecified individual water sport

37
Ap
pe
nd
ix 2
: IC
D-1
0-A
M c
od
es R
ep
ro
du
ce
d w
ith
pe
rm
issio
n f
ro
m t
he
Na
tio
na
l C
en
tre
fo
r C
lassif
ica
tio
n i
n H
ea
lth
.
⊗⊗U55 Ice and snow sports
⊗U55.0 Bobsledding
Luge
⊗U55.1 Ice skating and ice dancing
Figure skating
Excludes: ice hockey (U51.20)
speed skating (U55.5)
⊗⊗U55.2 Skiing
⊗U55.20 Alpine and downhill
⊗U55.21 Nordic and cross country
⊗U55.22 Freestyle
⊗U55.23 Snow ski jumping
Aerials
⊗U55.28 Other specified skiing
⊗U55.29 Skiing, unspecified
⊗U55.3 Snowmobiling
⊗U55.4 Snow boarding
⊗U55.5 Speed skating
Excludes: ice hockey (U51.20)
ice skating and ice dancing ( U55.1)
⊗U55.6 Tobogganing
⊗U55.7 Curling
⊗U55.8 Other specified ice or snow sport
⊗U55.9 Unspecified ice or snow sport
⊗⊗U56 Individual athletic activities
⊗⊗U56.0 Aerobics and calisthenics
⊗U56.00 Aerobics
Aquarobics
Boxercise
High impact }
Low impact }
Pump } aerobics
Sculpture }
Step }
Taibo
⊗U56.01 Calisthenics
⊗U56.1 Jogging and running
Excludes: running (in):
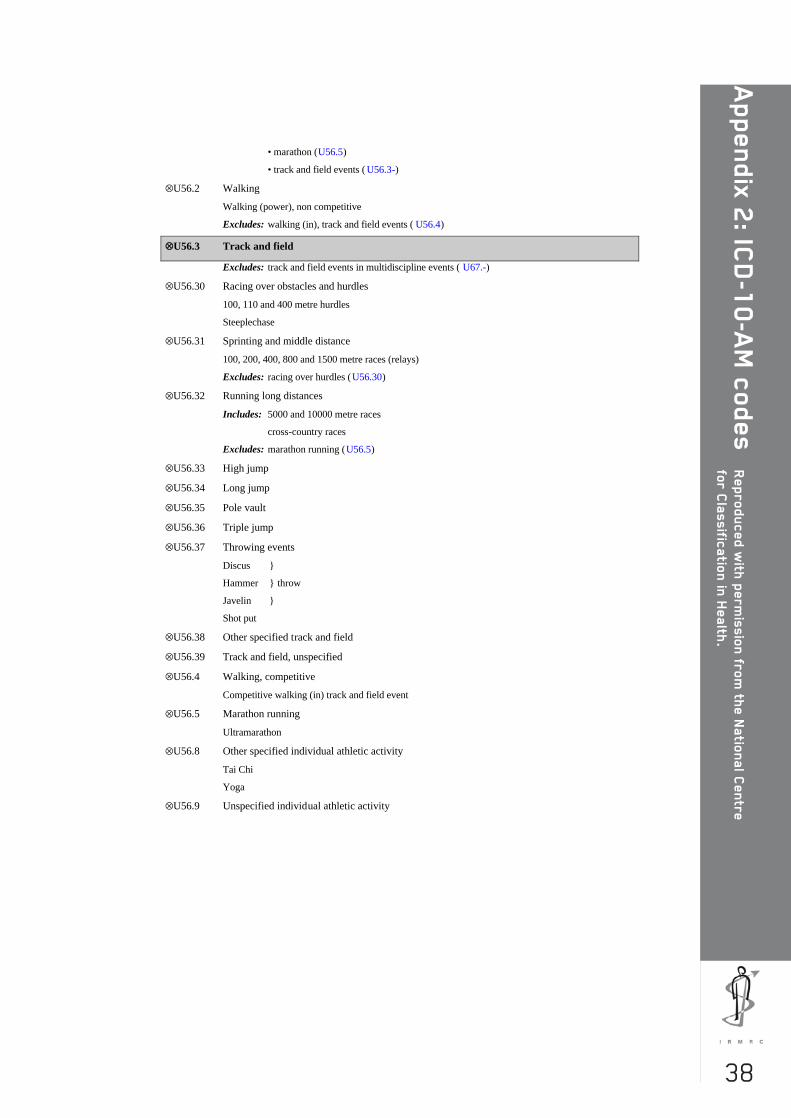
38
Ap
pe
nd
ix 2
: ICD
-10
-AM
co
de
s
Re
pro
du
ce
d w
ith p
erm
issio
n fr
om
the
Na
tion
al C
en
tre
for C
lassific
atio
n in
He
alth
.
• marathon (U56.5)
• track and field events ( U56.3-)
⊗U56.2 Walking
Walking (power), non competitive
Excludes: walking (in), track and field events ( U56.4)
⊗⊗U56.3 Track and field
Excludes: track and field events in multidiscipline events ( U67.-)
⊗U56.30 Racing over obstacles and hurdles
100, 110 and 400 metre hurdles
Steeplechase
⊗U56.31 Sprinting and middle distance
100, 200, 400, 800 and 1500 metre races (relays)
Excludes: racing over hurdles (U56.30)
⊗U56.32 Running long distances
Includes: 5000 and 10000 metre races
cross-country races
Excludes: marathon running (U56.5)
⊗U56.33 High jump
⊗U56.34 Long jump
⊗U56.35 Pole vault
⊗U56.36 Triple jump
⊗U56.37 Throwing events
Discus }
Hammer } throw
Javelin }
Shot put
⊗U56.38 Other specified track and field
⊗U56.39 Track and field, unspecified
⊗U56.4 Walking, competitive
Competitive walking (in) track and field event
⊗U56.5 Marathon running
Ultramarathon
⊗U56.8 Other specified individual athletic activity
Tai Chi
Yoga
⊗U56.9 Unspecified individual athletic activity

39
Ap
pe
nd
ix 2
: IC
D-1
0-A
M c
od
es R
ep
ro
du
ce
d w
ith
pe
rm
issio
n f
ro
m t
he
Na
tio
na
l C
en
tre
fo
r C
lassif
ica
tio
n i
n H
ea
lth
.
⊗⊗U57 Acrobatic sports
⊗⊗U57.0 Gymnastics
⊗U57.00 Balance beam
⊗U57.01 Floor
Floor exercise and tumbling
Rhythmic gymnastics (with props)
⊗U57.02 High bar
Uneven parallel bars
⊗U57.03 Parallel bars
⊗U57.04 Rings
⊗U57.05 Side horse and pommel horse
⊗U57.06 Trampoline and mini-trampoline
⊗U57.07 Vault
⊗U57.08 Other specified gymnastics
⊗U57.09 Gymnastics, unspecified
⊗U57.8 Other specified acrobatic sport
⊗U57.9 Unspecified acrobatic sport
⊗⊗U58 Aesthetic activities
⊗U58.0 Dancing
⊗U58.8 Other specified aesthetic sport
Marching
⊗U58.9 Unspecified aesthetic sport
⊗⊗U59 Racquet sports
⊗U59.0 Badminton
⊗U59.1 Racquetball
⊗U59.2 Squash
⊗U59.3 Table tennis and Ping-Pong
⊗U59.4 Tennis
Clay }
Grass } court tennis
Hard }
⊗U59.8 Other specified racquet sport
⊗U59.9 Unspecified racquet sport
⊗⊗U60 Target and precision sports
⊗U60.0 Archery
⊗U60.1 Billiards, pool and snooker

40
Ap
pe
nd
ix 2
: ICD
-10
-AM
co
de
s
Re
pro
du
ce
d w
ith p
erm
issio
n fr
om
the
Na
tion
al C
en
tre
for C
lassific
atio
n in
He
alth
.
⊗⊗U60.2 Bowling
⊗U60.20 Lawn bowling
⊗U60.21 Tenpin bowling
⊗U60.22 Indoor bowling
Excludes: tenpin bowling (U60.21)
⊗U60.29 Bowling, other and unspecified
⊗U60.3 Croquet
⊗U60.4 Darts
⊗U60.5 Golf
⊗U60.6 Firearm shooting
Clay }
Field }
Pigeon } shooting
Running game }
Skeet }
⊗U60.8 Other specified target and precision sport
Bocce
Boules
Petanque
⊗U60.9 Unspecified target and precision sports
⊗⊗U61 Combative sports
⊗U61.0 Aikido
⊗U61.1 Boxing
⊗U61.2 Fencing
Excludes: in modern pentathlon (U67.3)
⊗⊗U61.3 Martial arts
⊗U61.30 Judo
⊗U61.31 Jujitsu
⊗U61.32 Karate
⊗U61.33 Kendo
⊗U61.34 Kick-boxing
⊗U61.35 Kung fu
⊗U61.36 Tae kwon do
⊗U61.38 Other specified martial arts
⊗U61.39 Martial arts, unspecified
⊗⊗U61.4 Wrestling
⊗U61.40 Freestyle
⊗U61.41 Greco-Roman
⊗U61.42 Professional

41
Ap
pe
nd
ix 2
: IC
D-1
0-A
M c
od
es R
ep
ro
du
ce
d w
ith
pe
rm
issio
n f
ro
m t
he
Na
tio
na
l C
en
tre
fo
r C
lassif
ica
tio
n i
n H
ea
lth
.
⊗U61.48 Other specified wrestling
⊗U61.49 Wrestling, unspecified
⊗U61.5 Self defence training
⊗U61.8 Other specified combative sport
⊗U61.9 Unspecified combative sport
⊗⊗U62 Power sports
⊗U62.0 Power lifting
Bench press
Deadlift
Squat
⊗U62.1 Weight lifting
Competition and noncompetition:
• Clean-and-Jerk
• Snatch
⊗U62.3 Strength training and body building
⊗U62.4 Wood chopping
⊗U62.5 Wood sawing
⊗U62.8 Other specified power sport
⊗U62.9 Unspecified power sport
⊗⊗U63 Equestrian activities
Excludes: in modern pentathlon (U67.3)
⊗⊗U63.0 Equestrian events
⊗U63.01 Dressage
⊗U63.02 Show jumping
⊗U63.03 Steeplechase
⊗U63.08 Other specified equestrian event
⊗U63.09 Equestrian event, unspecified
⊗U63.1 Endurance riding
Cross-country riding
⊗U63.2 Polo and polocrosse
⊗U63.3 Horse racing
Excludes: trotting and harness racing ( U63.6)
⊗U63.4 Rodeo
⊗U63.5 Trail or general horseback riding
⊗U63.6 Trotting and harness
⊗U63.8 Other specified equestrian activity
⊗U63.9 Unspecified equestrian activity
⊗⊗U64 Adventure sports
⊗U64.0 Abseiling and rappelling
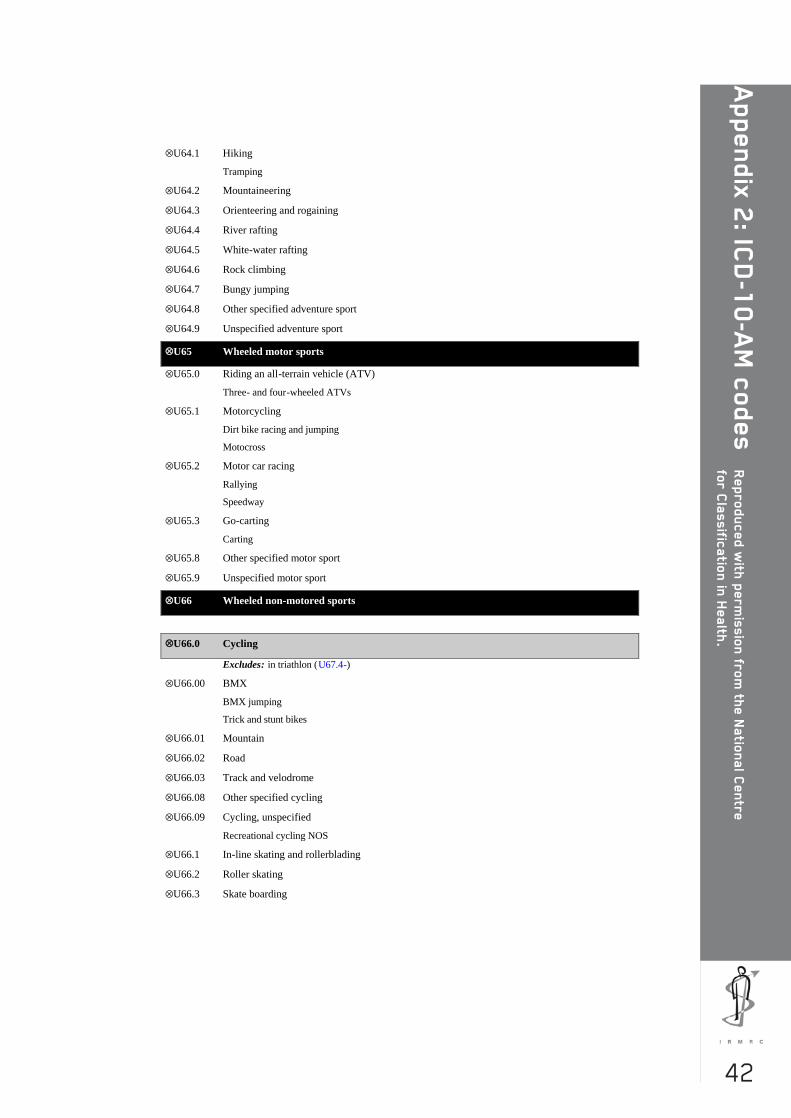
42
Ap
pe
nd
ix 2
: ICD
-10
-AM
co
de
s
Re
pro
du
ce
d w
ith p
erm
issio
n fr
om
the
Na
tion
al C
en
tre
for C
lassific
atio
n in
He
alth
.
⊗U64.1 Hiking
Tramping
⊗U64.2 Mountaineering
⊗U64.3 Orienteering and rogaining
⊗U64.4 River rafting
⊗U64.5 White-water rafting
⊗U64.6 Rock climbing
⊗U64.7 Bungy jumping
⊗U64.8 Other specified adventure sport
⊗U64.9 Unspecified adventure sport
⊗⊗U65 Wheeled motor sports
⊗U65.0 Riding an all-terrain vehicle (ATV)
Three- and four-wheeled ATVs
⊗U65.1 Motorcycling
Dirt bike racing and jumping
Motocross
⊗U65.2 Motor car racing
Rallying
Speedway
⊗U65.3 Go-carting
Carting
⊗U65.8 Other specified motor sport
⊗U65.9 Unspecified motor sport
⊗⊗U66 Wheeled non-motored sports
⊗⊗U66.0 Cycling
Excludes: in triathlon (U67.4-)
⊗U66.00 BMX
BMX jumping
Trick and stunt bikes
⊗U66.01 Mountain
⊗U66.02 Road
⊗U66.03 Track and velodrome
⊗U66.08 Other specified cycling
⊗U66.09 Cycling, unspecified
Recreational cycling NOS
⊗U66.1 In-line skating and rollerblading
⊗U66.2 Roller skating
⊗U66.3 Skate boarding

43
Ap
pe
nd
ix 2
: IC
D-1
0-A
M c
od
es R
ep
ro
du
ce
d w
ith
pe
rm
issio
n f
ro
m t
he
Na
tio
na
l C
en
tre
fo
r C
lassif
ica
tio
n i
n H
ea
lth
.
⊗⊗U66.4 Scooter riding
⊗U66.40 Folding non-motored scooter
⊗U66.49 Other and unspecified non-motored scooter
Scooter riding NOS
⊗U66.8 Other specified wheeled non-motored sport
Street luge
⊗U66.9 Unspecified wheeled non-motored sport
⊗⊗U67 Multidiscipline sports
⊗U67.0 Biathlon, winter
Includes: cross-country skiing } event(s)
shooting }
Excludes: summer biathlon (U67.8)
⊗U67.1 Decathlon
Includes: 100, 400 and 1500 metre }
110 metre hurdles }
discus throw }
high jump } event(s)
javelin throw }
long jump }
pole vault }
shot put }
⊗U67.2 Heptathlon
Includes: 100 metre hurdles }
200 and 800 metre }
high jump }
javelin throw } event(s)
long jump }
pole vault }
shot put }
⊗U67.3 Modern Pentathlon
Includes: equestrian }
fencing }
running } event(s)
shooting }
swimming }
⊗⊗U67.4 Triathlon
⊗U67.40 Cycling event
⊗U67.41 Running event
⊗U67.42 Swimming event
⊗U67.49 Unspecified event
⊗U67.8 Other specified multidiscipline sport
44
Ap
pe
nd
ix 2
: ICD
-10
-AM
co
de
s
Re
pro
du
ce
d w
ith p
erm
issio
n fr
om
the
Na
tion
al C
en
tre
for C
lassific
atio
n in
He
alth
.
Summer biathlon
⊗U67.9 Unspecified multidiscipline sport
⊗⊗U68 Aero sports
⊗U68.1 Aerobatics
⊗U68.2 Gliding
⊗U68.3 Hang gliding
⊗U68.4 Parachuting and sky diving
BASE jumping
Sky surfing
⊗U68.5 Paragliding and parasailing
Parapenting
⊗U68.6 Hot air ballooning
⊗U68.8 Other specified aero sport
⊗U68.9 Unspecified aero sport
⊗⊗U69 Other school-related recreational activities
⊗U69.0 School physical education class
⊗U69.1 School free play
Activities during recess
⊗U69.8 Other specified school-related recreational activity
⊗U69.9 Unspecified school-related recreational activity
⊗⊗U70 Other specified sport and exercise activity
⊗U70.0 Athletic activities involving fitness equipment, not elsewhere classified
Includes: dumbbell
Stairmaster
stationary pedal cycle
treadmill
Excludes: strength training and body building ( U62.3)
⊗U70.8 Other specified sport and exercise activity
⊗⊗U71 Unspecified sport and exercise activity
⊗⊗U72 Leisure activity, not elsewhere classified
Hobby activities
Participation in sessions and activities of vol untary organisations
Includes: leisure-time activities with an entertainment element such as going to the cinema, to a
dance or to a party

45
Ap
pe
nd
ix 3
: D
ata
fro
m t
he
ER
AS
S
The Exercise, Recreation and Sport Survey (ERASS) is a joint initiative of the Aus tralian Sports Commission and the state
and territory agencies responsible for sport and recreation. The following participation data for NSW and associated
information are reproduced with permission.
Participation figures used in this report were based o n the following ERASS questions:
The following questions are about physical activities you have participated in during the last 12 months for exercise,
recreation or sport. Do not include any activities that were part of work or household and garden chores .
Q1 During the last 12 months did you participate in any physical activities for exercise, recreation or sport?
Yes............................................................................................................1 Go to Q2
No.................. ............................................................................................2 Go to Q6
Don’t know.................................................................................................9 Go to Q6
Q2 What activities did you participate in?
Up to maximum of 10 activities to be coded
Participation in sport and recreational activities in New South Wales, 2003–2004*
Age group (years) Males Females Persons
15–24 846,800 808,900 1,655,700
25–34 857,400 821,400 1,678,800
35–44 820,700 816,800 1,637,500
45–54 750,100 701,900 1,452,000
55–64 515,400 509,800 1,025,200
65 and over 519,800 603,000 1,122,800
Total 4,310,200 4,261,800 8,572,000

46
Ap
pe
nd
ix 3
: Da
ta fr
om
the
ER
AS
S
Participation in selected sports and physical activities used in this report. NSW
, 2003–2004*
2003
2004
M
ales Fem
ales Persons
Males
Females
Persons
Football, Rugby (League, U
nion) 118,100
18,700 136,800
153,100 13,500
166,600
Football, Australian R
ules 45,900
6,600 52,500
39,000 4,000
43,100
Football, soccer (indoor and outdoor) 288,300
82,500 370,800
304,900 92,400
418,400
Netball
9,800 138,500
148,300 14,200
138,500 152,700
Cricket (indoor and outdoor)
164,900 23,700
188,600 197,000
21,900 218,900
Basketball
119,400 51,700
171,100 85,400
52,200 137,600
Field hockey 15,400
25,500 40,800
147,900 21,900
169,800
Racquet sports (tennis, squash and other racquet sports)
368,500 254,600
623,100 398,800
268,400 667,200
Ice and snow sports
62,400 25,600
88,000 79,600
54,300 133,900
Individual athletic activities (bushwalking, other w
alking, running, athletics, track, triathlon and track and field)
1,469,100
2,010,100 3,479,200
1,446,100
2,155,400
3,601,500
Acrobatic sports
NA
N
A
NA
3,600
14,700 18,300
Target and precision sports# (darts, shooting sports, golf , bowling,
billiards, snooker and pool) 470,400
167,800 638,200
539,300 168,900
708,300
Equestrian sports 20,500
26,300 46,800
11,600 55,300
66,900
Motor sports (m
otorcycle and other wheeled m
otor sports) 43,600
3,300 46,900
70,000 2,700
72,700
Swim
ming
431,600 483,900
915,600 470,500
491,300 961,800
Surfing and boogie boarding
133,800 15,900
149,700 192,700
39,500 232,300
Cycling
294,900 109,400
404,300 324,100
157,600 481,700
Skating and rollerblading (roller sports) 25,000
7,200 32,200
17,400 15,200
32,700
*Adapted from
: - Standing C
omm
ittee on Recreation and Sport 2005, Participation in exercise, recreation and sport annual report 2004, SC
OR
S, Canberra; and
- Standing C
omm
ittee on Recreation and Sport 2004, Participation in exercise, recreation and sport annual report 2003, SC
OR
S, Canberra.
#Shooting sports were not included in 2003