Embed Size (px)
Citation preview

181
Chapter 5
Liquid Water Oceans in Ice Giants
5.1 Introduction
Water is spectroscopically undetectable in both Uranus and Neptune; its saturated mixing ratio in
their cold photospheres is less than 10−25. However, the compressed, deep interior density of these
planets is strikingly close to that of pure water (Hubbard 1999). Additionally, successful density
models require an ice to rock mass ratio greater than unity (Hubbard et al. 1995) and gas comprising
less than 18% of the planet’s mass (Podolak et al. 2000). When addressing planetary mass, we take
“gas” to mean hydrogen and helium, and we assume “ice” consists of water ice as well as methane,
ammonia, and hydrogen sulfide. There is evidence based on CO observations that the enhancement
of oxygen in Neptune’s atmosphere with respect to the solar value is larger than that for carbon,
nitrogen, and sulfur (Lodders & Fegley 1994). Since oxygen is the most abundant element in the
solar system next to hydrogen and helium, water is thought to be the dominant component of ice
in the outer solar system. Thus, there must be a significant water reservoir in Uranus and Neptune.
Indeed, there has been speculation about oceans” in their deep interiors (Atreya 1986, p. 64; Hub-
bard et al. 1995), but these oceans” describe ionic phase transitions at thousands of degrees Kelvin.
We explore the necessary conditions for bona fide liquid water-hydrogen oceans to exist in the
upper interior of Neptune, where pressure is less than about 20 kbar and temperature is less than
about 800 K. We define the word “ocean” to mean a body with an interface between a hydrogen-rich,
saturated vapor and a water-rich, liquid ocean. We set up favorable conditions for an extant Nep-
tunian water ocean to show that its existence is unlikely: water, hydrogen, and helium are assumed
to be well mixed in the interior of the planet, and we assume a saturated (moist) water adiabat
1This chapter has been published as Wiktorowicz, S. J. & Ingersoll, A. P. 2007, Icarus 186, 436.

182
0 1 2 3 4 5 6 7 8 9x 10⁷
273300
350
400
450
500
550
600
647
700
750
Entropy (erg g−1 K−1)
T (K
)
Liquid
Liquid + Vapor
Vapor
Supercritical fluidMoist adiabatDry adiabatCritical point
Figure 5.1: Temperature-entropy curve for pure water. Note that an adiabat is a vertical line in thisdiagram and that temperature is shown increasing downward.
descends from the photosphere. The photospheric adiabat and the interior adiabat join at a phase
boundary that is either a cloud base or an ocean surface. The temperature-entropy diagram for
pure water (Figure 5.1) provides a qualitative illustration of how this works. We show temperature
decreasing upward in this figure, so an adiabat from the deep interior is a vertical line from below.
If it approaches the phase boundary on the right (the high-entropy side of the critical point), then
liquid droplets will form in the vapor. If the interior adiabat approaches the phase boundary on
the left (the low-entropy side of the critical point), then vapor bubbles will form in the liquid. The
former is analogous to a cloud base and the latter is analogous to an ocean surface. The critical
adiabat is the one that intersects the phase boundary at the critical point, which is also the warmest
point (647 K) on the phase boundary.
Since hydrogen is present in ice giants in addition to water vapor, the critical point at each
pressure level will depend on its composition. To describe these mixtures, Figure 5.1 should be
three-dimensional with composition as the third axis. The critical point from Figure 5.1 then be-
comes a critical curve. The locations of phase boundaries will be strongly affected by mixture
composition. Seward & Franck (1981), hereafter referred to as SF, experimentally identify the criti-

183
cal curve. They also investigate the phase boundaries of water-hydrogen mixtures for temperatures,
pressures, and compositions below 654 K, 2.5 kbar, and 60 mol-% hydrogen to (water + hydrogen).
In an ice giant with a moist adiabat connecting the photosphere to a phase transition, the exis-
tence of a cloud base or an ocean surface depends on two input parameters: the water to total gas
mixing ratio of the deep interior and the photospheric temperature. The moist adiabat extending
down from the photosphere contains two phases, a gas phase and a condensed phase. A cloud base
will result if the gas phase reaches the deep interior mixing ratio before the condensed phase does.
Conversely, an ocean surface will result if the condensed phase reaches the deep interior mixing ratio
before the gas phase does.
To understand liquid water oceans on Neptune, it is helpful to consider an idealized model of the
Earth’s ocean/atmosphere system. In equilibrium, the concentration of dry air (mostly nitrogen,
oxygen, and argon) in the ocean is set by its solubility and is denoted by Xdry. Under present
conditions, Xdry is ≈ 2 × 10⁻⁵ by mass. We define the photospheric temperature Tphot as the at-
mospheric temperature at the 0.4 bar level. The atmospheric temperature and pressure follow a
pseudo-adiabat − a moist adiabatic expansion in which the condensed water is removed from the
system as soon as it forms (e.g., Emanuel 1994, Salby 1996). Although the condensate is removed,
the atmosphere is saturated at every pressure level, which means that a liquid water droplet sus-
pended in the atmosphere just above the surface has the same Xdry as the ocean itself. With these
assumptions, the values of Xdry and Tphot determine everything about the system, including the
ocean temperature Tocean and the partial pressures of water and dry air at the ocean interface. If
Tphot were to increase, the mixing ratio of water on the moist adiabat would increase. Then, for
Xdry fixed, Tocean would have to increase in order to match the increased mixing ratio of water in the
atmosphere (the Henry’s Law constant for air is a weaker function of temperature than the vapor
pressure of water is). Increasing Tocean is like moving toward the critical point from the left (low
temperature) side of Figure 5.1. Alternately, for Tocean fixed, Xdry would have to decrease. This
lowers the equilibrium partial pressure of dry air relative to water and again matches the increased
mixing ratio of water in the atmosphere.
In temperature-composition space, the boundary between the region of cloud base solutions and
the region of ocean surface solutions will be a line. We refer to this boundary as the critical ocean,
and it lies at the critical temperature for its composition. At the critical ocean, both the water

184
mixing ratios and densities will be equal between the gas and condensed phases. As in Figure 5.1,
no phase transitions are possible for temperatures higher than the critical temperature.
For a suite of ice giants with different photospheric temperatures, different deep interior water
mixing ratios, and different atmospheric gas masses, the qualitative effects on the existence of oceans
are as follows. A cooler photosphere results in a photospheric adiabat with decreased water mixing
ratio in the gas phase (and therefore increased water mixing ratio in the condensed phase) at each
pressure level. Since the condensed phase mixing ratio will reach the deep interior value before the
gas phase ratio does, the photospheric adiabat will terminate in an ocean surface. For an ice giant
with a large water mixing ratio in the interior, the condensed phase ratio will again reach the interior
value before the gas phase ratio does. This ice giant will also contain an ocean surface. As in Figure
5.1, higher-entropy photospheric adiabats terminate in cloud bases. Entropy can be increased either
by increasing the photospheric temperature or by decreasing the pressure at a given temperature.
The latter is similar to decreasing the atmospheric gas mass.
Even though we complicate the Neptune calculations by assuming van der Waals gases as well
as condensation of methane, ammonia, and hydrogen sulfide, the qualitative aspects derived above
still apply. We pin the moist adiabat at 59 K and 0.4 bar (Figure 8 in Burgdorf et al. 2003), and
we extend it downward until a phase transition is reached. We determine which of these transitions
is likely by following the photospheric adiabat until it intersects the phase transition curves of SF.
Published models of Neptune’s density structure are then compared to our density estimates.
5.2 Photospheric Adiabat
5.2.1 Construction
Because gas at the temperature and pressure of a phase transition is non-ideal, the van der Waals
relation is the basis of our model:
P =RT
V − bH2− aH2
V 2, (5.1)
where aH2 and bH2 are the molar van der Waals coefficients for hydrogen (2.45×10¹¹ erg cm3 mol−2

185
and 26.61 cm3 mol−1, respectively; see Fishbane et al. (2005)), T is the temperature, and V is the
molar volume of the water-hydrogen mixture. Quantities without subscripts, other than P , R, T ,
or V , denote water vapor.
We assume that internal heat is convected up from the deep interior of ice giants to the pho-
tosphere, at about 0.4 bar, and then radiated to space. Thus, it is reasonable to assume their
pressure-temperature profiles follow adiabats. Hydrogen and helium affect molecular mass and heat
capacity along the photospheric adiabat. Carbon, nitrogen, and sulfur are assumed to exist as
methane, ammonia, and hydrogen sulfide. We include their effect on molecular mass and heat
capacity in addition to allowing their condensation. Thus, we assume that these species are also
saturated along the photospheric adiabat. Since we do not take into account the heat capacity or
volume of the condensed phases, the photospheric, moist adiabat is similar to a pseudoadiabat.
The temperature versus molar volume profile is calculated from the following equation, which is
derived in Appendix E:
dV
dT= −
Cv +
∑i
(Li
1 + qi
)(∂qi∂T
)V
RT
V − bH2+∑i
(Li
1 + qi
)(∂qi∂V
)T
. (5.2)
The summations occur over each species i (hydrogen, helium, water vapor, methane, ammonia, and
hydrogen sulfide). Since hydrogen and helium are not condensing, their latent heats are set to zero.
R is the molar gas constant and qi is the molar mixing ratio of the condensing species to the other
five species, given by the following:
qi =fi
1− fi, (5.3)
where fi is the molar mixing ratio of species i to total gas and Li is the species’ latent heat (by mole)
of sublimation or condensation. The mixture’s molar heat capacity at constant volume is given by
Cv, which is derived in Appendix E:
Cv =∑i
Cpi − R
1− 2aH2 (V − bH2)2
RTV 3
fi (5.4)

186
for a van der Waals gas. Here, Cp is the mixture’s molar heat capacity at constant pressure (the
weighted mean, by mole, of the heat capacities of all six species).
For each species, the Cp values and latent heats of sublimation are taken from Atreya (1986).
The latent heats of vaporization for methane and ammonia are 8.519× 10¹⁰ erg mol−1 for T ≥ 90.6
K (National Institute of Standards and Technology) and 2.5 × 10¹¹ erg mol−1 for T ≥ 194.95 K
(Osborne & van Dusen 1918), respectively. The temperature dependences of L and the saturation
vapor pressure e for pure water, are taken from Wagner & Pruss (1993). Saturation vapor pressures
versus temperature for methane (Ziegler 1959), hydrogen sulfide (Giauque & Blue 1936, Vorholz et
al. 2002), and ammonia (Karwat 1924, International Critical Tables 1928) are compiled in Atreya
(1986). Latent heat and saturation vapor pressure of pure water are used because we do not have
an adequate description of how these quantities vary, as a function of water vapor mixing ratio, in
a water-hydrogen mixture. Limited data on saturation vapor pressure are indeed given in SF, so an
interpolation is required to integrate the photospheric adiabat. The accuracy of this interpolation
will be addressed later (Figure 5.2). As will be seen in section 5.4.1, the fact that latent heat goes to
zero at 647 K (the critical point for pure water) causes unphysical behavior at higher temperatures.
We attempt to remedy this by extrapolating data from T < 600 K to predict high temperature
behavior.
Temperature and volume along the photospheric adiabat translate to pressure according to the
van der Waals relation (Equation 5.1). In order to determine f , the mixing ratio of water to total
gas, we modify Equation 5.1 to describe water vapor in the gas phase: P becomes e, aH2 and bH2
become the coefficients for water (a and b), and V becomes V/f . This is because the volume per
mole of water is the volume per mole of the mixture (V ) times the moles of mixture per mole of
water (1/f). Therefore,
e =RTf
V − bf− af2
V 2. (5.5)
Here, a = 5.507 × 10¹² erg cm3 mol−2 and b = 30.4 cm3 mol−1 (Fishbane et al. 2005). Using
Equation 5.5, we find

187
300 350 400 450 500 550 6000.9
0.95
1
1.05
1.1
1.15
1.2
1.25
1.3
T (K)
V SF /
V
DataFit1σ error
Figure 5.2: Photospheric adiabat uncertainty. We sample nine (T, P, f) points along two experi-mentally determined phase boundaries (f = 10 mol-% and 40 mol-%) of SF. Using T and f for eachpoint, we calculate the volume from the photospheric adiabat using Equation 5.5. We then calculatethe volume from experiment using Equation 5.1. The ratio of these volumes gives a correction factorwhich is then applied to the photospheric adiabats slope. We assume that ideal gas conditions at273 K imply the uncertainty here to be zero.
(∂f
∂T
)V
=V 2 (V − bf)2 de
dT−RV 2f (V − bf)
RTV 3 − 2af (V − bf)2 (5.6a)
(∂f
∂V
)T
=RTV 3f − 2af2 (V − bf)2
RTV 4 − 2V af (V − bf)2 . (5.6b)
From the definition of q in Equation 5.3, we can determine the quantities(∂q
∂T
)V
and(∂q
∂V
)T
,
which are necessary for Equation 5.2.
In ice giants, the other condensable species form cloud bases above the level of significant water
condensation, and their main effect is to lower the temperature of the photospheric adiabat within
the water cloud. To make the calculations simpler, we use the ideal gas approximation for the other
condensable gases. The van der Waals constants in Equation 5.5 can be set to zero, and
ej =RTfjV
. (5.7)

188
Here, the summation index j is taken to mean methane, ammonia, and hydrogen sulfide. For
numerical integration, it is useful to formulate(∂fj∂T
)V
and(∂fj∂V
)T
in terms of fj :
(∂fj∂T
)V
=(
1ej
dejdT− 1T
)fj , (5.8a)
(∂fj∂V
)T
=fjV. (5.8b)
5.2.2 Application to Neptune
Neptune itself might not be fully mixed from photosphere to rocky core. It is possible that there
exists stable stratification in the deep interior. However, the maximum water mixing ratio along
the photospheric adiabat cannot exceed the deep interior value, because density must increase with
depth. Thus, the true water mixing ratio at the phase transition must be less than or equal to the
deep interior value. To provide our Neptune model with the most optimistic parameters for the
existence of oceans, we assume the phase transition occurs when the water mixing ratio equals the
deep interior ratio.
We tie the van der Waals, photospheric adiabat to a pressure-temperature estimate (59 K at
0.4 bar) obtained by a combination of Voyager radio occultation experiments (Lindal 1992) and
Infrared Space Observatory observations (Burgdorf et al. 2003). We hold Neptune’s helium to
hydrogen gas mole fraction at 19/81 along the photospheric adiabat and also in the deep inte-
rior (Lindal 1992). Baines et al. (1995) find a constant methane mixing ratio below the methane
cloud base of fCH4 = 2.2+0.5−0.6 mol-%. We estimate the mixing ratio of the other condensables at
their cloud bases by assuming solar values of [C]:[N]:[S] along the photospheric adiabat. Given[C][H2] = 7.96× 10⁻⁴, [N]
[H2] = 2.24× 10⁻⁴, and [S][H2] = 3.7× 10⁻⁵ in the Sun (Gautier et al. 1995), the
ammonia and hydrogen sulfide cloud bases occur when fNH3 = 0.6+0.1−0.2 mol-% and fH2S = 0.10+0.02
−0.03
mol-%.
We overlay the photospheric adiabat on the phase transition curves from Figure 2 of SF, and we
present them as Figure 5.3. The thick line is the photospheric adiabat, and the thin lines are the
curves from SF. Each pressure-temperature point between 450 K and 650 K has two phase transition
curves passing through it. Each curve is labeled with its corresponding percentage hydrogen to (wa-

189
Figure 5.3: Photospheric adiabat overlying SF phase boundaries. Phase boundaries are thin lines,and numbers on each boundary denote hydrogen to (water + hydrogen) mixing ratio. The pho-tospheric adiabat is given as the thick line and follows, for the most part, the 90 mol-% phaseboundary. However, it can be seen that the water mixing ratio in the gas phase increases along thephotospheric adiabat as temperature is increased (hydrogen mixing ratio decreases).
ter + hydrogen) molar mixing ratio, XH2. The curves with high values of XH2 give the composition
of the vapor, and the curves with low values of XH2 give the composition of the liquid when the
two phases are in equilibrium. A critical point occurs when the liquid and vapor have the same
composition, i.e., where the curve for a given composition has infinite dP/dT . It is important to
note that liquid water infused with more than about 1 mol-% hydrogen is in equilibrium with vapor
only at a higher pressure than the critical pressure for that mixture. For a given composition, then,
an ocean surface must lie at supercritical pressure.
To estimate the uncertainty in the photospheric adiabat, dV/dT from Equation 5.2, we com-
pare experimentally determined (P, T, f) data to those predicted along the photospheric adiabat.
We follow two saturated vapor to dry vapor phase boundaries of SF which correspond to f = 10
mol-% and 40 mol-% (XH2 = 90 mol-% and 60 mol-%, respectively). Note that f = X = 100
mol-% −XH2 for SF data because their system only contains water and hydrogen. Also note that
their phase boundaries are only printed for T > 450 K. Since we know T and f from SF (f is either
10 mol-% or 40 mol-%), we predict the volume along the photospheric adiabat by solving for V in

190
Equation 5.5 (saturation vapor pressure, e, is only a function of T ). Using P and T from SF, we
calculate the volume along their phase boundaries, VSF, by solving for V in Equation 5.1. The quan-
tity VSF/V is a measure of the discrepancy between the photospheric adiabat and experimental data.
Figure 5.2 shows VSF/V for nine pressure-temperature points in the temperature range 450 K
< T < 630 K. The conditions for T ≤ 273 K along the photospheric adiabat are ideal:∣∣∣∣PVRT − 1
∣∣∣∣ =
7.1% at 273 K. Since the van der Waals equation of state tends towards the ideal gas formulation
at low temperatures and pressures, we assume that VSF/V = 1 for T ≤ 273 along the photospheric
adiabat. By multiplying VSF/V by the calculated dV/dT from Equation 5.2, we can correct the
photospheric adiabat to agree with SF.
dV
dT true=VSF
V
dV
dT(5.9)
Therefore, we fit a fourth-order polynomial to VSF/V versus temperature from the nine pressure-
temperature points to provide a correction factor at each temperature. We force the value and slope
of this factor at T = 273 K to be one and zero, respectively. The dotted lines in Figure 5.2 represent
the 1σ error bounds on the fourth-order fit. The corrected, photospheric adiabat, extending from 59
K to the critical temperature of pure water (647 K), is shown as the middle, thick curve in Figure
5.4. The 1σ upper and lower bounds to the fourth-order fit are multiplied by dV/dT from Equation
5.2 to determine the 1σ upper and lower bounds to the photospheric adiabat. These error bounds
are given as the thin curves in Figure 5.4.
5.3 Phase Transition
5.3.1 Cloud Base
By assuming values for both Neptune’s photospheric temperature and its deep interior water mixing
ratio, we determine which phase transition exists. Therefore, as we integrate downward from the
59 K photosphere, the target is the deep interior mixing ratio. We estimate this value by assuming
Neptune has a deep interior ice to rock mass ratio of 3.0+0.5−2.0:1 (Podolak & Reynolds 1984, Podolak
et al. 1991) and a gas mass of 2.0+1.2−0.5 M⊕ (Gudkova et al. 1988, Hubbard et al. 1995, Podolak et

191
59 100 200 300 400 500 600 647
100
101
102
103
104
T (K)
P (b
ar)
Figure 5.4: Pressure-temperature profile along the photospheric adiabat. The van der Waals, pho-tospheric adiabat containing H2, He, water vapor, CH4, NH3, and H2S is pinned at 59 K, 0.4 barand extends to the critical temperature for pure water (647 K). The photospheric adiabat reachesthis temperature at 8.8+1.8
−3.1 kbar.
al. 2000). The above authors obtained these values by fitting density models to Neptune’s gravita-
tional harmonics which were measured during the Voyager flyby. We assume that the deep interior
[H2]:[He] value is the same as the value in the atmosphere (19/81). This will comprise the deep
interior gas mass given above. The mass and mole fraction makeup of Neptune’s deep interior gas
is shown in Table 5.1.
Since the total planetary mass is 17.14 M⊕ (Hubbard et al. 1995), the corresponding deep in-
terior ice mass is 11.4+0.6−2.1 M⊕. Since the makeup of this ice is unknown, we assume that the ratios
[C]:[N]:[O]:[S] are solar in the deep interior. The corresponding mass and mole fraction components
of Neptune’s deep interior ice are given in Table 5.1.
As can be seen from the bold value in Table 5.1, the deep interior water vapor to total gas mixing
ratio (hydrogen, helium, water, methane, ammonia, hydrogen sulfide) is finterior = 26.9+5.2−9.5 mol-%.
This means that a water vapor cloud base will be reached if the water vapor mixing ratio f reaches
finterior along the photospheric adiabat before the critical temperature is reached (see section 5.1).

192
Table 5.1: Deep Interior Mixing Ratios
Ice and gas separate Ice and gas combinedSpecies By mole By mass By mole By mass
H2 81.0% 68.1% 45.8% 10.2%He 19.0% 31.9% 10.8% 4.8%
H2O 61.7% 63.3% 26.9% 53.8%CH4 28.8% 26.3% 12.5% 22.3%NH3 8.1% 7.9% 3.5% 6.7%H2S 1.3% 2.6% 0.6% 2.2%
We have a nominal, deep interior water mixing ratio and its associated upper and lower bounds,
and we also have a nominal, photospheric adiabat with upper and lower bounds (Figure 5.4). The
combination that favors a cloud base is the low-pressure, photospheric adiabat bound paired with
the lower mixing ratio bound (finterior = 17.4 mol-%), and it reaches cloud base at 623 K and 5.0
kbar. The combination that favors a liquid ocean is the high-pressure, photospheric adiabat bound
paired with the upper mixing ratio bound (finterior = 32.1 mol-%), and a cloud base is reached at
705 K and 19.5 kbar. The nominal, photospheric adiabat paired with the nominal interior mixing
ratio (finterior = 26.9 mol-%) is our best estimate, and it reaches cloud base at 663 K and 10.7 kbar.
Therefore, the water vapor cloud base is reached at T = 663+42−41 K and P = 10.7+8.8
−5.7 kbar. These
temperatures are above 647 K, which is the critical temperature for pure water, because the mixture
consists of water and hydrogen. This will be discussed in section 5.4.1.
5.3.2 Supercritical Fluid
Below the cloud base, the atmosphere conforms to a dry (non-condensing), adiabatic gas with about
27 mol-% water vapor to total gas. The pressure-temperature profile of this dry adiabat can be found
by setting L = 0 in Equation 5.2, keeping df/dT = 0, and solving for pressure in Equation 5.1. Even-
tually, as one descends further, the gas will slowly transition into a supercritical fluid whose density
equals that of a liquid of the same composition. This supercritical fluid is not a true ocean with a
saturated vapor to liquid interface. Hot, ionic “oceans” have been predicted in Neptune’s deep inte-
rior (Atreya 1986, p. 64; Hubbard et al. 1995), and they would lie at ≈ 2,000 K (Atreya et al. 2005).

193
5.4 Ocean Requirements
5.4.1 Deep Interior Mixing Ratio
By assuming a value for Neptune’s photospheric temperature and by leaving the deep interior water
mixing ratio as a free parameter, we find the minimum deep interior water mixing ratio that will
allow an ocean to exist. This particular ocean will be a critical ocean. A critical ocean will occur if
the photospheric adiabat (in temperature-composition space) intersects the critical curve, and if the
pressure at that intersection is higher than the critical pressure for that composition (Figure 5.3 and
the text in section 5.2.2 describing it). The composition at this intersection is the minimum deep
interior mixing ratio that allows an ocean to exist. Since we only aim to examine the requirements
for a critical ocean, it is unnecessary to calculate the water mixing ratio in the condensed phase. To
determine the location of a cool ocean, however, the water mixing ratio in the condensed phase must
be calculated. This will require the mixing ratios of the other condensables to be determined in
the water-hydrogen condensate. Currently, experimental data are not sufficient for this to be done
accurately.
We extrapolate the data in Table 1 of SF (and the additional data point on page 3, column 2
of their paper) to construct the critical curve over a large temperature range, and thus to allow the
photospheric adiabat to intersect at high temperature oceans. This table lists critical temperature
and pressure for a variety of compositions. Because the photospheric adiabat utilizes f (mixing
ratio of water to total gas), we employ composition as the water to (water + hydrogen) mixing
ratio, defined as X, Thus, X + XH2 = 100 mol-%. We fit the data with piecewise cubic Hermite
polynomials because a spline fit appears unphysical. The critical curve in temperature-X space is
given as Figure 5.5, and the critical curve in pressure-X space is given as Figure 5.6.
We extrapolate the photospheric adiabat, with a spline in temperature-X space, to temperatures
higher than 647 K. This is because water-hydrogen phase transitions can occur at higher temper-
atures. Unfortunately, using all T < 647 K in this fit gives a multivalued profile. This unphysical
behavior occurs because we are forced to approximate the mixture’s latent heat and saturation vapor
pressure with the expressions given for pure water: this is invalid near 647 K. However, including
only T < 600 K in the extrapolation eliminates this problem. It is a reasonable approximation
because latent heat is fairly constant with temperature until it very quickly goes to zero near the
critical temperature. In Figure 5.7, the photospheric adiabat is given as the thick, solid curve, and

194
30 40 50 60 70 80 90 100
647
660
670
680
690
700
710
720X (mol−%)
T crit (K
)
DataHermite fit1σ error
Figure 5.5: Critical curve: temperature vs. X. Data from SF are fit by a piecewise cubic interpo-lating Hermite polynomial.
30 40 50 60 70 80 90 100
102
103
104
X (mol−%)
P crit (b
ar)
DataHermite fit1σ error
Figure 5.6: Critical curve: pressure vs. X. Data from SF are fit by a piecewise cubic interpolatingHermite polynomial.

195
10 20 30 40 50
550
600
650
700
750
800
finterior = 17% finterior = 27% finterior = 32%
X (mol−%)
T (K
)
Adiabat1σ errorExtension1σ errorCritical curve1σ errorfinterior
Figure 5.7: Minimum water mixing ratio for an ocean. The photospheric adiabat, extrapolated forT > 647 K, and the critical curve are shown. Dashed curves indicate 1σ errors on each profile. Thetwo curves intersect at X = 38.8 ± 1.4 mol-%. This represents the minimum water to (water +hydrogen) mixing ratio necessary to support an ocean under the current, 59 K Neptunian photo-sphere. Since the deep interior f corresponds to X = 32+6
−11 mol-% at an ocean, Neptune is too dryto harbor oceans.
its extension to T > 647 K is given as the solid curve. The critical curve is shown as the thin, solid
curve. Dashed curves indicate the associated 1σ errors on each curve. Finally, the vertical, dotted
lines show the range of deep interior mixing ratios assumed for Neptune.
We attempt to place upper and lower limits on the shape of the extended, photospheric adiabat,
and we acknowledge that it is a crude extrapolation. The extended, photospheric adiabat intersects
the critical curve, and therefore terminates in a critical ocean, at T = 702.1+6.1−7.3 K and X = 38.8±1.4
mol-%. When factoring in the mixing ratios of the other species, we find f = 33.0 ± 1.3 mol-%.
By extending the photospheric adiabat in pressure-temperature space, we determine the pressure of
this critical ocean to be P = 18.7+6.6−5.3 kbar. Since the critical pressure for this composition is lower
than the pressure of the critical ocean (P = 11.65+0.21−0.42 kbar, Figure 5.6), we verify that the critical
ocean is indeed liquid. An extant ocean in Neptune thus requires a deep interior water mixing ratio
of at least f = 33.0± 1.3 mol-%, but we estimate its current value to be finterior = 26.9+5.2−9.5 mol-%.
Neptune is therefore slightly too dry to harbor oceans.

196
Figure 5.8: Density along the photospheric adiabat overlying density models. The thick, linearfeature in the lower left (from 10−4 to 10−2 Mbar) represents pressure versus density along thephotospheric adiabat. 1σ error bounds are roughly the thickness of the line. The cross at about10−2 Mbar and about 1 g/cm3 shows the location of the critical ocean, under a 59 K photosphere,in pressure-density space. This figure is modified from Figure 5 of Hubbard et al. (1995), and thincurves (solid, dashed, and dot-dashed) are different density models in that paper. Numbered, dottedcurves represent adiabats from that paper labeled with varying ice mass fractions. These adiabatslie in ice giants composed only of hydrogen, helium, and ice. Note that the photospheric adiabat lieswithin the range of density models while the ocean surface is far outside them. Thus, we concludenot only that Neptune has no extant liquid water-hydrogen ocean, but also that the photosphericadiabat is consistent with Voyager data.
5.4.2 Gravitational Signature
We investigate whether the photospheric adiabat is consistent with density models of Neptune’s
interior. At each pressure level, we calculate the density by dividing molar mass by molar volume,
V . We treat molar mass as simply a mean, weighted by mixing ratio, of the molar masses of the con-
stituent species. We plot pressure against density along the photospheric adiabat as Figure 5.8, and
we overlay these results on Figure 5.5 from Hubbard et al. (1995). As can be seen, the photospheric
adiabat is consistent with density models from photosphere to cloud base. We find the 5 to 20 kbar
cloud base from section 5.3.1 has a density of 0.221+0.048−0.076 g/cm3, while density models predict 0.09
to 0.30 g/cm3. The location of the cloud base is above the density discontinuity at ≈ 100 kbar, as
expected.
We now determine whether the critical ocean is consistent with density models. To estimate the
density of the critical ocean, we ignore the contribution of all species except water and hydrogen.

197
This is because water and hydrogen dominate the vapor, and the dissolved mole fraction of the other
species should be even lower in the liquid. We use the following law of additive volumes (Hubbard
1972):
1ρmix
=n∑i=1
Mi
ρi, (5.10)
where Mi and ρi are the mass mixing ratio and density, respectively, of species i. To calculate the
densities of hydrogen and water at the surface of the 19 kbar critical ocean, we use equation of state
fits complied by Hubbard et al. (1995) from various sources. Plugging in the densities for these two
species, we find the critical ocean has a density of 0.772+0.061−0.059 g/cm3. Based on planetary density
models calculated from Voyager gravitational constraints, the density between 13 and 25 kbar (range
of pressures at the critical ocean) lies between 0.14 g/cm3 and 0.34 g/cm3 (Figure 5.8), which is
inconsistent with an ocean; the required water mixing ratio is too high. Again, Neptune is too dry
to harbor oceans.
5.4.3 Photospheric Temperature
By assuming a value for Neptune’s deep interior water mixing ratio and by leaving the photospheric
temperature as a free parameter, we aim to find the maximum photospheric temperature that will
allow an ocean to exist. Neptune is not in thermal equilibrium with the Sun’s radiation; since its
thermal emission is 2.6 times as strong as its solar heating (Hubbard et al. 1995), Neptune is slowly
cooling. As an adiabatic atmosphere cools, its entropy decreases, which moves the phase boundary
to the left in Figure 5.1. As an ice giant with a high-entropy, low-temperature cloud base cools, its
cloud base will migrate to high temperature. After further cooling of the ice giant, the cloud base will
pass through the critical point to become a liquid ocean at high temperature. Finally, the cloud base
will transition to a liquid ocean at low temperature. Thus, it is worthwhile to ask whether Neptune
will eventually cool enough to permit the existence of liquid water oceans. Since the critical point for
hydrogen gas is 33.2 K, 13.0 bar (National Institute of Standards and Technology), hydrogen gas will
begin to condense at cooler temperatures. Since we do not take hydrogen condensation into account,
we do not attempt to model ice giants cooler than 30 K at 0.4 bar. We investigate the probability
of an ocean’s existence by considering a suite of ice giants with photospheric temperatures higher
than 30 K.

198
We assume f in the ocean will equal the deep interior mole fraction, finterior = 26.9+5.2−9.5 mol-%
(see section 5.3.1). Given the atmospheric mixing ratios of the other species (see section 5.2.2),
X = 32+6−11 mol-% in the ocean. Since the cloud base mixing ratios of the other condensables are
much lower than their assumed mixing ratios in the deep interior, X in the ocean will not equal
Xinterior. From Figures 6 and 7, we find the critical point to be at 726+69−28 K and 16+12
−5 kbar for
X = 32+6−11 mol-%. We set the 0.4 bar temperature to 30 K and integrate the photospheric adiabat,
as well as its upper and lower bounds, down to 647 K. We then fit a spline to the temperature-X
profile for T < 600 K and extrapolate to higher temperatures. We find the lower, photospheric
adiabat bound reaches the lower value of X = 21 mol-% at 636 K. Since this pressure level is much
cooler than its 796 K critical temperature, the lower, photospheric adiabat bound terminates in a
cloud base. The nominal, photospheric adiabat reaches the nominal X = 32 mol-% at 707 K, which
is cooler than that pressure level’s 726 K critical temperature. Thus, the nominal, photospheric
adiabat also intersects a cloud base.
However, the upper, photospheric adiabat bound does not reach the upper value of X = 38
mol-% before its 698 K critical temperature. In fact, the upper bound to the photospheric adiabat
intersects the critical curve at 720.9+6.3−5.9 K and X = 33.26+0.54
−0.53 mol-%, which implies that it reaches
a critical ocean. The uncertainties in temperature and composition of this critical ocean are solely
due to the uncertainties of SF in measuring the critical curve. Extending the upper, photospheric
adiabat bound with a spline fit in pressure-temperature space, we find this critical ocean to lie
at 155+14−12 kbar. These calculations are probably unqualified to accurately predict a pressure this
high. However, this critical ocean certainly lies at a higher-than-critical pressure of 15.1+2.0−1.9 kbar.
Therefore, we verify that the upper, photospheric adiabat bound (pinned to a 30 K photosphere)
intersects a critical ocean.
The existence of a critical ocean under a 30 K photosphere can only occur if the actual profile
intersects the critical curve before reaching the deep interior water mixing ratio. Thus the proba-
bility of an ocean’s existence is related to the probability that Neptune’s deep interior water mixing
ratio is higher than the nominal value. The minimum value of X necessary for an ocean is the
composition at the intersection between the nominal, photospheric adiabat and the critical curve.
Assuming Gaussian statistics, this occurs at X = 33.37+0.65−0.64 mol-%, which is 0.22±0.11σ away from
the ocean’s X = 32+6−11 mol-%. Therefore, the probability of such a high water mixing ratio, and
thus the probability of a 30 K photosphere terminating in an ocean surface, is 41.5±4.2%. It should
199
50 100 150 200 250 300
10−4
10−3
10−2
10−1
100
T0.4 bar (K)
Oce
an p
roba
bility
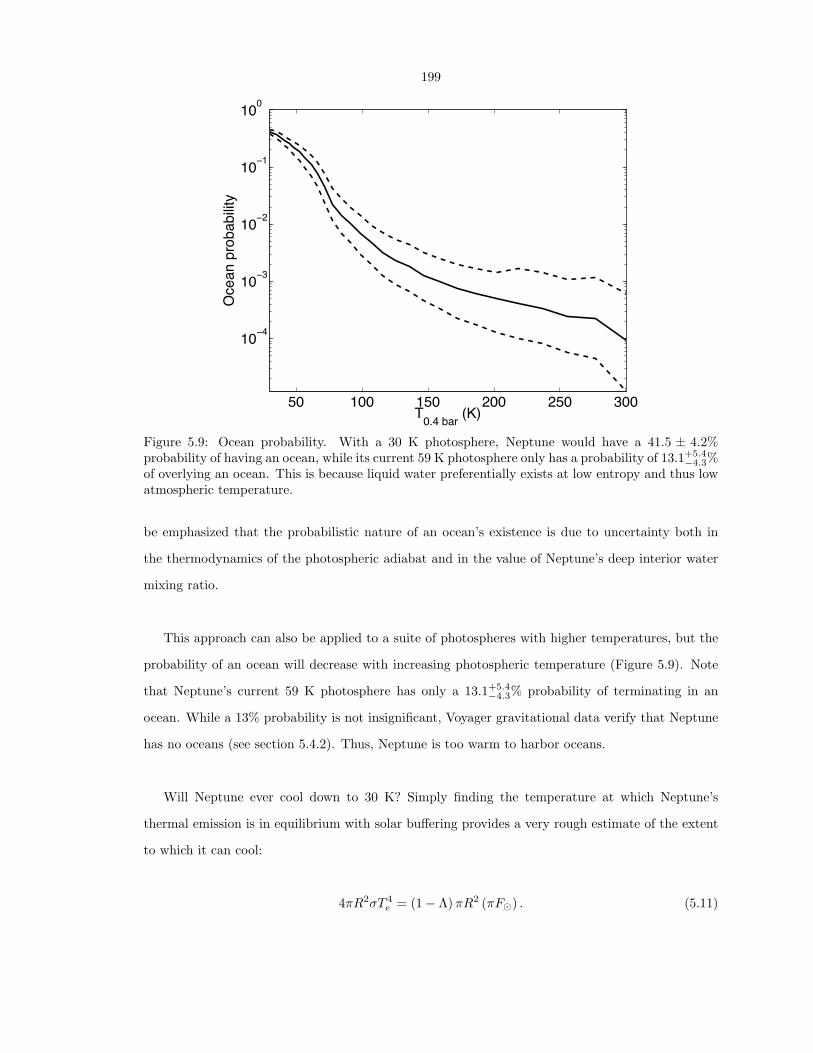
Figure 5.9: Ocean probability. With a 30 K photosphere, Neptune would have a 41.5 ± 4.2%probability of having an ocean, while its current 59 K photosphere only has a probability of 13.1+5.4
−4.3%of overlying an ocean. This is because liquid water preferentially exists at low entropy and thus lowatmospheric temperature.
be emphasized that the probabilistic nature of an ocean’s existence is due to uncertainty both in
the thermodynamics of the photospheric adiabat and in the value of Neptune’s deep interior water
mixing ratio.
This approach can also be applied to a suite of photospheres with higher temperatures, but the
probability of an ocean will decrease with increasing photospheric temperature (Figure 5.9). Note
that Neptune’s current 59 K photosphere has only a 13.1+5.4−4.3% probability of terminating in an
ocean. While a 13% probability is not insignificant, Voyager gravitational data verify that Neptune
has no oceans (see section 5.4.2). Thus, Neptune is too warm to harbor oceans.
Will Neptune ever cool down to 30 K? Simply finding the temperature at which Neptune’s
thermal emission is in equilibrium with solar buffering provides a very rough estimate of the extent
to which it can cool:
4πR2σT 4e = (1− Λ)πR2 (πF�) . (5.11)
200
Here R is planetary radius, σ is the Stefan-Boltzmann constant, Te (effective temperature) is as-
sumed to be the temperature at 0.4 bars, Λ is Bond albedo, and πF� is solar insolation. Keeping
solar luminosity and Neptune’s albedo fixed, Neptune’s 0.4 bar level cannot cool below 47 K. More-
over, the Sun will brighten continuously for about 6 billion years (reaching 1.1 L� in 1.1 Gyr and
1.4 L� in 3.5 Gyr; Sackmann et al. 1993). Thus, the maximum probability of forming oceans in
Neptune, while the Sun is on the main sequence, is the present probability (only 13.1+5.4−4.3%).
As the Sun slowly (compared to Neptune’s orbital period) loses about half its mass through the
red giant and AGB phases, Neptune’s orbit will gradually expand. Neptune will either collide with
Uranus, be ejected from the Solar System, or assume a stable orbit with roughly twice its current
semimajor axis (Debes & Sigurdsson 2002). This comes from angular momentum conservation:
LNeptune = MNeptune
√GM�aNeptune
(1− e2
Neptune
), (5.12)
where L is angular momentum, M is mass of each body, a is semimajor axis and e is eccentricity.
As a very young white dwarf, the Sun’s luminosity will be large. However, as it rapidly cools, the
Sun’s luminosity will decrease dramatically.
A collision would certainly mix Neptune’s interior water ice into its atmosphere, and the essen-
tially absent solar irradiance would allow the surviving planet to cool quickly. Significant cooling
will also occur if Neptune is ejected from the Solar System. Thus, regardless of Neptune’s eventual
state, it may be free to cool down below 30 K, where its water clouds have a 41.5± 4.2% probability
of condensing and forming oceans. Billions of years from now, after the Sun has gone, Neptune may
therefore become the only object in the Solar System with liquid water oceans.
5.5 The Water-Hydrogen-Helium System
We integrate the photospheric adiabat without methane, ammonia, and hydrogen sulfide to show
that the conclusions above are unchanged. We set the heat capacity and latent heat due to these
species to zero; therefore, this model atmosphere only contains hydrogen gas, helium, and water
vapor. In Figure 5.10, the bold, solid curve indicates the photospheric adiabat pinned at 59 K and

201
100 200 300 400 500 600
100
101
102
103
104
T (K)
P (b
ar)
CH4 cloud base
H2S cloud base
NH3 cloud base
H2O cloud baselower bound
Four condensables1σ errorOne condensable
Figure 5.10: Pressure-temperature profiles along photospheric adiabats with different condensablespecies. The solid curves represent the photospheric adiabat (and error bounds) with all speciescondensing (water, CH4, H2S, and NH3), whereas the dashed curve is a photospheric adiabat withonly water condensing. For clarity, error bounds are only shown for the adiabat with all speciescondensing. All photospheric adiabats are pinned at 59 K. Note that more condensation causes aphotospheric adiabat to run colder at depth, thus increasing the probability of an oceans existence.
Table 5.2: Cloud Bases
Species One condensable Four condensablesCH4 — 83.6+2.2
−3.1 K, 1.78+0.31−0.34 bar
H2S — 157.3+3.2−4.4 K, 14.2+2.2
−2.4 barNH3 — 215.8+6.2
−8.4 K, 43.0+8.9−9.5 bar
H2O 645+43−28 K, 6.3+5.2
−2.6 kbar 663+42−41 K, 10.7+8.8
−5.7 kbar
containing all six species. The error bounds are given as the thin, solid curves. The 59 K photo-
spheric adiabat containing only three species is shown as the bold, dashed curve. The error bounds
are left off of the three-species adiabat for clarity. Table 5.2 presents the locations of all cloud bases.
The calculation with water as the only condensable still predicts a water cloud base, as opposed
to an ocean surface, though the cloud base is now at lower temperature and pressure (from 663+42−41
K, 10.7+8.8−5.7 kbar to 645+43
−28 K, 6.3+5.2−2.6 kbar). This effect is primarily due to the lack of a methane
cloud near the photosphere, as can be seen in Figure 5.10. Clouds act to steepen dP/dT , so elimi-
nating clouds of methane and the other condensables should indeed cause the pressure at the phase

202
transition to be lower. Since a critical ocean requires the temperature to be critical and the pressure
to be supercritical, clouds of other species therefore make conditions slightly more favorable for the
existence of liquid water. Indeed, a critical ocean requires less water when clouds of many species
are present (X = 38.8 ± 1.4 mol-% and f = 33.0 ± 1.3 mol-%, see section 5.4.1) than when only
water clouds are present (X = 40.4± 1.3 mol-% and f = 35.4+1.3−1.2 mol-%).
5.6 Extrasolar Hot Neptunes
Most extrasolar planets discovered are of order one Jupiter mass and reside less than about 1 AU
from their parent stars (http://exoplanets.org); they presumably migrated many AU inward from
their sites of formation (Lin et al. 1996, Boss 1996). Neptune-mass planets that have also migrated
inward (“hot Neptunes”) are beginning to be found around other stars (Santos et al. 2004, Bonfils
et al. 2005, Udry et al. 2006, Lovis et al. 2006). It is reasonable to expect that many more will
soon be found as technological accuracy increases. We show above that while the temperature in
Neptune rapidly approaches the critical temperature with depth, the water mixing ratio reaches
the deep interior value before the critical curve is reached. This is why a cloud base is reached in
Neptune as opposed to an ocean surface. Thus, if Neptune at 30 AU is too hot to allow liquid water
oceans to exist in its interior, then hot Neptunes at less than 1 AU must be far too hot.
We present a simplified assessment of how migration affects the possibility of liquid water oceans.
We consider a family of extrasolar ice giants that have Neptune’s deep interior composition and Bond
albedo of 0.29, have saturated upper atmospheres, orbit stars of solar luminosity, have semimajor
axes between 1 AU to 50 AU, and have photospheres that are in thermal equilibrium with their
parent stars. We also assume that the atmospheres are convecting all the way down to the critical
temperature and that they equilibrate to moist adiabatic states throughout the inward migration.
We ignore any effects due to radiative zones in the ice giants. These assumptions may not stand up
to rigorous numerical calculation; however, our goal is to present an idealized description of the effect
of planetary migration on the existence of oceans. We calculate the effective planetary temperature
by balancing solar heating with thermal emission (Equation 5.11). The inner semimajor axis limit,
1 AU, is chosen because the cloud base occurs at 0.4 bars: for closer semimajor axes, no cloud base
would exist below a 0.4 bar photosphere. The outer choice of 50 AU is arbitrary.
203
2 5 10 20 50 10025
30
35
40
45
50
a (AU)
f inte
rior (m
ol−%
)
50 100150200250300
25
30
35
40
45
50
T0.4 bar (K)
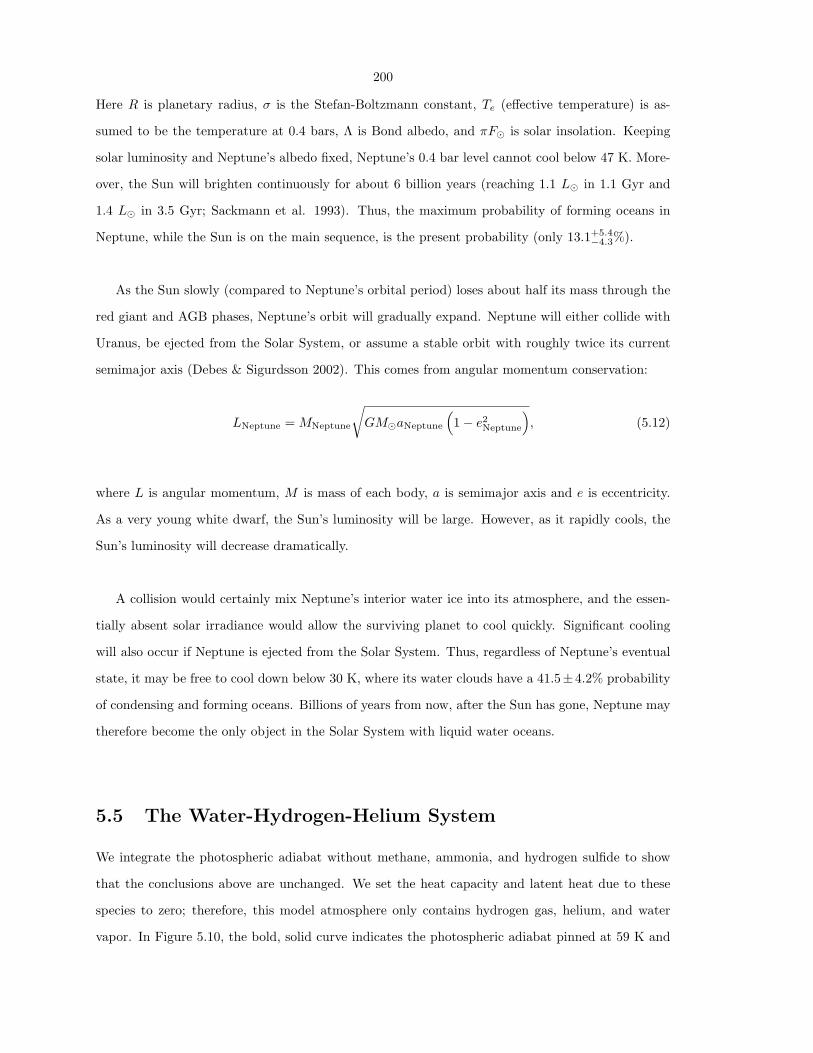
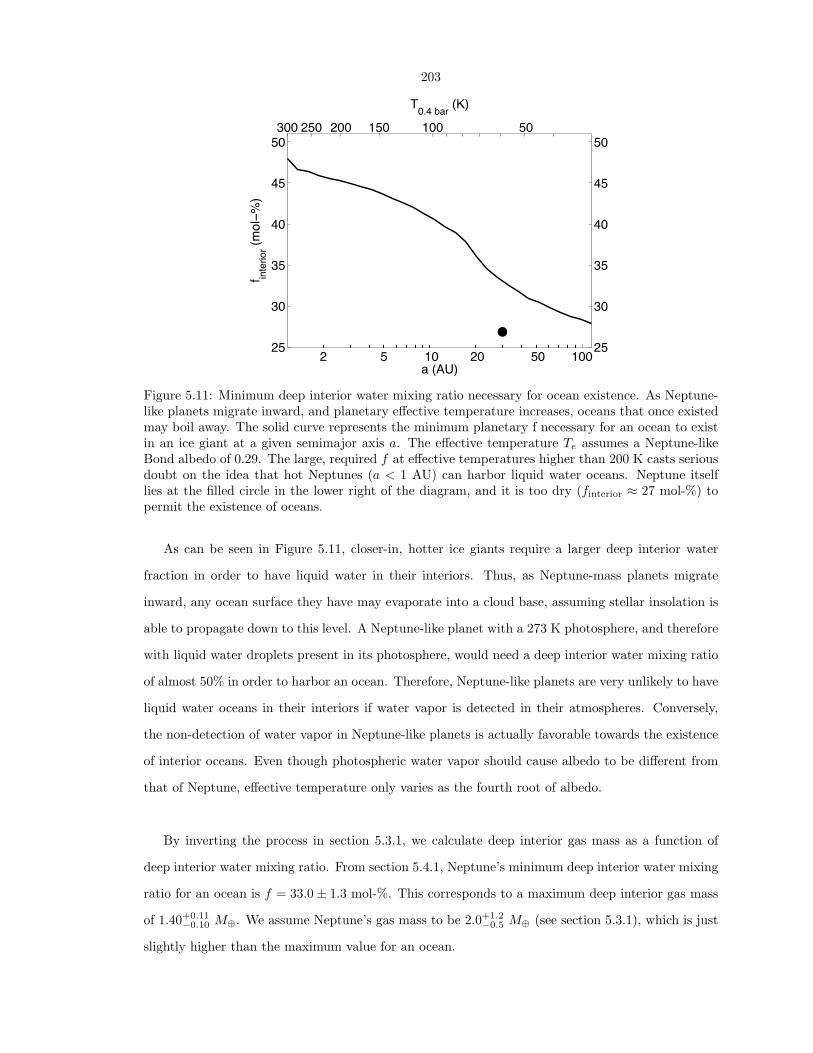
Figure 5.11: Minimum deep interior water mixing ratio necessary for ocean existence. As Neptune-like planets migrate inward, and planetary effective temperature increases, oceans that once existedmay boil away. The solid curve represents the minimum planetary f necessary for an ocean to existin an ice giant at a given semimajor axis a. The effective temperature Te assumes a Neptune-likeBond albedo of 0.29. The large, required f at effective temperatures higher than 200 K casts seriousdoubt on the idea that hot Neptunes (a < 1 AU) can harbor liquid water oceans. Neptune itselflies at the filled circle in the lower right of the diagram, and it is too dry (finterior ≈ 27 mol-%) topermit the existence of oceans.
As can be seen in Figure 5.11, closer-in, hotter ice giants require a larger deep interior water
fraction in order to have liquid water in their interiors. Thus, as Neptune-mass planets migrate
inward, any ocean surface they have may evaporate into a cloud base, assuming stellar insolation is
able to propagate down to this level. A Neptune-like planet with a 273 K photosphere, and therefore
with liquid water droplets present in its photosphere, would need a deep interior water mixing ratio
of almost 50% in order to harbor an ocean. Therefore, Neptune-like planets are very unlikely to have
liquid water oceans in their interiors if water vapor is detected in their atmospheres. Conversely,
the non-detection of water vapor in Neptune-like planets is actually favorable towards the existence
of interior oceans. Even though photospheric water vapor should cause albedo to be different from
that of Neptune, effective temperature only varies as the fourth root of albedo.
By inverting the process in section 5.3.1, we calculate deep interior gas mass as a function of
deep interior water mixing ratio. From section 5.4.1, Neptune’s minimum deep interior water mixing
ratio for an ocean is f = 33.0± 1.3 mol-%. This corresponds to a maximum deep interior gas mass
of 1.40+0.11−0.10 M⊕. We assume Neptune’s gas mass to be 2.0+1.2
−0.5 M⊕ (see section 5.3.1), which is just
slightly higher than the maximum value for an ocean.

204
If the “ocean planets” of Leger et al. (2004) have deep enough atmospheres, liquid water oceans
can exist inside them provided the deep interior has very little gas. For example, a 6 M⊕ planet
with 3 M⊕ of interior ice and a 300 K photosphere can only have an ocean if the deep interior has
less than 0.117+0.036−0.030 M⊕ of gas (f ≥ 47.9+2.9
−3.1 mol-%).
5.7 Future Work
We have used the van der Waals equation of state in this work, and we have shown it to be accurate
to only 30% in describing temperature, pressure, and composition simultaneously for T ≈ 450 K
(Figure 5.2). The next step is to continue this work using, for example, the modified Redlich-Kwong
equation of state (Redlich & Kwong 1949), which is more consistent with the phase transition curves
of SF. We would also like to see whether an ocean of density 0.8 g/cm3 descending from 19 kbar
can successfully be incorporated into models of Neptune’s density structure. To determine the con-
ditions appropriate for cool oceans, the mixing ratio along the photospheric adiabat of water in the
condensed phase must be obtained. This avenue would be useful when describing water-rich planets
with less massive atmospheres. Finally, it would be beneficial to have an accurate treatment of
Neptune’s true photosphere with age, which will of course depend on composition. This will better
address (1) whether it is possible for Neptune to cool down enough to permit liquid oceans to rain
out, and (2) the length of time before this may happen.
5.8 Conclusion
Neptune’s significant water content raises the interesting possibility that liquid water-hydrogen
oceans, with a saturated vapor to liquid interface, exist in its interior. This liquid would be in-
fused with over 60% hydrogen to (hydrogen + water) by mole. To be a true liquid, this ocean
would have to lie at a temperature lower than the critical temperature, and a pressure higher than
the critical pressure, for this composition (about 700 K and 12 kbar). There is a minimum deep
interior water mixing ratio in Neptune that allows an ocean to exist. Neptune’s deep interior ice
mass based on density models in the literature, finterior = 26.9+5.2−9.5 mol-%, is less than the minimum
required value of f = 33.0± 1.3 mol-% for a critical ocean. Indeed, we find that Neptune currently
has less than a 15% probability of harboring an ocean. The gravitational constraints confirm this

205
low probability, because an extant liquid water-hydrogen ocean would be denser than measured (0.8
g/cm3 instead of 0.1 to 0.3 g/cm3 at the ≈ 15 kbar level). Thus, Neptune is both too warm and too
dry for an ocean to exist at present. If the photosphere were to cool from its current 59 K to 30 K,
as hydrogen gas itself begins to condense out of the atmosphere, the probability of the water clouds
raining out would increase to 40%.
As the Sun ages and becomes a cool white dwarf, its buffering of Neptune’s atmosphere will
decrease significantly. Neptune may be allowed to cool sufficiently in the ensuing billions of years
for its existing water clouds to rain out. Thus, it is possible that Neptune may form liquid water
oceans many billions of years from now. While terrestrial extrasolar planets with semimajor axes
near 1 AU may have liquid water oceans on their surfaces, those oceans would freeze out for more
distant semimajor axes. However, the inner reaches of extrasolar systems are apparently too hot
for the existence of liquid water oceans in the interiors of Neptune-mass ice giants. Only the frigid
conditions at many tens of AU are suitable, if the planet is watery enough, for hydrogen-rich oceans
to lie at thousands of atmospheres of pressure.
References
Atreya, S. K., 1986, Atmospheres and Ionospheres of the Outer Planets and their Satellites. Springer-
Verlag, New York.
Atreya, S. K., Egeler, P. A., & Wong, A. S. 2005, Amer. Geophys. Union, Fall Meeting, P11A-0088
(abstract).
Bonfils, X., Forveille, T., Delfosse, X., Udry, S., Mayor, M., Perrier, C., Bouchy, F., Pepe, F., Queloz,
D., & Bertaux, J.-L. 2005, A&A 443, L15.
Boss, A. P. 1996, Lunar. Planet. Sci. XXVII, 139 (abstract).
Burgdorf, M., Orton, G. S., Davis, G. R., Sidher, S. D., Feuchtgruber, H., Griffin, M. J., & Swinyard,
B. M. 2003, Icarus 164, 244.
Debes, J. H. & Sigurdsson, S. 2002, ApJ 572, 556.
Emanuel, K. A. 1994, Atmospheric Convection. Oxford University Press, New York.

206
Fishbane, P. M., Gasiorowicz, S. G., & Thornton, S. T., 2005, Physics for Scientists and Engineers.
Prentice-Hall, Upper Saddle River.
Gautier, D., Conrath, B. J., Owen, T., de Pater, I., & Atreya, S. K. 1995, in Neptune and Triton,
ed. D. P. Cruikshank. University of Arizona Press, Tucson, p. 547.
Giauque, W. F., & Blue, R. W. 1936, J. Am. Chem. Soc. 58, 831.
Hubbard, W. B. 1972, ApJ 176, 525.
Hubbard, W. B., Podolak, M., & Stevenson, D. J. 1995, in Neptune and Triton, ed. D. P. Cruikshank.
University of Arizona Press, Tucson, p. 109.
Hubbard, W. B. 1999, in The New Solar System, eds. J. K. Beatty, C. C. Petersen, & A. Chaikin.
Sky Publishing Co., Cambridge, MA, p. 193.
International Critical Tables. 1928. McGraw-Hill Book, New York.
Karwat, E. 1924. Z. Phys. Chem. St’ochiomet. Verwandtschaftsr. 112, 486.
Leger, A., Selsis, F., Sotin, C., Guillot, T., Despois, D., Mawet, D., Ollivier, M., Labeque, A.,
Valette, C., Brachet, F., Chazelas, B., & Lammer, H. 2004, Icarus 169, 499.
Lin, D. N. C., Bodenheimer, P., & Richardson, D. C. 1996, Nature 380, 606.
Lindal, G. F. 1992, AJ, 103, 967.
Lodders, K. & Fegley, B., Jr. 1994, Icarus 112, 368.
Lovis, C., Mayor, M., Francesco, P., Yann, A., Benz, W., Bouchy, F., Correia, A. C. M., Laskar, J.,
Mordasini, C., Queloz, D., Santos, N. C., Udry, S., Bertaux, J.-L., & Sivan, J.-P. 2006, Nature
441, 305.
Marley, M. S., Gomez, P., & Podolak, M. 1995, J. Geophys. Res. 100, 23349.
National Institute of Standards and Technology: http://webbook.nist.gov/chemistry/name-ser.html
Osborne, N. S. & van Dusen, M. S. 1918, J. Am. Chem. Soc. 40, A14.
Podolak, M. & Reynolds, R. T. 1984, Icarus 57, 102.
Podolak, M., Hubbard, W. B., & Stevenson, D. J. 1991, in Uranus, eds. J. Bergstralh, E. Minor, &
M. S. Matthews. University of Arizona Press, Tucson, p. 29.
Podolak, M., Podolak, J. I., & Marley, M. S. 2000, Planet. Space Sci. 48, 143.

207
Redlich, O. & Kwong, J. N. S. 1949, Chem. Rev. 44, 233.
Sackmann, I.-J., Boothroyd, A. I., & Kraemer, K. E. 1993, ApJ 418, 457.
Salby, M. L. 1996, Atmospheric Physics. Academic Press, San Diego.
Santos, N. C., Bouchy, F., Mayor, M., Pepe, F., Queloz, D., Udry, S., Lovis, C., Bazot, M., Benz,
W., Bertaux, J.-L., Lo Curto, G., Delfosse, X., Mordasini, C., Naef, D., Sivan, J.-P., & Vauclair,
S. 2004, A&A 426, L19.
Seward, T. M. & Franck, E. U. 1981, Ber. Bunsen Phys. Chem. 85, 2 (SF).
Stanley, S. & Bloxham, J. 2004, Nature 428, 151.
Udry, S., Mayor, M., Benz, W., Bertaux, J.-L., Bouchy, F., Lovis, C., Mordasini, C., Pepe, F.,
Queloz, D., & Sivan, J.-P. 2006, A&A 447, 361.
Vorholz, J., Rumpf, B., & Maurer, G. 2002, Phys. Chem. Chem. Phys. 4, 4449.
Wagner, W. & Pruss, A. 1993, J. Phys. Chem. Ref. Data 22, 783.
Zemansky, M. W. 1957, Heat and Thermodynamics. McGraw-Hill Book Company, Inc., New York.
Ziegler, W. T. 1959, Natl. Bur. Stand. Tech. Notes 6038, Washington, DC.

208
5.9 Appendix E: Moist Adiabat
To derive the equation for dV/dT , we note the following thermodynamic equations:
TdS = CvdT + T
(∂P
∂T
)V
dV (Zemansky 1957, p. 245), and (E1)
TdS = CpdT − T(∂V
∂T
)P
dP (Zemansky 1957, p. 246). (E2)
Therefore,
Cp − Cv = −T(∂V
∂T
)2
P
(∂P
∂V
)T
(Zemansky 1957, p. 251). (E3)
Evaluate Equation E3 for the van der Waals equation of state (with a and b coefficients for hydrogen
gas) by taking the partial derivative of Equation 5.1 with respect to V at constant P:
(∂V
∂T
)−1
P
R
V − bH2− RT
(V − bH2)2 +2aH2
V 3= 0 (E4)
(∂V
∂T
)P
=
R
V − bH2
RT
(V − bH2)2 −2aH2
V 3
(E5)
(∂P
∂V
)T
= − RT
(V − bH2)2 +2aH2
V 3, so (E6)
Cp − Cv =R2T 2
T (V − bH2)2
1RT
(V − bH2)2 −2aH2
V 3
. Thus, (E7)
Cp − Cv =R
1− 2aH2 (V − bH2)2
RTV 3
, (E8)
which is the same as Equation 5.4 for one species. Adding latent heat to Equation E1, we find

209
TdS = CvdT + T
(∂P
∂T
)V
dV +∑i
(1− fi)Lidqi = 0, (E9)
where the factor (1− fi) converts to “per moles of mixture”. From the definition of qi in Equation
5.3, we see that
1− fi =1
1 + qi. (E10)
Rearranging terms,
[Cv +
∑i
(Li
1 + qi
)(∂qi∂T
)V
]dT +
[T
(∂P
∂T
)V
+∑i
(Li
1 + qi
)(∂qi∂V
)T
]dV = 0, but (E11)
T
(∂P
∂T
)V
=RT
V − bH2(E12)
for a van der Waals equation of state. Thus,
(dV
dT
)S
= −
Cv +
∑i
(Li
1 + qi
)(∂qi∂T
)V
RT
V − bH2+∑i
(Li
1 + qi
)(∂qi∂V
)T
. (E13)