Embed Size (px)
Citation preview
ElectronicallyReprinted from
July 2011
www.che.com
Crysta
llizers • Ho
t aC
id H
eat exC
Ha
ng
ers V
ol. 118 n
o. 7 ju
ly 2011
7
Focus on Valves and Actuators
Liquid-Gas Coalescers
Inspecting Fractionation Towers
High-Purity Piping
Hydrometallurgy
Absorbents for Spills
Facts at Your Fingertips: Gas-Liquid Mixing
Page 28
Page 34
Heat Exchangers
for Hot Acids
Engineers working in the chemical process industries (CPI) some-times have to deal with aerosol contamination issues in which
liquid-gas coalescers are routinely employed. For example, liquid-gas co-alescers are used to protect compres-sors, liquid-gas contactors, turbines, low-NOx burners, metering and in-strumentation stations, and for many other applications.
Choosing the right coalescer type can be a confusing task as many of the equipment-supplier claims can be difficult to understand without more background information on how the products are rated. This article sup-plies this information and explains how the commonly used rating pro-cedures can affect the performance claims output.
For evaluating a coalescer efficiency rating, it is important to have the test procedure specified and consider the different test options, as they will affect the rating. Furthermore, the same coalescer can give different per-formance ratings depending on the test method used.
This article compares the differ-ent test methods commonly used to rate liquid-gas coalescers, includ-ing the DOP [1], sodium chloride [2], ANSI/CAGI [3] and the liquid aerosol separation efficiency (LASE) test [4]. A review of how vertical liquid-gas coalescers operate is also presented, including key model features of media velocity and annular velocity as they pertain to test conditions.
Both the DOP and the sodium chlo-ride methods provide information only on the media capture efficiency and do
not take into account many of the fac-tors associated with how a liquid-gas coalescer operates. The ANSI/CAGI test is a marked improvement oper-ating under oil-saturated conditions, with a poly disperse inlet particle size distribution. The LASE test takes the evaluation to a further degree by in-creasing the “challenge” load (inlet concentration) to > 1,000 ppm, and also taking into account the annular velocity and using a full flow sampler to eliminate any side stream bias.
CoALESCER bASICSAs mentioned above, there are a num-ber of methods that have been applied to evaluating liquid-gas coalescers in a laboratory setting. In order to un-derstand how the test procedures af-fect the performance ratings, it is first necessary to have an understanding of how liquid coalescers operate.
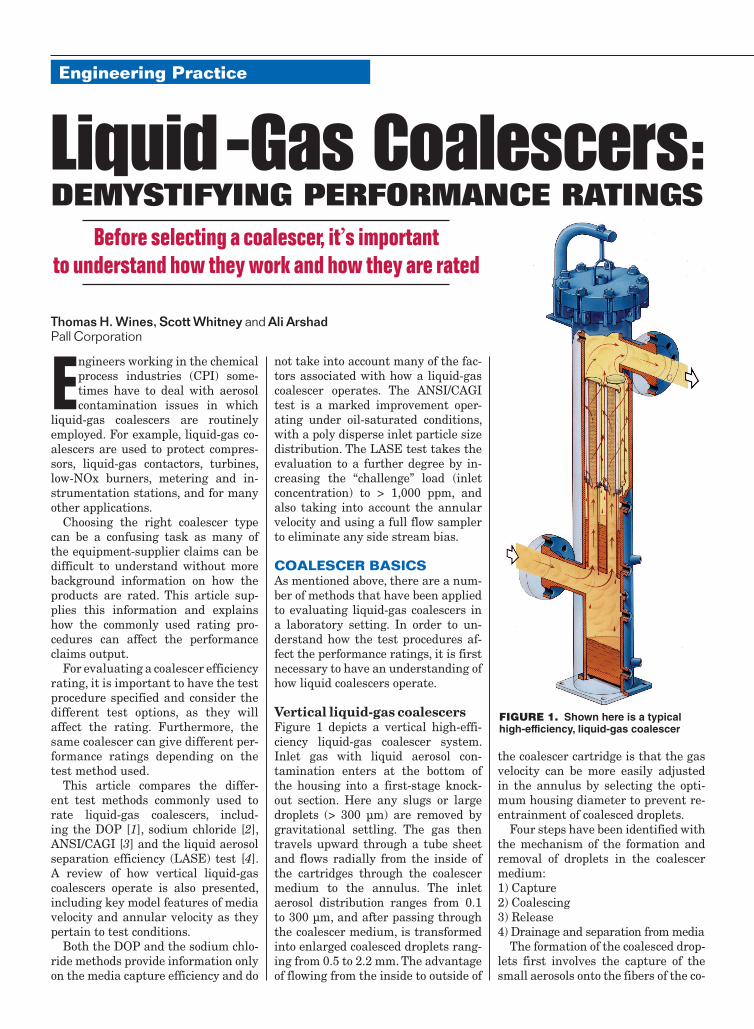
Vertical liquid-gas coalescersFigure 1 depicts a vertical high-effi-ciency liquid-gas coalescer system. Inlet gas with liquid aerosol con-tamination enters at the bottom of the housing into a first-stage knock-out section. Here any slugs or large droplets (> 300 µm) are removed by gravitational settling. The gas then travels upward through a tube sheet and flows radially from the inside of the cartridges through the coalescer medium to the annulus. The inlet aerosol distribution ranges from 0.1 to 300 µm, and after passing through the coalescer medium, is transformed into enlarged coalesced droplets rang-ing from 0.5 to 2.2 mm. The advantage of flowing from the inside to outside of
the coalescer cartridge is that the gas velocity can be more easily adjusted in the annulus by selecting the opti-mum housing diameter to prevent re-entrainment of coalesced droplets.
Four steps have been identified with the mechanism of the formation and removal of droplets in the coalescer medium:1) Capture2) Coalescing3) Release4) Drainage and separation from media
The formation of the coalesced drop-lets first involves the capture of the small aerosols onto the fibers of the co-
Feature ReportEngineering Practice
Thomas H. Wines, Scott Whitney and Ali ArshadPall Corporation
Before selecting a coalescer, it’s important to understand how they work and how they are rated
Figure 1. Shown here is a typical high-efficiency, liquid-gas coalescer
Liquid-Gas Coalescers:Demystifying Performance ratings
alescer medium. The actual coalescing or merging of the fine droplets is be-lieved to take place on the fibers, and especially at fiber intersections. The coalesced droplets are then released from the fiber due to the drag force of the gas flow exceeding the adsorp-tion energy. This process is repeated through the depth of the coalescer medium until the coalescing process is completed and the largest possible, stable droplet size is achieved. Dur-ing the coalescing stages, the growing droplets are also draining downward inside the media pack due to the force of gravity.Surface treatment. One way to im-prove the draining of the coalesced liquid drops in the medium is to apply a surface treatment that changes the medium’s wetting properties by low-ering the overall surface energy. This ensures that both oil and aqueous drops will not wet the surfaces and hence will have lower liquid-fiber at-traction forces, thereby allowing bet-ter drainage.
Modeling the vertical coalescerThe modeling of the vertical liquid-gas coalescer system can be divided into two basic aspects for performance: media velocity and annular velocity. Media velocity. The media velocity (vmed) is defined as the actual flowrate divided by the coalescer filter area:
vmed = Qa/NAmed (1)
Where: Qa = actual system flowrate (at sys-tem conditions)N = number of coalescersAmed = media area for one coalescerQa is obtained from the standard sys-tem flowrate, Qs:
Qa= QsSgrair,stp/rg (2)
Where: Sg = gas specific gravity rair,stp = density of air at standard temperature and pressurerg = density of gas at system conditions
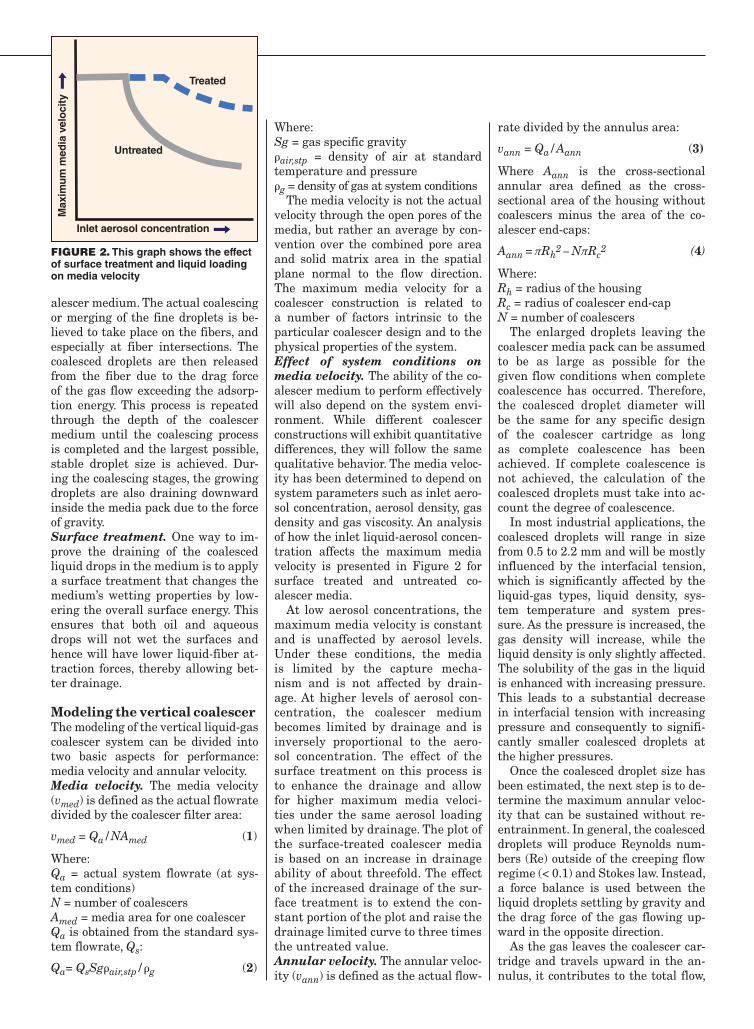
The media velocity is not the actual velocity through the open pores of the media, but rather an average by con-vention over the combined pore area and solid matrix area in the spatial plane normal to the flow direction. The maximum media velocity for a coalescer construction is related to a number of factors intrinsic to the particular coalescer design and to the physical properties of the system.Effect of system conditions on media velocity. The ability of the co-alescer medium to perform effectively will also depend on the system envi-ronment. While different coalescer constructions will exhibit quantitative differences, they will follow the same qualitative behavior. The media veloc-ity has been determined to depend on system parameters such as inlet aero-sol concentration, aerosol density, gas density and gas viscosity. An analysis of how the inlet liquid-aerosol concen-tration affects the maximum media velocity is presented in Figure 2 for surface treated and untreated co-alescer media.
At low aerosol concentrations, the maximum media velocity is constant and is unaffected by aerosol levels. Under these conditions, the media is limited by the capture mecha-nism and is not affected by drain-age. At higher levels of aerosol con-centration, the coalescer medium becomes limited by drainage and is inversely proportional to the aero-sol concentration. The effect of the surface treatment on this process is to enhance the drainage and allow for higher maximum media veloci-ties under the same aerosol loading when limited by drainage. The plot of the surface-treated coalescer media is based on an increase in drainage ability of about threefold. The effect of the increased drainage of the sur-face treatment is to extend the con-stant portion of the plot and raise the drainage limited curve to three times the untreated value. Annular velocity. The annular veloc-ity (vann) is defined as the actual flow-
rate divided by the annulus area:
vann = Qa/Aann (3)
Where Aann is the cross-sectional annular area defined as the cross-sectional area of the housing without coalescers minus the area of the co-alescer end-caps:
Aann = πRh2 – NπRc
2 (4)
Where: Rh = radius of the housingRc = radius of coalescer end-capN = number of coalescers
The enlarged droplets leaving the coalescer media pack can be assumed to be as large as possible for the given flow conditions when complete coalescence has occurred. Therefore, the coalesced droplet diameter will be the same for any specific design of the coalescer cartridge as long as complete coalescence has been achieved. If complete coalescence is not achieved, the calculation of the coalesced droplets must take into ac-count the degree of coalescence.
In most industrial applications, the coalesced droplets will range in size from 0.5 to 2.2 mm and will be mostly influenced by the interfacial tension, which is significantly affected by the liquid-gas types, liquid density, sys-tem temperature and system pres-sure. As the pressure is increased, the gas density will increase, while the liquid density is only slightly affected. The solubility of the gas in the liquid is enhanced with increasing pressure. This leads to a substantial decrease in interfacial tension with increasing pressure and consequently to signifi-cantly smaller coalesced droplets at the higher pressures.
Once the coalesced droplet size has been estimated, the next step is to de-termine the maximum annular veloc-ity that can be sustained without re-entrainment. In general, the coalesced droplets will produce Reynolds num-bers (Re) outside of the creeping flow regime (< 0.1) and Stokes law. Instead, a force balance is used between the liquid droplets settling by gravity and the drag force of the gas flowing up-ward in the opposite direction.
As the gas leaves the coalescer car-tridge and travels upward in the an-nulus, it contributes to the total flow,
Inlet aerosol concentration
Untreated
Treated
Max
imu
m m
edia
vel
oci
ty
Liquid-Gas Coalescers:Demystifying Performance ratings
Figure 2. This graph shows the effect of surface treatment and liquid loading on media velocity
Engineering Practice
thereby increasing the annular veloc-ity. The annular velocity is modeled as a linear function with vertical dis-tance, and the annular velocity is zero at the bottom of the cartridge and in-creases to a maximum value at the top of the cartridge.
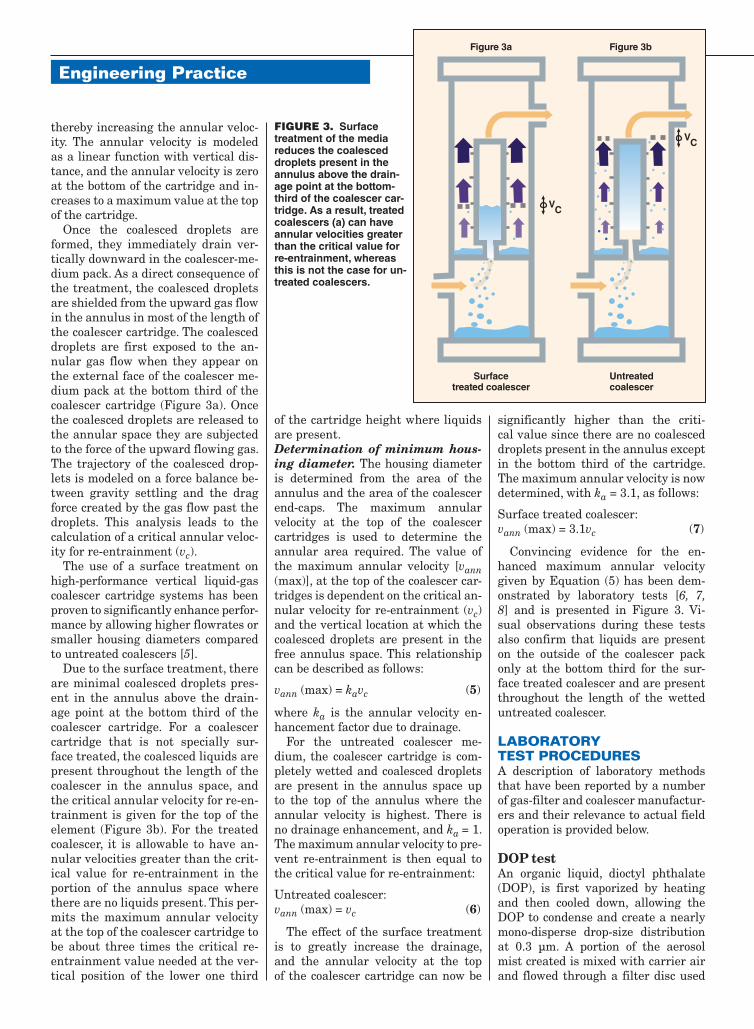
Once the coalesced droplets are formed, they immediately drain ver-tically downward in the coalescer-me-dium pack. As a direct consequence of the treatment, the coalesced droplets are shielded from the upward gas flow in the annulus in most of the length of the coalescer cartridge. The coalesced droplets are first exposed to the an-nular gas flow when they appear on the external face of the coalescer me-dium pack at the bottom third of the coalescer cartridge (Figure 3a). Once the coalesced droplets are released to the annular space they are subjected to the force of the upward flowing gas. The trajectory of the coalesced drop-lets is modeled on a force balance be-tween gravity settling and the drag force created by the gas flow past the droplets. This analysis leads to the calculation of a critical annular veloc-ity for re-entrainment (vc).
The use of a surface treatment on high-performance vertical liquid-gas coalescer cartridge systems has been proven to significantly enhance perfor-mance by allowing higher flowrates or smaller housing diameters compared to untreated coalescers [5].
Due to the surface treatment, there are minimal coalesced droplets pres-ent in the annulus above the drain-age point at the bottom third of the coalescer cartridge. For a coalescer cartridge that is not specially sur-face treated, the coalesced liquids are present throughout the length of the coalescer in the annulus space, and the critical annular velocity for re-en-trainment is given for the top of the element (Figure 3b). For the treated coalescer, it is allowable to have an-nular velocities greater than the crit-ical value for re-entrainment in the portion of the annulus space where there are no liquids present. This per-mits the maximum annular velocity at the top of the coalescer cartridge to be about three times the critical re-entrainment value needed at the ver-tical position of the lower one third
of the cartridge height where liquids are present.Determination of minimum hous-ing diameter. The housing diameter is determined from the area of the annulus and the area of the coalescer end-caps. The maximum annular velocity at the top of the coalescer cartridges is used to determine the annular area required. The value of the maximum annular velocity [vann (max)], at the top of the coalescer car-tridges is dependent on the critical an-nular velocity for re-entrainment (vc) and the vertical location at which the coalesced droplets are present in the free annulus space. This relationship can be described as follows:
vann (max) = kavc (5)
where ka is the annular velocity en-hancement factor due to drainage.
For the untreated coalescer me-dium, the coalescer cartridge is com-pletely wetted and coalesced droplets are present in the annulus space up to the top of the annulus where the annular velocity is highest. There is no drainage enhancement, and ka = 1. The maximum annular velocity to pre-vent re-entrainment is then equal to the critical value for re-entrainment:
Untreated coalescer: vann (max) = vc (6)
The effect of the surface treatment is to greatly increase the drainage, and the annular velocity at the top of the coalescer cartridge can now be
significantly higher than the criti-cal value since there are no coalesced droplets present in the annulus except in the bottom third of the cartridge. The maximum annular velocity is now determined, with ka = 3.1, as follows:
Surface treated coalescer: vann (max) = 3.1vc (7)
Convincing evidence for the en-hanced maximum annular velocity given by Equation (5) has been dem-onstrated by laboratory tests [6, 7, 8] and is presented in Figure 3. Vi-sual observations during these tests also confirm that liquids are present on the outside of the coalescer pack only at the bottom third for the sur-face treated coalescer and are present throughout the length of the wetted untreated coalescer.
LAboRAToRY TEST PRoCEduRESA description of laboratory methods that have been reported by a number of gas-filter and coalescer manufactur-ers and their relevance to actual field operation is provided below.
DOP testAn organic liquid, dioctyl phthalate (DOP), is first vaporized by heating and then cooled down, allowing the DOP to condense and create a nearly mono-disperse drop-size distribution at 0.3 µm. A portion of the aerosol mist created is mixed with carrier air and flowed through a filter disc used
VC
VC
Surfacetreated coalescer
Figure 3a Figure 3b
Untreatedcoalescer
Figure 3. Surface treatment of the media reduces the coalesced droplets present in the annulus above the drain-age point at the bottom-third of the coalescer car-tridge. As a result, treated coalescers (a) can have annular velocities greater than the critical value for re-entrainment, whereas this is not the case for un-treated coalescers.

as the test sample at a controlled flow-rate with an aerosol concentration of 100 ± 20 µg/L (~ 77 ppm). Typically, the test sample is a filter disc with an area of 100 cm2 and is challenged at a flowrate of 32 L/min. The inlet and outlet of the test sample is analyzed for aerosol content using a forward light-scattering photometer.
The test is run on clean, dry filter samples and at minimal pressure to assure sufficient flow with the outlet at atmospheric pressure. Results are measured as percent penetration on a scale setting of down to 0.001% or even to 0.0001%. Values are commonly reported as percent removal at 0.3 µm, with percent removal equal to one minus the percent penetration.Advantages. The DOP test is an in-dustry standard used for rating high-efficiency particulate air (HEPA) fil-ters, and standard test equipment is readily available. The test is a reliable and useful way to evaluate the cap-ture efficiency of a filter media under initial use conditions.Disadvantages. The test conditions are not representative of field condi-tions. The aerosol pressure is very low, and the challenge aerosol concentra-tion is below that of many typical field applications. The aerosol challenge is also nearly mono disperse and uses a different liquid than would be encoun-tered in actual service. The test is run with a clean and dry filter in service. Also the test sample is a filter disc,
and this is not always a good simula-tion of a coalescer cartridge that can contain pleated media and outer wrap materials. Lastly, the test is not mea-suring a saturated media that would be expected for a liquid-gas coalescer in service.
Sodium chloride testAn aerosol challenge is created by atomizing a sodium chloride solution into a clean, dry filtered air stream. The water carrying the sodium chlo-ride is vaporized, leaving behind solid salt crystals. The salt particle-size dis-tribution can be varied in a controlled manner by adjusting the sodium-chlo-ride solution strength, the pressure and the air flowrate. The aerosol chal-lenge is passed through a test filter disc (typically 90-mm dia.) used as the test sample.
The test flowrate is adjustable and field-service gas fluxrates are typi-cally used. An isokinetic probe is used to draw off a controlled portion of the aerosol stream and pass it to a laser particle counter. The concentration of the aerosol stream is maintained above 106 particles per cubic meter and both inlet and outlet air streams are evaluated for particle counts.Advantages. The sodium chloride test allows for the use of an aerosol challenge that has a varied particle-size-distribution range similar to that encountered under field conditions. The flow per filter area is adjustable
and is typically run at conditions simi-lar to actual field use. The test appa-ratus includes laser particle counters that have improved accuracy over the light scattering methods used in the DOP test. This method has found wide acceptance in many industries, includ-ing the microelectronics field, and is a reliable and useful way to evaluate the capture efficiency of a filter media under initial use conditions.Disadvantages. The test conditions are not representative of field condi-tions. The aerosol pressure is very low, and the challenge aerosol is made up of only solid particles. The test is also run with a clean and dry filter in service. Also, the test sample is a fil-ter disc, and this is not always a good simulation of a coalescer cartridge that can contain pleated media and outer wrap materials. Lastly, the test is not measuring a saturated media that would be expected for a liquid-gas coalescer in service.
LASE testThe efficiency of liquid-gas coalescers is measured using a test stand config-ured as shown in Figure 4. The test stand utilizes an assembly consisting of a standard size element installed in a housing of a standard inside di-ameter. An oil aerosol challenge is generated upstream of the element using an ultrasonic spray nozzle. Per-formance measurements are taken only after the coalescer assembly dif-ferential pressure and sump drainage rate have stabilized, that is, reached equilibrium. The test flowrate is ad-justed up to the rated flow of the test coalescer and the annular velocity is also adjusted to representative field conditions by adjusting the test hous-ing diameter.
The removal efficiency of the co-alescer is determined by installing a full flow sampler at the outlet of the coalescer assembly. The reason for employing the full flow sampler is to eliminate sampling biases and ensure that all of the downstream oil, both en-trained and wall flow, is captured and accounted for. An extraction and ana-lytical analysis are then performed on the full flow sampler to determine the amount of oil that was collected dur-ing the test.
Oil and air injector nozzle
3
Inlet airball valve
(from manifold)
Rotometer inlet air regulator
Air rotometer (300 SCFM)
Rotometer pressure gauge
Oil reservoir air regulator
Inlet air regulator
Inlet air control valve
Thermocouple
Inlet air pressure gauge
Measuring section
Coalescer test housing
Full flow samplerGlobe valve
Oil reservoir
Oil rotometer
Oil challenge air rotometer
Oil drain sump
Figure 4. The schematic of the liquid aerosol separation efficiency (LASE) test
Engineering Practice
General description of the test stand. The test stand is supplied with dry air that is prefiltered and coalesced to eliminate any back-ground dirt or liquid aerosols. The oil is supplied to the atomizing noz-zle via a pressurized oil reservoir, and the coalesced oil is collected in a sump and measured. It is impor-tant to measure the incremental amount of oil that is drained from the coalescer housing throughout the duration of the test. These data are used to determine the actual liq-uid challenge. Actual system flow-rates are monitored and controlled by a regulating valve, and the flowrate is measured with a calibrated rotom-eter. System pressure, temperature, and differential pressure across the coalescer assembly are also measured.
The inlet to the housing is through the bottom center of the housing. No settling chambers, inertial separators or other attempts to precondition or remove oil challenge before contact with the element is permitted. The minimum air velocity between the at-omizing nozzle and the test element inlet, including all parts of the hous-ing, is 80 ft/s minimum (24.38 m/s). Aerosol generation. A liquid loading system utilizing an ultrasonic spray nozzle is used to generate the aero-sols. The oil used for this evaluation is Mobil Corp.’s DTE – 24 lube oil.
The quantity of aerosol (by mass) and size distribution produced by the nozzle depends on the flowrate through the nozzle and the physi-cal properties of the medium being sparged. The varying sized aerosols generated by this system (0.1–1.0 µm) are considered to be representative of what would be typically found in the aftercooler exhaust air from a recipro-cating compressor.Full flow sampler. The full flow sam-pler is an inline design and contains a flat sheet, non-corrugated Teflon mem-brane having a removal rating of at least 0.45 µm and a minimum effective area of 0.26 ft2 (0.025 m2). The sam-pler has a baffle plate to guard against direct impingement of oil droplets onto the medium and to provide a uniform flow across the membrane disc. It also has a surface finish, material of con-struction and design that allow proper
extraction and clean up. The inlet and outlet are equipped with Triclover fit-tings to facilitate installation and de-mounting. These fittings are sealed when not in use and during extraction procedures to avoid contamination. Sampler extraction and analysis method. After a test run, the down-stream sampling membranes are ex-tracted by laboratory-grade hexane. A pre-weighed quantity of each solvent is introduced into the sampler and allowed to mix for a known period of time. An aliquot of the mixture is re-moved and analyzed by either an in-frared spectrophotometer when Freon is used, or gas chromatography mass spectrometer (GCMS) method when hexane is used as the extracting sol-vent. The minimum detectable oil level is 0.001 ppmw, based on air at 100°F and 100 psig. The upstream or chal-lenge aerosol concentration is deter-mined by direct gravimetric measure-ment following the saturation of the test element and stabilization of the saturated assembly differential pres-sure by measuring the sump drainage oil from the coalescer housing during the sampling period. Subsequently, the actual upstream-liquid-challenge concentration is determined by adding the downstream aerosol concentration to the sump concentration.Advantages. The LASE test allows for the use of an aerosol challenge that has a varied particle-size-distribution range similar to that encountered under field conditions. The flow per fil-ter area is specified at 100% rated flow. The test conditions are under pressure and the test coalescer is tested for ef-ficiency after it has become saturated with oil. The aerosol concentration in the challenge feed is 1,112 ppm and represents a realistic and difficult field application. The annular veloc-
ity is controlled at conditions expected under field conditions also at the max-imum velocity per the LASE sizing method as calculated for the test con-ditions. The sampling technique used is a full flow sampler, and this method allows for more accurate results than sidestream evaluation.Disadvantages. The test conditions are not completely representative of field conditions, as the test pressure is still lower than typical operating con-ditions and uses air as the carrier gas and oil as the liquid aerosol.
ANSI/CAGIThe ANSI/CAGI method follows a sim-ilar procedure and uses similar equip-ment to the LASE test as described above, with a few exceptions that are shown here:1) The aerosol challenge is much lower at 40 ppm2) The annular velocity is not adjusted to the expected industrial use3) The downstream sampling uses a sidestream method that first catches wall flow in a small vessel separator followed by a membrane samplerAdvantages. The ANSI/CAGI test allows for the use of an aerosol chal-lenge that has a varied particle-size distribution range similar to that encountered under field conditions. The flow per filter area is specified at 100% rated flow. The test conditions are under pressure and the test co-alescer is tested for efficiency after it has become saturated with oil.Disadvantages. The test conditions are not representative of field condi-tions. The aerosol pressure is lower than typical operating conditions and uses air as the carrier gas. The aerosol oil challenge is set to 40 ppm, which is lower than many field applications and makes this an easier test to get
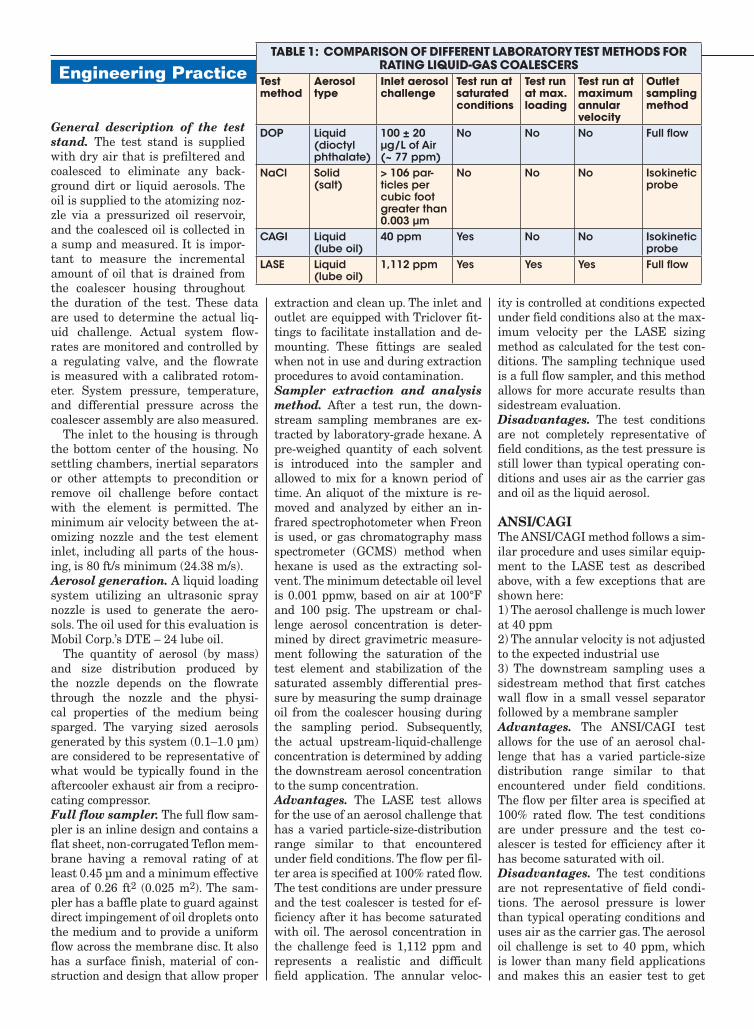
Table 1: Comparison of DifferenT laboraTory TesT meThoDs for raTing liquiD-gas CoalesCers
Test method
aerosol type
inlet aerosol challenge
Test run at saturated conditions
Test run at max. loading
Test run at maximum annular velocity
outlet sampling method
DOP Liquid (dioctyl phthalate)
100 ± 20 μg/L of Air (~ 77 ppm)
No No No Full flow
NaCl Solid (salt)
> 106 par-ticles per cubic foot greater than 0.003 μm
No No No Isokinetic probe
CAGI Liquid (lube oil)
40 ppm Yes No No Isokinetic probe
LASE Liquid (lube oil)
1,112 ppm Yes Yes Yes Full flow
high-efficiency results. The test proto-col does not specify the annular veloc-ity, and this will also enable the test to provide high-efficiency results as well. The downstream sampling method uses a wall flow collector and iso-ki-netic probe that is not as accurate as using a full flow sampling membrane.
Concluding observationsDepending on the test method used, varying efficiency ratings can be ob-tained for the same test coalescer. A comparison of the test methods dis-cussed here are presented in Table 1 along with the actual test results in Table 2 obtained using the SepraSol™
Plus liquid-gas coalescer. The DOP and sodium chloride tests
were found to provide information only on the media capture efficiency and were not taking into account many of the factors associated with how a liquid-gas coalescer operates.
The ANSI/CAGI test is a marked improvement operating under oil-sat-urated conditions, with a poly disperse inlet particle-size distribution.
The LASE test takes the evaluation
to a further degree by increasing the challenge load to > 1,000 ppm, and also taking into account the annular velocity and using a full flow sampler to eliminate any sidestream bias.
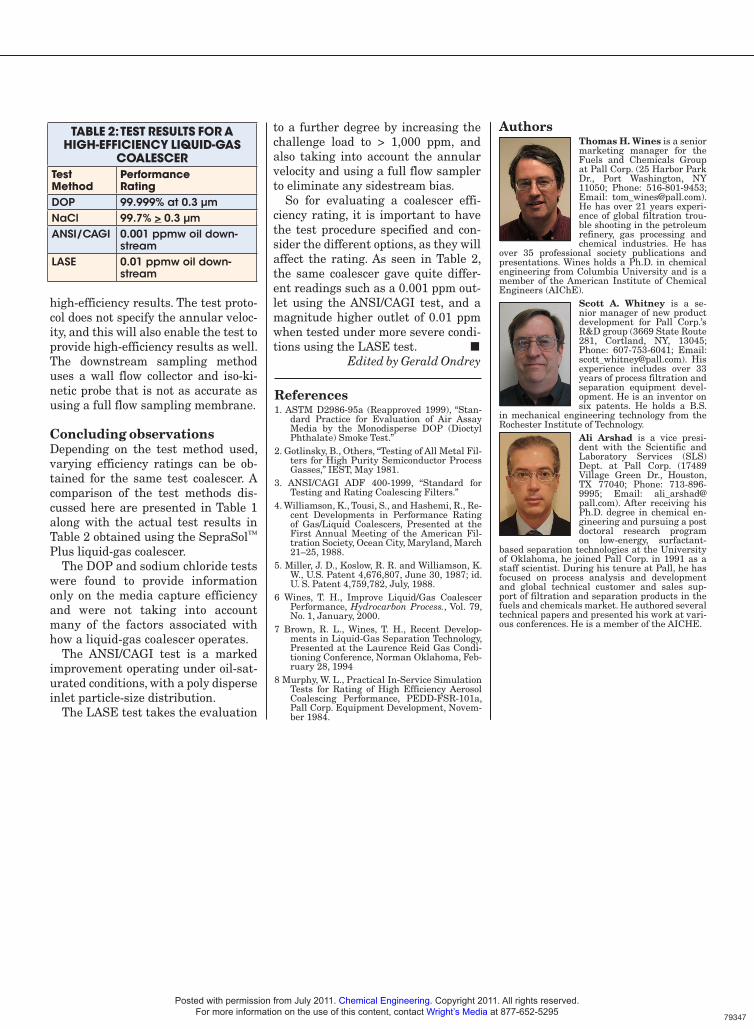
So for evaluating a coalescer effi-ciency rating, it is important to have the test procedure specified and con-sider the different options, as they will affect the rating. As seen in Table 2, the same coalescer gave quite differ-ent readings such as a 0.001 ppm out-let using the ANSI/CAGI test, and a magnitude higher outlet of 0.01 ppm when tested under more severe condi-tions using the LASE test. ■
Edited by Gerald Ondrey
Table 2: TesT resulTs for a high-effiCienCy liquiD-gas
CoalesCerTest method
performance rating
DOP 99.999% at 0.3 μmNaCl 99.7% > 0.3 μmANSI/CAGI 0.001 ppmw oil down-
streamLASE 0.01 ppmw oil down-
stream
AuthorsThomas H. Wines is a senior marketing manager for the Fuels and Chemicals Group at Pall Corp. (25 Harbor Park Dr., Port Washington, NY 11050; Phone: 516-801-9453; Email: [email protected]). He has over 21 years experi-ence of global filtration trou-ble shooting in the petroleum refinery, gas processing and chemical industries. He has
over 35 professional society publications and presentations. Wines holds a Ph.D. in chemical engineering from Columbia University and is a member of the American Institute of Chemical Engineers (AIChE).
Scott A. Whitney is a se-nior manager of new product development for Pall Corp.’s R&D group (3669 State Route 281, Cortland, NY, 13045; Phone: 607-753-6041; Email: [email protected]). His experience includes over 33 years of process filtration and separation equipment devel-opment. He is an inventor on six patents. He holds a B.S.
in mechanical engineering technology from the Rochester Institute of Technology.
Ali Arshad is a vice presi-dent with the Scientific and Laboratory Services (SLS) Dept. at Pall Corp. (17489 Village Green Dr., Houston, TX 77040; Phone: 713-896-9995; Email: [email protected]). After receiving his Ph.D. degree in chemical en-gineering and pursuing a post doctoral research program on low-energy, surfactant-
based separation technologies at the University of Oklahoma, he joined Pall Corp. in 1991 as a staff scientist. During his tenure at Pall, he has focused on process analysis and development and global technical customer and sales sup-port of filtration and separation products in the fuels and chemicals market. He authored several technical papers and presented his work at vari-ous conferences. He is a member of the AICHE.
References1. ASTM D2986-95a (Reapproved 1999), “Stan-
dard Practice for Evaluation of Air Assay Media by the Monodisperse DOP (Dioctyl Phthalate) Smoke Test.”
2. Gotlinsky, B., Others, “Testing of All Metal Fil-ters for High Purity Semiconductor Process Gasses,” IEST, May 1981.
3. ANSI/CAGI ADF 400-1999, “Standard for Testing and Rating Coalescing Filters.”
4. Williamson, K., Tousi, S., and Hashemi, R., Re-cent Developments in Performance Rating of Gas/Liquid Coalescers, Presented at the First Annual Meeting of the American Fil-tration Society, Ocean City, Maryland, March 21–25, 1988.
5. Miller, J. D., Koslow, R. R. and Williamson, K. W., U.S. Patent 4,676,807, June 30, 1987; id. U. S. Patent 4,759,782, July, 1988.
6 Wines, T. H., Improve Liquid/Gas Coalescer Performance, Hydrocarbon Process., Vol. 79, No. 1, January, 2000.
7 Brown, R. L., Wines, T. H., Recent Develop-ments in Liquid-Gas Separation Technology, Presented at the Laurence Reid Gas Condi-tioning Conference, Norman Oklahoma, Feb-ruary 28, 1994
8 Murphy, W. L., Practical In-Service Simulation Tests for Rating of High Efficiency Aerosol Coalescing Performance, PEDD-FSR-101a, Pall Corp. Equipment Development, Novem-ber 1984.
Posted with permission from July 2011. Chemical Engineering. Copyright 2011. All rights reserved.For more information on the use of this content, contact Wright’s Media at 877-652-5295
79347

Fuels and Chemicals
25 Harbor Park DrivePort Washington, NY 11050 +1 516 484 3600 telephone+1 800 289 7255 toll free US
Visit us on the Web at www.pall.com
Pall Corporation has offices and plants throughout the world. For Pall representativesin your area, please go to www.pall.com/contact.
© Copyright 2011, Pall Corporation. Pall, and are trademarks of Pall Corporation. ® Indicates a Pall trademark registered in the USA. is a service mark of Pall Corporation.
FC_CHEMENGEN
F&C Tagline2_Layout 1 9/1/11 3:46 PM Page 1