Embed Size (px)
Citation preview

Clinical Chemistry 55:6 Automation and Analytical Techniques 1147–1154 (2009)
Liquid Chromatography–Tandem Mass Spectrometry Analysis of Folate and Folate Catabolites in Human Serum
Rita Hannisdal,1,2* Per Magne Ueland,1,2,3 and Asbjørn Svardal1,2
BACKGROUND: Folate status is associated with several chronic diseases; thus accurate assessment of folate status has become important in the clinical setting and in epidemiological studies. The diversity of folate forms complicates the task of assaying endogenous folate. We developed and validated an assay that measures various forms of folate in addition to folate catabolites in human serum.
METHODS: We added ascorbic acid to serum samples from 168 healthy blood donors and 39 patients with renal failure, and precipitated the proteins with acetonitrile containing 13C-labeled folate forms as internal standards. The supernatant was evaporated and the analytes redissolved in water. We then used liquid chromatography–tandem mass spectrometry to quantify 5-methyltetrahydrofolate (5mTHF), 4-�-hydroxy5-methyltetrahydrofolate (hmTHF), folic acid (FA), 5-formyltrahydrofolate (5fTHF), p-aminobenzoylglutamate (pABG), and p-acetamidobenzoylglutamate (apABG).
RESULTS: Detection limits were 0.07– 0.52 nmol/L, and the assay was linear to 140 nmol/L for all analytes. The mean serum folate concentration from 168 blood donors was 22.7 nmol/L, of which 85.8% was 5mTHF, 12.1% hmTHF, 2.1% FA, and 0.0% 5fTHF. In the same individuals, the mean concentrations of pABG and apABG were 0.07 nmol/L and 0.47 nmol/L, respectively. The concentrations of folate catabolites were 22–30 times higher in 39 patients with renal failure. This folate assay correlated well with the microbiologic assay (r 2 � 0.92) and with measurement of serum folate as pABG equivalents (r2 � 0.93).
CONCLUSIONS: This method based on liquid chromatography–tandem mass spectrometry measures the
most abundant folate species and 2 folate catabolites in human serum. © 2008 American Association for Clinical Chemistry
Folate plays important roles in one-carbon metabolism, including maintenance and repair of DNA and remethylation of homocysteine to methionine. Impaired folate status can cause megaloblastic anemia (1 ) and is a risk factor for neural-tube defects (2 ). Folate deficiency has also been associated with cardiovascular disease (3 ), dementia (4 ), cognitive impairment (5 ), and various forms of cancer, including colorectal and breast cancer (6 ).
The chemical structure of folate consists of a pterin moiety coupled through a methylene group to p-aminobenzoylglutamate (pABG).4 Folate species differ with respect to the oxidation state of the pterin moiety, the number of glutamate residues connected, and the presence of different one-carbon substituents at the N-5 and/or N-10 position (7 ).
Folate in serum is present in the monoglutamate form, and the prevailing species is 5-methyltetrahydrofolate (5mTHF) (8, 9 ). Formyltetrahydrofolate (8, 9 ) and folic acid (FA) can also be present in serum (9 ), with the latter found only after ingestion of supplements or fortified food containing FA (9, 10 ).
5mTHF can be oxidized to 5-methyl-5,6-dihydrofolate under mild oxidation conditions (oxygen). Under more severe conditions (hydrogen peroxide) 5mTHF is oxidized further to a compound originally identified as 4-�-hydroxy-5-methyltetrahydrofolate (hmTHF) (11 ). Reexamination of the identity of this compound suggested that it has a pyrazino-s-triazine structure (12 ).
Folate catabolism is a major route of folate turnover in humans and involves cleavage of the C9-N10 bond, producing a pterin and pABG (13 ). The majority of pABG is N-acetylated to p-acetamidobenzoyl
1 LOCUS for Homocysteine and Related Vitamins and 2 Section for Pharmacology, Received August 7, 2008; accepted December 16, 2008. Institute of Medicine, University of Bergen, Bergen, Norway; 3 Haukeland Previously published online at DOI: 10.1373/clinchem.2008.114389 University Hospital, Bergen, Norway. 4 Nonstandard abbreviations: pABG, p-aminobenzoylglutamate; 5mTHF, 5
* Address correspondence to this author at: Section for Pharmacology, Institute methyltetrahydrofolate; FA, folic acid; hmTHF, 4-�-hydroxy-5-methyltetrahydroof Medicine, University of Bergen, N-5021 Bergen, Norway. Fax �47-55-97- folate; apABG, p-acetamidobenzoylglutamate; 5fTHF, 5-formyltrahydrofolate; 46-05; e-mail [email protected]. LOQ, limit of quantification LOD, limit of detection; S/N, signal to noise.
1147

glutamate (apABG) before excretion (13 ). Several studies have suggested that folate catabolism plays an important role in regulating intracellular folate concentrations, and increased folate catabolism is believed to take place in individuals taking oral contraceptives or anticonvulsant drugs (14 ).
Serum folate has been measured by various methods (15 ), including chromatographic methods based on HPLC (16, 17 ), LC-MS (18 –21 ), and liquid chromatography–tandem mass spectrometry (LC-MS/MS) (9, 22 ). Despite efforts to establish reliable methods for determining folate status, large interassay and inter-laboratory differences have been reported (23–25 ), and each laboratory must establish its own reference intervals.
pABG and apABG in human urine were first isolated and quantified by McPartlin et al. (13 ), whose method involved ion exchange and sorbent extraction before HPLC analysis. Recently, pABG and apABG in serum were also measured by use of LC-MS/MS (26 ).
We describe a selective LC-MS/MS method for simultaneous determination of 5mTHF, hmTHF, FA, 5fTHF, pABG, and apABG in 60 �L of human serum. Sample processing is carried out by a robotic workstation, and sample throughput is 192 samples per day.
Materials and Methods
CHEMICALS
5mTHF, FA, 5fTHF, pABG, and ascorbic acid were purchased from Sigma Chemical; 13C5 5mTHF, 13C5
FA, and 13C5 5fTHF were obtained from Merck Eprova AG; and 13C2 pABG was from Larodane Fine Chemicals AB. hmTHF and 13C5 hmTHF were prepared from 5mTHF and 13C5 5mTHF, respectively, as previously described (11 ), and apABG and 13C2 apABG were prepared from pABG and 13C2 pABG, respectively, as previously described (13 ). Charcoal, mercaptoethanol, phosphoric acid, sodium phosphate, and acetic acid were purchased from Merck, and acetonitrile was from LabScan.
SOLUTIONS AND SAMPLES
Folate species and catabolites were prepared in 20 mmol/L phosphate buffer, pH 7.2. Solutions containing 5mTHF, 5fTHF, and pABG were supplemented with 56.8 mmol/L ascorbic acid, 8.25 mmol/L mercaptoethanol, and 1.9 mol/L acetonitrile. Solutions containing hmTHF and FA were supplemented with 56.8 mmol/L ascorbic acid, and solutions containing apABG supplemented with 8.25 mmol/L mercaptoethanol.
Whole blood from 168 healthy Norwegian blood donors (70% males) with a mean age of 45 years (range 21– 69 years) was collected into Vacutainer tubes with
1148 Clinical Chemistry 55:6 (2009)
no additive. The whole blood samples were kept for 30 min at room temperature before centrifugation and separation of the serum fraction. We obtained 39 serum samples with increased serum creatinine in the range 130 –957 �mol/L from the routine clinical chemistry laboratory at Haukeland University Hospital. All samples were anonymized and could not be linked back to personal identity. Written consent was obtained from all blood donors. The study was examined by the institutional review board (REK Vest) and found to be of the quality control category, which under the Norwegian regulations in force is exempt from full review by the board. Thus the board has no objection to publication of the results.
We prepared folate-free serum by treating serum with activated charcoal (8 mg/mL serum). The charcoal was kept in suspension by continuous mixing for 15 min at room temperature, and then centrifuged at 23 500g for 15 min. The treated serum contained no detectable folate (�0.1 nmol/L) as measured by a microbiologic assay (27 ).
All samples and stock solutions were stored at – 80 °C.
SAMPLE PROCESSING
Serum samples (60 �L) were mixed with 7 �L of 200 mmol/L ascorbic acid. The samples were deproteinized by adding 120 �L acetonitrile containing internal standards; 13C5 5mTHF (20.0 nmol/L), 13C5 hmTHF (14.0 nmol/L), 13C5 FA (5.0 nmol/L), 13C5 5fTHF (5.0 nmol/ L), 13C2 pABG (5.0 nmol/L), and 13C2 apABG (5.0 nmol/L). The internal standards were kept at – 80 °C and added to the acetonitrile immediately before sample preparation to avoid any oxidation. After centrifugation, 70 �L of the supernatant was transferred to an empty plate and evaporated with a vacuum centrifuge (Heto vacuum centrifuge) at 30 °C. The analytes were redissolved in 50 �L water, and the solutions were stirred for 90 s. All pipetting was carried out in 96-well microtiter plates by a robotic workstation (ATplus 2, Hamilton). The samples were placed at 4 °C in the sample tray for �24 h until analyses by LC-MS/MS.
INSTRUMENTATION
We used an Agilent series HPLC system (Agilent Technologies) equipped with a degasser, a column oven that included a column switcher, a quaternary pump for solvent delivery, and a thermostated autosampler for sample introduction. The HPLC system was coupled to an API 4000 Q Trap (Applied Biosystems/MDS SCIEX) tandem mass spectrometer outfitted with an electrospray ion source (Turbo Ion SprayTM). Analyst software (Applied Biosystems/MDS SCIEX) was used for HPLC system control and data acquisition and processing.

Folate and Folate Catabolites by LC-MS/MS
Table 1. Retention time and instrument settings.
Analyte Transition,
m/z Tr
a , min
DP, V
CE, V
CUR, psig
5mTHF 460.4 3 313.2 2.33 55 25 30 13C5 5mTHF 465.4 3 313.2 2.33 55 25 30
hmTHF 474.4 3 327.2 2.40 60 30 30 13C5 hmTHF 479.4 3 327.2 2.40 60 30 30
FA 442.4 3 295.2 2.61 55 25 50 13C5 FA 447.4 3 295.2 2.61 55 25 50
5fTHF 474.4 3 327.2 2.61 60 30 50 13C5 5fTHF 479.4 3 327.2 2.61 50 25 50
pABG 267.2 3 120.0 2.05 42 22 30 13C2 pABG 269.2 3 120.0 2.05 42 22 30
apABG 311.2 3 162.0 2.62 55 20 50 13C2 apABG 309.2 3 162.0 2.62 55 20 50
a tr, retention time; DP, declustering potential; CE, collision energy; CUR, curtain gas.
LC-MS/MS
Samples were placed in a cooled (4 °C) sample tray and injected into a Zorbax stable bond C8 reversed-phase column [50 � 4.6 mm (i.d.); particle size 3.5 �m] from Agilent Technologies. The column was mounted in the thermostated column compartment set at 20 °C. The flow rate was 1.0 mL/min. The mobile phase consisted of 3 solutions, A � 650 mmol/L acetic acid, B � water, and C � methanol, and was developed according to the following timetable: 0 – 0.2 min (70.0% A and 30.0% B), 1.5–2.7 min (3.5% A, 26.5% B, and 70.0% C), 2.8 – 3.5 min (3.5% A, 1.5% B, and 95.0% C), and 3.6 – 4.8 min (70.0% A and 30.0% B). All gradient steps were linear. The column effluent was directed into the mass spectrometer in the time interval of 1.8 –3.0 min, otherwise to waste.
We optimized acquisition settings by infusion of a 10 �mol/L solution of each analyte at a rate of 1 �L/ min using a Harvard Model 11 syringe pump connected directly to the ion source by PEEK (polyether ether ketone) tubing. Before entering the mass spectrometer, this solution was mixed at a T-junction with mobile phase delivered at a rate of 1.0 mL/min and with a composition corresponding to the time of elution of the actual analyte.
The ion source temperature (500 °C), the ion spray voltage (5500 V), the collision gas (4 psig), the ion source gas 1 (80 psig), the ion source gas 2 (75 psig), the cell exit potential (10 V), and the activated interface heater were identical for all analytes. Other instrument parameters, mass transitions, and retention times for each compound are detailed in Table 1. The analytes
were detected in the positive ion mode by multiple-reaction monitoring.
Matrix effects were assessed by a postcolumn infusion procedure (28 ). The analytes (100 �mol/L at a constant flow of 20 �L/min) were directed via a tee to the column effluent, and a prepared serum sample was injected.
LINEARITY AND ASSAY CALIBRATION
We assessed the linear range and limit of quantification (LOQ) by adding the analytes at concentrations of 0.1– 140 nmol/L to folate-free serum. Limits of detection (LOD) were defined as the lowest concentrations that gave peaks with signal-to-noise (S/N) ratios of 5, and LOQ were defined as the lowest concentrations that gave peaks with S/N ratios of 10. The S/N ratio was determined as S/N � (peak height – baseline)/SD (baseline), using the S/N script supplied by Applied Biosystems (Analyst Ver. 1.4.1).
For assay calibration we divided pooled serum into 3 portions and added 5mTHF (0, 17, and 62 nmol/ L), hmTHF (3, 9, and 54 nmol/L), and FA, 5fTHF, pABG, and apABG (1, 5, and 50 nmol/L). We estimated the concentration of endogenous 5mTHF to be 8 nmol/L by adding known amounts of 5mTHF to the serum samples and assuming equal recoveries of endogenous and added 5mTHF and linearity of peak areas vs total concentrations. The other analytes were not present above their LOD.
RECOVERY AND ANALYTICAL VARIATION
Folate-free serum and PBS were spiked with 5mTHF, hmTHF, FA, 5fTHF, pABG, or apABG at 3 different concentrations (5, 15 and 45 nmol/L). Twenty replicates were analyzed at each concentration in 1 analytical run. Recovery (%) was calculated by comparing the peak area, corrected by internal standard, in folate-free serum to that in PBS.
For imprecision studies of the assay we used folate-free serum spiked with 3 different concentrations (low, medium, and high) of all the analytes. Intrarun imprecision was determined by measuring 20 replicates of each concentration in 1 day. For interrun imprecision, 10 replicates of each concentration were measured for a 2-week period.
Results and Discussion
SAMPLE PREPARATION
For sample preparation, we added ascorbic acid to the serum sample to avoid oxidation of folate. If any 5mTHF had been oxidized to 5-methyl-5,6dihydrofolate before sample preparation, it would be reduced back to 5mTHF after the addition of ascorbic acid (29 ). The samples were deproteinized by acetoni-
Clinical Chemistry 55:6 (2009) 1149
2.2.2
2.0
i 4
1.8
a5fTHFFA
hmTHF5mTHFpABG2.6
Retent on time (min)
100
pABG
150
50
000
000
0
000
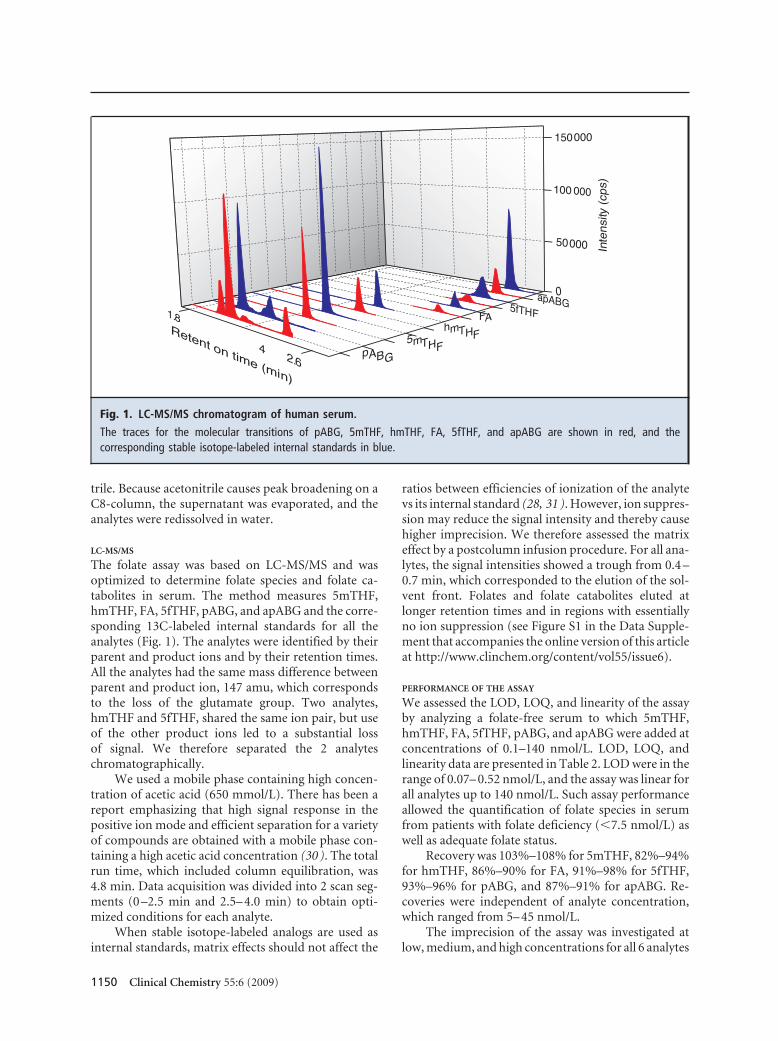
Fig. 1. LC-MS/MS chromatogram of human serum.
The traces for the molecular transitions of pABG, 5mTHF, hmTHF, FA, 5fTHF, and apABG corresponding stable isotope-labeled internal standards in blue.
are shown in red, and the
trile. Because acetonitrile causes peak broadening on a C8-column, the supernatant was evaporated, and the analytes were redissolved in water.
LC-MS/MS
The folate assay was based on LC-MS/MS and was optimized to determine folate species and folate catabolites in serum. The method measures 5mTHF, hmTHF, FA, 5fTHF, pABG, and apABG and the corresponding 13C-labeled internal standards for all the analytes (Fig. 1). The analytes were identified by their parent and product ions and by their retention times. All the analytes had the same mass difference between parent and product ion, 147 amu, which corresponds to the loss of the glutamate group. Two analytes, hmTHF and 5fTHF, shared the same ion pair, but use of the other product ions led to a substantial loss of signal. We therefore separated the 2 analytes chromatographically.
We used a mobile phase containing high concentration of acetic acid (650 mmol/L). There has been a report emphasizing that high signal response in the positive ion mode and efficient separation for a variety of compounds are obtained with a mobile phase containing a high acetic acid concentration (30 ). The total run time, which included column equilibration, was 4.8 min. Data acquisition was divided into 2 scan segments (0 –2.5 min and 2.5– 4.0 min) to obtain optimized conditions for each analyte.
When stable isotope-labeled analogs are used as internal standards, matrix effects should not affect the
1150 Clinical Chemistry 55:6 (2009)
ratios between efficiencies of ionization of the analyte vs its internal standard (28, 31 ). However, ion suppression may reduce the signal intensity and thereby cause higher imprecision. We therefore assessed the matrix effect by a postcolumn infusion procedure. For all analytes, the signal intensities showed a trough from 0.4 – 0.7 min, which corresponded to the elution of the solvent front. Folates and folate catabolites eluted at
)y
(cp
sIn
ten
sit
longer retention times and in regions with essentially no ion suppression (see Figure S1 in the Data Supplement that accompanies the online version of this article at http://www.clinchem.org/content/vol55/issue6).
PERFORMANCE OF THE ASSAY
We assessed the LOD, LOQ, and linearity of the assay by analyzing a folate-free serum to which 5mTHF, hmTHF, FA, 5fTHF, pABG, and apABG were added at concentrations of 0.1–140 nmol/L. LOD, LOQ, and linearity data are presented in Table 2. LOD were in the range of 0.07– 0.52 nmol/L, and the assay was linear for all analytes up to 140 nmol/L. Such assay performance allowed the quantification of folate species in serum from patients with folate deficiency (�7.5 nmol/L) as well as adequate folate status.
Recovery was 103%–108% for 5mTHF, 82%–94% for hmTHF, 86%–90% for FA, 91%–98% for 5fTHF, 93%–96% for pABG, and 87%–91% for apABG. Recoveries were independent of analyte concentration, which ranged from 5– 45 nmol/L.
The imprecision of the assay was investigated at low, medium, and high concentrations for all 6 analytes

Folate and Folate Catabolites by LC-MS/MS
Table 2. LOD, LOQ, and linearity data.
Analyte LOD, nmol/L LOQ, nmol/L Slope Intercept R2 Sy � x a Sab Sbc
5mTHF 0.07 0.13 0.037 �0.002 0.995 0.14 0.0008 0.051
HmTHF 0.20 0.40 0.026 �0.013 0.995 0.10 0.0006 0.035
FA 0.27 0.53 0.109 0.029 0.997 0.32 0.0018 0.115
5fTHF 0.52 1.03 0.132 0.063 0.997 0.40 0.0023 0.145
pABG 0.08 0.17 0.080 0.181 0.993 0.34 0.0020 0.123
apABG 0.13 0.27 0.018 0.027 0.993 0.08 0.0005 0.029
a Standard error of the estimate. b Standard error of slope. c Standard error of intercept.
(Table 3). The intra-run CVs ranged from 5.0%–9.9%, and the inter-run CVs from 3.3%–9.5%, and assay imprecision was comparable to that reported for other folate methods based on LC-MS/MS (9, 32 ).
DISTRIBUTION OF FOLATE SPECIES
The median (range) of total folate concentration in 168 fresh serum samples from healthy Norwegian blood donors was 19.8 (7.0 –174.0) nmol/L. The median
Table 3. Imprecision of the assay.a
Intra-run Inter-run
Concentration, nmol/L (n � 20) CV, %
Concentration, nmol/L (n � 10)
5mTHF 11.0 (0.9) 8.0 10.4 (0.4)
31.1 (2.7) 8.9 32.4 (1.6)
109.0 (5.9) 5.4 103.9 (4.9)
HmTHF 1.4 (0.1) 9.7 1.5 (0.1)
4.0 (0.3) 8.1 5.6 (0.4)
39.8 (2.5) 6.4 44.2 (2.5)
FA 1.0 (0.1) 8.4 1.1 (0.1)
4.1 (0.3) 6.8 4.5 (0.3)
47.5 (3.1) 6.5 45.5 (2.8)
5fTHF 1.2 (0.1) 7.6 1.0 (0.1)
3.7 (0.3) 8.0 4.1 (0.4)
42.1 (3.4) 8.9 38.5 (2.1)
pABG 1.3 (0.1) 7.7 1.3 (0.1)
5.1 (0.4) 8.5 4.8 (0.2)
41.3 (2.6) 6.3 39.6 (2.2)
apABG 1.3 (0.1) 6.4 1.0 (0.1)
4.5 (0.2) 5.0 4.3 (0.3)
46.2 (2.6) 5.7 40.1 (1.9)
CV, %
4.1
5.1
4.7
7.4
7.1
5.7
11.9
6.4
6.1
10.5
9.9
5.5
9.6
3.4
5.6
8.5
7.1
4.8
a Concentrations are given as the mean (SD).
(range) for 5mTHF was 16.4 (5.8 –71.3) nmol/L, for hmTHF 2.3 (0.0 –12.7) nmol/L, and for FA 0.0 (0.0 – 74.8) nmol/L; 5fTHF was not detected. This corresponds to 85.8%, 12.1%, 2.1%, and 0% of the total folate, respectively.
The high concentration of hmTHF in human serum was unexpected and has not previously been reported. hmTHF has been described as an oxidation product of 5mTHF (11 ), and we have detected substantial amounts in sera stored at room temperature for weeks or at �20 °C for years. But the samples used for assay validation were stored in the dark on ice for 30 –150 min before centrifugation and separation of the serum fraction, which was then stored at �80 °C for �2 years. The possible existence of hmTHF in vivo should be investigated in future studies, taking particular measures to avoid folate oxidation in vitro.
The observation that 5mTHF is the most abundant folate species in human serum confirms consistent reports by others (9, 33 ). The concentration of FA was lower than that detected in US population (in which FA accounted for 8% of total folate) (9 ), and only 1 of 168 sample donors had FA above 2.0 nmol/L, i.e., 74.8 nmol/L FA. This finding could be explained by the fact that there is no dietary FA fortification in Norway.
MATERIALS AND METHOD COMPARISON
We compared the total concentration of folate in 168 serum samples measured by this LC-MS/MS method with the concentrations measured by a microbiologic method and a newly developed pABG assay (34 ). These comparisons gave a correlation of r 2 � 0.92 and r 2 � 0.93, respectively (Fig. 2). The median (range) folate concentration measured with the LC-MS/MS assay [19.8 (7.0 –174.0) nmol/L] was higher than that obtained with the microbiological method [12.5 (4.6 – 141.6) nmol/L] and the pABG assay [17.9 (6.8 –141.0) nmol/L]. The presence of hmTHF in the samples [2.3
Clinical Chemistry 55:6 (2009) 1151

95% CI –3.70 to –0.47 1.13 to 1.32
Coefficient Intercept –1.98
Slope 1.22
B
0 50 100 150 0
50
100
150 x = yx = y
A
0
50
100
150
0 50 100 150 pABG assay (nmol/L) Microbiological assay (nmol/L)
Tot
al f
olat
e (n
mol
/L)
95% CI 2.16 to 4.03 1.16 to 1.32
Coefficient Intercept 3.06
Slope 1.24
Fig. 2. Comparison of methods by Passing and Bablok regression analyses.
Total folate (the sum of 5mTHF, hmTHF, FA, and 5fTHF) measured with the current assay was compared with folate measured with the microbiologic assay (A) and the pABG assay (B). The solid line represents the regression line, dashed lines the 95% CI, and dotted line the identity line (x � y); n � 168.
(0.0 –12.7) nmol/L] could partly account for the lower concentration obtained with the microbiological method, because hmTHF does not support the growth of Lactobacillus rhamnosus (formerly known as Lactobacillus casei) (35 ).
FOLATE CATABOLITES
The 2 folate catabolites, pABG and apABG, have been detected in urine (36 ) and have also been reported in
the healthy individuals. pABG and apABG showed a positive correlation with total folate (Fig. 3).
In summary, we developed an LC-MS/MS method for the determination of 5mTHF, hmTHF, FA, 5fTHF, pABG, and apABG in human serum. This method is the first reported that allows simultaneous analysis of the 4 different folate species together with
serum (26 ). Our observation of low concentrations of pABG in serum from healthy blood donors (mean 0.07
50 nmol/L) is in disagreement with a previous report of a mean pABG concentration of 8.9 nmol/L in serum
pABG
apABG
from healthy volunteers (26 ). These results were obtained with serum samples that were acidified without any antioxidants present. This process is known to lead to partial conversion of folate to pABG (37 ), and we confirmed the presence of similar amounts of pABG in serum subsequent to such sample preparation. Thus, the presence of about 10 nmol/L pABG in serum (27 ) seems to be an artifact related to partial conversion of folate to pABG at low pH. We also measured apABG concentrations (mean 0.47 nmol/L) lower than previously reported (mean 3.0 nmol/L) (26 ).
Fo
late
cat
abo
lite
(nm
ol/L
) 40
30
20
10
We measured pABG and apABG in 39 serum sam0
0 50 100 150 200 250 300
ples from patients with increased serum creatinine concentrations (130 –957 �mol/L). These samples had increased concentrations of the folate catabolites compared to the concentrations in healthy blood donors. The median (range) concentration of pABG was 0.3 (0.0 –13.7) nmol/L and of apABG 3.5 (0.5–52.9) nmol/L. The mean total folate value in these samples was 38.9 nmol/L, which is substantially higher than in
1152 Clinical Chemistry 55:6 (2009)
Total folate (nmol/L)
Fig. 3. Total folate, pABG, and apABG in patients with increased serum creatinine.
pABG (Spearman R � 0.88, P � 0.001) and apABG (Spearman R � 0.77, P � 0.001) showed a significant correlation with total folate; n � 39.

Folate and Folate Catabolites by LC-MS/MS
the folate catabolites in serum. The method also Authors’ Disclosures of Potential Conflicts of Interest: Upon manuscript submission, all authors completed the Disclosures of Potenmeasures hmTHF in serum, which is a folate form tial Conflict of Interest form. Potential conflicts of interest: previously believed to occur only after strong oxida
tion of 5mTHF (29 ). A fast and automated sample Employment or Leadership: P.M. Ueland, Foundation to Promote
preparation combined with short retention time of Research into Functional and Bevital. Consultant or Advisory Role: None declared. the analytes ensures a high sample throughput of 192 Stock Ownership: None declared.
samples per 24 h. Honoraria: None declared. Research Funding: The Norwegian Cancer Society and Foundation. Expert Testimony: None declared.
Author Contributions: All authors confirmed they have contributed Role of Sponsor: The funding organizations played no role in the to the intellectual content of this paper and have met the following 3 design of study, choice of enrolled patients, review and interpretation requirements: (a) significant contributions to the conception and design, of data, or preparation or approval of manuscript. acquisition of data, or analysis and interpretation of data; (b) drafting or revising the article for intellectual content; and (c) final approval of Acknowledgment: We thank Torunn Eide for excellent technical the published article.
1. Chanarin I. Megaloblastic anaemia, cobalamin, and folate. J Clin Pathol 1987;40:978 –84.
2. Blom HJ, Shaw GM, den Heijer M, Finnell RH. Neural tube defects and folate: case far from closed. Nat Rev Neurosci 2006;7:724–31.
3. Clarke R, Lewington S, Sherliker P, Armitage J. Effects of B-vitamins on plasma homocysteine concentrations and on risk of cardiovascular disease and dementia. Curr Opin Clin Nutr Metab Care 2007;10:32–9.
4. Ravaglia G, Forti P, Maioli F, Martelli M, Servadei L, Brunetti N, et al. Homocysteine and folate as risk factors for dementia and Alzheimer disease. Am J Clin Nutr 2005;82:636 –43.
5. Balk EM, Raman G, Tatsioni A, Chung M, Lau J, Rosenberg IH. Vitamin B6, B12, and folic acid supplementation and cognitive function: a systematic review of randomized trials. Arch Intern Med 2007;167:21–30.
6. Fairfield KM, Fletcher RH. Vitamins for chronic disease prevention in adults: scientific review. JAMA 2002;287:3116–26.
7. Stover PJ. Physiology of folate and vitamin B12 in health and disease. Nutr Rev 2004;62(6 Pt 2):S3– 12; discussion S13.
8. Ratanasthien K, Blair JA, Leeming RJ, Cooke WT, Melikian V. Folates in human serum. J Clin Pathol 1974;27:875–9.
9. Pfeiffer CM, Fazili Z, McCoy L, Zhang M, Gunter EW. Determination of folate vitamers in human serum by stable-isotope-dilution tandem mass spectrometry and comparison with radioassay and microbiologic assay. Clin Chem 2004;50:423–32.
10. Kelly P, McPartlin J, Goggins M, Weir DG, Scott JM. Unmetabolized folic acid in serum: acute studies in subjects consuming fortified food and supplements. Am J Clin Nutr 1997;65:1790–5.
11. Gapski GR, Whiteley JM, Huennekens FM. Hydroxylated derivatives of 5-methyl-5,6,7,8-tetrahydrofolate. Biochemistry 1971;10:2930 –4.
12. Jongejan JA, Mager HIX, Berends W. Autoxidation of 5-alkyl-tetrahydropteridines the oxidation product of 5-methyl-THF. In: Kisliuk RL, Brown GM, eds. Chemistry and biology of pteridines: proceedings of the Sixth International Symposium on the Chemistry and Biology of Pteridines, La Jolla, California, September 25–28, 1978. New York: Elsevier/North-Holland; 1979.
assistance.
References
p 241–6. (Developments in biochemistry; v. 4 0165-1714)
13. Mcpartlin J, Courtney G, Mcnulty H, Weir D, Scott J. The quantitative-analysis of endogenous folate catabolites in human urine. Anal Biochem 1992; 206:256–61.
14. Suh JR, Herbig AK, Stover PJ. New perspectives on folate catabolism. Annu Rev Nutr 2001;21: 255–82.
15. Quinlivan EP, Hanson AD, Gregory JF. The analysis of folate and its metabolic precursors in biological samples. Anal Biochem 2006;348:163– 84.
16. Belz S, Frickel C, Wolfrom C, Nau H, Henze G. High-performance liquid chromatographic determination of methotrexate, 7-hydroxymethotrexate, 5-methyltetrahydrofolic acid and folinic acid in serum and cerebrospinal fluid. J Chromatogr B Biomed Appl 1994;661:109–18.
17. Lucock MD, Hartley R, Smithells RW. A rapid and specific HPLC-electrochemical method for the determination of endogenous 5-methyltetrahydrofolic acid in plasma using solid phase sample preparation with internal standardization. Biomed Chromatogr 1989;3:58 –63.
18. Hart DJ, Finglas PM, Wolfe CA, Mellon F, Wright AJ,SouthonS.Determinationof5-methyltetrahydrofolate (13C-labeled and unlabeled) in human plasma and urine by combined liquid chromatography mass spectrometry. Anal Biochem 2002; 305:206–13.
19. Nelson BC, Dalluge JJ, Margolis SA. Preliminary application of liquid chromatography-electrospray-ionization mass spectrometry to the detection of 5-methyltetrahydrofolic acid monoglutamate in human plasma. J Chromatogr B Biomed Sci Appl 2001;765:141–50.
20. Nelson BC, Pfeiffer CM, Margolis SA, Nelson CP. Affinity extraction combined with stable isotope dilution LC/MS for the determination of 5-methyltetrahydrofolate in human plasma. Anal Biochem 2003;313:117–27.
21. Pawlosky RJ, Flanagan VP, Pfeiffer CM. Determination of 5-methyltetrahydrofolic acid in human serum by stable-isotope dilution high-performance liquid chromatography-mass spectrometry. Anal Biochem 2001;298:299–305.
22. Nelson BC, Satterfield MB, Sniegoski LT, Welch
MJ. Simultaneous quantification of homocysteine and folate in human serum or plasma using liquid chromatography/tandem mass spectrometry. Anal Chem 2005;77:3586–93.
23. Gunter EW, Bowman BA, Caudill SP, Twite DB, Adams MJ, Sampson EJ. Results of an international round robin for serum and whole-blood folate. Clin Chem 1996;42:1689–94.
24. Thame G, Guerra-Shinohara EM, Moron AF. Serum folate by two methods in pregnant women carrying fetuses with neural tube defects. Clin Chem 2002;48:1094–5.
25. Owen WE, Roberts WL. Comparison of five automated serum and whole blood folate assays. AJCP 2003;120:121–6.
26. Sokoro AA, Etter ML, Lepage J, Weist B, Eichhorst J, Lehotay DC. Simple method for the quantitative analysis of endogenous folate catabolites p-aminobenzoylglutamate (pABG) and its acetamido (apABG) derivative in human serum and urine by liquid chromatography-tandem mass spectrometry. J Chromatogr B Analyt Technol Biomed Life Sci 2006;832:9–16.
27. Molloy AM, Scott JM. Microbiological assay for serum, plasma, and red cell folate using cryopreserved, microtiter plate method. Methods Enzymol 1997;281:43–53.
28. Annesley TM. Ion suppression in mass spectrometry. Clin Chem 2003;49:1041–4.
29. Gregory JF 3rd. Chem and nutritional aspects of folate research: analytical procedures, methods of folate synthesis, stability, and bioavailability of dietary folates. Adv Food Nutr Res 1989;33: 1–101.
30. Kamel AM, Brown PR, Munson B. Effects of mobile-phase additives, solution pH, ionization constant, and analyte concentration on the sensitivities and electrospray ionization mass spectra of nucleoside antiviral agents. Anal Chem 1999; 71:5481–92.
31. Matuszewski BK, Constanzer ML, ChavezEng CM. Strategies for the assessment of matrix effect in quantitative bioanalytical methods based on HPLC-MS/MS. Anal Chem 2003;75:3019–30.
32. Fazili Z, Pfeiffer CM. Measurement of folates in serum and conventionally prepared whole blood lysates: application of an automated 96-well plate isotope-dilution tandem mass spectrometry
Clinical Chemistry 55:6 (2009) 1153
method. Clin Chem 2004;50:2378 –81. 33. Fazili Z, Pfeiffer CM, Zhang M. Comparison
of serum folate species analyzed by LC-MS/MS with total folate measured by microbiologic assay and Bio-Rad radioassay. Clin Chem 2007;53: 781–4.
34. Hannisdal R, Svardal A, Ueland PM. Measurement of folate in fresh and archival serum sam
ples as p-aminobenzoylglutamate equivalents. Clin Chem 2008;54:665–72.
35. Thien KR, Blair JA, Leeming RJ, Cooke WT, Melikian V. Serum folates in man. J Clin Pathol 1977;30:438–48.
36. Gregory JF 3rd, Caudill MA, Opalko FJ, Bailey LB. Kinetics of folate turnover in pregnant women (second trimester) and nonpregnant controls dur
ing folic acid supplementation: stable-isotopic labeling of plasma folate, urinary folate and folate catabolites shows subtle effects of pregnancy on turnover of folate pools. J Nutr 2001;131: 1928–37.
37. Maruyama T, Shiota T, Krumdieck CL. The oxidative cleavage of folates: a critical study. Anal Biochem 1978;84:277–95.
1154 Clinical Chemistry 55:6 (2009)


![Serum Levels of Homocysteine, Vitamin B12 and Folate in ... · methyltetrahydrofolate and methyl-Vitamin-B12 are essential factors for methionine synthesis of Hcy [10]. Lacking Vitamin](https://img.dokumen.tips/doc/110x75/5ec906dfa105b02e13239827/serum-levels-of-homocysteine-vitamin-b12-and-folate-in-methyltetrahydrofolate.jpg)