Embed Size (px)
Citation preview

Copyright © 2008 John Wiley & Sons, Ltd. Biomed. Chromatogr. 22: 873–878 (2008)DOI: 10.1002/bmc
Quantification of mitiglinide in human plasma 873ORIGINAL RESEARCHORIGINAL RESEARCH
Copyright © 2008 John Wiley & Sons, Ltd.
BIOMEDICAL CHROMATOGRAPHYBiomed. Chromatogr. 22: 873–878 (2008)Published online 3 March 2008 in Wiley InterScience(www.interscience.wiley.com) DOI: 10.1002/bmc.1005
Liquid chromatography/electrospray ionization tandemmass spectrometry for the quantification of mitiglinidein human plasma: validation and its application topharmacokinetic studies
Yan Zhang,1,2 Likun Ding,1 Yun Tian,1 Jing Yang,1 Lin Yang1 and Aidong Wen1*1Department of Pharmacy, Xijing Hospital of the Fourth Military Medical University, Xi’an 710032, People’s Republic of China2Department of Pharmacy, Tangdu Hospital of the Fourth Military Medical University, Xi’an 710038, People’s Republic of China
Received 19 November 2007; revised 15 December 2007; accepted 17 December 2007
ABSTRACT: A sensitive and specific method was developed and validated for the determination of mitiglinide in human plasmausing liquid chromatographic separation with electrospray ionization tandem mass spectrometric detection. Acidified plasmasamples were extracted with ethyl acetate. The chromatographic separation was performed on an Agilent Zorbax Eclipse Plus C18
column with a mobile phase of methanol–10 mM ammonium acetate solution at a flow rate of 0.3 mL/min. Analytes were detectedwith an Agilent 6410 Triple qudrupole mass spectrometer equipped with an electrospray ionization source in positive multiple re-action monitoring mode: m/z 316.2 (precursor ion) to 298.2 (product ion) for mitiglinide and m/z 318.2 (precursor ion) to 120.2(product ion) for the internal standard. This method was validated over a linear range of 0.5– 4000 ng/mL for mitiglinide in humanplasma. The lower limit of quantification (LLOQ) was 0.5 ng/mL, while a relative standard deviation (RSD) was less than 3.9%.The intra- and inter-run precision (as RSD, %) obtained from three validation runs were all less than 15%. The validated methodwas successfully used to analyze human plasma samples for application in pharmacokinetic studies. Copyright © 2008 John Wiley& Sons, Ltd.
KEYWORDS: mitiglinide; HPLC-MS/MS; pharmacokinetics
INTRODUCTION
Mitiglinide (Fig. 1), (–)-2(s)-benzyl-4-(cisperhydroisoindol-2-yl) butyric acid, is a new rapid-onset insulinotropicagent of the glinide class (Sunaga et al., 2001). The calciumhydrate form is used in clinical practice. Mitiglinide isthought to simulate insulin secretion by closing theATP-sensitive K+ [K(ATP)] channels in pancreatic betacells. Its early insulin release and short duration ofaction could be effective in improving postprandialhyperglycemia (Reimann et al., 2001; Liang et al., 2007).In vitro and in vivo studies have demonstrated that theinsulinotropic effect of mitiglinide is more potent thanthat of nateglinide (Ojima et al., 2004).
A high-performance liquid chromatographic methodemploying UV detection has previously been estab-lished for the determination of mitiglinide in rat plasmawithin a linear range of 0.1–20 μg/mL. However, thelower limit of quantification (LLOQ; 0.1 μg/mL)
reported was not adequate to monitor the therapeuticlevels needed (Yu and Zeng, 2006). Liang et al. (2007)recently described an LC-MS method for determinationof mitiglinide in human urine. The method was vali-dated over a linear range of 5–1000 ng/mL, and the runtime was about 14 min, which was unsuitable for analy-sis of large batches of biological samples. In order toevaluate the administered dose, a selective and sensi-tive assay method is needed for its quantification inhuman plasma. In this work, a rapid and sensitive LC–MS/MS method for the determination of mitiglinidein human plasma was developed and validated. Theprocedure exhibited excellent performance in termsof high selectivity, wide linear range (0.5–4000 ng/mL),rapid analytical speed (5 min per sample), low LLOQ(0.5 ng/mL) and small injection volume (2 μL). The methodwas successfully applied to study the pharmacokineticsof mitiglinide.
EXPERIMENTAL
Chemicals and reagents. Mitiglinide reference standard(99.5% purity) and mitiglinide tablets (5 mg/tablet) were pro-vided by Tianjin Hankang Pharmaceutical Co. Ltd. (Tianjin,
*Correspondence to: A. Wen, Department of Pharmacy, XijingHospital of the Fourth Military Medical University, Xi’an 710032,People’s Republic of China.E-mail: [email protected]
Abbreviations used: MRM, multiple reaction monitoring.

Copyright © 2008 John Wiley & Sons, Ltd. Biomed. Chromatogr. 22: 873–878 (2008)DOI: 10.1002/bmc
874 Y. Zhang et al.ORIGINAL RESEARCH
China). Nateglinide reference standard (internal standard,IS), 99.5% purity was obtained from Jiangsu Yabang Pharma-ceutical Co. Ltd. (Jiangsu, China). HPLC-grade methanolwas purchased from Fisher scientific (Pittsburgh, PA, USA).HPLC-quality water was prepared using a Milli-Q plotwaterpurification system (Millipore, Bedford, MA, USA). Otherchemicals were all of analytical grade.
Instrumentation. LC-MS/MS system were performed using anAgilent 1200 series HPLC and an Agilent 6410 Triplequdrupolemass spectrometer equipped with an electrospray ionizationsource (Agilent Technologies, USA). The chromatographicseparation was achieved on a Zorbax Eclipse Plus C18 (1.8 μm,3.0 × 100 mm i.d., Agilent). All data were acquired employingAgilent 6410 Quantitative Analysis version analyst data pro-cessing software.
LC-MS/MS conditions. The mobile phase composition was amixture of methanol–10 mM ammonium acetate solution(75:25, v/v), which was pumped at a flow rate of 0.3 mL/min.Mass spectrometric detection was performed on a Series 6410Triple Quad LC-MS (Agilent Technologies, USA) using
Table 1. Main working parameters for tandem mass spectrometry
Parameter Value
Scan type MRMIon polarity PositiveFragmentor voltage, V 100Nebulizer pressure, psi 45Drying gas temperature, °C 350Dry gas flow, L/min 10Dwell time per transition, ms 200Resolution UnitCollision energy, eV 10.0 (analyte) and 25 (IS)Ion transition for mitiglinide, m/z 316.2 → 298.2Ion transition for nateglinide, m/z 318.2 → 120.2
multiple reaction monitoring (MRM). A turbo electrosprayinterface in positive ionization mode was used. The main work-ing parameters of the mass spectrometer are summarized inTable 1.
Sample preparation. The plasma sample (0.5 mL) was mixedwith 4 mL ethyl acetate after addition of 50 μL IS solution(10 μg/mL) and 50 μL 10% acetic acid. The mixture wasvortex-mixed for 3 min and centrifuged for 10 min at 4000 rpm.The upper organic phase was transferred and evaporated todryness under a gentle stream of nitrogen in a water bath of30°C. The residue was reconstituted in 150 μL of the mobilephase by vortex-mix for 1 min. After being centrifuged for4 min at 16,000 rpm, the sample was transferred to the glassautosampler vial insert and 2 μL aliquot was injected into thechromatographic system.
Preparation of the stock and standard solutions. Thestock solutions of mitiglinide (1 mg/mL) and the internalstandard (1 mg/mL) were separately prepared in methanol.Standard solutions of mitiglinide at concentration of 100,10 and 1 μg/mL, and 100 and 10 ng/mL were prepared byserial dilution of mitiglinide stock solution with methanol inseparate 10 mL volumetric flasks. A solution containing 10 μg/mL of nateglinide was also obtained by dilution of the inter-nal standard stock solution. All standard solutions werestored at 4°C.
Preparation of calibration curves and quality controlsamples. Calibration standards of mitiglinide were preparedat the concentration levels of 0.5, 2, 10, 50, 100, 500, 1000,2000 and 4000 ng/mL by spiking an appropriate amountof the standard solutions in 0.5 mL blank plasma. The calibra-tion curve was prepared and assayed along with qualitycontrol (QC) samples. QC samples were prepared in 0.5 mLblank plasma at three levels of 1, 100 and 3000 ng/mL, andstored at −20°C.
Method validation. A calibration curve was constructedfrom a blank sample (a plasma sample processed without theIS) and nine non-zero samples covering the total range of0.5–4000 ng/mL. The calibration curves were generated usingthe ratio of the peak area of mitiglinide to the IS vs theconcentration of mitiglinide with a weight (1/C2) factor. The
Figure 1. The structure of (A) mitiglinide (the state ofadministration), (B) mitiglinide (the state of detection),(C) nateglinide.
Copyright © 2008 John Wiley & Sons, Ltd. Biomed. Chromatogr. 22: 873–878 (2008)DOI: 10.1002/bmc
Quantification of mitiglinide in human plasma 875ORIGINAL RESEARCH
LLOQ was defined as the lowest concentration on thecalibration curve at which the maximum acceptable deviationwas set at 20%, and it was established using five samplesindependent of standards (DHHS/FDA/CDER, 2001).
Validation samples were prepared and analyzed on threeseparate runs to evaluate the accuracy and the intra- andinter-run precisions of the analytical method. The accuracyas well as the precision was determined by analyzing fivereplicates at three QC levels along with one standard curvein each run. The acceptance criterion for intra- and inter-runprecisions was 15% or better and that for the accuracy was100 ± 15% or better for QC samples.
The extraction recoveries of mitiglinide at three QC levelswere determined by comparison of the peak areas of mitiglinideextracted from plasma samples with that of mitiglinide dis-solved in the blank plasma sample’s reconstituted solution (thefinal solution of blank plasma after extraction and reconstitution).
The stability of mitiglinide in plasma under different tem-perature and timing conditions was evaluated. QC sampleswere subjected to short-term room temperature conditions,to long-term storage conditions (−20°C) and to three freeze–thaw stability studies. All the stability studies were conductedat two concentration levels (1 and 3000 ng/mL as low andhigh values) with three determinations for each.
Pharmacokinetic study. The validated method was appliedto evaluate the pharmacokinetics of mitiglinide. Thirty peoplewere divided into three groups with five males and fivefemales in each. The demographic data for these volunteerswere mean age 34.1 years and mean weight 59.5 kg. Followingan overnight fast, the volunteers received mitiglinide tabletscontaining 5, 10 or 20 mg mitiglinide. Blood samples werecollected pre-dose and at 5, 10, 15, 20, 30, 45 and 60 min,and 1.5, 2, 3, 5, 8, 12 and 15 h pose-dose. The blood samplesobtained were frozen at −80°C until analysis.
The pharmacokinetics of mitiglinide was evaluated. Themaxium plasma concentration (Cmax) and the time to reach it(Tmax) were noted directly. The DAS 2.0 was used for calcula-tion of the pharmacokinetic parameters: t1/2 (elimination half-life), AUC(0–15) (the area under the plasma concentration–timecurve from 0 to 15 h), AUC(0–∞) (the area under the plasmaconcentration–time curve from 0 to infinity).
RESULTS AND DISCUSSION
Selection of the IS
It is important to choose the appropriate internal stand-ard to achieve acceptable method performance,especially with LC-MS/MS, where matrix effects canlead to poor analytical results. We chose nateglinide(Fig. 1) as the internal standard, as it is structurallyrelevant to mitiglinide and commercially available. Inaddition, the behavior of its retention time is similarto that of mitiglinide. Clean chromatographs wereobtained and no significant direct interference in theMRM channels at the relevant retention times wasobserved.
LC-MS/MS conditions
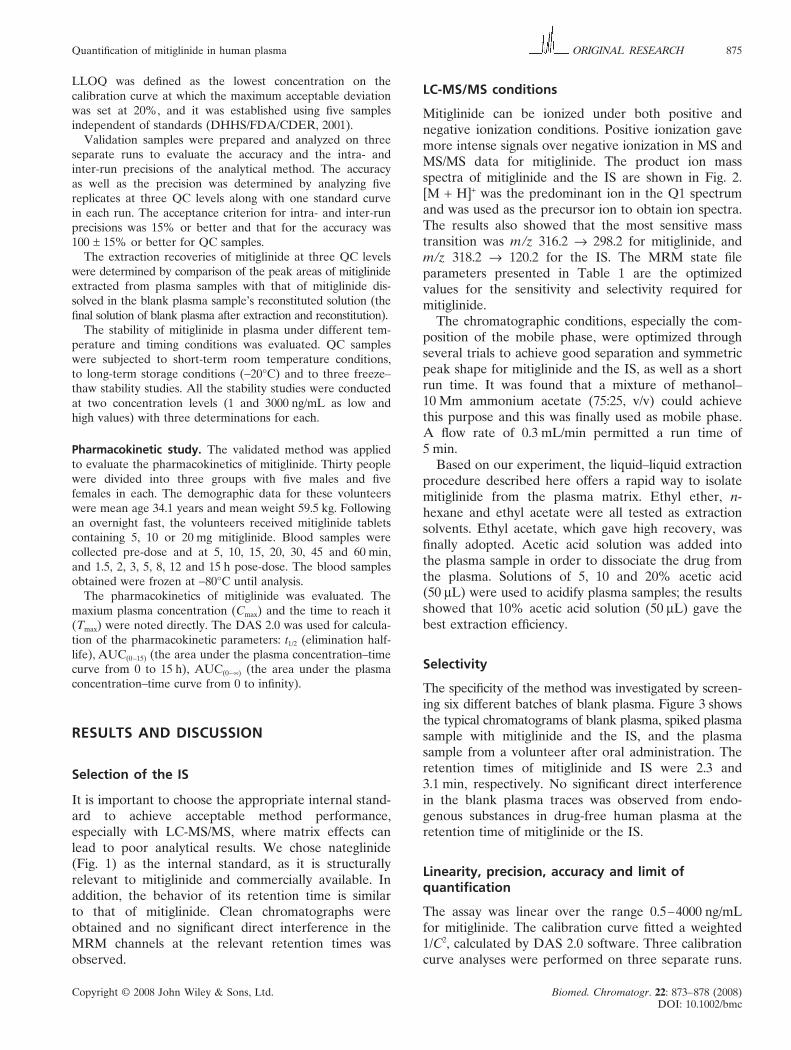
Mitiglinide can be ionized under both positive andnegative ionization conditions. Positive ionization gavemore intense signals over negative ionization in MS andMS/MS data for mitiglinide. The product ion massspectra of mitiglinide and the IS are shown in Fig. 2.[M + H]+ was the predominant ion in the Q1 spectrumand was used as the precursor ion to obtain ion spectra.The results also showed that the most sensitive masstransition was m/z 316.2 → 298.2 for mitiglinide, andm/z 318.2 → 120.2 for the IS. The MRM state fileparameters presented in Table 1 are the optimizedvalues for the sensitivity and selectivity required formitiglinide.
The chromatographic conditions, especially the com-position of the mobile phase, were optimized throughseveral trials to achieve good separation and symmetricpeak shape for mitiglinide and the IS, as well as a shortrun time. It was found that a mixture of methanol–10 Mm ammonium acetate (75:25, v/v) could achievethis purpose and this was finally used as mobile phase.A flow rate of 0.3 mL/min permitted a run time of5 min.
Based on our experiment, the liquid–liquid extractionprocedure described here offers a rapid way to isolatemitiglinide from the plasma matrix. Ethyl ether, n-hexane and ethyl acetate were all tested as extractionsolvents. Ethyl acetate, which gave high recovery, wasfinally adopted. Acetic acid solution was added intothe plasma sample in order to dissociate the drug fromthe plasma. Solutions of 5, 10 and 20% acetic acid(50 μL) were used to acidify plasma samples; the resultsshowed that 10% acetic acid solution (50 μL) gave thebest extraction efficiency.
Selectivity
The specificity of the method was investigated by screen-ing six different batches of blank plasma. Figure 3 showsthe typical chromatograms of blank plasma, spiked plasmasample with mitiglinide and the IS, and the plasmasample from a volunteer after oral administration. Theretention times of mitiglinide and IS were 2.3 and3.1 min, respectively. No significant direct interferencein the blank plasma traces was observed from endo-genous substances in drug-free human plasma at theretention time of mitiglinide or the IS.
Linearity, precision, accuracy and limit ofquantification
The assay was linear over the range 0.5–4000 ng/mLfor mitiglinide. The calibration curve fitted a weighted1/C2, calculated by DAS 2.0 software. Three calibrationcurve analyses were performed on three separate runs.
Copyright © 2008 John Wiley & Sons, Ltd. Biomed. Chromatogr. 22: 873–878 (2008)DOI: 10.1002/bmc
876 Y. Zhang et al.ORIGINAL RESEARCH
The mean equation of the calibration curve obtainedfrom three batches in method validation was f =0.001366 + 0.004538 × C (r = 0.995) for mitiglinide,where f represents the mitiglinide peak area to theIS peak area ratio and C represents the mitiglinideconcentration.
The intra- and inter-run precision and accuracy ofthe assay assessed by running a single batch of samplescontaining a calibration curve and five replicates ateach QC level. The precision was calculated using one-way ANOVA. The results, summarized in Table 2,demonstrate that the precision and accuracy values arewithin the acceptable range and the method is accurateand precise.
The LLOQ of mitiglinide was verified in this way(0.5 ng/mL). The data for the LLOQ are shown inTable 3.
Extraction recovery and matrix effects
The extraction recovery of mitiglinide was calculatedby analyzing five replicates at 1, 100 and 3000 ng/mL.The extraction recoveries of the assay were 73.8 ± 6.8,73.5 ± 6.3 and 72.8 ± 3.1% for the low, middle and highconcentration levels, respectively.
The matrix effect was defined as the direct or in-direct alteration or interference in response due to thepresence of unintended or other interfering substances
Table 2. Precision and accuracy of the assay for the determi-nation of mitiglinide in human plasma (n ===== 3 runs, five repli-cates per run)
Added C Found C Inter-assay Intra-assay(ng/mL) (ng/mL) RSD% RSD%
1.014 0.9677 13.6 4.8100.4 109.9 15.0 2.33012 3265.9 9.7 4.5
Table 3. Accuracy and precision for the assay of LLOQ (n ===== 5)
Added C Found C Mean RSD RE(ng/mL) (ng/mL) (ng/mL) (%) (%)
0.5020 0.5322 6.00.5020 0.5713 13.80.5020 0.5601 0.5654 3.9 11.60.5020 0.5926 18.00.5020 0.5710 13.7
Figure 2. Full-scan positive ion turbolonspray product ion mass spectra of (A) precursor ion ofmitiglinide, (B) product ion of mitiglinide, (C) precursor ion of IS and (D) product ion of IS.

Copyright © 2008 John Wiley & Sons, Ltd. Biomed. Chromatogr. 22: 873–878 (2008)DOI: 10.1002/bmc
Quantification of mitiglinide in human plasma 877ORIGINAL RESEARCH
in the samples. It was evaluated by comparing the peakarea of the analytes dissolved in the blank plasmasample’s reconstituted solution (the final solution ofthe blank plasma after extraction and reconstitution)with that of the analytes dissolved in the mobile phase.Three different concentration levels of mitiglinide (1,100 and 3000 ng/mL) were evaluated by analyzing fivesamples at each level. The blank plasma used in thisstudy was from five different batches of the blankplasma. If the peak area ratio is less than 85% or morethan 115%, a matrix effect is implied. In this study,there was no matrix effect of the analytes.
Stability
The stability results are summarized in Table 4. Thedata showed that no significant degradation of mitig-linide in plasma was observed at room temperature for8 h and during the three freeze–thaw cycles. Mitiglinidein plasma at −20°C was stable for 2 weeks.
Pharmacokinetic studies
The method was successfully applied to determine theplasma concentration of mitiglinide up to 15 h after
Figure 3. Typical chromatograms of: (A) blank plasma; (B) LLOQ for mitiglinide (0.5 ng/mL) in plasma and IS; (C) plasma spiked with mitiglinide (100 ng/mL) and IS; (D) plasmaobtained from a volunteer at 8 h after oral administration of 10 mg mitiglinide.

Copyright © 2008 John Wiley & Sons, Ltd. Biomed. Chromatogr. 22: 873–878 (2008)DOI: 10.1002/bmc
878 Y. Zhang et al.ORIGINAL RESEARCH
Table 4. Stability data of Mitiglinide in human plasma under various conditions (n ===== 3)
Added C Found C RSD AccuracyStorage conditions (ng/mL) (ng/mL) (%) (mean ± SD%)
Room temperature for 8 h 1.004 0.9973 2.7 99.3 ± 2.73012 2803.9 4.2 93.1 ± 3.9
Three free-thaw cycles 1.004 1.033 7.6 102.8 ± 7.83012 3300.1 1.0 109.6 ± 1.1
Two weeks at −20°C 1.004 1.083 2.0 107.9 ± 2.23012 2812.4 3.0 93.4 ± 2.8
CONCLUSIONS
A sensitive, specific and accurate method is describedfor the quantification of mitiglinide in human plasmaby LC-MS/MS in positive electrospray ionization modeusing MRM and fully validated according to commonlyaccepted criteria. The desired sensitivity of mitiglinidewas achieved with an LLOQ of 0.5 ng/mL, and the shortrun time was suitable for analysis of the large batchesof samples. The method has been successfully used forpharmacokinetic studies.
REFERENCES
DHHS/FDA/CDER. Guidance for Industry, Bioanalytical MethodValidation. US Department of Health and Human Services, Foodand Drug Administration, Center for Drug Evaluation and Research,May 2001.
Liang Y, Sun J, Xie L, Kang A, Xie Y, Chen WD, Lv H andWang GJ. Simple, sensitive, and rapid LC-ESI-MS method forquantification of mitiglinide in human urine. Chromatographia2007; 66: 165.
Ojima K, Kiyono Y and Kojima M. Pharmacological and clinicalprofile of mitiglinide calcium hydrate (Glufast), a new insulino-tropic agent with rapid onset. Nippon Yakurigaku Zasshi 2004; 124:245–255.
Reimann F, Proks P and Ashcroft FM. Effect of mitiglinide (S 21403)on Kir6.2/SUR1, Kir6.2/SUR2A and on Kir6.2/SUR2B types ofATP-sensitive potassium channel. British Journal of Pharmacology2001; 132: 1542.
Sunaga Y, Gonoi T, Shibasaki T, Ichikawa K, Kusama H, Yano Hand Seino S. The effects of mitiglinide KAD-1229, a new anti-diabetic drug, on ATP-sensitive K+ channels and insulin secretion:comparison with the sulfonylureas and nateglinide. European Journalof Pharmacology 2001; 431: 119.
Yu L and Zeng S. Determination of mitiglinide in rat plasma byhigh-performance liquid chromatography with UV detection.Journal of Chromatography B 2006; 834: 204.
Table 5. Pharmacokinetic parameters of 10 healthy volunteers after oral administration of Mitiglinide
Parameters 5 mg 10 mg 20 mg
Cmax (ng/mL) 613.8 ± 62.6 1167.0 ± 342.6 2482.4 ± 409.4Tmax (h) 0.3 ± 0.1 0.4 ± 0.2 0.5 ± 0.4t1/2 (h) 1.9 ± 0.5 2.8 ± 1.0 1.9 ± 0.4AUC(0–15) (μg h/L) 823.7 ± 76.2 1578.9 ± 236.6 3739.8 ± 373.4AUC(0–∞) (μg h/L) 825.9 ± 76.4 1589.4 ± 239.5 3748.1 ± 375.2Cl/F (L/h) 6.1 ± 0.6 6.4 ± 0.9 5.4 ± 0.6
Figure 4. Mean drug plasma concentration versus time curveof mitiglinide in 10 volunteers after oral administration ofmitiglinide.
oral administration of 5, 10 or 20 mg mitiglinide to thehealthy volunteers. Mean plasma concentration–timeprofile are presented in Fig. 4. The pharmacokineticparameters are listed in Table 5. The data in the single-dose study show the linear relationship (r 2 = 0.99)between AUC0–15 and the dose. There was no signifi-cant difference of Tmax and t1/2 among the three dosages,indicating the pharmacokinetic linearity of the threedosages within the studied dose range. Therefore, theamount of mitiglinide excreted by volunteers was alinear function of dose.


![Electrospray ionization mass spectrometry of ...93)85031-R.pdfElectrospray Ionization Mass Spectrometry of Phosphopeptides Isolated by On-Line ... this purpose [19~22]. Immobilized](https://img.dokumen.tips/doc/110x75/5ad660d07f8b9a6b668b8d17/electrospray-ionization-mass-spectrometry-of-9385031-rpdfelectrospray-ionization.jpg)