Embed Size (px)
Citation preview

Report of Programme Committee D
TRIENNIUM 2003 – 2006
Chairperson Chawki Mohamed Rahal
Algeria
LIQUEFIED NATURAL GAS
June 2006


ABSTRACT This report details the work undertaken by Programme Committee D during the triennium 2003–2006. This report of Programme Committee D consists of three parts. The first describes the results achieved by the Committee Management with respect to the objectives assigned as part of the Triennial Work Program adopted in 2003. The second part consists of the detailed report prepared by the Vice Chairman of the Committee which gives the situation of the LNG industry worldwide in 2004. The third part describes the results achieved by the three Study Groups which have constituted the core of the activities of the Committee. The subjects relating to LNG are as follows: • LNG Quality • Safety and Technology Developments in LNG Terminals and Vessels • The future of the LNG spot market. These reports have been the result of intense activities of PGC D members which were joined by a number of invited experts who accepted to participate in these studies. These themes which show that the LNG industry as a whole is experiencing unprecedented vitality and growth will be presented during the World Gas Conference at the PGC D Committee Sessions and Expert forums together with the contribution of a large number of authors. The approved Triennial Work Program, the membership of Programme Committee D and the meeting schedule of its members are listed in Annex 1, Annex 2 and Annex 3 respectively.
RESUME Ce rapport contient le détail des travaux entrepris par le Comité Programme D durant le triennat 2003-2006. Ce rapport du Comité Programme D comprend trois parties. La première partie décrit les résultats accomplis par le Comité Management en ce qui concerne les objectifs qui lui ont été assignés dans le cadre du Programme Triennal de Travail adopté en 2003. La deuxième partie comporte le rapport détaillé préparé par le Vice Président du Comité donnant la situation de l’industrie mondiale du GNL en 2004. La troisième partie décrit les résultats accomplis par les trois Groupes d’Etude au centre des activités du Comité. Les sujets ayant trait au GNL sont comme suit : Qualité du GNL Sécurité et Développements Technologiques dans les Terminaux et Navires
Méthaniers Le futur du marché Spot du GNL
Ces rapports sont le résultat des activités intenses des membres du PGC D auxquels se sont joints sur invitation un certain nombre d’experts qui ont accepté de participer à ces études. Ces thèmes, qui montrent que l’industrie du GNL dans son ensemble fait preuve d’une vitalité et d’une croissance sans précédents, seront présentés, en même temps que les contributions de nombreux auteurs, durant le World Gas Conférence aux Sessions du Comité PGC D et aux Forums d’Experts. Le Programme Triennal de Travail, la liste des Membres du Comité PGC D et le calendrier de réunion de ses Membres se trouvent respectivement en Annexe1, Annexe 2 et Annexe 3.

TABLE OF CONTENTS
Abstract
1. THE ACTIVITIES OF PROGRAMME COMMITTEE D DURING THE TRIENNIUM 2003-2006
2. THE WORLDWIDE LNG INDUSTRY AT THE END OF 2004
3. REPORT OF STUDY GROUP D1: “LNG QUALITY”
4. REPORT OF STUDY GROUP D2: “SAFETY AND TECHNOLOGY
DEVELOPMENTS IN LNG TERMINALS AND VESSELS”
5. REPORT OF STUDY GROUP D3: “THE FUTURE OF THE LNG SPOT MARKET”
6. ACKNOWLEDGEMENTS
Appendix A: Triennial Work Program of PGCD Appendix B: Membership of the PGCD and Study Groups Appendix C: Committee Meetings.

5
1. THE ACTIVITIES OF PROGRAMME COMMITTEE D DURING THE
TRIENNIUM 2003-2006
Programme Committee D has had a very dynamic and active triennium at a time where LNG is experiencing much renewed interest in the world and this will be an ongoing trend for the coming years as natural gas is more and more appreciated for its environment friendly quality. PGC D will, as part of its activities in this triennium has set itself the following objectives:
- Monitor the LNG industry, - Attract old and new actors to participate or take an active role in the IGU activities, - Rationalise the LNG activities of IGU in cooperation with the other international LNG
organisations, - Monitor and support when necessary the activities of the Working Committees 1-5 as well as
those of the other Programme Committees by providing the necessary expertise in the field of LNG,
- Organise workshops and/or participate at conferences, - PGC D will also perform, during this triennium, studies on LNG topics of interest to IGU
Members. Experts should be invited to participate to PGC D activities particularly for the Study Groups.
1.1. MONITOR THE LNG INDUSTRY Traditionally, the Committee in charge of LNG in the IGU produces a report that reports the trend experienced by the LNG industry during the triennium. This document is a very rich and complete database for the LNG industry worldwide. It is a task generally assigned to the Vice Chairman of the Committee and this document is a compilation of data from various sources validated by the members of the Committee which represent a large part of the Industry. This complete report, the LNG Industry worldwide in 2004 follows this chapter and will be presented at the World gas Conference where a update of the data till the end of 2005 will be provided. 1.2. ATTRACT OLD AND NEW ACTORS OF THE LNG INDUSTRY It has been felt by Committee members that an attempt should be made to attract the maximum number of representatives of countries and associated members affiliated to the IGU which are involved in one way or another with the LNG industry.
In order to achieve this objective, the Committee Management has been in contact with the national associations of countries which are already involved in LNG activities. As such the following countries have been approached: Brunei, Egypt, India, Indonesia, Libya, Malaysia, Nigeria, Oman, Portugal, People’s Republic of China, Qatar, Republic of China Taiwan, Trinidad and Tobago, Turkey, and United Arab Emirates. This contact has resulted over the triennium in the nomination of Members from Indonesia, Malaysia, People’s Republic of China, Qatar, Republic of China Taiwan and United Arab Emirates.
It is suggested that the Management of the IGU as well as the management of PGC D continues this effort of attempting to attract members from these countries as they already play a role in LNG.
Overall, it can be said that during the triennium 2003-2006, seven (7) LNG existing Exporting out of a total of twelve (12) and three (3) future Exporting countries during the next triennium out of eight (8) indicating a representing 50% of the potential of Exporters. Table 1 below give the detailed status of the LNG Exporting countries at the end of triennium 2003-2006 as well as the perspectives for triennium 2006-2009.

6
Table 1 PGCD Membership (Exporting Countries)
Exporting Countries Country name
Member of PGCD
2003-2006
To be invited to
PGCD Algeria 1 Australia 1 Brunei 1 Indonesia 1 Libya 1 Malaysia 1 Nigeria 1 Oman 1 Qatar 1 Trinidad and Tobago 1 United Arab Emirates 1 USA 1
Existing
Sub Total 7 5 Angola 1 Egypt 1 Equatorial Guinea 1 Iran 1 Norway 1 Peru 1 Russia 1 Yemen 1
New 2005-2009
Sub Total 3 5 TOTAL 10 10
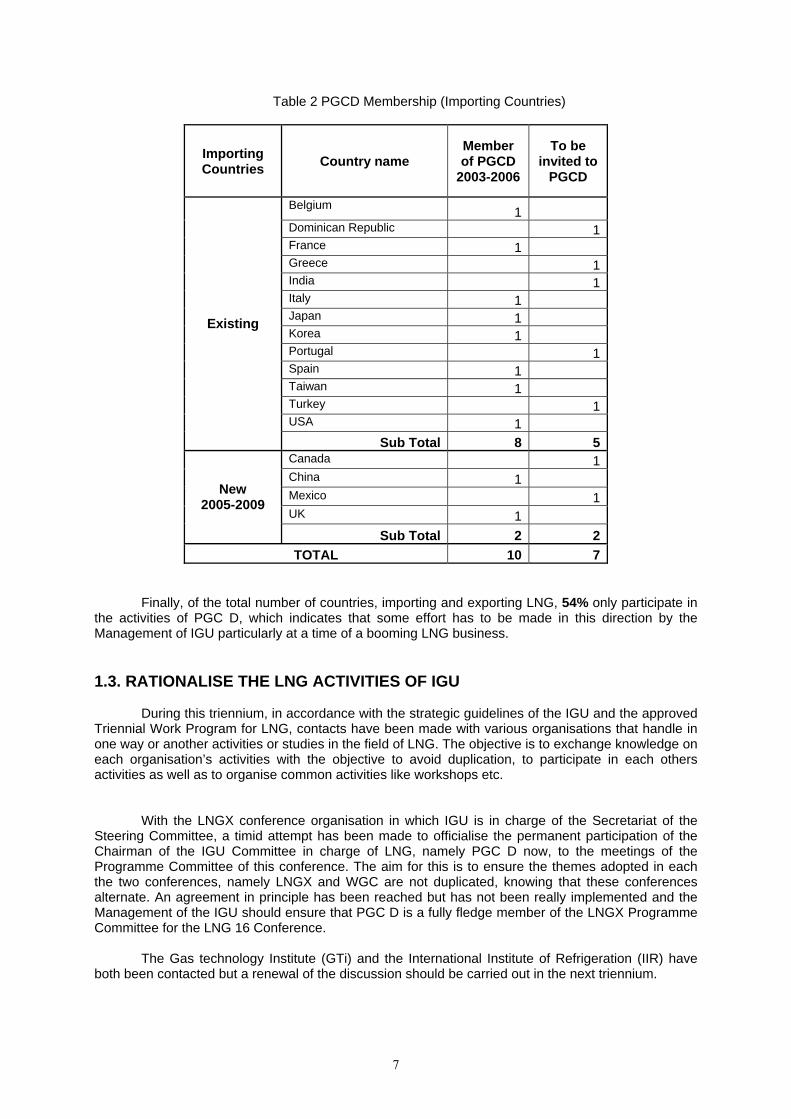
Eight (8) out of thirteen (13) existing LNG importing countries and two (2) out of (4) future
importers during the coming triennium participate in the PGC D activities representing 59 %of the potential of importers. Table 2 below give the detailed status of the LNG Importing countries at the end of triennium 2003-2006 as well as the perspectives for triennium 2006-2009.
7
Table 2 PGCD Membership (Importing Countries)
Importing Countries Country name
Member of PGCD
2003-2006
To be invited to
PGCD
Belgium 1 Dominican Republic 1 France 1 Greece 1 India 1 Italy 1 Japan 1 Korea 1 Portugal 1 Spain 1 Taiwan 1 Turkey 1 USA 1
Existing
Sub Total 8 5 Canada 1 China 1 Mexico 1 UK 1
New 2005-2009
Sub Total 2 2 TOTAL 10 7
Finally, of the total number of countries, importing and exporting LNG, 54% only participate in
the activities of PGC D, which indicates that some effort has to be made in this direction by the Management of IGU particularly at a time of a booming LNG business.
1.3. RATIONALISE THE LNG ACTIVITIES OF IGU
During this triennium, in accordance with the strategic guidelines of the IGU and the approved Triennial Work Program for LNG, contacts have been made with various organisations that handle in one way or another activities or studies in the field of LNG. The objective is to exchange knowledge on each organisation’s activities with the objective to avoid duplication, to participate in each others activities as well as to organise common activities like workshops etc.
With the LNGX conference organisation in which IGU is in charge of the Secretariat of the Steering Committee, a timid attempt has been made to officialise the permanent participation of the Chairman of the IGU Committee in charge of LNG, namely PGC D now, to the meetings of the Programme Committee of this conference. The aim for this is to ensure the themes adopted in each the two conferences, namely LNGX and WGC are not duplicated, knowing that these conferences alternate. An agreement in principle has been reached but has not been really implemented and the Management of the IGU should ensure that PGC D is a fully fledge member of the LNGX Programme Committee for the LNG 16 Conference.
The Gas technology Institute (GTi) and the International Institute of Refrigeration (IIR) have both been contacted but a renewal of the discussion should be carried out in the next triennium.
8
SIGTTO, the Society of International Gas Tanker and Terminal Operators, has been approached and the result was conclusive since the organisation through its Chairman has participated in PGC D meetings and has been active in Study Group D2.
For the International LNG Alliance (ILNGA), now taken over by USEA, there has not been a need to develop cooperation since the member representing USA was the Executive Director of this organisation. Grounds for cooperation have yet however to be defined a formalised in view of the integration of ILNGA within USEA. PGC D has participated in reviewing some of the materials prepared within ILNGA, like a brochure it has developed on LNG in view of the need for communication towards the public in the USA and in a study performed by FERC on the interchangeability of gas.
As far as the International Association of Natural Gas Vehicles (IANGNV) is concerned, no direct contact has been established. It was expected that if there was a need, it would be coordinated through WOC5 which had anticipated developing cooperation with this organisation.
Although a cooperation agreement with the World Energy Council (WEC) has been signed by the IGU Management, there has been no interface between this organisation and PGC D as far as LNG is concerned. Perhaps in the next triennium more attention should be drawn to the LNG program it wants to develop.
With the World Petroleum Council (WPC), in line with the framework of the cooperation defined by the IGU Presidency, WPC has invited PGC D to chair a round table on LNG in its 18th Conference held in Johannesburg on 28th September 2005 with the theme : “Distribution and Transportation of Gas : LNG or Pipeline ? The cooperation has been a success and it is understood that a more extensive cooperation could follow between the two organisations on Natural Gas but also on LNG in particular.
Finally, a ground breaking agreement has been reached with the International Group of Liquefied Natural Gas Importers (GIIGNL) and resulted in the organisation of an annual meeting between the Technical Committee of GIIGNL and the PGC D to exchange information on activities of the two organisations. The first meeting held in Paris on 18th May 2005 included the participation of SIGTTO and Gas LNG Europe (GLE). With the presentations of each organisation’s activities, an topics matrix has been developed and distributed. This matrix which constitutes a data base on the activities of these organisations will be reviewed in a joint meeting on a yearly basis. In effect, the next joint meeting is scheduled to take place at the time of the coming World Gas Conference in Amsterdam. 1.4. MONITOR AND SUPPORT IGU COMMITTEES ON LNG RELATED MATTERS After reviewing the overall Triennial Work Program of the IGU, PGC D identified potentially three Committee/Task Forces with which there could be an interface. These are:
• Working Committee 5 in charge of Utilisation of natural Gas for issues on gas utilisation in the form of LNG,
• Programme Committee B for issues, • Task Force Research and Development in order to cover LNG research.
The first two Committees 5 and A have not clearly indicated a need for an exchange on LNG and therefore no common activity has been identified even though a joint meeting has been held with Programme Committee B in Nordwijkerhout (Netherlands). For R&D, PGC D nominated a member to represent it in the activities of the task force. This member participated in the R&D survey organised by this Task Force.

9
1.5. ORGANISE WORKSHOPS AND/OR PARTICIPATE AT CONFERENCES During this triennium, various communications have been done by Members of PGC D in various Conferences. The following papers have been presented:
• Panel 8 - 4th LAGCEC – Rio de Janeiro 28th April 2004 : “The new rise of LNG” , Dr. C.M. RAHAL
• LNG & GTL: World-wide and Russian prospects - Moscow 26 May 2004: “vvvv”, Dr M. Taleb
• IGRC 2004 - Vancouver - 1-4 November 2004: "Gas technology in realising a sustainable energy future", Mr. Rob NAGELVOORT.
• FLAME 2005 – Amsterdam – xx February 2005: "Assessing the Impact of Gas Quality on the
LNG market ", Rob KLEIN NAGELVOORT.
10
6. THE LNG INDUSTRY WORLD WIDE AT THE END OF 2004
PGC D LNG SURVEY
“The world-wide LNG industry at the end of 2004”
Vice Chairman/Vice Président
Seiichi UCHINO
Japan
11
ABSTRACT
As is customary for the Committee in charge of LNG within the International Gas Union, presently named Program Committee D, a report has been prepared during each triennium to show the evolution of the LNG industry as a whole during the triennium 2003-2006.
The Vice Chairman of the Committee, held by Japan for triennium 2003 - 2006, customarily has been engaged in the preparation of this report.
This report, based on various related data from different sources, referenced in the report, provides information and trends of the world LNG industry. It covers all segments of the LNG chain namely LNG plants, LNG carriers and LNG receiving terminals in terms of capacity and number of units, type of processes or technology as well the import export trade statistics for the period 2001-2004.
The presentation of this report at the 23rd World Gas Conference in Amsterdam will include an update of the data contained in this report for the year 2005.
Résumé
Comme il est de coutume pour le Comité ayant la charge du GNL au sein de l’Union Internationale de l’Industrie du Gaz, dénommé « Program Committee D », un rapport est préparé pendant chaque triennat pour montrer l’évolution de l’industrie du GNL d’une façon générale pendant le triennat 2003-2006.
Il revient comme de coutume, au Vice Président du Comité, position tenue par le Japon pour 2003-2006, de préparer ce rapport.
Ce rapport, basé sur une variété de données provenant de différentes sources référencées dans le rapport, procure des informations pertinentes et des tendances de l’‘industrie mondiale du GNL. Ce rapport couvre tous les segments de la chaine GNL, en particulier les unités de liquéfaction, les navires de transport ainsi que les terminaux de réception, ceci en termes de capacité, et nombre d’unités, de type de procédés ou de technologie utilisés. Il comporte aussi les statistiques du commerce import/export pour la période 2001-2004.
La présentation de ce rapport au 23ème Congrès Mondial du Gaz à Amsterdam comprendra une mise à jour des données contenues dans ce rapport pour l’année 2005.

12
TABLE OF CONTENTS
2.1. Foreword 2.2. Key Facts 2.3. Amount of LNG Import and Export
Overview LNG trade volume Amount of export by country Amount of import by country Interregional import and export volume by region Spot market
2.4. LNG Liquefaction plants Overview Liquefaction capacity Liquefaction capacity by region Liquefaction capacity by country Liquefaction train capacity Liquefaction process Newly initiated plants and trains Terminals and trains under construction or in planning
2.5. LNG Receiving Terminals Overview Number of receiving terminals by country Number of receiving terminals by region Number of receiving terminals by year of start-up LNG storage capacity Maximum capacity of LNG carriers able to berth Gas sendout capacity Newly initiated terminals Terminals under construction or in planning
2.6. LNG Carriers Overview Capacity Number of commissions Tank type
2.7. Conclusion 2.8. References

13
2.1. FOREWORD More than 40 years have passed since the first commercial export of LNG in the world. Utilization
of LNG has been rapidly spreading in recent years owing to the growing energy needs of the world. The growth of the LNG traded volumes is the highest of all fuels thanks to the environment-friendly characteristics of natural gas and the transportability of LNG.
Compiled from various data, this report presents in one document the status of the LNG industry in 2004 in all its segments, LNG liquefaction plants, receiving terminals, LNG and LNG carriers as well as provides import and export statistics to attest of the growing importance of this form of energy.
The LNG committee of the IGU has traditionally prepared this report, and the one for the preceding term (2000 - 2003) profiled the LNG industry as of 2001. This latest edition, in addition to the status of the industry in 2004, includes comparisons with 2001. Finally, the report would not be complete without some comments on the outlook for LNG liquefaction and receiving terminals and LNG carriers.
2.2. KEY FACTS
The key facts for the LNG industry over the years 2001 - 2004 were as follows. 1) The volume of LNG trade reached 142.4 million tons and increased 35 million tons, or 33%,
from 2001. 2) The share of spot trade in LNG has been increasing substantially in recent years to reach
19% of total LNG trade volumes in 2004. 3) The world LNG liquefaction capacity totaled 139.5 million tons per year in 2004 and
increased 18.1 million tons since 2001. 4) The number of liquefaction trains in operation numbered 73 in 12 countries. 5) The number of LNG receiving terminals in operation around the world reached 47. These
terminals were located in 13 countries on three continents. 6) 174 LNG carriers were in operation. The combined capacity of these ships is 20.72 million
cubic meters, which has increased by 6.45 million cubic meters, or 45%, from 2001, for an average of 119,000 cubic meters per carrier.
2.3. AMOUNT OF LNG IMPORT AND EXPORT Overview
In 2004, the volume of LNG trade reached 142.4 million tons. Countries exporting LNG numbered 12, the same as in 2001 (i.e., Algeria, Libya, Nigeria, United
States, Trinidad and Tobago, Australia, Brunei, Indonesia, Malaysia, United Arab Emirates, Oman, and Qatar). Over the same period, the number of countries importing LNG increased by three (Portugal, India, and Dominican Republic) to 13 (the other ten being Japan, South Korea, Taiwan, United States, Italy, Spain, Belgium, France, Turkey, and Greece).
LNG trade volume Figure 1 shows the trend of the LNG trade volume over the years 1984 - 2004. Over the years
2001 - 2004, liquefaction capacity increased substantially due to the construction of new, and expansion of existing, plants and trains. As a result, the 2004 LNG trade volume represented a hefty increase of 35 million tons, or 33%, from 2001. The LNG trade volume is expected to continue to increase rapidly, in light of the many plans for addition and expansion of liquefaction plants, trains, and receiving terminals.

14
020406080
100120140160
1984 1985 1986 1987 1988 1989 1990 1991 1992 1993 1994 1995 1996 1997 1998 1999 2000 2001 2002 2003 2004
Year
Trad
e Q
uant
ityMTPY
Fig.1 LNG Trade Quantity from 1984 to 2004
Source: "BP Statistical Review of World Energy June 2005"
Amount of export by country The amount of LNG export by each country is shown below.
Table 1 LNG Export per Country in 2004 Country Amount MTPY
Indonesia 26.8 Malaysia 22.1 Algeria 20.6 Qatar 19.3
Trinidad and Tobago 11.2 Nigeria 10.1
Australia 9.7 Brunei 7.6 Oman 7.2
United Arab Emirates 5.9 USA 1.3 Libya 0.5
Source: "BP Statistical Review of World Energy June 2005" Figure 2 indicates the share breakdown of the 2004 LNG export amount by country, and Figure 3,
4 comparisons with 2001. Indonesia is still the largest exporter, accounting for some 27 million tons or 19% of the total in 2004. The share breakdown of the total LNG export by country remains the same relative to the total liquefaction capacity, however slight variations are observed due to respective operation rate of the liquefaction plants.

15
Nigeria7.1%
Libya0.4%
USA0.9%
TrinidadTobago7.9%
Australia6.8%
Brunei5.3%
Oman5.1%
UAE4.1%
Algeria14.5%
Indonesia18.8%
Malaysia15.6%
Qatar13.5%
Fig.2 LNG Exports per Country in 2004
Source: "BP Statistical Review of World Energy June 2005"
As compared to 2001, the amount of export exhibited increases in the case of Malaysia, Qatar,
Nigeria, and Trinidad and Tobago, where trains have been expanded. Partly because of the increase in the overall export volume, there is a decline in the shares of Indonesia and Algeria, the two largest exporters.
0
5
10
15
20
25
30MTPY
Algeria Nigeria Libye USA TrinidadTobago
Australia Brunei Malaisia Indonesia Oman UAE Qatar
2001
2004
Fig.3 LNG Exports per Country in 2001 and 2004
Source: "BP Statistical Review of World Energy June 2005"
0
5
10
15
20
25
30(%)
Algeria Nigeria Libye USA TrinidadTobago
Australia Brunei Malaisia Indonesia Oman UAE Qatar
2001
2004
Fig.4 LNG Exports per Country in 2001 and 2004 Source: "BP Statistical Review of World Energy June 2005"
16
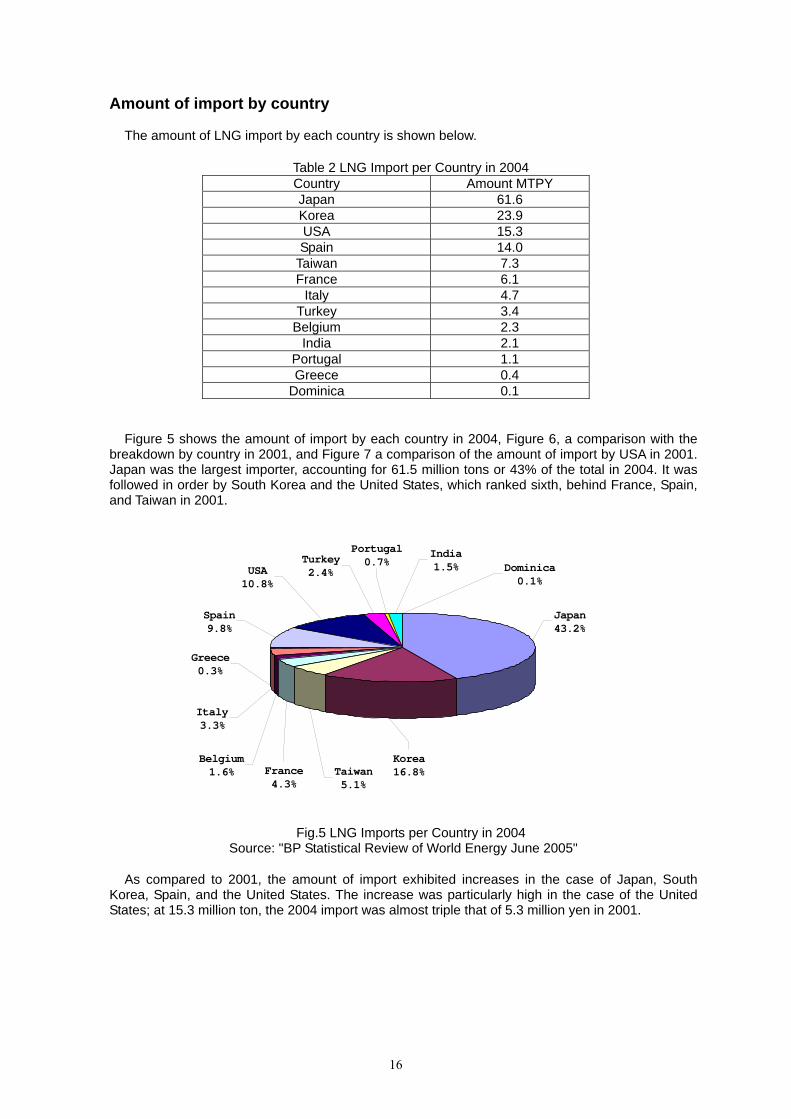
Amount of import by country The amount of LNG import by each country is shown below.
Table 2 LNG Import per Country in 2004 Country Amount MTPY Japan 61.6 Korea 23.9 USA 15.3 Spain 14.0
Taiwan 7.3 France 6.1
Italy 4.7 Turkey 3.4
Belgium 2.3 India 2.1
Portugal 1.1 Greece 0.4
Dominica 0.1
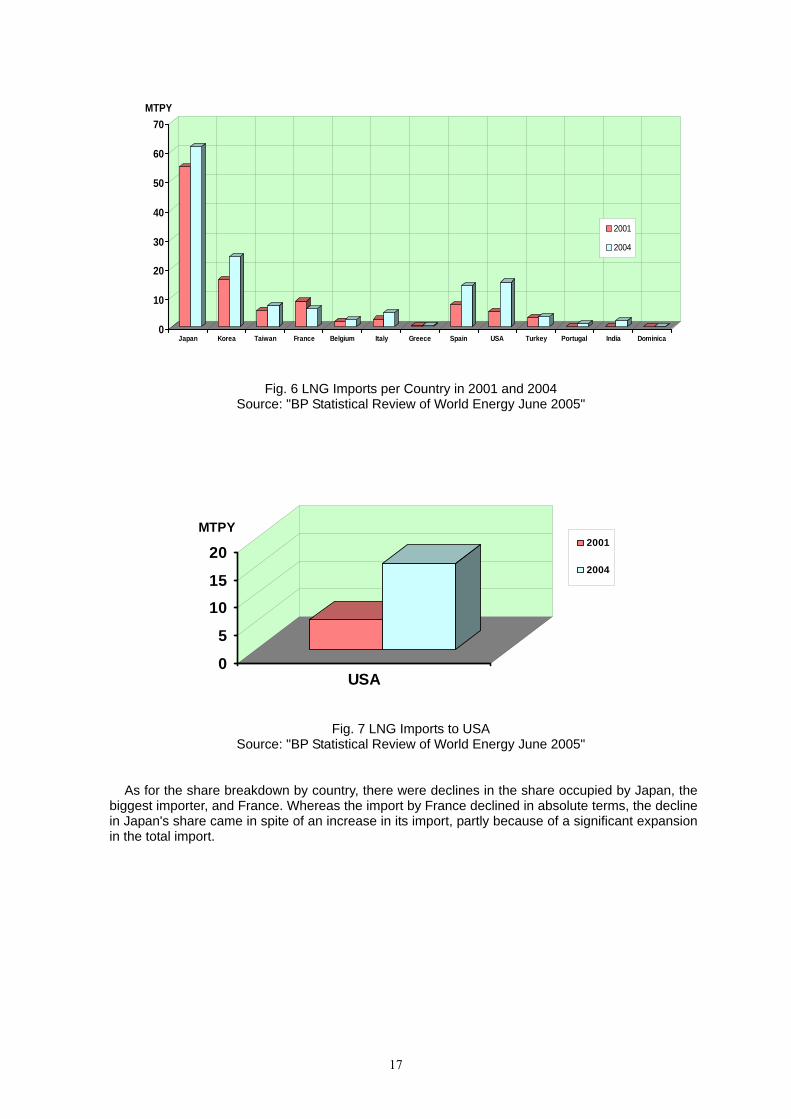
Figure 5 shows the amount of import by each country in 2004, Figure 6, a comparison with the
breakdown by country in 2001, and Figure 7 a comparison of the amount of import by USA in 2001. Japan was the largest importer, accounting for 61.5 million tons or 43% of the total in 2004. It was followed in order by South Korea and the United States, which ranked sixth, behind France, Spain, and Taiwan in 2001.
Japan43.2%
USA10.8%
Spain9.8%
India1.5%
Korea16.8%
Dominica0.1%
Taiwan5.1%
Italy3.3%
France4.3%
Belgium1.6%
Greece0.3%
Portugal0.7%Turkey
2.4%
Fig.5 LNG Imports per Country in 2004 Source: "BP Statistical Review of World Energy June 2005"
As compared to 2001, the amount of import exhibited increases in the case of Japan, South
Korea, Spain, and the United States. The increase was particularly high in the case of the United States; at 15.3 million ton, the 2004 import was almost triple that of 5.3 million yen in 2001.
17
0
10
20
30
40
50
60
70MTPY
Japan Korea Taiwan France Belgium Italy Greece Spain USA Turkey Portugal India Dominica
2001
2004
Fig. 6 LNG Imports per Country in 2001 and 2004 Source: "BP Statistical Review of World Energy June 2005"
0
5
10
15
20MTPY
USA
2001
2004
Fig. 7 LNG Imports to USA Source: "BP Statistical Review of World Energy June 2005"
As for the share breakdown by country, there were declines in the share occupied by Japan, the
biggest importer, and France. Whereas the import by France declined in absolute terms, the decline in Japan's share came in spite of an increase in its import, partly because of a significant expansion in the total import.
18
0
10
20
30
40
50
60
(%)
Japan Korea Taiwan France Belgium Italy Greece Spain USA Turkey Portugal India Dominica
2001
2004
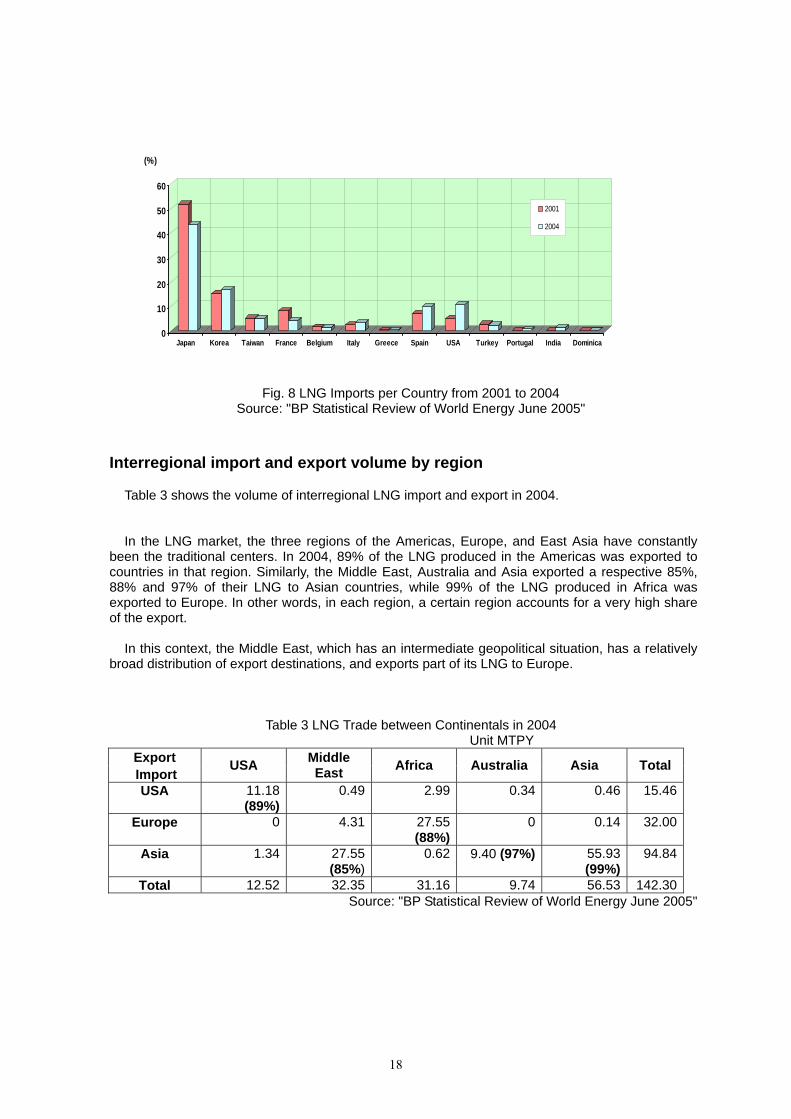
Fig. 8 LNG Imports per Country from 2001 to 2004 Source: "BP Statistical Review of World Energy June 2005"
Interregional import and export volume by region Table 3 shows the volume of interregional LNG import and export in 2004. In the LNG market, the three regions of the Americas, Europe, and East Asia have constantly
been the traditional centers. In 2004, 89% of the LNG produced in the Americas was exported to countries in that region. Similarly, the Middle East, Australia and Asia exported a respective 85%, 88% and 97% of their LNG to Asian countries, while 99% of the LNG produced in Africa was exported to Europe. In other words, in each region, a certain region accounts for a very high share of the export.
In this context, the Middle East, which has an intermediate geopolitical situation, has a relatively
broad distribution of export destinations, and exports part of its LNG to Europe.
Table 3 LNG Trade between Continentals in 2004 Unit MTPY
Export Import
USA Middle East Africa Australia Asia Total
USA 11.18 (89%)
0.49 2.99 0.34 0.46 15.46
Europe 0 4.31 27.55 (88%)
0 0.14 32.00
Asia 1.34 27.55 (85%)
0.62 9.40 (97%) 55.93 (99%)
94.84
Total 12.52 32.35 31.16 9.74 56.53 142.30Source: "BP Statistical Review of World Energy June 2005"

19
Tables 4, 5, and 6 present detailed figures for LNG trade volume in 2002, 2003, and 2004.
Table 4 LNG Trade Quantity in 2002 Unit MTPY
Export
Import USA Trinida
d Oman Qatar UAE Algeria Libya Nigeri
a Australia
Brunei
Indonesia
Malaysia Total
USA 3.42 0.07 0.79 0.60 0.18 0.06 0.06 5.18Puerto Rico 0.46 0.04 0.50
Dominica 0.00Belgium 0.08 2.56 2.64France 0.43 8.16 0.64 9.23Greece 0.40 0.40
Italia 1.76 2.80 4.56Portugal 0.34 0.34
Spain 0.37 0.61 1.76 0.40 4.76 0.50 1.29 0.06 0.06 9.81Turkey 3.26 1.02 4.28India
Japan 1.36 0.87 6.72 4.74 7.78 6.36 18.72
11.60
58.15
Korea 4.38 5.56 0.26 0.19 0.83 5.42 2.48 19.13
Taiwan 3.32 2.28 5.60Total 1.36 4.26 6.37 14.8
7 5.48 21.50 0.50 6.27 8.02 7.31 27.4
6 16.4
2119.
83Source: "BP Statistical Review of World Energy June 2005"
Table 5 LNG Trade Quantity in 2003
Unit MTPY Export
Import USA Trinid
ad Oma
n Qatar UAE Algeria Libya Nigeri
a Australia
Brunei
Indonesia
Malaysia Total
USA 8.57 0.19 0.31 1.21 1.14 0.06 11.48Puerto Rico 0.24 0.24
Dominica 0.59 0.59Belgium 2.52 2.52France 7.36 0.54 7.90Greece 0.44 0.44
Italia 1.62 2.80 4.42Portugal 0.68 0.68
Spain 0.06 0.26 1.50 0.19 5.98 0.60 3.38 0.06 12.03Turkey 3.09 0.90 3.99India 0
Japan 1.31 0.06 1.73 7.24 5.50 8.22 7.14 19.24 13.38 63.82Korea 5.19 6.30 0.18 0.14 0.59 5.54 3.03 20.98Taiwan 3.74 2.24 5.98Total 1.31 9.53 7.37 15.35 5.69 22.40 0.60 9.43 8.42 7.74 28.53 18.71 135.07
Source: "BP Statistical Review of World Energy June 2005"
20
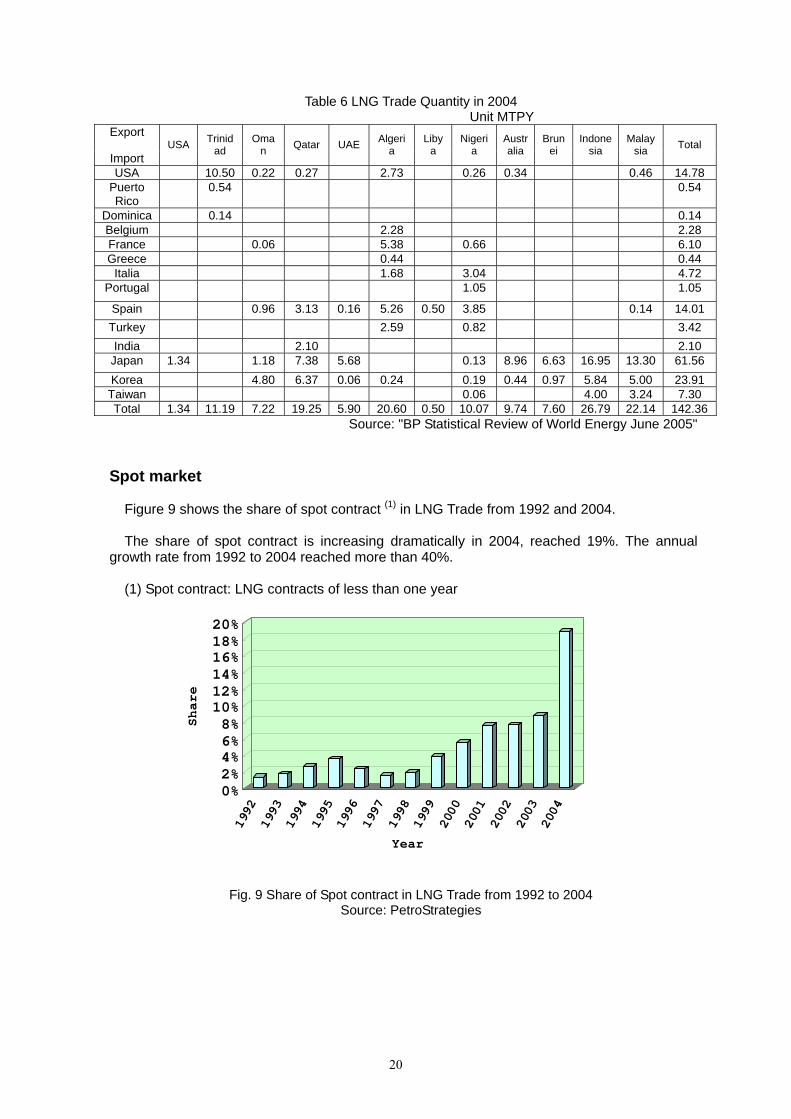
Table 6 LNG Trade Quantity in 2004 Unit MTPY
Export
Import USA Trinid
ad Oma
n Qatar UAE Algeria
Libya
Nigeria
Australia
Brunei
Indonesia
Malaysia Total
USA 10.50 0.22 0.27 2.73 0.26 0.34 0.46 14.78 Puerto Rico
0.54 0.54
Dominica 0.14 0.14 Belgium 2.28 2.28 France 0.06 5.38 0.66 6.10 Greece 0.44 0.44
Italia 1.68 3.04 4.72 Portugal 1.05 1.05
Spain 0.96 3.13 0.16 5.26 0.50 3.85 0.14 14.01 Turkey 2.59 0.82 3.42 India 2.10 2.10
Japan 1.34 1.18 7.38 5.68 0.13 8.96 6.63 16.95 13.30 61.56 Korea 4.80 6.37 0.06 0.24 0.19 0.44 0.97 5.84 5.00 23.91 Taiwan 0.06 4.00 3.24 7.30 Total 1.34 11.19 7.22 19.25 5.90 20.60 0.50 10.07 9.74 7.60 26.79 22.14 142.36
Source: "BP Statistical Review of World Energy June 2005"
Spot market
Figure 9 shows the share of spot contract (1) in LNG Trade from 1992 and 2004. The share of spot contract is increasing dramatically in 2004, reached 19%. The annual
growth rate from 1992 to 2004 reached more than 40%. (1) Spot contract: LNG contracts of less than one year
0%2%4%6%8%10%12%14%16%18%20%
Share
1992
1993
1994
1995
1996
1997
1998
1999
2000
2001
2002
2003
2004
Year
Fig. 9 Share of Spot contract in LNG Trade from 1992 to 2004 Source: PetroStrategies
21
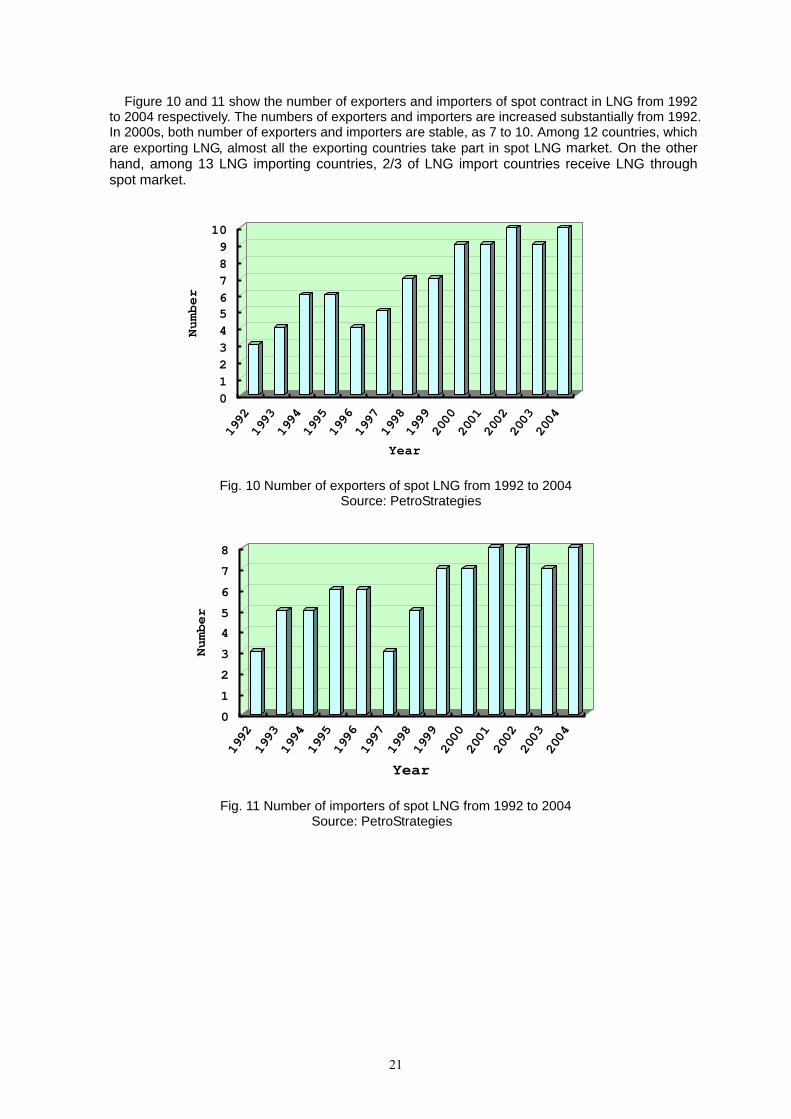
Figure 10 and 11 show the number of exporters and importers of spot contract in LNG from 1992 to 2004 respectively. The numbers of exporters and importers are increased substantially from 1992. In 2000s, both number of exporters and importers are stable, as 7 to 10. Among 12 countries, which are exporting LNG, almost all the exporting countries take part in spot LNG market. On the other hand, among 13 LNG importing countries, 2/3 of LNG import countries receive LNG through spot market.
0123456789
10
Number
1992
1993
1994
1995
1996
1997
1998
1999
2000
2001
2002
2003
2004
Year
Fig. 10 Number of exporters of spot LNG from 1992 to 2004
Source: PetroStrategies
0
1
2
3
4
5
6
7
8
Number
1992
1993
1994
1995
1996
1997
1998
1999
2000
2001
2002
2003
2004
Year
Fig. 11 Number of importers of spot LNG from 1992 to 2004
Source: PetroStrategies

22
Figure 12 shows the number of LNG cargos for spot contract LNG from 1992 to 2003 and the number reached 250 cargos in 2003. The number of cargos began to increase from 1999, when spot trading LNG volume started to explode.
0
50
100
150
200
250
300Number
1992
1993
1994
1995
1996
1997
1998
1999
2000
2001
2002
2003
2004
Year
Fig. 12 Number of LNG cargos for spot LNG from 1992 to 2003
Source: PetroStrategies
2.4. LNG LIQUEFACTION PLANTS Overview
In 2004, 19 LNG liquefaction plants were in operation on four different continents. The oldest has
been in operation for 40 years. Since 2001, a new LNG liquefaction plant Tiga has been placed into operation in Bintulu,
Malaysia. Plans envisioned the commencement of operations by two plants (Damietta and Idku) in 2005, one (Darwin) in 2006, and four (Bioko Island, Donggi, Sakhalin, and Snohvit) in 2007. These additions when in operation will make a significant increase in the total number of trains, from 19 at present to 26.
In 2004, LNG was being produced by 12 countries, the same number as in 2001 (i.e., Algeria,
Libya, Nigeria, United States, Trinidad and Tobago, Australia, Brunei, Indonesia, Malaysia, United Arab Emirates, Oman, and Qatar). These are expected to be joined by Egypt, Equatorial Guinea, Nigeria, Russia, and Norway over the years 2005 - 2007. As such, the number of producer countries is projected to jump from 12 to 17.
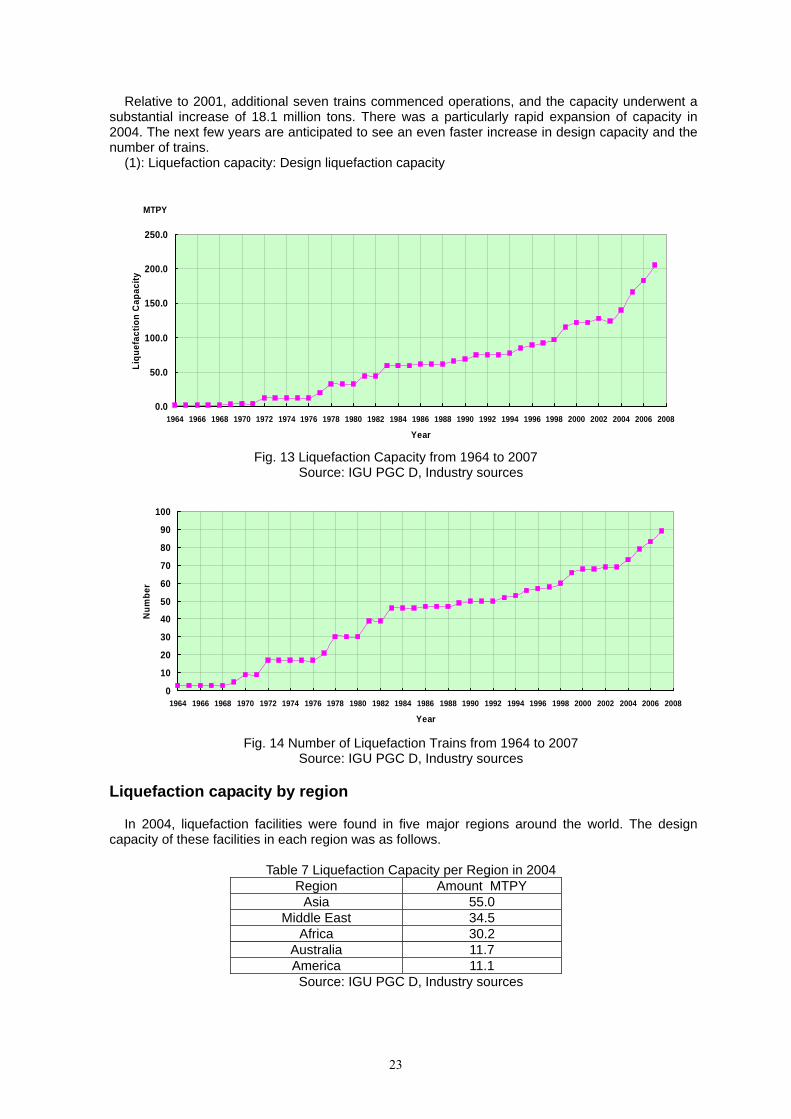
Liquefaction capacity (1) Figure 13 shows the trend of world liquefaction capacity from 1964 to 2004 and the forecast for
this capacity change up to and including 2007, and Figure 14, the corresponding trend of the number of liquefaction trains. As of 2004, the world capacity totaled 139.5 million tons per year, and liquefaction trains numbered 73. It can be seen that the capacity has increased greatly; the 2004 figure was 35 times as large as that in 1970, four times as large as that in 1980, and twice as large as that in 1990.
23
Relative to 2001, additional seven trains commenced operations, and the capacity underwent a substantial increase of 18.1 million tons. There was a particularly rapid expansion of capacity in 2004. The next few years are anticipated to see an even faster increase in design capacity and the number of trains.
(1): Liquefaction capacity: Design liquefaction capacity
0.0
50.0
100.0
150.0
200.0
250.0
1964 1966 1968 1970 1972 1974 1976 1978 1980 1982 1984 1986 1988 1990 1992 1994 1996 1998 2000 2002 2004 2006 2008
Year
Liqu
efac
tion
Cap
acity
MTPY
Fig. 13 Liquefaction Capacity from 1964 to 2007
Source: IGU PGC D, Industry sources
0
10
20
30
40
50
60
70
80
90
100
1964 1966 1968 1970 1972 1974 1976 1978 1980 1982 1984 1986 1988 1990 1992 1994 1996 1998 2000 2002 2004 2006 2008
Year
Num
ber
Fig. 14 Number of Liquefaction Trains from 1964 to 2007
Source: IGU PGC D, Industry sources
Liquefaction capacity by region In 2004, liquefaction facilities were found in five major regions around the world. The design
capacity of these facilities in each region was as follows.
Table 7 Liquefaction Capacity per Region in 2004 Region Amount MTPY
Asia 55.0 Middle East 34.5
Africa 30.2 Australia 11.7 America 11.1 Source: IGU PGC D, Industry sources

24
Figure 15 shows the regional shares of the world liquefaction capacity in 2004, and Figure 16, a comparison of these shares with those in 2001. It should be noted that in 2004, Asia continued to have the largest share of this capacity at 55.0 million tons per year (39%). Comparison with 2001 reveals a decline in the share occupied by Africa and rise in those occupied by Middle East, Australia and the Americas.
Over the years 2005 - 2007, a series of projects for construction of liquefaction plants and additional trains in Africa is forecast to bring a big expansion in Africa's share and relative decline in Asia's share, and make Africa the largest region of production.
Australia8%
Middle East24%
Africa21%
Asia39%
America8%
Fig. 15 Liquefaction Capacity per Region in 2004
Source: IGU PGC D, Industry sources
0
5
1015
20
2530
3540
45
Shar
e of
Liq
uefa
ctio
nC
apac
ity
AsiaAfric
a
Middle Eas
t
Australi
a
America
2001
2004
%
Fig. 16 Liquefaction Capacity per Region in 2001 and 2004
Source: IGU PGC D, Industry sources

25
Liquefaction capacity by country
Figures for liquefaction capacity in each country are shown below.
Table 8 Liquefaction Capacity per Country in 2004 Country Amount MTPY
Indonesia 26.1 Malaysia 23.9
Qatar 23.2 Algeria 20.0
Australia 11.7 Trinidad and Tobago 9.6
Nigeria 8.9 Oman 6.6 Brunei 5.0
United Arab Emirates 4.7 USA 1.5 Libya 1.3 Source: IGU PGC D, Industry sources
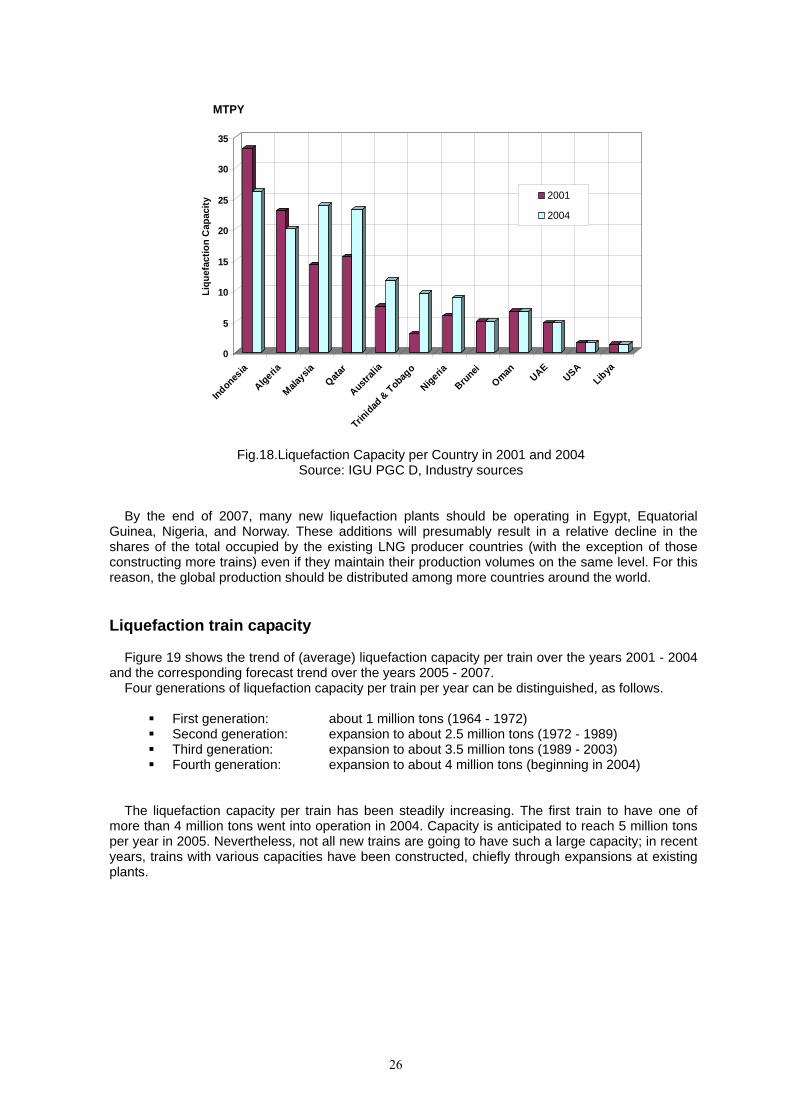
Figure 17 shows country shares of the world liquefaction capacity in 2004, and Figure 18, a
comparison of these shares with those in 2001. Indonesia had the largest share of this capacity at 26.1 million tons per year (18%). As compared to 2001, there was a sizable increase in the capacities of countries where new trains were added, i.e., Malaysia, Qatar, Australia, Nigeria, and Trinidad and Tobago.
Australia8% Qatar
16%
Indonesia18%
Oman5%
UAE3%
Nigeria6%
Brunei4%
USA1%
Libya1%
Trinidad & Tobago7%
Malaysia17%
Algeria14%
Fig.17 Liquefaction Capacity per Country in 2004 Source: IGU PGC D, Industry sources
26
0
5
10
15
20
25
30
35
Liqu
efac
tion
Cap
acity
Indonesia
Algeria
Malaysia
Qatar
Australi
a
Trinidad
& Tobag
o
Nigeria
BruneiOman UAE
USALibya
2001
2004
MTPY
Fig.18.Liquefaction Capacity per Country in 2001 and 2004
Source: IGU PGC D, Industry sources By the end of 2007, many new liquefaction plants should be operating in Egypt, Equatorial
Guinea, Nigeria, and Norway. These additions will presumably result in a relative decline in the shares of the total occupied by the existing LNG producer countries (with the exception of those constructing more trains) even if they maintain their production volumes on the same level. For this reason, the global production should be distributed among more countries around the world.
Liquefaction train capacity Figure 19 shows the trend of (average) liquefaction capacity per train over the years 2001 - 2004
and the corresponding forecast trend over the years 2005 - 2007. Four generations of liquefaction capacity per train per year can be distinguished, as follows.
First generation: about 1 million tons (1964 - 1972) Second generation: expansion to about 2.5 million tons (1972 - 1989) Third generation: expansion to about 3.5 million tons (1989 - 2003) Fourth generation: expansion to about 4 million tons (beginning in 2004)
The liquefaction capacity per train has been steadily increasing. The first train to have one of
more than 4 million tons went into operation in 2004. Capacity is anticipated to reach 5 million tons per year in 2005. Nevertheless, not all new trains are going to have such a large capacity; in recent years, trains with various capacities have been constructed, chiefly through expansions at existing plants.

27
0.0
1.0
2.0
3.0
4.0
5.0
6.0
1964 1966 1968 1970 1972 1974 1976 1978 1980 1982 1984 1986 1988 1990 1992 1994 1996 1998 2000 2002 2004 2006 2008
Year
Des
ign
Liqu
efac
tion
Trai
n C
apac
ity
MTPY
Fig.19 Liquefaction Train Capacity from 1964 to 2007
Source: IGU PGC D, Industry sources
Liquefaction processes There were eight types of liquefaction process in use at liquefaction plants as of 2004. Figure 20 shows the shares of the entire liquefaction capacity occupied by each type of process.
The most extensively used process was APCI C3/MCR, which accounted for liquefaction of 134 million tons per year, or the vast majority (87%) of the world total.
0102030405060708090
Shar
e
APCI- MCR PRICO MCR TEAL MCR APCI-C3/MCR
PhillipsCascade
TechnipCascade
Conoco-Phillips
OptimizedCascadeProcess
(%)
Fig. 20 Liquefaction Processes in 2004 Source: IGU PGC D, Industry sources
Figure 21 presents a comparison of the capacity share breakdowns by process in 2001, 2004,
and 2007 (forecast). Although there has been, and is anticipated to be, no change in the clear dominance of the APCI C3/MCR, use of other processes (such as optimal cascades, APCI C3/Shell MCR and Shell DMR) has been gradually increasing, and this trend is expected to continue.

28
0
20
40
60
80
100
Shar
e
APCI- MCR PRICO MCR TEAL MCR APCI- C3/MCR Phillips Cascade TechnipCascade
Conoco-PhillipsOptimizedCascade
LINDE MFC Shell DMR
Process
(%)
Fig. 21 Liquefaction Processes in 2001, 2004 and 2007
Source: IGU PGC D, Industry sources
Newly initiated plants and trains Table 9 shows the plants and trains that were first placed into operation from 2002 to 2004. An additional plant and six trains went into operation from 2002. In 2004, the Rasgas 2 train, with
a capacity of 4.7 million tons per year, the largest in the world, went into operation in Qatar.
Table 9 Newly Commenced LNG Liquefaction Plants and Trains from 2002 to 2004 Country Plant
Name Start UP
Owners Design Capacity
MTPY
Number of trains
Design Capacit
y per Train MTPY
Process Method
Nigeria Nigeria LNG 3
2002 Nigeria LNG (NNPC, Shell, Total,
ENI)
3.2 1 3.2 APCI-C3/MCR
Trinidad &
Tobago
A LNG 2 2002 Atlantic LNG (NGC/BP/Repsol/BG)
3.2 1 3.2 Optimized
Cascade Malaysi
a Tiga 2003 Malaysia LNG 6.8 2 3.4 APCI-C3/
Trinidad &
Tobago
A LNG 3 2003 Atlantic LNG (NGC/BP/Repsol/BG)
3.2 1 3.2 Optimized
Cascade Qatar Ras
Laffan 3 (Ras
Gas2)
2004 QP/ ExxsonMobil 4.7 1 4.7 APCI-C3/MCR
Australia
NWS 4 2004 NWS J/V �Woodside/Shell/
BHP/BP/ ChevronTexaco/MIMI
�
4.2 1 4.2 APCI-C3/MCR
Source: IGU PGC D, LNG Journal, GIIGNL “The LNG Industry in 2004”, Industry sources
29
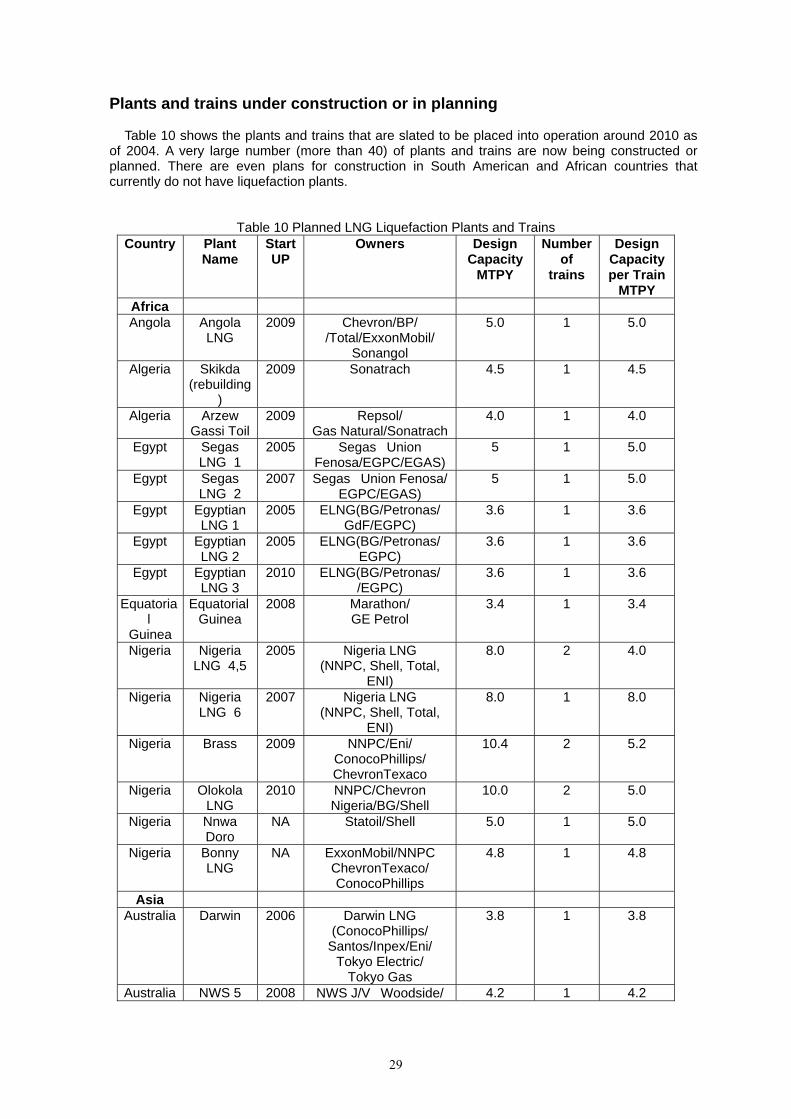
Plants and trains under construction or in planning Table 10 shows the plants and trains that are slated to be placed into operation around 2010 as
of 2004. A very large number (more than 40) of plants and trains are now being constructed or planned. There are even plans for construction in South American and African countries that currently do not have liquefaction plants.
Table 10 Planned LNG Liquefaction Plants and Trains Country Plant
Name Start UP
Owners Design Capacity
MTPY
Number of
trains
Design Capacity per Train
MTPY Africa Angola Angola
LNG 2009 Chevron/BP/
/Total/ExxonMobil/ Sonangol
5.0 1 5.0
Algeria Skikda (rebuilding
)
2009 Sonatrach 4.5 1 4.5
Algeria Arzew Gassi Toil
2009 Repsol/ Gas Natural/Sonatrach
4.0 1 4.0
Egypt Segas LNG 1
2005 Segas�Union Fenosa/EGPC/EGAS)
5 1 5.0
Egypt Segas LNG 2
2007 Segas�Union Fenosa/ EGPC/EGAS)
5 1 5.0
Egypt Egyptian LNG 1
2005 ELNG(BG/Petronas/ GdF/EGPC)
3.6 1 3.6
Egypt Egyptian LNG 2
2005 ELNG(BG/Petronas/ EGPC)
3.6 1 3.6
Egypt Egyptian LNG 3
2010 ELNG(BG/Petronas/ /EGPC)
3.6 1 3.6
Equatorial
Guinea
Equatorial Guinea
2008 Marathon/ GE Petrol
3.4 1 3.4
Nigeria Nigeria LNG 4,5
2005
Nigeria LNG (NNPC, Shell, Total,
ENI)
8.0 2 4.0
Nigeria Nigeria LNG 6
2007 Nigeria LNG (NNPC, Shell, Total,
ENI)
8.0 1 8.0
Nigeria Brass 2009 NNPC/Eni/ ConocoPhillips/ ChevronTexaco
10.4 2 5.2
Nigeria Olokola LNG
2010 NNPC/Chevron Nigeria/BG/Shell
10.0 2 5.0
Nigeria Nnwa Doro
NA Statoil/Shell 5.0 1 5.0
Nigeria Bonny LNG
NA ExxonMobil/NNPC ChevronTexaco/ ConocoPhillips
4.8 1 4.8
Asia Australia Darwin 2006 Darwin LNG
(ConocoPhillips/ Santos/Inpex/Eni/
Tokyo Electric/ Tokyo Gas
3.8 1 3.8
Australia NWS 5 2008 NWS J/V�Woodside/ 4.2 1 4.2

30
Country Plant Name
Start UP
Owners Design Capacity
MTPY
Number of
trains
Design Capacity per Train
MTPY Shell/BHP/BP/
ChevronTexaco/MIMI) Australia Gorgon 2009 Chevron/
ExxonMobil/ Shell
10.0 2 5.0
Australia Greater Sunrise
NA Woodside/ Osaka Gas/
ConocoPhillips/Shell
5.3 1 5.3
Brunei Lumut 6 2011 Brunei LNG (Brunei
Government/Shell/ Mitsubishi)
4.2 1 4.2
Indonesia Tangguh 2008 Pertamina BP/CNOOC/
Mitsubishi/Inpex/ Nippon Oil/ Kanematsu/ LNG Japan
8.4 2 4.2
Indonesia Dongi 2010 Pertamina/Medeco 7.0 2 3.5 Indonesia Bontang I NA Pertamina/Total/Unocal/
VICO 3.5 1 3.5
Russia Sakhalin 2 2007 Sakhalin LNG (Shell/Mitsui/Mitsubishi)
9.6 2 4.8
America Bolivia Pacific LNG NA Repsol/BG 7.0 2 3.5 Brazil Solimoes NA Statoil /Petrobras 2.5 1 2.5 Peru Peru LNG 2008 Hunt Oil/
SK/Sonatrach/Repsol 4.4 1 4.4
Trinidad & Tobago
A LNG 4 2005 Atlantic LNG (NGC/BP/Repsol/BG)
5.2 1 5.2
Venezuela Mariscal Surce
NA PdV/Shell/ Mitsubishi
4.7 1 4.7
M. East Iran Persian
LNG 2009 NIOC/Shell/
Repsol 10 2 5.0
Iran NICO LNG 2009 NIOC/BG 9.6 2 4.8 Iran Pars LNG 2009 NIOC/Total/Petronas 10 2 5.0 Iran Iran North
Pars NA NIOC/Indian Oil/
Petropars 8 2 4.0
Oman Qalhat LNG 2006 Oman Government/ Oman LNG/ Union
Fenosa Gas
3.7 1 3.7
Qatar Qatar Gas 2 2008 QP/ ExxsonMobil QP/ExxsonMobil/Total
15.6 2 7.8
Qatar Qatar Gas 3 2009 QP/ ConocoPhillips 7.8 1 7.8 Qatar Qatar Gas 4 2012 QP/Shell 7.8 1 7.8 Qatar Ras Laffan
4 2005 QP/ ExxsonMobil 4.7 1 4.7
Qatar Ras Laffan 5
2007 QP/ ExxsonMobil 4.7 1 4.7
Qatar Ras Laffan 6,7
2009 QP/ ExxsonMobil 15.6 2 7.8
Yemen Yemen LNG 2008 Yemen LNG (Total/Kogas/Yemen
Gas/Hunt Oil/SK/Hyundai)
6.9 2 3.45
Europe Norway Snohvit 2007 Statoil/Petoro/Total/
GdF/Amerada 4.2 1 4.2
31
Country Plant Name
Start UP
Owners Design Capacity
MTPY
Number of
trains
Design Capacity per Train
MTPY Hess/RWE-DEA)
Source: IGU PGC D, LNG Journal, GIIGNL “The LNG Industry in 2004”, Industry sources
2.5. LNG RECEIVING TERMINALS Overview
In 2004, the number of LNG receiving terminals in operation around the world reached 47. These
terminals were located in 13 countries on three continents (North America, Europe, and Asia). Over the years 2001 - 2004, five additional terminals went into operation in Bilbao (Spain), Sines
(Portugal), Nagasaki (Japan), San Andres (Dominican Republic), and Dahej (India). There are plans for the start-up of another five terminals in Energy Bridge (United States), Hazira (India), Isle of Grain (UK), Sakai (Japan) and Kwangyang (South Korea) in 2005, 6 terminals in 2006, and 11 terminals in 2007. As such, the number of terminals is expected undergo a big increase, from 47 in 2004 to 69 in 2007.
The number of countries with LNG receiving terminals increased by three beginning in 2001 and
reached 13 in 2004 (i.e., Japan, South Korea, Taiwan, United States, Italy, Spain, Belgium, France, Portugal, Turkey, Greece, India, and Dominican Republic). Over the years 2005 - 2007, 5 additional countries are expected to begin receiving LNG. The total number should therefore jump from 13 in 2004 to 18 in 2007.
Number of receiving terminals by country
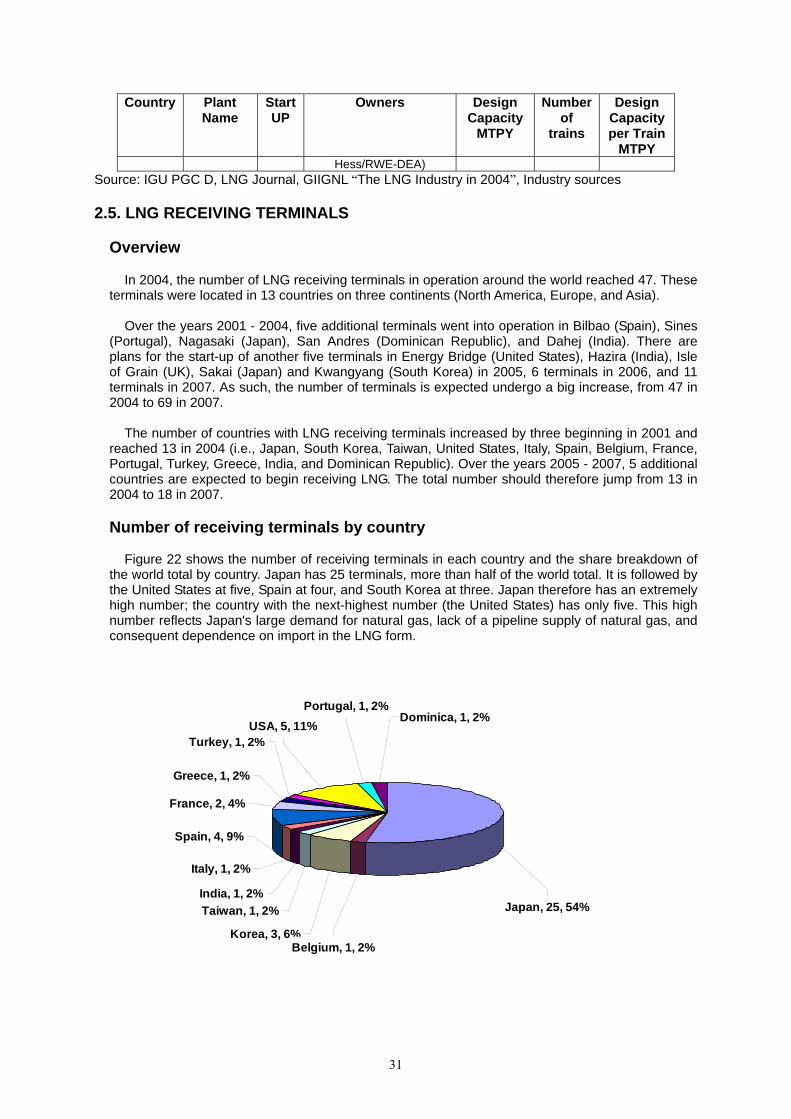
Figure 22 shows the number of receiving terminals in each country and the share breakdown of
the world total by country. Japan has 25 terminals, more than half of the world total. It is followed by the United States at five, Spain at four, and South Korea at three. Japan therefore has an extremely high number; the country with the next-highest number (the United States) has only five. This high number reflects Japan's large demand for natural gas, lack of a pipeline supply of natural gas, and consequent dependence on import in the LNG form.
Dominica, 1, 2%
Italy, 1, 2%
India, 1, 2%Taiwan, 1, 2%
Korea, 3, 6%Belgium, 1, 2%
Spain, 4, 9%
France, 2, 4%
Greece, 1, 2%
Turkey, 1, 2%USA, 5, 11%
Portugal, 1, 2%
Japan, 25, 54%

32
Fig.22 LNG Receiving Terminals per Country In 2004 Source: IGU PGC D, LNG Journal, GIIGNL "The LNG Industry in 2004", Industry sources

33
Number of receiving terminals by region Figure 23 shows the number of receiving terminals in each region. The share of the total
occupied by Asia is substantial, mainly because of the many terminals in Japan. Asia accounts for about 65% of the total.
Asia, 30, 64%
Europe, 11, 23%USA, 6, 13%
Fig.23 LNG Receiving Terminals per Region In 2004
Source: IGU PGC D, LNG Journal, GIIGNL "The LNG Industry in 2004", Industry sources
Number of receiving terminals in each year of start-up
Figure 24 shows the number of receiving terminals in each year (period) of start-up. The number
of terminals placed into operation increased over the years 1970 - 1990, leveled off in the first half of the 1990s, and began to increase again in the second half of the 1990s. Numerous terminals are under construction or in planning, and the number is anticipated to increase at an explosive rate beginning around 2005.
0
1
2
3
4
5
6
7
8
Number
-1970 1971-1975
1976-1980
1981-1985
1986-1990
1991-1995
1996-2000
2001-2004
Year
Fig. 24 Start Year of LNG Receiving Terminals from 1969 to 2004 Source: IGU PGC D, LNG Journal, GIIGNL "The LNG Industry in 2004", Industry sources

34
LNG storage capacity Figure 25 shows the LNG storage capacity (the combined capacity of LNG tanks) in each country
in 2004. Japan, which also had the most LNG receiving terminals, had the largest capacity, accounting for about 60% of the world total, and was followed by South Korea at about 17%. This huge storage capacity derives from the country's dependence on import of LNG due to the lack of natural gas supply by pipeline, and the need to absorb the great degree of seasonal demand fluctuation due to the high demand in the civil sector.
South Korea has many large-scale terminals, and its storage capacity is consequently high for its
number of terminals. LNG storage tanks in receiving terminals range in capacity from 35,000 to 200,000 cubic meters.
The largest ones are underground tanks built in Japan.
Dominica1%
India4%
Italy1%
Portugal1%
USA5%
Turkey1%
Greece1%France
3%
Belgium1%
Korea17%
Taiwan2%
Spain3%
Japan60%
Fig.25 LNG storage capacity per country
Source: IGU PGC D, LNG Journal, GIIGNL "The LNG Industry in 2004", Industry sources
Maximum capacity of LNG carriers able to berth Figure 26 shows the maximum capacity of LNG carriers able to berth at LNG receiving terminals. Large carriers are able to berth at almost all terminals; terminals able to accept shipments from
carriers with a capacity of 100,000 cubic meters or more account for 84% of the total number. Eleven percent can accommodate carriers with a capacity of more than 140,000 cubic meters as
well, and some are already taking steps to handle larger carriers. Terminals of this type are likely to increase in number over the coming years.

35
70,000-100,000m35%
140,000 or morem3
11%10,000-70,000 m3
14%
100,000-140,000m3
70%
Fig.26 Maximum Capacity of LNG Carriers for LNG Receiving Terminals in 2004 Source: IGU PGC D, Gas LNG Europe, Industry sources
Gas send out capacity
Figure 27 shows the total send out capacity of LNG terminals. Terminals with sendout capacity
between five and ten billion cubic meters per year are the most frequent.
0
2
4
6
8
10
12
14
16
18
Num
ber
<1 1.0-<5.0 5.0-<10 10-<20 20-<30 30-<40
Capacity Bm3PY
Fig.27 Total Gas Send out Capacity of LNG Terminals in 2004
Source: IGU PGC D, Gas LNG Europe, LNG in Japan, GIIGNL "The LNG Industry in 2004", Industry sources
36
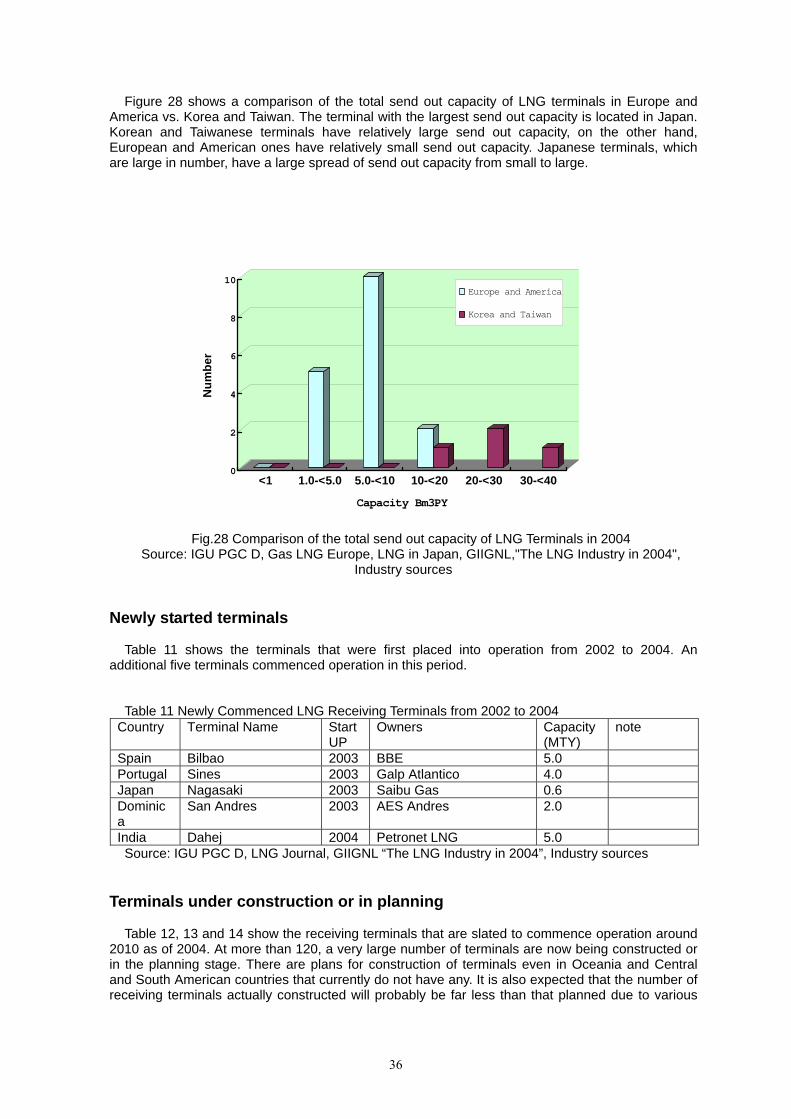
Figure 28 shows a comparison of the total send out capacity of LNG terminals in Europe and America vs. Korea and Taiwan. The terminal with the largest send out capacity is located in Japan. Korean and Taiwanese terminals have relatively large send out capacity, on the other hand, European and American ones have relatively small send out capacity. Japanese terminals, which are large in number, have a large spread of send out capacity from small to large.
0
2
4
6
8
10
Num
ber
<1 1.0-<5.0 5.0-<10 10-<20 20-<30 30-<40
Capacity Bm3PY
Europe and America
Korea and Taiwan
Fig.28 Comparison of the total send out capacity of LNG Terminals in 2004 Source: IGU PGC D, Gas LNG Europe, LNG in Japan, GIIGNL,"The LNG Industry in 2004",
Industry sources
Newly started terminals
Table 11 shows the terminals that were first placed into operation from 2002 to 2004. An
additional five terminals commenced operation in this period. Table 11 Newly Commenced LNG Receiving Terminals from 2002 to 2004
Country Terminal Name Start UP
Owners Capacity (MTY)
note
Spain Bilbao 2003 BBE 5.0 Portugal Sines 2003 Galp Atlantico 4.0 Japan Nagasaki 2003 Saibu Gas 0.6 Dominica
San Andres 2003 AES Andres 2.0
India Dahej 2004 Petronet LNG 5.0 Source: IGU PGC D, LNG Journal, GIIGNL “The LNG Industry in 2004”, Industry sources
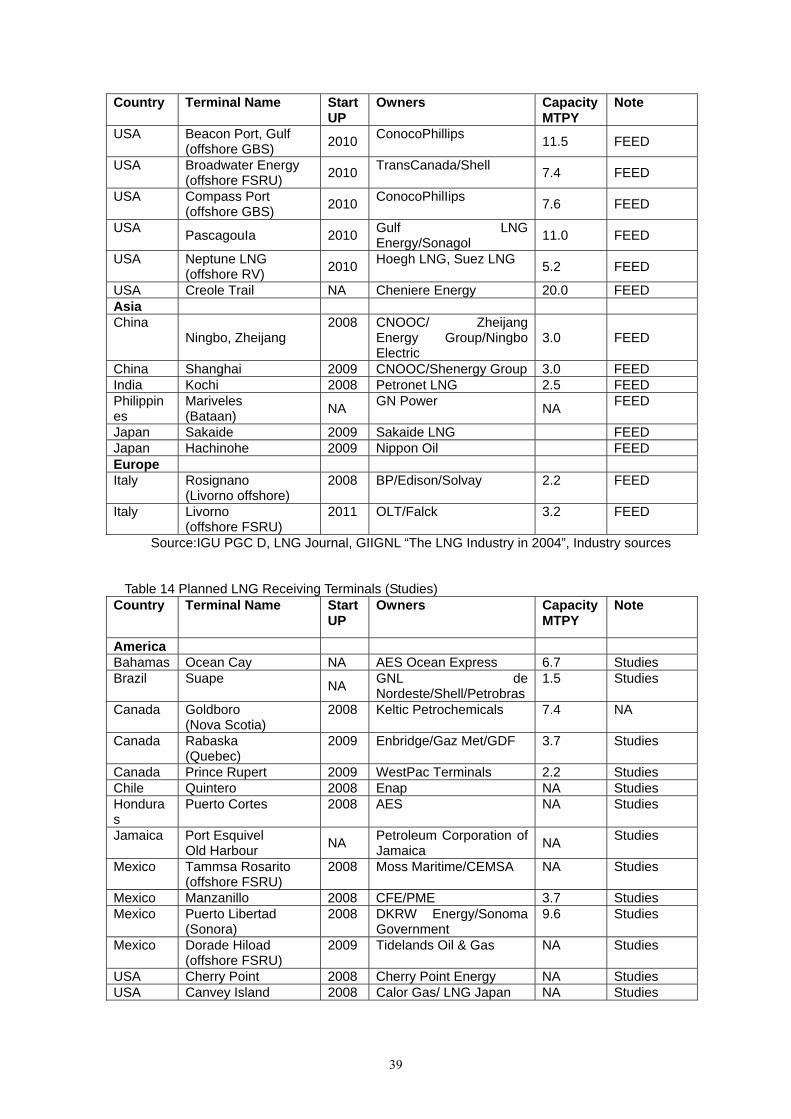
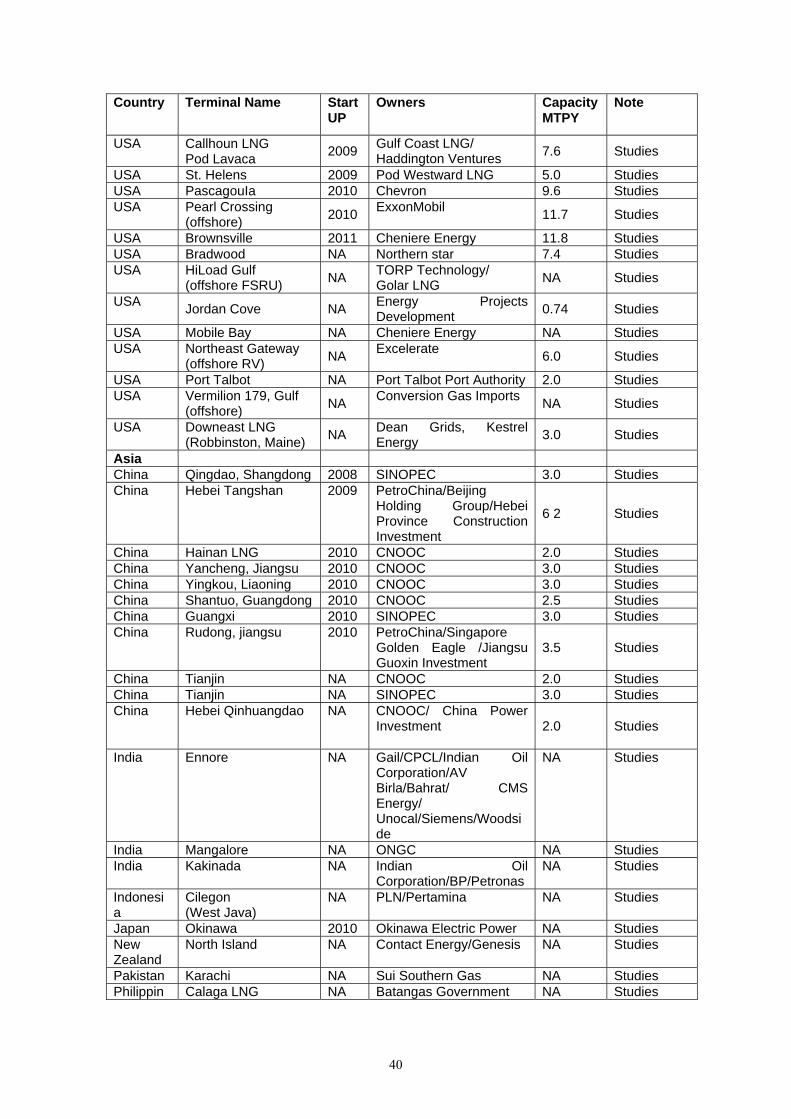
Terminals under construction or in planning
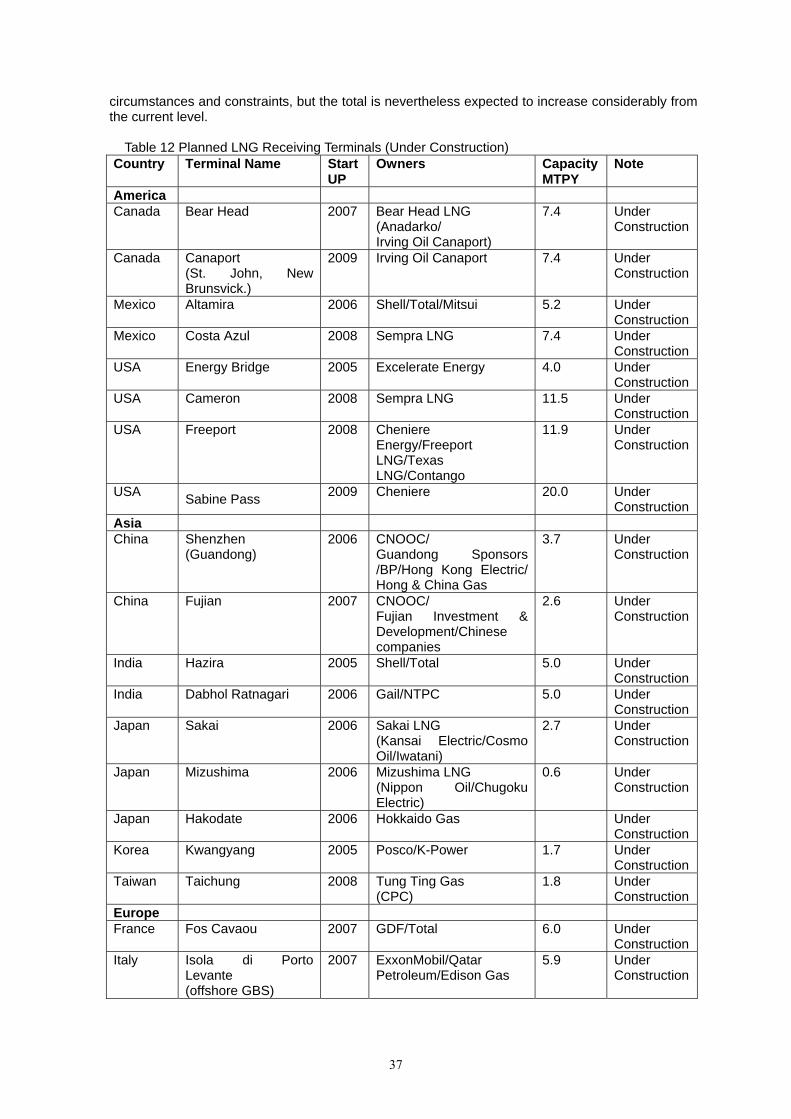
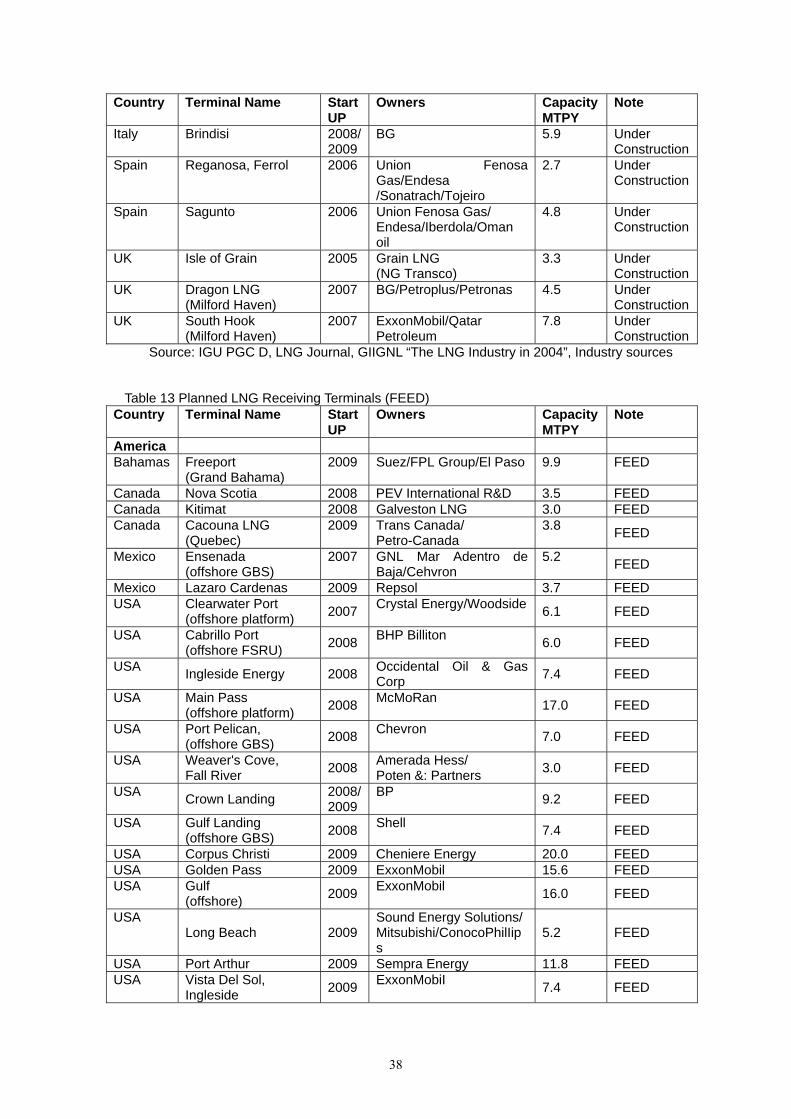
Table 12, 13 and 14 show the receiving terminals that are slated to commence operation around 2010 as of 2004. At more than 120, a very large number of terminals are now being constructed or in the planning stage. There are plans for construction of terminals even in Oceania and Central and South American countries that currently do not have any. It is also expected that the number of receiving terminals actually constructed will probably be far less than that planned due to various
37
circumstances and constraints, but the total is nevertheless expected to increase considerably from the current level.
Table 12 Planned LNG Receiving Terminals (Under Construction)
Country Terminal Name Start UP
Owners Capacity MTPY
Note
America Canada Bear Head 2007 Bear Head LNG
(Anadarko/ Irving Oil Canaport)
7.4 Under Construction
Canada Canaport (St. John, New Brunsvick.)
2009 Irving Oil Canaport 7.4 Under Construction
Mexico Altamira 2006 Shell/Total/Mitsui 5.2 Under Construction
Mexico Costa Azul 2008 Sempra LNG 7.4 Under Construction
USA Energy Bridge 2005 Excelerate Energy 4.0 Under Construction
USA Cameron 2008 Sempra LNG 11.5 Under Construction
USA Freeport 2008 Cheniere Energy/Freeport LNG/Texas LNG/Contango
11.9 Under Construction
USA Sabine Pass 2009 Cheniere 20.0 Under Construction
Asia China Shenzhen
(Guandong) 2006 CNOOC/
Guandong Sponsors /BP/Hong Kong Electric/ Hong & China Gas
3.7
Under Construction
China Fujian 2007 CNOOC/ Fujian Investment & Development/Chinese companies
2.6 Under Construction
India Hazira 2005 Shell/Total 5.0 Under Construction
India Dabhol Ratnagari 2006 Gail/NTPC 5.0 Under Construction
Japan Sakai 2006 Sakai LNG (Kansai Electric/Cosmo Oil/Iwatani)
2.7 Under Construction
Japan Mizushima 2006 Mizushima LNG (Nippon Oil/Chugoku Electric)
0.6 Under Construction
Japan Hakodate 2006 Hokkaido Gas Under Construction
Korea Kwangyang 2005 Posco/K-Power 1.7 Under Construction
Taiwan Taichung 2008 Tung Ting Gas (CPC)
1.8 Under Construction
Europe France Fos Cavaou 2007 GDF/Total 6.0 Under
Construction Italy Isola di Porto
Levante (offshore GBS)
2007 ExxonMobil/Qatar Petroleum/Edison Gas
5.9 Under Construction
38
Country Terminal Name Start UP
Owners Capacity MTPY
Note
Italy Brindisi 2008/2009
BG 5.9 Under Construction
Spain Reganosa, Ferrol 2006 Union Fenosa Gas/Endesa /Sonatrach/Tojeiro
2.7 Under Construction
Spain Sagunto 2006 Union Fenosa Gas/ Endesa/Iberdola/Oman oil
4.8 Under Construction
UK Isle of Grain 2005 Grain LNG (NG Transco)
3.3 Under Construction
UK Dragon LNG (Milford Haven)
2007 BG/Petroplus/Petronas 4.5 Under Construction
UK South Hook (Milford Haven)
2007 ExxonMobil/Qatar Petroleum
7.8 Under Construction
Source: IGU PGC D, LNG Journal, GIIGNL “The LNG Industry in 2004”, Industry sources
Table 13 Planned LNG Receiving Terminals (FEED) Country Terminal Name Start
UP Owners Capacity
MTPY Note
America Bahamas Freeport
(Grand Bahama) 2009 Suez/FPL Group/El Paso 9.9 FEED
Canada Nova Scotia 2008 PEV International R&D 3.5 FEED Canada Kitimat 2008 Galveston LNG 3.0 FEED Canada Cacouna LNG
(Quebec) 2009 Trans Canada/
Petro-Canada 3.8 FEED
Mexico Ensenada (offshore GBS)
2007 GNL Mar Adentro de Baja/Cehvron
5.2 FEED
Mexico Lazaro Cardenas 2009 Repsol 3.7 FEED USA Clearwater Port
(offshore platform) 2007 Crystal Energy/Woodside 6.1 FEED
USA Cabrillo Port (offshore FSRU) 2008 BHP Billiton 6.0 FEED
USA Ingleside Energy 2008 Occidental Oil & Gas Corp 7.4 FEED
USA Main Pass (offshore platform) 2008 McMoRan 17.0 FEED
USA Port Pelican, (offshore GBS) 2008 Chevron 7.0 FEED
USA Weaver's Cove, Fall River 2008 Amerada Hess/
Poten &: Partners 3.0 FEED
USA Crown Landing 2008/2009
BP 9.2 FEED
USA Gulf Landing (offshore GBS) 2008 Shell 7.4 FEED
USA Corpus Christi 2009 Cheniere Energy 20.0 FEED USA Golden Pass 2009 ExxonMobil 15.6 FEED USA Gulf
(offshore) 2009 ExxonMobil 16.0 FEED
USA Long Beach 2009
Sound Energy Solutions/ Mitsubishi/ConocoPhilIips
5.2 FEED
USA Port Arthur 2009 Sempra Energy 11.8 FEED USA Vista Del Sol,
Ingleside 2009 ExxonMobiI 7.4 FEED
39
Country Terminal Name Start UP
Owners Capacity MTPY
Note
USA Beacon Port, Gulf (offshore GBS) 2010 ConocoPhillips 11.5 FEED
USA Broadwater Energy (offshore FSRU) 2010 TransCanada/Shell 7.4 FEED
USA Compass Port (offshore GBS) 2010 ConocoPhilIips 7.6 FEED
USA PascagouIa 2010 Gulf LNG Energy/Sonagol 11.0 FEED
USA Neptune LNG (offshore RV) 2010 Hoegh LNG, Suez LNG 5.2 FEED
USA Creole Trail NA Cheniere Energy 20.0 FEED Asia China
Ningbo, Zheijang 2008 CNOOC/ Zheijang
Energy Group/Ningbo Electric
3.0 FEED
China Shanghai 2009 CNOOC/Shenergy Group 3.0 FEED India Kochi 2008 Petronet LNG 2.5 FEED Philippines
Mariveles (Bataan) NA GN Power NA FEED
Japan Sakaide 2009 Sakaide LNG FEED Japan Hachinohe 2009 Nippon Oil FEED Europe Italy Rosignano
(Livorno offshore) 2008 BP/Edison/Solvay 2.2 FEED
Italy Livorno (offshore FSRU)
2011 OLT/Falck 3.2 FEED
Source:IGU PGC D, LNG Journal, GIIGNL “The LNG Industry in 2004”, Industry sources
Table 14 Planned LNG Receiving Terminals (Studies)
Country Terminal Name Start UP
Owners Capacity MTPY
Note
America Bahamas Ocean Cay NA AES Ocean Express 6.7 Studies Brazil Suape NA GNL de
Nordeste/Shell/Petrobras 1.5 Studies
Canada Goldboro (Nova Scotia)
2008 Keltic Petrochemicals 7.4 NA
Canada Rabaska (Quebec)
2009 Enbridge/Gaz Met/GDF 3.7 Studies
Canada Prince Rupert 2009 WestPac Terminals 2.2 Studies Chile Quintero 2008 Enap NA Studies Honduras
Puerto Cortes 2008 AES NA Studies
Jamaica Port Esquivel Old Harbour NA Petroleum Corporation of
Jamaica NA Studies
Mexico Tammsa Rosarito (offshore FSRU)
2008 Moss Maritime/CEMSA NA Studies
Mexico Manzanillo 2008 CFE/PME 3.7 Studies Mexico Puerto Libertad
(Sonora) 2008 DKRW Energy/Sonoma
Government 9.6 Studies
Mexico Dorade Hiload (offshore FSRU)
2009 Tidelands Oil & Gas NA Studies
USA Cherry Point 2008 Cherry Point Energy NA Studies USA Canvey Island 2008 Calor Gas/ LNG Japan NA Studies
40
Country Terminal Name Start UP
Owners Capacity MTPY
Note
USA Callhoun LNG� Pod Lavaca 2009 Gulf Coast LNG/
Haddington Ventures 7.6 Studies
USA St. Helens 2009 Pod Westward LNG 5.0 Studies USA PascagouIa 2010 Chevron 9.6 Studies USA Pearl Crossing
(offshore) 2010 ExxonMobil 11.7 Studies
USA Brownsville 2011 Cheniere Energy 11.8 Studies USA Bradwood NA Northern star 7.4 Studies USA HiLoad Gulf
(offshore FSRU) NA TORP Technology/ Golar LNG NA Studies
USA Jordan Cove NA Energy Projects Development 0.74 Studies
USA Mobile Bay NA Cheniere Energy NA Studies USA Northeast Gateway
(offshore RV) NA Excelerate 6.0 Studies
USA Port Talbot NA Port Talbot Port Authority 2.0 Studies USA Vermilion 179, Gulf
(offshore) NA Conversion Gas Imports NA Studies
USA Downeast LNG (Robbinston, Maine) NA Dean Grids, Kestrel
Energy 3.0 Studies
Asia China Qingdao, Shangdong 2008 SINOPEC 3.0 Studies China Hebei Tangshan 2009 PetroChina/Beijing
Holding Group/Hebei Province Construction Investment
6 2 Studies
China Hainan LNG 2010 CNOOC 2.0 Studies China Yancheng, Jiangsu 2010 CNOOC 3.0 Studies China Yingkou, Liaoning 2010 CNOOC 3.0 Studies China Shantuo, Guangdong 2010 CNOOC 2.5 Studies China Guangxi 2010 SINOPEC 3.0 Studies China Rudong, jiangsu 2010 PetroChina/Singapore
Golden Eagle /Jiangsu Guoxin Investment
3.5 Studies
China Tianjin NA CNOOC 2.0 Studies China Tianjin NA SINOPEC 3.0 Studies China Hebei Qinhuangdao NA CNOOC/ China Power
Investment
2.0 Studies
India Ennore NA Gail/CPCL/Indian Oil Corporation/AV Birla/Bahrat/ CMS Energy/ Unocal/Siemens/Woodside
NA Studies
India Mangalore NA ONGC NA Studies India Kakinada NA Indian Oil
Corporation/BP/Petronas NA Studies
Indonesia
Cilegon (West Java)
NA PLN/Pertamina NA Studies
Japan Okinawa 2010 Okinawa Electric Power NA Studies New Zealand
North Island NA Contact Energy/Genesis NA Studies
Pakistan Karachi NA Sui Southern Gas NA Studies Philippin Calaga LNG NA Batangas Government NA Studies

41
Country Terminal Name Start UP
Owners Capacity MTPY
Note
es (Manila) Singapore
NA 2012 Singapore Energy Authority
NA Studies
Thailand Map Ta Phud NA PTT NA Studies Europe Cyprus Vassiliko 2009 Cyprus Government 0.7 Studies Germany Wilhemshaven NA E. ON NA Studies Italy Taranto 2009 Gas Natural 5.9 Studies Italy Priolo/Augusta/Melilli 2010 Shell Energy
Europe/ERG Power & Gas
5.9 Studies
Italy Monfalcone (offshore)
2010 Endesa 6.0 Studies
Italy Sicily 2010 EPG power & Gas 5.8 Studies Netherlands
Maasvlakte Port of Rotterdam
2010 Gasunie/Royal Vopak 6.4 Studies
Netherlands
Port of Rotterdam
2010 Petroplus NA Studies
Poland Baltic NA PGNiG NA Studies Spain Arinaga
(Gran Canary Island) 2008 Gascan/Unelco Endesa 1.5 Studies
Spain Granadilla 2008 Gascan/Unelco Endesa 1.5 Studies Sweden Oxelusund NA Sydkraft Gas
(Eon) NA Studies
UK Canvey Island 2010 Calor Gas/LNG Japan/Centrica/Osaka Gas
4.0 Studies
UK Amlwch (Anglesey)
NA Canatxx NA Studies
Source: IGU PGC D, LNG Journal, GIIGNL “The LNG Industry in 2004”, Industry sources 2.6. LNG CARRIERS
Overview
In 2004, a total of 174 LNG carriers were in operation. Taken together, they had a combined
capacity of 20.72 million cubic meters, for an average of 119,000 cubic meters per carrier. Over the years 2001 - 2004, an additional 47 carriers were placed into service, and the combined
capacity jumped by 6.45 million cubic meters or 45%. Due to the commissioning of large carriers, the average capacity was 3,000 cubic meters larger than in 2001.
Capacity
Figure 29 shows the distribution of the number of LNG carriers by capacity class in 2004. The share occupied by large carriers has become large; carriers with a capacity of at least 135,000 cubic meters accounted for 78% of the total. A carrier in the Oman project had the highest capacity at 147,000 cubic meters.

42
135,000m3�46%
� 40,000m35%
� 100,000m311%
� 135,000m332%
Fig. 29 Capacity of LNG Carriers
Source: GIIGNL “The LNG Industry in 2004”, Tokyo Gas, Industry sources
Figure 30 shows the trend of LNG carrier age (number of years of service) and capacity for carriers that were commissioned over the years 1969 – 2004 and the corresponding forecast trend over the years 2005-2008. Carrier size began to increase around 1975, when carriers in the 125,000-cubic-meter class made their appearance. Almost all carriers commissioned since 1998 have a capacity of at least 135,000 cubic meters.
020,00040,00060,00080,000
100,000120,000140,000160,000180,000200,000220,000240,000
1965 1970 1975 1980 1985 1990 1995 2000 2005 2010
Year of Delivery
Cap
acity
m3
Fig. 30 Capacity of LNG Carriers from 1969 to 2004
Source: GIIGNL “The LNG Industry in 2004”, Tokyo Gas, Industry sources
The needs for cost reduction are expected to lead to an increase in commissions of carriers in the class of 150,000 cubic meters. Furthermore, carriers with a capacity in excess of 200,000 cubic meters are scheduled to be placed into service beginning in 2007. Carrier capacities are therefore projected to become much larger.
Figure 31 shows the trend of the combined LNG carrier capacity over the years 1969 to 2004
and the corresponding forecast trend over the years 2005-2008. The placement of many large carriers into service since 2002 greatly increased the total capacity, which reached 20.72 cubic meters in 2004. The total capacity will keep increasing rapidly from 2004 to 2008.

43
0
5,000
10,000
15,000
20,000
25,000
30,000
35,000
40,000
19691971197319751977197919811983198519871989199119931995199719992001200320052007
Year
Capacity
km3
Fig. 31 Total Capacity of LNG Carriers Source: GIIGNL "The LNG Industry in 2004", Tokyo Gas, Industry sources
Number of commissions
Figure 32 shows the trend of the number of LNG carriers commissioned over the years 1969-
2004 and the corresponding forecast trend over the years 2005-2008. Newly commissioned carriers numbered nine in 2002, 15 in 2003, and 23 in 2004.
The number of vessels commissioned was in average about eight at the most up until 1999, but
has been steadily increasing since 2000. This increase is linked to that in the LNG import and export volume accompanying the construction of additional liquefaction and receiving terminals. An additional 21 carriers were scheduled to be commissioned in 2005, and the number of additions will amount to 47 in 2008.
05101520253035404550
Number
1969
1970
1971
1972
1973
1974
1975
1976
1977
1978
1979
1980
1981
1982
1983
1984
1985
1986
1987
1988
1989
1990
1991
1992
1993
1994
1995
1996
1997
1998
1999
2000
2001
2002
2003
2004
2005
2006
2007
2008
Year
Fig. 32 Number of Delivery of LNG Carriers from 1969 to 2004 Source: GIIGNL "The LNG Industry in 2004", Tokyo Gas, Industry sources
Figure 33 shows the trend of the total number of commissions over the years 1969 – 2004 and
the corresponding forecast trend over the years 2005-2008. The number rapidly raised beginning in 2002, reached 174 in 2004 and will reach 302 in 2008.

44
0
50
100
150
200
250
300
350
1969 1971 1973 1975 1977 1979 1981 1983 1985 1987 1989 1991 1993 1995 1997 1999 2001 2003 2005 2007
Year
Number
Fig. 33 Total Number of Delivery of LNG Carriers from 1969 to 2004 Source: GIIGNL "The LNG Industry in 2004", Tokyo Gas, Industry sources
Tank type
Figure 34 shows the number of carriers in each category of tank type. There are four basic types:
Moss, Esso, SPB, and membrane. The Moss and membrane types are two major types, and the membrane type accounts for 61%.
020406080100120140160180
Number
Esso Moss SPB Membrane
Tank Type
Fig. 34 Tank Type of LNG Carriers from 1969 to 2004
Source: GIIGNL "The LNG Industry in 2004", Tokyo Gas, Industry sources
45
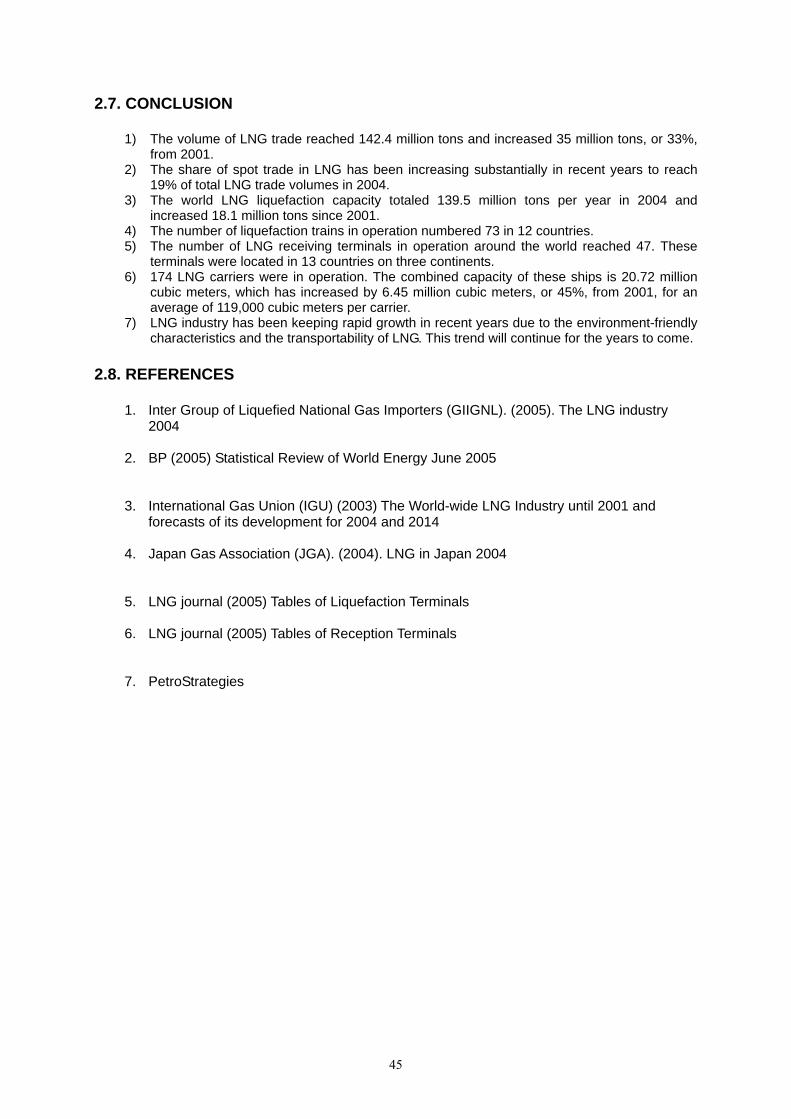
2.7. CONCLUSION
1) The volume of LNG trade reached 142.4 million tons and increased 35 million tons, or 33%, from 2001.
2) The share of spot trade in LNG has been increasing substantially in recent years to reach 19% of total LNG trade volumes in 2004.
3) The world LNG liquefaction capacity totaled 139.5 million tons per year in 2004 and increased 18.1 million tons since 2001.
4) The number of liquefaction trains in operation numbered 73 in 12 countries. 5) The number of LNG receiving terminals in operation around the world reached 47. These
terminals were located in 13 countries on three continents. 6) 174 LNG carriers were in operation. The combined capacity of these ships is 20.72 million
cubic meters, which has increased by 6.45 million cubic meters, or 45%, from 2001, for an average of 119,000 cubic meters per carrier.
7) LNG industry has been keeping rapid growth in recent years due to the environment-friendly characteristics and the transportability of LNG. This trend will continue for the years to come.
2.8. REFERENCES
1. Inter Group of Liquefied National Gas Importers (GIIGNL). (2005). The LNG industry 2004
2. BP (2005) Statistical Review of World Energy June 2005
3. International Gas Union (IGU) (2003) The World-wide LNG Industry until 2001 and
forecasts of its development for 2004 and 2014 4. Japan Gas Association (JGA). (2004). LNG in Japan 2004
5. LNG journal (2005) Tables of Liquefaction Terminals 6. LNG journal (2005) Tables of Reception Terminals
7. PetroStrategies

46
3. LNG QUALITY
REPORT OF STUDY GROUP D1
“LNG quality”
RAPPORT DU GROUPE DE TRAVAIL D1
“Qualité du GNL”
Study Group Chairman/Président du Groupe de Travail
Rob Klein Nagelvoort
THE NETHERLANDS
47
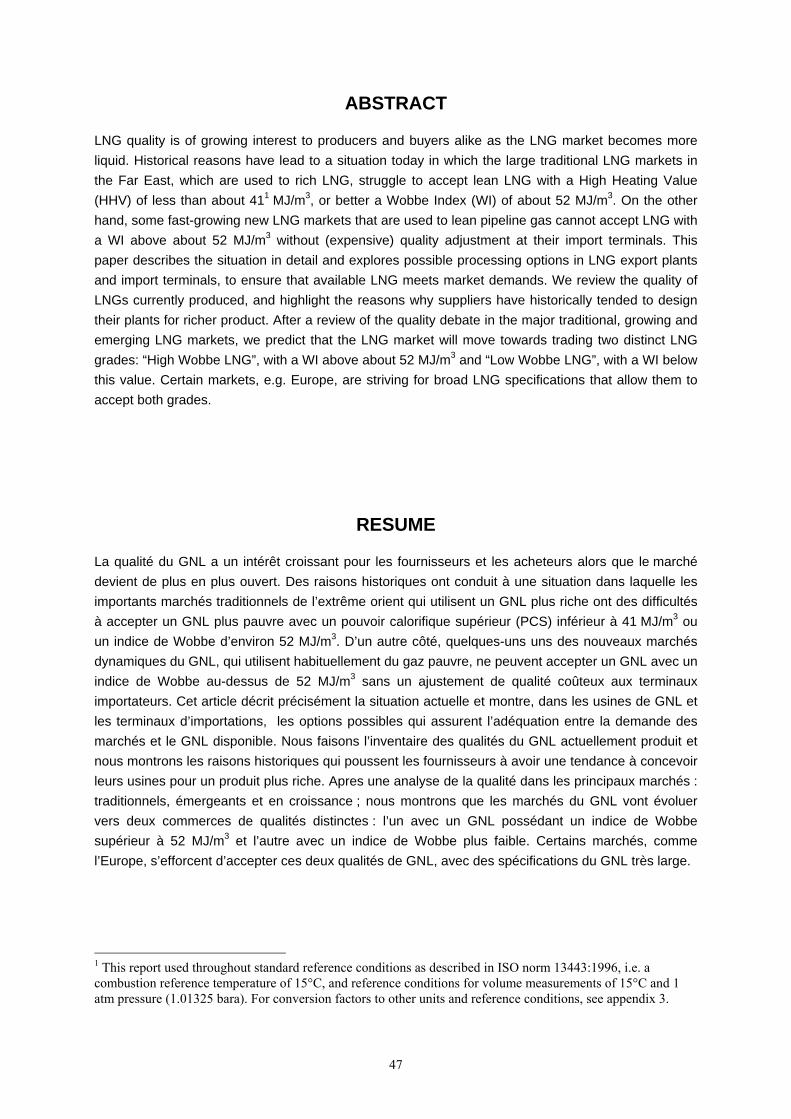
ABSTRACT
LNG quality is of growing interest to producers and buyers alike as the LNG market becomes more liquid. Historical reasons have lead to a situation today in which the large traditional LNG markets in the Far East, which are used to rich LNG, struggle to accept lean LNG with a High Heating Value (HHV) of less than about 411 MJ/m3, or better a Wobbe Index (WI) of about 52 MJ/m3. On the other hand, some fast-growing new LNG markets that are used to lean pipeline gas cannot accept LNG with a WI above about 52 MJ/m3 without (expensive) quality adjustment at their import terminals. This paper describes the situation in detail and explores possible processing options in LNG export plants and import terminals, to ensure that available LNG meets market demands. We review the quality of LNGs currently produced, and highlight the reasons why suppliers have historically tended to design their plants for richer product. After a review of the quality debate in the major traditional, growing and emerging LNG markets, we predict that the LNG market will move towards trading two distinct LNG grades: “High Wobbe LNG”, with a WI above about 52 MJ/m3 and “Low Wobbe LNG”, with a WI below this value. Certain markets, e.g. Europe, are striving for broad LNG specifications that allow them to accept both grades.
RESUME
La qualité du GNL a un intérêt croissant pour les fournisseurs et les acheteurs alors que le marché devient de plus en plus ouvert. Des raisons historiques ont conduit à une situation dans laquelle les importants marchés traditionnels de l’extrême orient qui utilisent un GNL plus riche ont des difficultés à accepter un GNL plus pauvre avec un pouvoir calorifique supérieur (PCS) inférieur à 41 MJ/m3 ou un indice de Wobbe d’environ 52 MJ/m3. D’un autre côté, quelques-uns uns des nouveaux marchés dynamiques du GNL, qui utilisent habituellement du gaz pauvre, ne peuvent accepter un GNL avec un indice de Wobbe au-dessus de 52 MJ/m3 sans un ajustement de qualité coûteux aux terminaux importateurs. Cet article décrit précisément la situation actuelle et montre, dans les usines de GNL et les terminaux d’importations, les options possibles qui assurent l’adéquation entre la demande des marchés et le GNL disponible. Nous faisons l’inventaire des qualités du GNL actuellement produit et nous montrons les raisons historiques qui poussent les fournisseurs à avoir une tendance à concevoir leurs usines pour un produit plus riche. Apres une analyse de la qualité dans les principaux marchés : traditionnels, émergeants et en croissance ; nous montrons que les marchés du GNL vont évoluer vers deux commerces de qualités distinctes : l’un avec un GNL possédant un indice de Wobbe supérieur à 52 MJ/m3 et l’autre avec un indice de Wobbe plus faible. Certains marchés, comme l’Europe, s’efforcent d’accepter ces deux qualités de GNL, avec des spécifications du GNL très large.
1 This report used throughout standard reference conditions as described in ISO norm 13443:1996, i.e. a combustion reference temperature of 15°C, and reference conditions for volume measurements of 15°C and 1 atm pressure (1.01325 bara). For conversion factors to other units and reference conditions, see appendix 3.

48
TABLE OF CONTENT
3.1. Introduction
3.2. Essential LNG quality specifications • General • Combustion properties • Impurities
3.3. The current LNG quality debate in key importing countries • Japan • EU (EASEE-gas) • UK • USA • China • India
3.4. Technical possibilities for LNG quality adjustment • At the export plant • At the import terminal
3.5. Conclusions and Recommendations • General conclusions • Available LNG and market requirements • View to the future • Recommendations
Appendices • Biliography • Conversion factors for High Heating Value and Wobbe Index • Further details on China

49
3.1. INTRODUCTION
Until the late 1990’s, LNG trade was predominantly based on long-term contracts between a single supplier and a single customer. That meant in most cases the supplier could adjust the product to suit an established pipeline gas market, or an emerging LNG market’s specifications became aligned to the dominant supplier’s product.
More recently, utilisation of spare plant capacity beyond contracted volumes has made additional cargoes available for sale into an increasingly diverse and expanding market. At the same time, gas demand has risen while local gas supplies by pipeline have diminished, increasing the movement of gas over long distances. In extreme cases, cargoes have crossed traditional regional boundaries and become the first global trades. In the 21st century, entry of a number of new large and smaller players, and renewal of some of the old contracts, has either forced or enabled suppliers to set up multiple contracts with customers in different locations and even different regions.
The LNG produced around the world varies in composition depending on the nature of reservoir fluids, whether or not they are associated with an oil production, and how much LPG is extracted during liquefaction. And to further complicate matters, for historical reasons charted in more detail in Section 3.3 of this report, individual nations have developed different gas specifications. So a 21st century supplier is faced with matching his product to different market requirements, and a terminal operator has to consider flexibility to receive LNG of different quality from different sources.
This report addresses the dilemma of how to reconcile varying compositions and specifications - but only at one level, and that is the issue of international specifications. It does not remove the final problem of quality adjustment, whether at the liquefaction end of the chain or at the regasification terminal, from economic decisions in a free market by both suppliers and customers. Instead, it seeks to foster co-operation and balancing of costs and benefits along the gas value chain by suggesting a way of harmonising the specifications. It aims to make economic decisions more transparent. And finally it offers a tool for briefing legislators and other stakeholders about a specialist topic. The specifications themselves vary in ways that are discussed in more detail in Section 2. Broadly speaking, they refer to:
• Combustion properties, which specify the energy content and also affect gas flame characteristics (Wobbe index, High Heating Value and Relative Density)
• Compositional limits such as maximum sulphur and oxygen, acceptable nitrogen content and sometimes limits on some individual hydrocarbon components
Supply of gas outside these limits could have major commercial, safety and environmental
implications for some individual customers. Finally, specifications are sometimes written in different units with different reference conditions.
Methods currently available for quality adjustment are discussed briefly in Section 3.4. There is plenty of material on this subject in the public domain and within other industry groups. We explain advantages and disadvantages of the various available options, and draw some general conclusions.
In Section 3.5 we offer our conclusions and some perceptions of our members on where current trends are leading the LNG trade over the next 10-15 years, as a guide to where the next wave of investment will be needed. This is to begin to answer the questions: “What type of LNG will be sellable?” and “What type of quality adjustment equipment will needed?”
50
3.2. ESSENTIAL LNG QUALITY SPECIFICATIONS 3.2.1. GENERAL
When talking about the “quality” of LNG, people mostly refer to the High Heating Value (HHV) or Gross Calorific Value (GCV), a measure of its energy content per volume. The HHV or GCV is the number of heat units generated when a unit volume of product in the vapour phase at standard temperature and pressure is burnt completely in dry air. The gaseous products of combustion are brought to the same standard conditions of temperature and pressure, but the water produced is condensed to liquid in equilibrium with water vapour.
This report uses the HHV as defined in the ISO standard 13443:1996, i.e. metering and combustion of the gas at 15 ºC and at a pressure of 101.325 kPa (1.01325 bara), using real gas conditions (expressed in MJ/m3). For conversions to other units, see appendix 3.
The importance of the HHV is obvious when looking at LNG sales contracts, which usually stipulate that the sales value is directly related to the amount of energy that is transferred to the customer. Hence careful measurement of the HHV becomes a matter of economic priority.
However, a qualitative description of a specific cargo of LNG that is for sale requires more detail than just the HHV, if a potential buyer wants to determine whether it is acceptable. Two gases of the same HHV can still be very different. A final gas user will likely have concerns in two areas: combustion properties related to burner operation, best described by interchangeability parameters, and the level of impurities in the gas, important for safety, environmental performance and certain chemical plants taking gas as feedstock. 3.2.2. COMBUSTION PROPERTIES
In order to ensure that the regasified LNG can be burnt safely and efficiently, it must be interchangeable with the gas the customer is used to. The single most important interchangeability parameter is the Wobbe Index (WI). The WI is a measure of the degree to which the combustion properties of one gas resemble those of another gas. The WI is defined as follows:
RdHHVWI =
where Rd is the density of gas relative to the density of air.
If two gases have the same WI then the energy input to the flame of a burner is identical, for a given pressure. The WI is expressed, like the HHV, in MJ/m3, or sometimes in btu/scf. By imposing an upper and lower bound on the WI, NOx and other emissions can be controlled, high efficiency of burners can be achieved, and most importantly, the safe operation of equipment can be assured.
From upper and lower limits on any two of the three parameters HHV, WI and Rd, one can draw an “interchangeability box” on an HHV-WI plot. If the limits are chosen with respect to the requirements of gas turbines and gas appliances in a specific gas market, the interchangeability box defines which gases are acceptable to all users in this particular market.
Graph 1 below visualizes the concept, using the example of the interchangeability box for high-calorific value gases (“H” gases) proposed by EASEE-gas2 in the Common Business Practice 2005-001/01 “Harmonisation of natural gas quality”. The concept of the interchangeability box was also recently proposed by the NGC+3 as a basis for regulating gas quality in the US.
2 EASEE-gas is the gas arm of the European Association for the Streamlining of Energy Exchange. 3 The NGC+ consists of the Natural Gas Council as well as several other gas industry organizations in the United states, and has recently made proposals to the US Federal Government on gas quality restrictions

51
The concept of the Interchangeability boxfor "H" gases on HHV-WI plot
46
47
48
49
50
51
52
53
54
34 36 38 40 42 44
High Heating Value [MJ/m3 (15/15)]
Wob
be In
dex
[MJ/
m3
(15/
15)]
LNG Export Plants
Pure methane
Some Pipeline Gases
Example: EASEE-Gas interchangeability boxdefined by upper and lower Wobbe Index limits as well as restriction on relative density
Graph 1: EASEE-gas Interchangeability Box, LNG and pipeline gas qualities4
An “interchangeability box” is the most useful way of defining a range of gases that can be
used in a gas market without materially affecting burner performance.
Graph 1 shows the quality of LNGs that are currently produced in the existing LNG export plants as well as the design quality for some planned LNG export plants. It is important to note that the data in graph 1 does not reflect the quality guarantees that are provided by the LNG export plants in long term Sales and Purchase Agreements (SPA). Those guarantees contain a quality range rather than a fixed number. Those guaranteed ranges are plant-specific but can cover a range of +/- 2 MJ/m3 around the original design value, in order to allow some flexibility for the quality to change over time due to a number of factors such as the availability, decline and ramp-up of the fields that supply gas to the plant, or changing level of LPG extraction to accommodate for either capacity expansions, maintenance or revenue optimisation. For an LNG trading company those long-term quality guarantees are more relevant than the expected quality ranges, when allocating supplies to a specific market.
Graph 1 also shows some examples of pipeline gases. All the LNGs can be found within a small deviation from a line in the upper part of the HHV-WI plot, whilst a number of pipeline gases are located in the lower part, with a Wobbe Index lower than that of methane. This is due to their relatively high inert gases content such as nitrogen of CO2. 3.2.3. IMPURITIES
There is a range of typical contaminants in natural gas, which customers wish to limit mostly for safety and environmental reasons. For LNG, the process of liquefaction makes it necessary to extract mercury (which damages cryogenic equipment) and water as well as CO2 (which would freeze up) to very low levels, so a further specification in sales contracts is unnecessary. Other impurities are discussed below.
4 This graph presents the expected quality of LNG from existing and planned export plants. It should be noted however that the output of an LNG plant may change in quality over time due to a number of factors, including the availability, decline and ramp-up of the fields that supply gas to the plant.

52
Nitrogen Economic reasons drive the exporter to limit the presence of nitrogen in the LNG: it is hard to
liquefy, and of no value unless it enables the sale of a cargo to a market which has a low limit on HHV or WI. Also, it boils off preferentially during shipping. A typical value at ship loading is 0.5 mol % of Nitrogen in the cargo. Oxygen
Oxygen does not normally occur in natural gas. However, it may be introduced artificially. For instance, at the reservoir, water injected into the formation may contain some dissolved oxygen. However, even small concentrations of oxygen in the LNG export plant feed cause corrosion in the amine treating unit, which remove s acid components from the feed. Hence LNG exporters will take care to limit this component to the minimum.
Further downstream, at the receiving terminal, blending with air or imperfectly separated nitrogen may introduce oxygen. H2S (hydrogen sulphide), COS (carbonyl sulphide), mercaptans and total sulphur
Sulphur content is limited in all sales contracts in one way or another, and will likely become a bigger issue in the future as environmental legislation around the world toughens and LNG exports from the Middle East, which has many sour fields, increase.
H2S is highly corrosive in the presence of liquid water, and can present a problem where regasified LNG is blended with pipeline gas, which may have a higher water content. Typical limits for H2S are between 5 and 7 mg/m3, but there are indications that Japan might move to tighter specifications because of the desire to run fuel cells on gas, which are vulnerable to H2S poisoning. In Europe, EASEE-gas has proposed a global limitation of 4.74 mg/m3 for sulphur in the form of H2S+COS.
Mercaptans are less dangerous, but smelly, and actually added by many local distribution companies for leak detection purposes. The main reason to impose limits is environmental – most of the sulphur in natural gas typically occurs as mercaptans. At the same time, it should be taken into account that removing these components to very low levels means increased costs and more difficult operation at the LNG export plants.
At the moment, a proposal has been put forward by EASEE-gas to limit total sulphur in gas imported into the EU to 28.43 mg/m3. There is however a very tight mercaptans specification (less than 5.69 mg/m3), which may be difficult to meet for some exporters.
In the USA, ever stricter emission standards limit the acceptable total sulfur in natural gas.

53
3.3. THE CURRENT GAS QUALITY DEBATE IN KEY LNG IMPORTING COUNTRIES 3.3.1. JAPAN Requirement of Local Distribution Companies for High Heating Value of LNG
In Japan, the total heating value of natural gas supplied through pipelines by local distribution companies (LDCs) each year reaches 1.2 × 10¹² MJ. Of this value, domestically produced natural gas accounts for only 6%, while LNG accounts for 85% or more. Approximately 20 million tons of LNG is unloaded at the LNG berths of LDCs every year. LDCs are required by law to maintain the High Heating Value (HHV) of the gas they supply at a specified level or over. Typically, companies producing gas mainly from LNG add butane or propane to control the minimum HHV to 41.6 MJ/m3 (44 MJ/m3(n)) and the average HHV to 43.5 MJ/m3 (46 MJ/m3(n)).
The recent dramatic increase in LPG prices has forced LDCs to reduce the average HHV. It is estimated that major LDCs will finish reducing the average HHV to 42.6 MJ/m3 (45 MJ/m3(n)) in 2007.
LDCs prefer not to receive LNG having a low HHV since gas made from this type of LNG is likely to cause knocking in gas engines. A critical value is 39.0 MJ/m3 (41.2 MJ/m3(n)). If LNG of a lower HHV is enriched to a HHV of 42.6 MJ/m3 (45 MJ/m3(n)) by adding butane, the butane content would exceed the critical value that can keep gas engines free from knocking. Therefore, LNG having a HHV of less than 39.0 MJ/m3 (41.2 MJ/m3(n)) is unsuitable as a raw material for LDCs.
The desirable range of the HHV of LNG is from 41.6 to 42.6 MJ/m3 (44 to 45 MJ/m3(n)), since the minimum HHV of natural gas supplied by LDCs must not be less than 41.6 MJ/m3 (44 MJ/m3(n)) according to related regulations, and also because it is economical to minimize the amounts of butane and propane to be blended with LNG. Requirement of Electric Power Companies for Gross Calorific Value of LNG
In Japan, electric power companies purchase 40 million tons of LNG a year independently to supply it as a fuel gas to their power plants using their own facilities.
For conventional steam turbine-driven power generation systems, LNG of an extended HHV range can be used to fire the boilers. However, the demand for higher efficiency power generation facilities has increased in recent years in order to achieve lower greenhouse gas emissions. In such circumstances, at present, power generation systems typically employ gas turbine combined cycle systems.
All thermal power plants that commenced operation in or after 1992 are equipped with gas turbine combined cycle power generation systems. In gas turbine combined cycle power generation, the allowable range of fuel gas Wobbe Index (WI) fluctuation is as narrow as approximately 5% to obtain both high power generation efficiency and low NOx emissions while maintaining stable combustion. Consequently, the WI of send-out gas from the LNG import terminals that is be used as fuel gas for combined cycle power plants is managed to fluctuate only in a range of approximately 2 MJ/m3. Requirement for the Nitrogen Content of LNG
The percentage of nitrogen in LNG boil-off gas is 10 or more times higher than that in LNG. To monitor the HHV of gas distributed by LDCs, the companies analyze the components using gas chromatography. A density sensor, which is a sensor having a high response characteristic, is usually used to control the percentage of butane or propane in the city gas they supply. When nitrogen concentration increases, gross calorific value decreases. On the contrary, the density sensor detects an increase in the gross calorific value. Hence, conspicuous fluctuation of the nitrogen concentration has a significant effect on the quality of the natural gas supplied by LDCs.
In gas turbine power generation systems, substantial fluctuation of the nitrogen concentration will significantly change the WI, leading to a higher risk of flame-lift. Though the nitrogen content of

54
imported LNG is only 0.01 to 0.4 mol%, we should pay attention to the fluctuation of nitrogen concentration when directly using boil-off gas to fire a gas turbine.
In conclusion, increasing the nitrogen content of LNG is unfavorable for both LDCs and electric power companies.
Requirement for the sulfur content of LNG
Contracts with Japanese buyer of LNG typically specify that the total sulfur concentration should not exceed 28.43 mg/m3. They usually also state that the preferable total sulfur concentration not be greater than 4.74 mg/m3.
Household fuel-cell cogeneration systems are at the practical use stage in Japan. Increasing the sulfur content would greatly influence the design of desulfurization equipment.
LNG is recognized as a clean fuel that produces little SOx. LDCs and electric power companies strongly require that the sulfur content be maintained at the desirable level described above. 3.3.2. EU (EASEE-GAS)
With the implementation of a single internal gas market in Europe, the existence of different requirements throughout Europe regarding natural gas quality has appeared to be a potential barrier for interoperability of natural gas networks. These differences in requirements come in multiple forms. Firstly, there is not a unique set of parameters used within Europe for defining the gas specifications. Secondly, values for common parameters may be different from country to country. Finally, in some cases national authorities either approve or specify the gas quality, while in other countries the specifications have been developed by the gas industry itself.
The 5th meeting of European Gas Regulatory Forum therefore identified in February 2002 the need for rapid and tangible solutions to remove such technical barriers. The Forum invited GTE (Gas Transmission Europe) in liaison with relevant stakeholders to set out an action plan and a time-schedule for solving these issues.
GTE prepared a position paper and an action plan for harmonization of gas quality specifications, and presented this at the 6th meeting of the European Gas Regulatory Forum in October 2002. The Forum agreed to the plan and invited EASEE-gas in liaison with GTE, OGP (International Organization of Oil and Gas Producers) and consumer/trading interests to take the lead in streamlining the interoperability for high calorific gas qualities in terms of (i) combustion properties; (ii) High Heating Value and (iii) additional components.
Based on subsequent discussions among the stakeholders, EASEE-gas recommended to the European Gas Regulatory Forum 15-16 September 2005 a Common Business Practice (CBP) on harmonisation of natural gas qualities. The Forum agreed that all necessary actions should be undertaken in order to reduce interoperability problems hampering free trade of gas within a reasonable period. The recommendation on gas qualities was considered to be a step towards a competitive and interoperable European gas market; however further assessment on a national level on how to implement the recommendations was considered necessary. The Forum invited all participants, including the authorities, to assess their respective position before the next Forum in 2006.
The CBP is valid for high calorific gas without added odorants at European cross border points, EU entry points for natural gas pipelines and LNG import terminals. Natural gas arriving at cross border points within the proposed quality specifications shall not be refused for quality reasons, but it is important to emphasis that the CBP does not in any way restrict parties at a cross border point to agree on other specifications.
Variations in gas quality may cause inefficiencies for end consumers. The CBP therefore recommends that the size and frequency of major variations within the ranges should be restricted in a
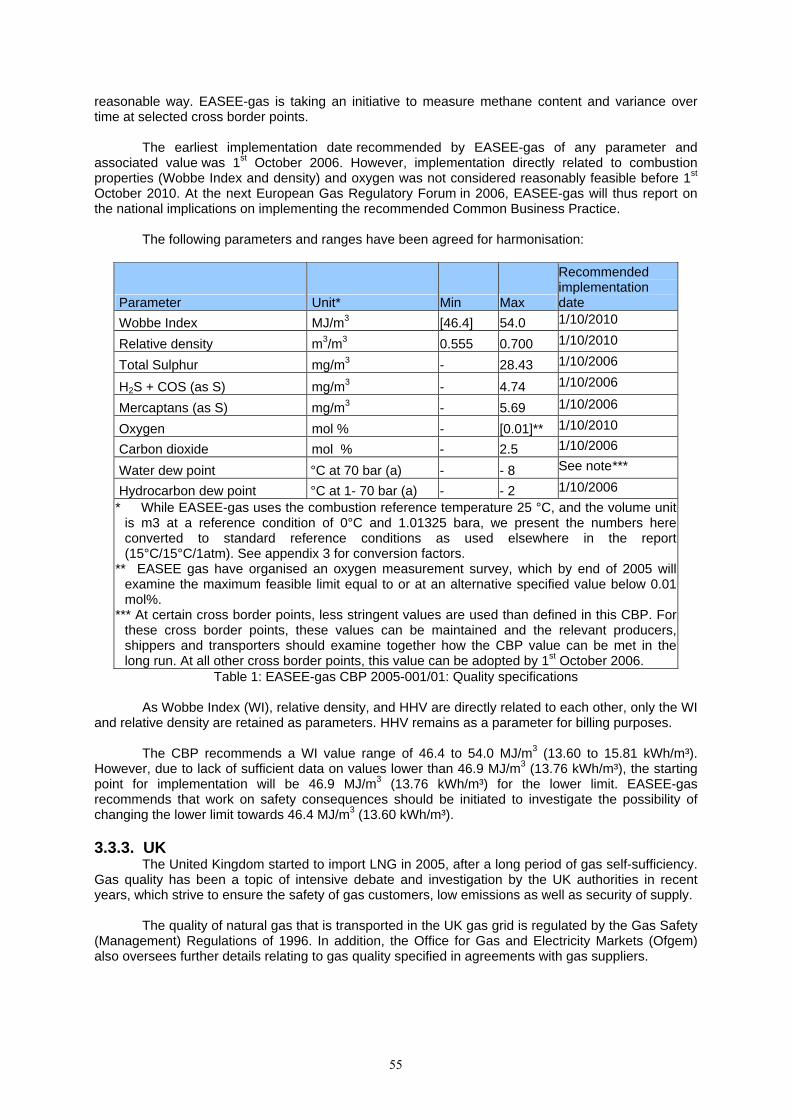
55
reasonable way. EASEE-gas is taking an initiative to measure methane content and variance over time at selected cross border points.
The earliest implementation date recommended by EASEE-gas of any parameter and associated value was 1st October 2006. However, implementation directly related to combustion properties (Wobbe Index and density) and oxygen was not considered reasonably feasible before 1st October 2010. At the next European Gas Regulatory Forum in 2006, EASEE-gas will thus report on the national implications on implementing the recommended Common Business Practice.
The following parameters and ranges have been agreed for harmonisation:
Parameter Unit* Min Max
Recommended implementation date
Wobbe Index MJ/m3 [46.4] 54.0 1/10/2010
Relative density m3/m3 0.555 0.700 1/10/2010
Total Sulphur mg/m3 - 28.43 1/10/2006
H2S + COS (as S) mg/m3 - 4.74 1/10/2006
Mercaptans (as S) mg/m3 - 5.69 1/10/2006
Oxygen mol % - [0.01]** 1/10/2010
Carbon dioxide mol % - 2.5 1/10/2006
Water dew point °C at 70 bar (a) - - 8 See note***
Hydrocarbon dew point °C at 1- 70 bar (a) - - 2 1/10/2006 * While EASEE-gas uses the combustion reference temperature 25 °C, and the volume unit
is m3 at a reference condition of 0°C and 1.01325 bara, we present the numbers here converted to standard reference conditions as used elsewhere in the report (15°C/15°C/1atm). See appendix 3 for conversion factors.
** EASEE gas have organised an oxygen measurement survey, which by end of 2005 will examine the maximum feasible limit equal to or at an alternative specified value below 0.01 mol%.
*** At certain cross border points, less stringent values are used than defined in this CBP. For these cross border points, these values can be maintained and the relevant producers, shippers and transporters should examine together how the CBP value can be met in the long run. At all other cross border points, this value can be adopted by 1st October 2006.
Table 1: EASEE-gas CBP 2005-001/01: Quality specifications
As Wobbe Index (WI), relative density, and HHV are directly related to each other, only the WI and relative density are retained as parameters. HHV remains as a parameter for billing purposes.
The CBP recommends a WI value range of 46.4 to 54.0 MJ/m3 (13.60 to 15.81 kWh/m³). However, due to lack of sufficient data on values lower than 46.9 MJ/m3 (13.76 kWh/m³), the starting point for implementation will be 46.9 MJ/m3 (13.76 kWh/m³) for the lower limit. EASEE-gas recommends that work on safety consequences should be initiated to investigate the possibility of changing the lower limit towards 46.4 MJ/m3 (13.60 kWh/m³). 3.3.3. UK
The United Kingdom started to import LNG in 2005, after a long period of gas self-sufficiency. Gas quality has been a topic of intensive debate and investigation by the UK authorities in recent years, which strive to ensure the safety of gas customers, low emissions as well as security of supply.
The quality of natural gas that is transported in the UK gas grid is regulated by the Gas Safety (Management) Regulations of 1996. In addition, the Office for Gas and Electricity Markets (Ofgem) also oversees further details relating to gas quality specified in agreements with gas suppliers.

56
The GS(M)R specifies a maximum Wobbe Index (WI) in normal operation of 51.41 MJ/m3. There are few LNG suppliers that can satisfy this requirement without further processing at the import facilities. However, according to the Department of Trade and Industry (DTI) of the UK Government, all LNG supplies that could potentially reach the UK in the foreseeable future could be made compliant to the pipeline grid specifications by nitrogen ballasting.
Ofgem decided, at the end of 2005, to lift restrictions on the amount of nitrogen in gas entering the UK national gas grid. According to Ofgem, nitrogen ballasting not exceeding 7 mol % would be sufficient to make the richest possible LNG supplied to the UK conform to the GS(M)R limits.
A government consultation on gas quality is currently under way, and the results are awaited by the industry. One of the questions considered is whether the WI limit specified in the GS(M)R should be raised. The Government has made it clear that such a rise would be unlikely to take effect before the end of the next decade, by which time the UK may already be importing significant volumes of LNG.
According to the DTI, there are currently almost 50 million gas appliances in use in the UK, 46.5 million of which are domestic appliances. The DTI concludes that the cost to the UK of adjusting the quality of imported gas, including LNG, is lower than the cost of replacing or adjusting these appliances. It cautions, however, that the additional processing costs at the import terminals may deter some LNG suppliers with rich product from delivering to the UK.
3.3.4. USA
New energy legislation was recently adopted in the US, which will impact the LNG import terminal permitting process. The legislation helps to streamline the permitting process, by clarifying Federal Energy Regulatory Commision’s (FERC) exclusive jurisdiction over LNG siting, and codifying FERC's Hackberry policy on regulation and access to terminals.
However, while the legislation deals with permitting issues, FERC has so far not provided urgently required clarity on gas quality standards. The industry awaits for the FERC to embrace the gas quality White Paper provided to FERC in March 2005 by a joint industry task force, operating under the guidance of the Natural Gas Council (NGC).
The NGC White Paper contained guidelines that centered on the concept of the “interchangeability box”, meaning that any gas should satisfy requirements on two complimentary parameters, the Wobbe index and HHV. The NGC document is mainly technical in nature, it provides guidelines on parameters and values to use, but it is up to FERC to decide how such guidelines should be implemented. The proposed limits relevant for regasified LNG are an upper WI limit of +4% with respect to the WI of historic supplies with an absolute maximum of 52.1 MJ/m3 (1400 btu/scf (60 deg F, 14.73 psia, real)) and a HHV upper limit of 41.3 MJ/m3 (1110 btu/scf as before).
The US does not have federal or state-wide gas quality specifications. Rather, each pipeline has its own individual gas quality specifications, not all of which are regulated by FERC. FERC only regulates interstate transmission pipelines; intrastate pipeline and distribution networks are regulated by state regulators. Additionally various environmental agencies such as EPA and CARB also impose regulations that indirectly impact gas quality. This regulatory overlap is further complicating matters.
In addition to the federal level activities by the NGC, gas quality is also debated in separate dockets related to all the specific LNG import projects.
Lacking regulatory certainty, LNG trading companies are apprehensive to sign up to rich LNG supplies for the US market at this stage. While there are terminals with FERC approved gas quality specifications that can already accept rich LNG, LNG that does require processing may not fetch as good a price as LNG that meets the specifications once the processing costs are reflected in the net-back pricing. This may prevent some supplies from reaching the US.
Due to the lack of over-arching regulations, the situation is complicated, with individual requirements at every import terminal. The progress of the gas quality debate in the US is watched closely by the industry.
57
3.3.5. CHINA
China’s GDP is predicted to continue growing by 8-9% in the period 2006-2010. Natural gas will be pivotal to underpin economic growth combined with high efficiency and low pollution in some key developing areas.
LNG will play a key role in some coastal areas including Bohai Rim, Yangtse River Delta and Pearl River Delta. Forecasts for LNG imports range from 30-50 bcm per year by 2020, with first imports starting in 2006 in Guandong/Dapeng, followed by Fujian in 2008. Two other projects, in Shanghai and Zhejiang respectively, have started site preparation work, and seven new projects (Shangdong, Jiangsu, Liaoning Tianjin, Hebei, Guangxi, and a second project in Guangdong) have either received the central government’s formal notice to proceed or implicit agreement to go ahead.
China currently doesn’t have specifications for imported LNG. Quality is set on a contract-by-contract level. Most big cities still distribute medium calorific value towngas from coal and naphtha and will need to implement consumer conversion programmes when natural gas becomes widely available. Natural gas quality specifications in China are very wide and set only a few broad parameters regarding gross calorific value, CO2 and sulphur specifications.
In addition to indigenous supplies, China might import LNG from several sources plus pipeline gas from Russia. The currently identified supplies – domestic and imported - display a 25% range between the highest and lowest Wobbe numbers. For instance the CAPCO minimum WI is 41.8 MJ/m3 whereas Guandong maximum Wobbe is 52.2 MJ/m3. Also Guandong and Fujian terminals will import LNG with different characteristics: lean LNG from Tangguh (Fujian) and rich LNG from Australia Northwest Shelf (Guandong). Such wide range of domestic and imported supplies in domestic appliances might pose interchangeability questions.
Considering the size of China and the diverse sources of gas supplies it would take several years until the whole gas transportation and distribution systems are unified. If this were to happen it would be useful if China would have a common national specification for the regions that consume natural gas. This measure would prevent costly and lengthy consumer gas conversion programmes which would certainly cost hundreds of millions of US$ to be implemented. Those specifications could potentially be as broad as possible like in Spain (where there is a total 20% allowance for minimum and maximum Wobbe) without compromising safety and environmental standards.
A key issue is to work with appliance manufacturers to provide more flexible equipment. Since China is just starting its gas economy it can more easily leapfrog and produce state of the art flexible gas appliances. This should be planned before LNG is made available and before actual towngas systems are converted from medium calorific value towngas to high calorific value natural gas/regasified LNG. For more details on China, please refer to appendix 3.4. 3.3.6. INDIA
While a gas market has existed in India for some time, the customers are mainly industrial users. Distribution grids in cities are rare, and the need for space heating and cooking fuel is widely met by kerosene and LPG or kerosene.
There are only 3 LDC’s operating in Mumbai, Delhi and Gujarat and a growing number of CNG vehicles. A long distance pipeline connects the West and North markets with domestic gas and more recently LNG being fed into the system.
Currently the gas market is fragmented. However, the rapidly growing overall energy demand as well as economic pressures arising from the high prices of alternative fuels are expected to lead to strong gas demand growth. While it is possible that some international gas pipelines may be built to supply the Indian gas market in the future, it is expected that imported LNG will also play a significant role.
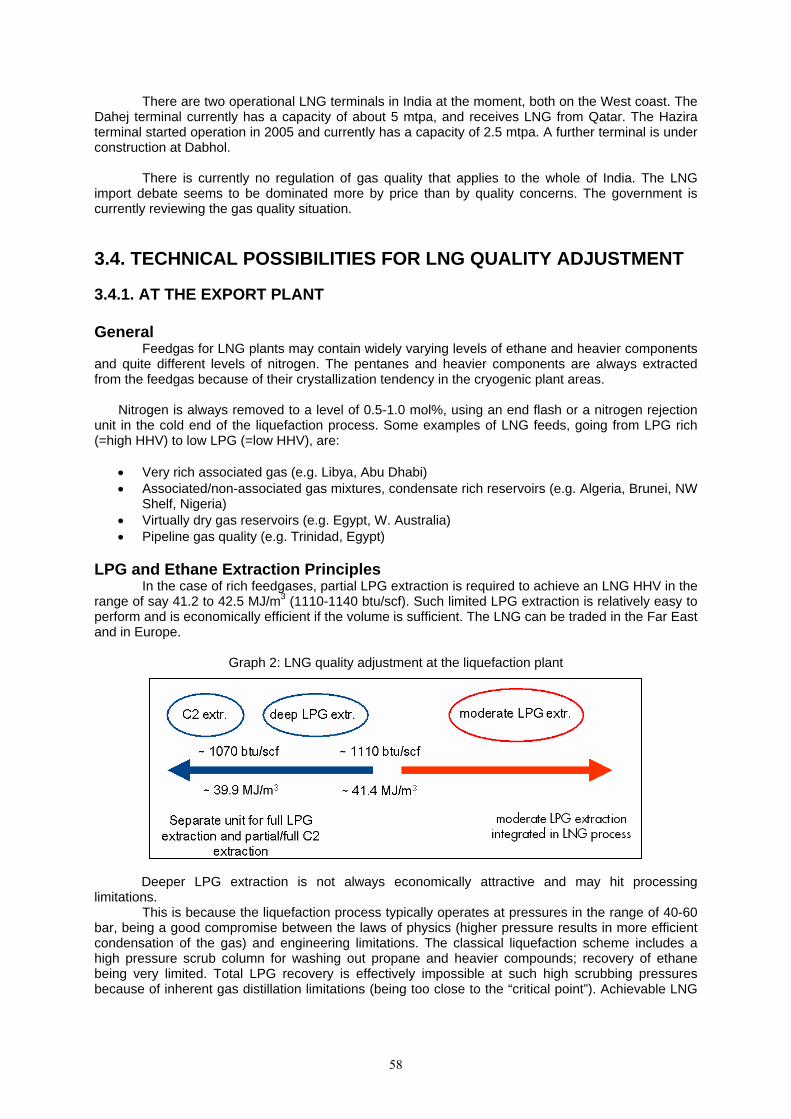
58
There are two operational LNG terminals in India at the moment, both on the West coast. The Dahej terminal currently has a capacity of about 5 mtpa, and receives LNG from Qatar. The Hazira terminal started operation in 2005 and currently has a capacity of 2.5 mtpa. A further terminal is under construction at Dabhol.
There is currently no regulation of gas quality that applies to the whole of India. The LNG import debate seems to be dominated more by price than by quality concerns. The government is currently reviewing the gas quality situation. 3.4. TECHNICAL POSSIBILITIES FOR LNG QUALITY ADJUSTMENT 3.4.1. AT THE EXPORT PLANT General
Feedgas for LNG plants may contain widely varying levels of ethane and heavier components and quite different levels of nitrogen. The pentanes and heavier components are always extracted from the feedgas because of their crystallization tendency in the cryogenic plant areas.
Nitrogen is always removed to a level of 0.5-1.0 mol%, using an end flash or a nitrogen rejection unit in the cold end of the liquefaction process. Some examples of LNG feeds, going from LPG rich (=high HHV) to low LPG (=low HHV), are:
• Very rich associated gas (e.g. Libya, Abu Dhabi) • Associated/non-associated gas mixtures, condensate rich reservoirs (e.g. Algeria, Brunei, NW
Shelf, Nigeria) • Virtually dry gas reservoirs (e.g. Egypt, W. Australia) • Pipeline gas quality (e.g. Trinidad, Egypt)
LPG and Ethane Extraction Principles
In the case of rich feedgases, partial LPG extraction is required to achieve an LNG HHV in the range of say 41.2 to 42.5 MJ/m3 (1110-1140 btu/scf). Such limited LPG extraction is relatively easy to perform and is economically efficient if the volume is sufficient. The LNG can be traded in the Far East and in Europe.
Graph 2: LNG quality adjustment at the liquefaction plant
Deeper LPG extraction is not always economically attractive and may hit processing
limitations. This is because the liquefaction process typically operates at pressures in the range of 40-60
bar, being a good compromise between the laws of physics (higher pressure results in more efficient condensation of the gas) and engineering limitations. The classical liquefaction scheme includes a high pressure scrub column for washing out propane and heavier compounds; recovery of ethane being very limited. Total LPG recovery is effectively impossible at such high scrubbing pressures because of inherent gas distillation limitations (being too close to the “critical point”). Achievable LNG

59
HHV’s are some 40.6 MJ/m3 (1090 btu/scf) when starting from a rich feedgas and some 39.9 MJ/m3 (s) (1070 btu/scf) when starting from a rather lean feedgas, being low in ethane. It has to be realised that such extraction goes at the expense of the LNG production capacity for two reasons, namely
• The “cold” used for dropping out the LPG is not available anymore for producing LNG • It is harder to liquefy a lean LNG in the first place Every ton of LPG extracted in this way costs one to three tons of LNG depending on various
parameters, such as the depth of extraction, quality of the feedgas, pressure of extraction, designing a new plant or adding to an existing operation etc. The penalty is very much project specific, so it is not easy to give a simple correlation.
There are solutions based on techniques used in the gas processing industry to extract full LPG and to partially extract ethane as well. The key is to reduce the distillation pressure to some 20-30 bar and to re-compress the stripped gas going to the liquefaction unit. The decision of which process to use depends on technical criteria and economic considerations. This separate extraction unit is expensive, but when the scale is right the added revenue could make extraction economically attractive. LPG and Ethane Extraction Costs
LPG and Ethane extraction units will have an impact in four areas: • Increased plant capital expenditures due to the additional equipment (storage and treatment
units, loading facilities and related utilities) • Increased amounts of feedgas required • Added complexity of additional maritime traffic around the plant. LPG tankers are normally not
part of the plant dedicated fleet • Increased safety constraints related to the handling and storage of LPG When extracting substantial volumes of LPG, the total extra cost can be in the range of 300-500
million US$, assuming export of separate refrigerated propane and butane products. The total LPG volume must be more than a critical volume, say about 0.4 million ton per annum, to make the scheme economic.
There is no real international market for refrigerated ethane, which means that ethane extracted in large volumes can only be piped to nearby petrochemical plants. Small volumes of extracted ethane can be used as fuel gas in the LNG plant, however this will back out fuelgas from the endflash unit. The burning of ethane may as a consequence cost several percent of LNG production.
It is clear from the above that without a large disposal possibility, ethane is very costly to extract. Therefore, bringing the LNG HHV below some 39.1 MJ/m3 (1050 btu/scf) is very difficult in many cases.
As a last comment, it is to be remembered that without any extraction it is more costly to produce lean LNG from a lean feed than it is to produce rich LNG from a rich feed. For instance producing 39.1 MJ/m3 (1050 btu/scf) HHV LNG from pipeline gas may cost 5-10% more than producing 42.5 MJ/m3 (1140 btu/scf) HHV LNG from medium to rich feedgas.
It is clear from the above that going or not going for deep LPG (and ethane) extraction is a major decision in any LNG project. Retrofitting in an existing project is usually expensive and only economically attractive when the LPG volumes are substantial and the “lean” LNG markets are sufficiently attractive. 3.4.2. AT IMPORT TERMINAL General
Quality adjustment at LNG import terminals can be achieved by the following techniques: • Enrichment of LNG by addition of LPG. • Blending of LNG with natural gas or LNG of a different composition.

60
• Ballasting of a rich LNG with an inert gas (e.g. nitrogen). • Extraction of the C3+ or even ethane by fractionation of LNG.
The following sections describe each of these techniques, assess their likely feasibility and
compare and contrast them where appropriate. We acknowledge GIIGNL5 for their kind permission to use some elements of their report on quality adjustment methods at LNG receiving terminals, issued in 2005 for members use only. LPG injection (Liquefied Petroleum Gases = C3, C4)
This technique is widely used in Japan where the HHV required in the local distribution networks is higher than the HHV of some imported LNGs. Technically, the process is fairly simple but it requires additional equipment for LPG unloading, storage, heating and mixing, thus increasing significantly the capital costs. Operating costs are obviously impacted by the purchase of Butane and Propane, the energy content of these products being valorised at natural gas prices, usually lower than LPG prices. Blending of LNGs of different compositions
The mixing of LNGs of different qualities in tanks is a routine operation where an import terminal receives LNG from diverse suppliers. Mixing is often necessary for internal terminal tank management (i.e. to provide free capacity for the next cargo to be unloaded) and although some blending will take place in-tank as a consequence, this is generally an operational side effect rather than an operational objective.
The use of in-tank blending to achieve a desired send-out gas quality is not routinely carried out in the industry. Blending is difficult to rely on as a quality adjustment mechanism unless a substantial amount of LNG is stored at the import terminal, which may entail prohibitive costs. Precautions must also be taken to avoid stratification and possible roll-over in the tanks used for blending.
An alternative approach to blending in LNG tanks is to blend in the send-out section of the LNG import terminal. This is achieved by blending LNG from two or more LNG tanks, upstream the LNG vaporizers. In order to achieve the desired send-out gas quality, it is necessary to control the flow rate of LNG from each tank such that each LNG was added in the correct proportion. Such technique is currently used in Japan as a complement to LPG injection.
A disadvantage of this technique is that it is necessary to have separate tanks for each LNG source, which is likely to increase the total storage capacity and capital cost of the terminal. Whereas blending might help to manage gas quality, it is usually not a tool that can be counted on for back-to-back quality guarantees, especially not in the case of LNG import terminals with limited storage capacity. Blending in pipeline networks
An alternative to blending in the import terminal is to blend further downstream at the entry into a pipeline network. The feasibility of this technique is very situation specific and is dependent on factors such as the operations of other shippers and the size and quality specifications of the pipeline network. In particular, the flow rate of gas available for blending with re-gasified LNG from an import terminal would have to be high enough to ensure that the blended gas stayed within the specified quality range of the pipeline network.
Unfortunately, given that the gas send-out rate from an LNG import terminal is usually substantial when compared to the flow rate in the network that it enters, there are currently very few places in the world where this could be achieved other than the Gulf Coast of the USA and possibly at Zeebrugge in Belgium. However, other opportunities could arise elsewhere as supply sources will undoubtedly change over time.
5 G.I.I.G.N.L.: Groupe International des Importateurs de Gaz Naturel Liquéfié – Paris (International Group of Liquefied Natural Gas Importers – Paris (France))

61
Ballasting with nitrogen Nitrogen ballasting has a particularly strong effect on Wobbe Index. This number is
proportional to the High Heating Value (HHV) and inversely proportional to the square root of Relative Density. The addition of nitrogen to LNG reduces the HHV of re-gasified LNG because nitrogen is an inert gas. Meanwhile, the addition of nitrogen increases the Relative Density of the mixture, the Relative Density of nitrogen (0.969) being significantly higher than the methane one (0.556). The net results of adding nitrogen to regasified LNG are therefore to reduce the HHV and increase the Relative Density, both leading to a reduction in Wobbe Index.
Nitrogen injection is a safe and well proven technique for quality adjustment in the case of LNG being too rich compared to the local network specifications. However, the amount of injected nitrogen is often limited by the maximum nitrogen (or inert gases) content in natural gas, set forth in the local specifications. In the UK, the maximum nitrogen limit has just been lifted. In the USA, 3% is normally the allowable limit, thus allowing a Wobbe Index reduction of about 3%.
It is of course necessary to first secure a supply of nitrogen which could be obtained “over the fence” through a company specialised in industrial gases or by mean of a dedicated air separation unit built inside the terminal itself. Nitrogen is mainly obtained from the ambient air using either membrane permeation or cryogenic distillation technologies.
The choice of technology will largely amount to a cost/benefit analysis between technologies that can deliver enough nitrogen of sufficient purity for the particular application. In the case of the US for instance, which requires a very lean LNG and has an oxygen specification of around 100 to 200 ppm maximum, membrane technology may be advantageous, in particular where the utilization of the nitrogen plant is intermittent.
In addition to the choice of nitrogen technology and how it is applied, the point at which the nitrogen is to be injected is an interrelated and key decision. There are four main locations that could be considered and these are shown in figure 3 below.
LNG Storage
HP LNG PumpsLNG Re-Condenser LNG Vaporizer
BOG Compressor
InjectionPoint 1
InjectionPoint 2
InjectionPoint 4
InjectionPoint 3
Send-Out Gas
LNG Inlet
Vapour Return
Graph 3 – Potential Nitrogen Injection Points
Qualitative consideration of the four alternative injection points would seem to suggest that the first or fourth options would be the most promising.
• Injection Point 1 - upstream of the re-condenser - Nitrogen injected at relatively low pressure in liquid or gaseous form.
• Injection Point 4 - downstream of the vaporizer – Nitrogen injected at relatively high pressure in gaseous form.
From an energy perspective, injection point 1 is better than injection point 4 because it requires
less compression power. However, injection point 4 offers two significant advantages: (1) it does not imply any modification of the regasification process thus facilitating retrofit on existing terminals and, (2) in the case of multiple send-out pipelines supplying gas to different customers it allows to inject nitrogen only in the pipeline(s) where it is compulsory (and not, for instance, in a pipeline dedicated to a power plant)

62
Special attention should be paid to the range of the required nitrogen flowrate, which is the product of the send-out flowrate range and the percentage of nitrogen required, depending upon the LNG quality. A very wide range of nitrogen flowrates is likely to be necessary in a lot of cases, thus leading to the installation of multiple parallel small nitrogen production units rather than a big one. An alternative is to have a liquid nitrogen buffer storage, for example being supplied with liquid nitrogen by truck. Ballasting with other gases
Air ballasting (also known as ‘air stabilization’ and ‘dilution’) has obviously a lower cost than nitrogen ballasting, the air separation unit becoming unnecessary. Air contains approximately 79% nitrogen and 21% oxygen, so the effect of air ballasting on the properties of natural gas is very similar to the effect of nitrogen ballasting, albeit with the disadvantage that oxygen is introduced into the natural gas. Due to local gas specifications, which often impose very low oxygen content, this method is seldom practicable.
It is possible to ballast with other gases, for instance CO2; however, it is not thought that this has actually been done in an import terminal. Extraction of Natural Gas Liquids (NGL = Ethane, Propane, Butane)
Extraction of NGLs from LNG is a standard fractionation process with the exception that the operating temperatures involved are substantially lower than for most other fractionation processes. It is possible to design a fractionation process to separate as many LNG components as desired, although to produce a greater number of separate products, a greater number of distillation columns are required.
In the simplest process, in which it is desired only to separate light components (e.g. nitrogen, methane and ethane) from heavier components (e.g. propane, butane, pentane and heavier), only a single distillation column is required. In a more complicated process, a system of four distillation columns can be used in series to produce products consisting predominantly of methane, ethane, propane, butane and pentane. This type of scheme was used at Barcelona LNG for the treatment of former ultra-rich LNG from Libya. The scheme has been dismantled a few years ago.
Although there is no current example of a fractionation unit in operation at an LNG terminal, such a solution could be found economical in the future, if the terminal is located in close proximity to existing gas processing facilities and, even more important, a market for ethane. Processing infrastructure is important since the NGLs extracted from LNG in almost all cases need to be further refined before they can be sold, unless there is an NGL pipeline in close proximity.
NGL extraction (like LPG injection) also involves a significant increase in safety precautions related to the handling and storage of the NGLs, and this can lead to difficulties in placing the units in plants where space is limited. It can also mean greater difficulty in obtaining safety and environment permits.
For reasons of reliability, an additional nitrogen injection facility is likely to be necessary for dealing with the maintenance periods of the fractionation units. Nitrogen injection could also complement the fractionation in the case of rich spot LNG cargoes going out of the design specifications of the fractionation units.
The considerable increase in US LNG demand and the specific gas quality issues in this country have led some engineering companies involved in the very active US gas processing industry to promote innovative processes aiming to deal with variable LNG composition and pipeline specifications and to reduce processing costs at LNG receiving terminals. Comparison Nitrogen Injection Vs NGL Extraction
As noted previously, nitrogen injection and NGL extraction do not offer the same service from a technical standpoint.
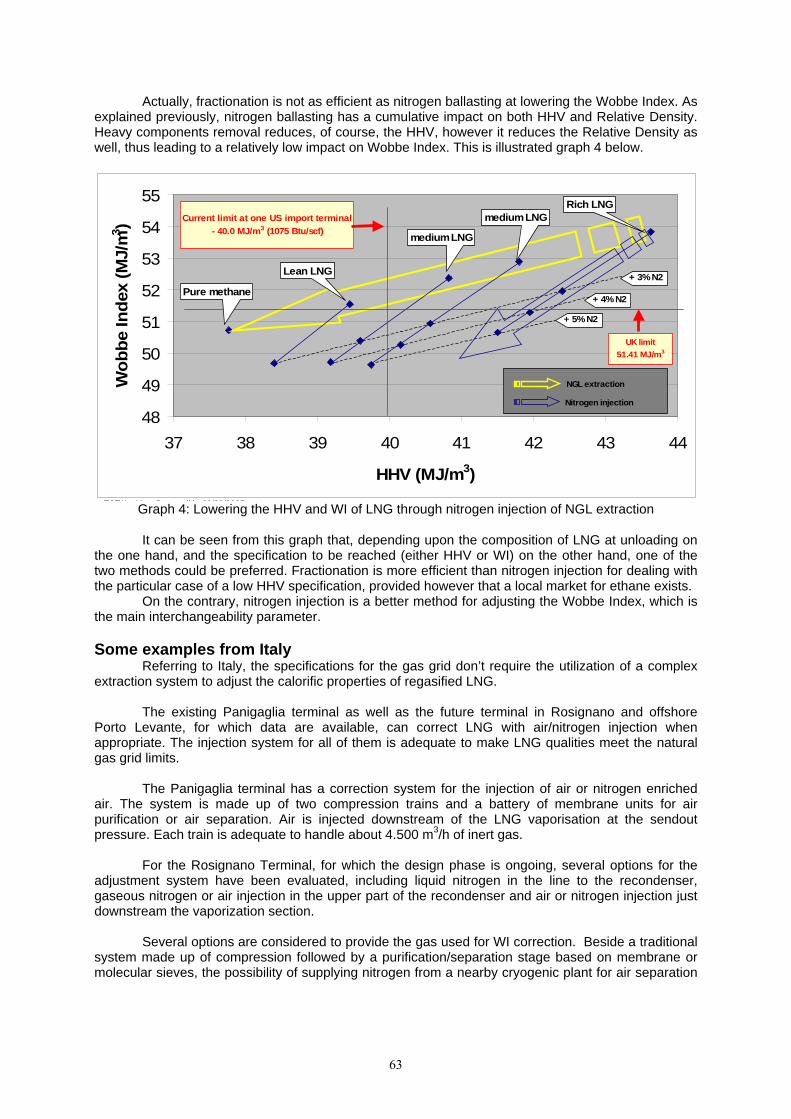
63
Actually, fractionation is not as efficient as nitrogen ballasting at lowering the Wobbe Index. As explained previously, nitrogen ballasting has a cumulative impact on both HHV and Relative Density. Heavy components removal reduces, of course, the HHV, however it reduces the Relative Density as well, thus leading to a relatively low impact on Wobbe Index. This is illustrated graph 4 below.
48
49
50
51
52
53
54
55
37 38 39 40 41 42 43 44
HHV (MJ/m3)
Wob
be In
dex
(MJ/
m 3 )
+ 3% N2
+ 5% N2
+ 4% N2
Current limit at one US import terminal - 40.0 MJ/m3 (1075 Btu/scf)
Rich LNG
TOTAL Y B llé 29/09/2005
NGL extraction
Nitrogen injection
medium LNG
medium LNG
Lean LNG
Pure methane
UK limit51.41 MJ/m3
Graph 4: Lowering the HHV and WI of LNG through nitrogen injection of NGL extraction
It can be seen from this graph that, depending upon the composition of LNG at unloading on
the one hand, and the specification to be reached (either HHV or WI) on the other hand, one of the two methods could be preferred. Fractionation is more efficient than nitrogen injection for dealing with the particular case of a low HHV specification, provided however that a local market for ethane exists.
On the contrary, nitrogen injection is a better method for adjusting the Wobbe Index, which is the main interchangeability parameter. Some examples from Italy
Referring to Italy, the specifications for the gas grid don’t require the utilization of a complex extraction system to adjust the calorific properties of regasified LNG.
The existing Panigaglia terminal as well as the future terminal in Rosignano and offshore Porto Levante, for which data are available, can correct LNG with air/nitrogen injection when appropriate. The injection system for all of them is adequate to make LNG qualities meet the natural gas grid limits.
The Panigaglia terminal has a correction system for the injection of air or nitrogen enriched air. The system is made up of two compression trains and a battery of membrane units for air purification or air separation. Air is injected downstream of the LNG vaporisation at the sendout pressure. Each train is adequate to handle about 4.500 m3/h of inert gas.
For the Rosignano Terminal, for which the design phase is ongoing, several options for the adjustment system have been evaluated, including liquid nitrogen in the line to the recondenser, gaseous nitrogen or air injection in the upper part of the recondenser and air or nitrogen injection just downstream the vaporization section.
Several options are considered to provide the gas used for WI correction. Beside a traditional system made up of compression followed by a purification/separation stage based on membrane or molecular sieves, the possibility of supplying nitrogen from a nearby cryogenic plant for air separation
64
and liquid oxygen and nitrogen production, which will benefit from the cold of the LNG, is being evaluated for assessing the synergic economic and technical advantages of such an option.
In case this option proves to be feasible and economically suitable, considering the plant maximum sendout (1.100.000 m3/h, corresponding to 120% of average sendout) up to 21 t/h (17.800 m3/h) of nitrogen will be produced, pumped and vaporized in a dedicated ORV for WI adjustment purposes.
The terminal in Porto Levante (8 Bcm per year receiving terminal), will be equipped with a Wobbe Index (WI) adjustment unit to correct the sendout gas to meet grid specification. Air will be injected into the BOG recondenser where it will be absorbed by the LNG prior to being pumped to the vaporization section.
For the selected WI system, 2-50% trains are envisioned. Each train consists of an inlet filter, a multi-stage centrifugal compressor, molecular sieve air dryer units and post filters. Dried air will feed to the recondenser at about 9 bar. For the correction of the heavy design LNG (up to 53.4 MJ/m3) about 14,900 Nm3/h dried gas is required. The WI adjustment system required an increase of about 12% of the total plant power consumption during normal operation. However, as this operation will be infrequent, there was no increase to the overall power generation sizing to accommodate WI adjustment.
Providing a nitrogen system for WI adjustment instead of the dry air system is more costly than providing air for WI, even though the power requirement for the nitrogen system is less.

65
3.5. CONCLUSIONS AND RECOMMENDATIONS 3.5.1. GENERAL
It is clear that the LNG market is undergoing a fundamental transition. As natural gas provides an increasing percentage of global energy needs, while gas reserves close to developed markets are being depleted, the amount of LNG produced and consumed rises every year.
One aspect of this growth is the larger number of players participating in LNG trade, both on the exporting and importing side. Another is an increase in the amount of LNG traded outside long-term contracts. A critical point seems to have been reached, where suppliers and consumers talk more and more about the “Atlantic Basin” (usually including the Mediterranean Basin) and the “Asia Pacific Region” and the LNG supply – demand balance within them. The Middle East is often referred to as a supply region, supplying both the Atlantic Basin and Asia Pacific.
However, there is as yet no clear vision on the future quality of traded LNG. As the LNG markets become more liquid, are we going to see a convergence on a single LNG quality? Or are we going to end up with various traded grades? 3.5.2. AVAILABLE LNG AND MARKET REQUIREMENTS
There seem to be four types of LNG markets currently, seen from the point of view of LNG quality:
• Traditional Far-Eastern LNG markets (Japan, Korea), which receive practically no pipeline gas. Gas customers here strongly prefer rich gas, which fits well with the integrated LNG value chain (maximum energy density in LNG cargoes, easier liquefaction, gas infrastructure optimisation). To an extent, LNG that is too lean can be enriched by injecting LPGs. However, these need to be bought at a cost, and LNG that is too lean to be sold to end users without LPG injection is likely to fetch a lower price. While there are niche markets in the Far East for lean gas, the main requirement will be for rich LNG. As a rule of thumb, the leaner the LNG, the lower the price it is likely to fetch.
• Traditional Continental Europe markets (France, Spain, Italy and Belgium), which are able
to receive varied qualities of LNG thanks to a broad range of acceptable Wobbe Indexes. The recent proposals for very broad EU wide gas quality requirements underline Europe’s desire to attract LNG from as wide a range of suppliers as possible, to increase its security of gas supply. This does not however remove the need for quality adjustment measures in certain places, as illustrated for Italy (see chapter 4).
• New LNG markets with major integrated pipeline systems (USA, UK), where deep
extraction of feedstock for a local LPG market or petrochemical industry from pipeline gas is common, and where fairly large amounts of inerts may remain in the pipeline gas (e.g. some North Sea gas). As a consequence, end users here have appliances tuned to lean natural gas. Lean LNG, which is interchangeable with existing supplies without the need for WI or HHV adjustment at the import terminal, will likely fetch a higher price than richer LNGs that do require such adjustment. This economic penalty may not apply if the combination of existing NGL extraction facilities and a market for ethane in close proximity to the regasification terminal make the extraction and sale of NGLs economically attractive. However, this is an exceptional situation. As a rule of thumb, the richer the LNG above the WI threshold value, the lower the netback price it is likely to fetch.
• New LNG markets without major integrated gas pipeline systems, e.g. China or India,
where the wish of the buyers to receive LNG from as many (competing) supply projects as possible may lead to very broad gas quality specifications. Security of supply considerations may encourage these markets to opt for rather wide quality restrictions, possibly following broadly the EASEE-gas proposal for Europe. It should be noted that gas appliances exist that can cope with a wide WI range. Any country, but particularly these emerging gas markets, may find it a wise decision to make these mandatory.

66
These markets are the targets for existing LNG operations as well as new LNG projects, some of which, especially in the Middle East and in West Africa, are very large. Graph 5 below shows how gas quality requirements and the world’s LNG supply portfolio match up. It should be noted that the EASEE-gas range as well as the NGC+ interchangeability box are merely proposals at this stage, but they reflect what the industry believes would be acceptable for the markets. The ranges shown for Japan and the UK reflect existing regulations.
Gas Quality Requirements of Major Marketswith quality of LNG at loading
50.0
50.5
51.0
51.5
52.0
52.5
53.0
53.5
54.0
37 38 39 40 41 42 43 44
High Heating Value [MJ/m3 (15/15)]
Wob
be In
dex
[MJ/
m3
(15/
15)]
Atlantic+Med. LNG
Middle East LNG
Asia Pacific LNG
Pure methane
Methane like gas (0.554)
Heavy gas (0.660)
USA - NGC+
UK - GS(M)R
Europe - EASEE-gas Japan - desired HHV range
Graph 5: WI-HHV supply-demand picture6
The graph shows that: • The gas quality requirement of the two major emerging Atlantic Basin markets and the
requirements of Japan appear as two distinct areas on the WI-HHV plot, corresponding to lean and rich LNGs, respectively
• While there are more suppliers of rich than of lean LNG in the Asia Pacific region, and, conversely, more suppliers of lean LNG in the Atlantic Basin (including the Mediterranean countries) than of rich LNG, there is considerable diversity of qualities in all three regions.
• Europe’s proposed EASEE-gas quality “restrictions” are not restricting any LNG supplies • LNG of a medium WI and HHV, i.e. a HHV of around 41 MJ/m3 (1100 btu/scf), can be sold
into all markets but will require WI or HHV adjustment to enter either the USA/UK or the Japanese markets.
3.5.3. VIEW TO THE FUTURE
It seems likely at this stage that LNG markets will demand two distinct broad-band LNG qualities in substantial volumes: a low-Wobbe grade, with a WI up to about 52 MJ/m3, and a high-Wobbe grade with a WI above this value. 6 This graph presents the expected quality of LNG at loading. It should be noted however that the output of an LNG plant may change in quality over time due to a number of factors, including the availability, decline and ramp-up of fields that supply gas to the plant. Therefore LNG suppliers will tend to negotiate for some contractual quality flexibility in LNG supply contracts. This means that some of the supplies that seem to match gas market specifications on this graph may not in fact be suitable for long-term supply contracts without providing for WI/HHV adjustment capability at the import terminal, because the suppliers are not in a position to guarantee a stable, sufficiently low WI or HHV of their product. Note also that LNG “ages” during transport, which means that both HHV and WI increase by about 0.2-0.4 MJ/m3 during a medium to longer voyage

67
A full convergence of the requirements of the very large traditional LNG markets in the Far East and the fast-growing new LNG markets in the US and the UK, which are used to lean pipeline gas, seems unlikely for the following reasons:
• The Far Eastern markets are always going strongly prefer rich LNG, which allows consumers there to utilise existing gas appliances without LNG importers having to purchase a lot of expensive LPG to achieve the require HHV.
• The traditional pipeline markets are going to strongly prefer LNG, which has a Wobbe and
HHV which is low enough to operate their existing systems safely, avoiding expensive system modifications as well as costly nitrogen injection7.
• LNG of a medium quality will be valuable mainly because of its ability to go to a wide range of
markets; however costly treatment (injection of LPGs in the Far East or injection of inerts, or even LPG extraction in the traditional pipeline markets) will make this LNG less attractive to sell to one of the two “extreme” markets.
For each individual export project, it may be desirable to be able to make a good price in at least
one of the two markets with “extreme” LNG quality requirements: the low Wobbe markets, which have recently offered good prices, or the traditional high WI market in the Far East, where large volumes can be placed, and long term contracts may be possible.
These market considerations may motivate export projects to design their facilities such that they will be able to deliver into at least one of the two broad quality bands without need for further modification. However, other considerations such as feed gas quality, demand for NGLs at the location of the export plant and the economics of LPG production for export, strongly influenced by the size of the facility, will create a unique combination of trade-offs to consider for every project. 3.5.4. RECOMMENDATIONS
If a double-broad-band LNG market is the future, what recommendations for the industry can be given? We would like to suggest the following for consideration:
• New large LNG producers may consider designing flexibility into their operations, to be able to supply both relatively rich and relatively lean gas. This will allow them to access virtually all markets, and may offer attractive spot market opportunities as well as a strong position to negotiate long term contracts. Due to their geographical position and the size of their gas resources, some Middle Eastern countries are particularly well placed for this strategy.
• Small to medium LNG producers may decide to go for a medium LNG export quality; this
could be particularly attractive if the plant is part of the LNG portfolio of a larger international company. This position on the HHV-WI plot offers interesting arbitrage opportunities at higher risk.
• LNG importing countries, especially those with emerging gas markets, would be well advised
to introduce wide gas quality specifications and the associated flexible burners and turbines early on, to maximise supply opportunities at minimum cost.
• It seems likely that markets with gas quality requirements in the middle of the LNG quality
range, and certainly those that can take both high and low WI LNG, will have a wider range of supplies to choose from leading to a higher security of supply and, potentially, lower prices for LNG.
7 Note however that there will always be terminals that will make the investment to attract richer cargoes, e.g. Altamira, Lake Charles and most probably Baja, if the specifications allow them to do so.

68
APPENDICES Appendix 3.1: Bibliography
• Reference is made to ISO Norm 13443:1996, Natural Gas: Standard Reference Conditions • EASEE-gas CBP 2005-001/01, Harmonisation of Natural Gas Quality, approved 3 February
2005, published by EASEE-gas at http://www.easee-gas.org/ • White Paper on Natural Gas Interchangeability and Non-Combustion End Use, NGC+
Interchangeability Work Group, 17 Dec 2004, published by the North American Energy Standards Board on http://www.naesb.org/pdf/update011905w10.pdf
• Letter by Ofgem, the Office for Gas and Energy Markets (UK) of 22 December 2005, on the “Uniform Network code modification 049 ‘Optional limits for inert gases at System Entry Points’”, published by Ofgem on their website www.ofgem.gov.uk
• Future Arrangements for Great Britain’s Gas Quality Specifications, Department of Trade and Industry (UK Government), 30th December 2005, published at http://www.dti.gov.uk/energy/domestic_markets/gas_market/gas_quality.shtml

69
Appendix 3.2: Conversion factors for HHV and WI to btu/scf btu/scf MJ/m3 kWh/m3 MJ/m3 MJ/m3 15/15/1 60/60/14.73 25/0/1 25/0/1 0/0/1 15/15/1 to convert from multiply with btu/scf 15C/15C/1atm 1 1.0007 0.03927 0.01091 0.03938 0.03726 btu/scf 60F/60F/14.73psia 0.9993 1 0.03924 0.01090 0.03935 0.0372 MJ/m3 25C/0C/1atm 25.46 25.48 1 0.2778 1.0027 0.9487 kWh/m3 25C/0C/1atm 91.67 91.73 3.600 1 3.6097 3.415 MJ/m3 0C/0C/1atm 25.40 25.41 0.997 0.2770 1 0.9461 MJ/m3 15C/15C/1atm 26.84 26.86 1.054 0.2928 1.0569 1
Table 2: Approximate conversion factors for WI and HHV
• Column 2 gives the reference conditions in the order (combustion reference temperature) / (volume measurement temperature) / (reference pressure). “C”, “F”, “atm” and “psia” stand for the units degree Celsius, degree Fahrenheit, pressure in standard atmospheres (1 atm = 101.325 kPa) and pressure in pound per square inch absolute (14.73 psia = 101.559 kPa), respectively. For example, 25C/0C/1atm stand for the following reference conditions: Combustion reference temperature 25 degree Celcius, volume measurement at 0 degree Celsius and 1 atmosphere pressure
• Conversion factor based on own research and ISO 13443:1996 • accurate to +/- 0.1%, for real natural gases
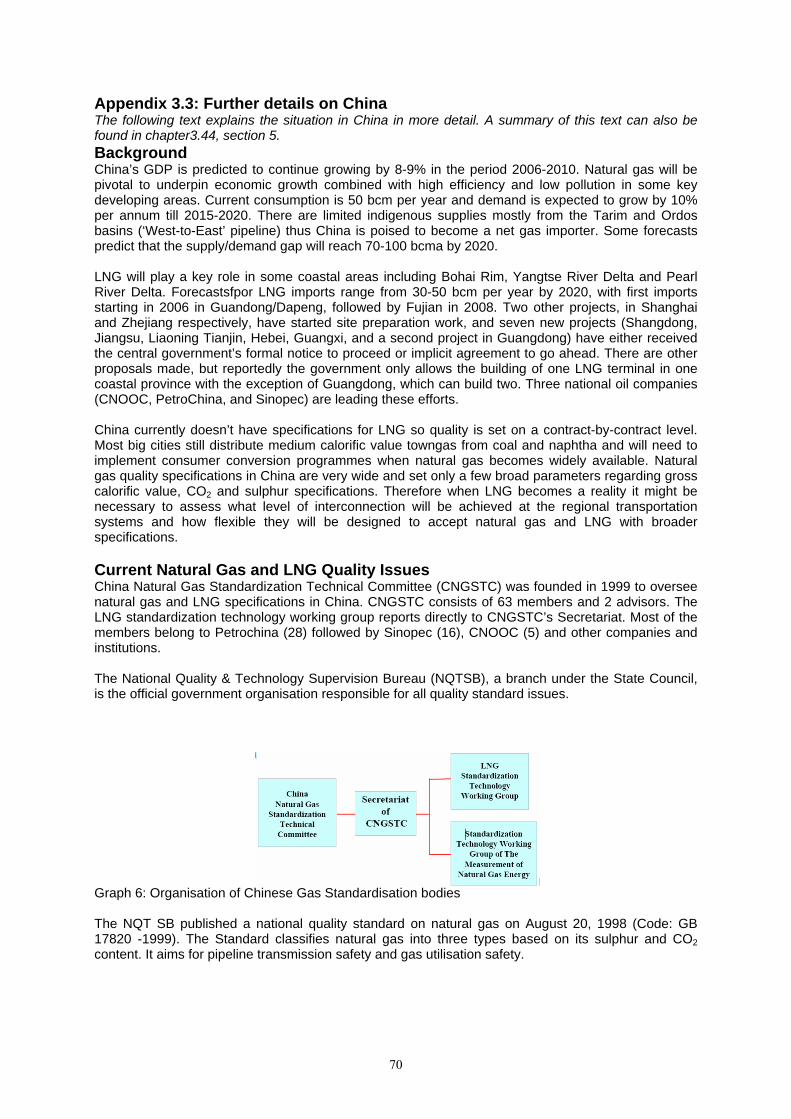
70
Appendix 3.3: Further details on China The following text explains the situation in China in more detail. A summary of this text can also be found in chapter3.44, section 5. Background China’s GDP is predicted to continue growing by 8-9% in the period 2006-2010. Natural gas will be pivotal to underpin economic growth combined with high efficiency and low pollution in some key developing areas. Current consumption is 50 bcm per year and demand is expected to grow by 10% per annum till 2015-2020. There are limited indigenous supplies mostly from the Tarim and Ordos basins (‘West-to-East’ pipeline) thus China is poised to become a net gas importer. Some forecasts predict that the supply/demand gap will reach 70-100 bcma by 2020. LNG will play a key role in some coastal areas including Bohai Rim, Yangtse River Delta and Pearl River Delta. Forecastsfpor LNG imports range from 30-50 bcm per year by 2020, with first imports starting in 2006 in Guandong/Dapeng, followed by Fujian in 2008. Two other projects, in Shanghai and Zhejiang respectively, have started site preparation work, and seven new projects (Shangdong, Jiangsu, Liaoning Tianjin, Hebei, Guangxi, and a second project in Guangdong) have either received the central government’s formal notice to proceed or implicit agreement to go ahead. There are other proposals made, but reportedly the government only allows the building of one LNG terminal in one coastal province with the exception of Guangdong, which can build two. Three national oil companies (CNOOC, PetroChina, and Sinopec) are leading these efforts. China currently doesn’t have specifications for LNG so quality is set on a contract-by-contract level. Most big cities still distribute medium calorific value towngas from coal and naphtha and will need to implement consumer conversion programmes when natural gas becomes widely available. Natural gas quality specifications in China are very wide and set only a few broad parameters regarding gross calorific value, CO2 and sulphur specifications. Therefore when LNG becomes a reality it might be necessary to assess what level of interconnection will be achieved at the regional transportation systems and how flexible they will be designed to accept natural gas and LNG with broader specifications. Current Natural Gas and LNG Quality Issues China Natural Gas Standardization Technical Committee (CNGSTC) was founded in 1999 to oversee natural gas and LNG specifications in China. CNGSTC consists of 63 members and 2 advisors. The LNG standardization technology working group reports directly to CNGSTC’s Secretariat. Most of the members belong to Petrochina (28) followed by Sinopec (16), CNOOC (5) and other companies and institutions. The National Quality & Technology Supervision Bureau (NQTSB), a branch under the State Council, is the official government organisation responsible for all quality standard issues. Graph 6: Organisation of Chinese Gas Standardisation bodies The NQT SB published a national quality standard on natural gas on August 20, 1998 (Code: GB 17820 -1999). The Standard classifies natural gas into three types based on its sulphur and CO2 content. It aims for pipeline transmission safety and gas utilisation safety.
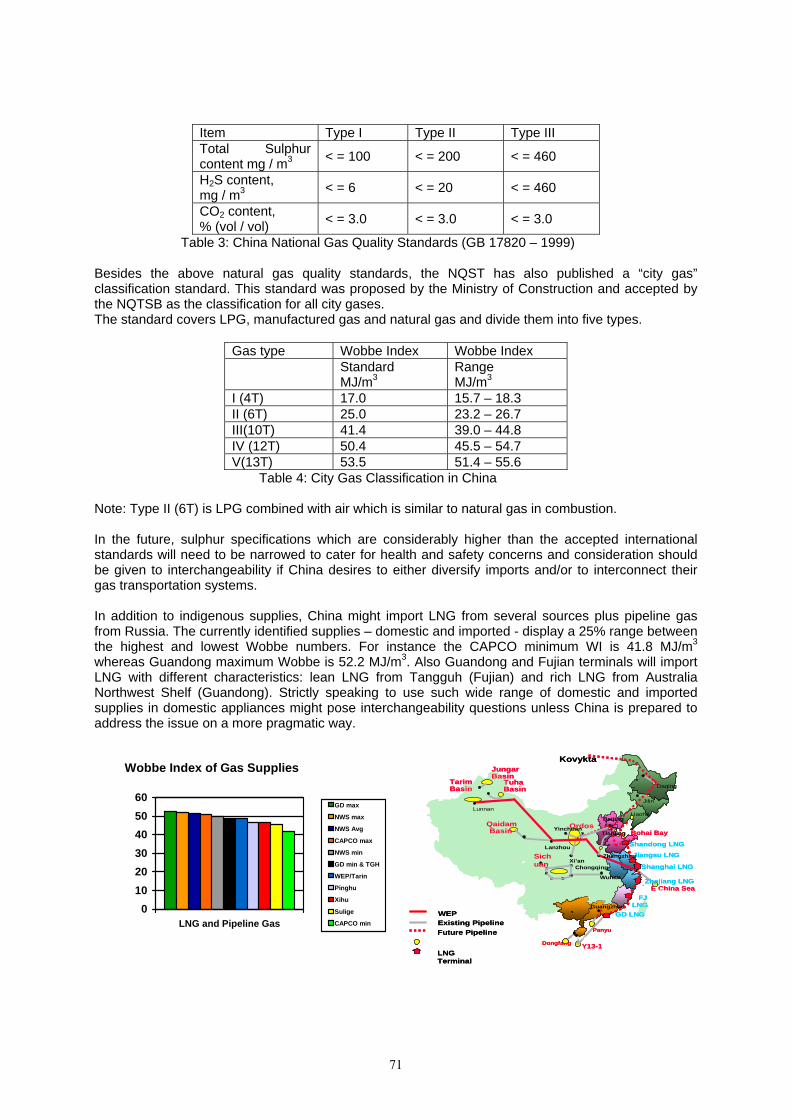
71
Item Type I Type II Type III Total Sulphur content mg / m3 < = 100 < = 200 < = 460
H2S content, mg / m3 < = 6 < = 20 < = 460
CO2 content, % (vol / vol) < = 3.0 < = 3.0 < = 3.0
Table 3: China National Gas Quality Standards (GB 17820 – 1999) Besides the above natural gas quality standards, the NQST has also published a “city gas” classification standard. This standard was proposed by the Ministry of Construction and accepted by the NQTSB as the classification for all city gases. The standard covers LPG, manufactured gas and natural gas and divide them into five types.
Gas type Wobbe Index Wobbe Index Standard
MJ/m3 Range MJ/m3
I (4T) 17.0 15.7 – 18.3 II (6T) 25.0 23.2 – 26.7 III(10T) 41.4 39.0 – 44.8 IV (12T) 50.4 45.5 – 54.7 V(13T) 53.5 51.4 – 55.6
Table 4: City Gas Classification in China Note: Type II (6T) is LPG combined with air which is similar to natural gas in combustion. In the future, sulphur specifications which are considerably higher than the accepted international standards will need to be narrowed to cater for health and safety concerns and consideration should be given to interchangeability if China desires to either diversify imports and/or to interconnect their gas transportation systems. In addition to indigenous supplies, China might import LNG from several sources plus pipeline gas from Russia. The currently identified supplies – domestic and imported - display a 25% range between the highest and lowest Wobbe numbers. For instance the CAPCO minimum WI is 41.8 MJ/m3 whereas Guandong maximum Wobbe is 52.2 MJ/m3. Also Guandong and Fujian terminals will import LNG with different characteristics: lean LNG from Tangguh (Fujian) and rich LNG from Australia Northwest Shelf (Guandong). Strictly speaking to use such wide range of domestic and imported supplies in domestic appliances might pose interchangeability questions unless China is prepared to address the issue on a more pragmatic way.
Wobbe Index of Gas Supplies
0102030405060
LNG and Pipeline Gas
GD max
NWS max
NWS Avg
CAPCO max
NWS min
GD min & TGH
WEP/Tarin
Pinghu
Xihu
Sulige
CAPCO min
Jiangsu LNG
E China Sea
TarimBasin
Lunnan
JungarBasin
TuhaBasin
QaidamBasin
Ordos
Xihu
Xi’anSichuan Chongqing
Y13-1
Hongkong
Sanya
Liaohe
Bohai Bay
200km
Yinchuan
Zhengzhou
Wuhan
Lanzhou
Beijing
Kovykta
GD LNG
Zhejiang LNG
FJ LNGGuangzhou
Dongfang
Jilin
Daqing
Tianjing
Shandong LNG
Existing PipelineFuture PipelineGas FieldLNG Terminal
Shanghai LNG
WEP
Panyu

72
Graph 7&8: Chinese Natural Gas infrastructure, Wobbe index of gas supplies
Recommendations Considering the size of China and the diverse sources of gas supplies it would take several years until the whole gas transportation and distribution systems are unified. If this was to happen it would be useful if China would have a common national specification for the regions which would consume natural gas. This measure would prevent costly and lengthy consumer gas conversion programmes which would certainly cost hundreds of millions of US$ to be implemented. Those specifications could potentially be as broad as possible like in Spain (where there is a total 20% allowance for minimum and maximum Wobbe) without compromising safety and environmental standards. A key issue is to work with appliance manufacturers to provide more flexible equipment. Since China is just starting its gas economy it can more easily leapfrog and produce state of the art flexible gas appliances. This should be planned before LNG is made available and before actual towngas systems are converted from medium calorific value towngas to high calorific value natural gas/regasified LNG. China could also consider the possibility of establishing an intermediary gas quality standard in the mid-range between the lean and rich gases. On the importing side, LNG terminals should be flexible enough to accommodate a wider range of supplies. Wider local/regional specifications will be instrumental to enable more flexible imports. CNGSTC should also consider interchangeability studies and parameters with industry support.
73
4. SAFETY AND TECHNOLOGY DEVELOPMENTS IN LNG
TERMINALS AND VESSELS
REPORT OF STUDY GROUP D 2
“Safety and Technology Developments in LNG Terminals and Vessels”
RAPPORT DU GROUPE DE TRAVAIL D 2
“Sécurité et Développements Technologiques des Terminaux de GNL et des Méthaniers”
Study Group Chairman/Président du Groupe de Travail
O. BRUNO LARSEN
Norway
74
TABLE OF CONTENTS
4.1. INTRODUCTION AND SUMMARY 4.2. TECHNOLOGY DEVELOPMENTS IN EXPORT
TERMINALS 4.2.1. Liquefaction process 4.2.2. Storage 4.2.3. LNG transfer 4.2.4. Offshore terminals 4.2.5. Environmental issues
4.3. TECHNOLOGY DEVELOPMENTS IN LNG CARRIERS 4.3.1. Larger vessel designs 4.3.2. Hull 4.3.4. LNG Reliquefaction 4.3.5. Environmental issues
4.4. TECHNOLOGY DEVELOPMENTS IN IMPORT TERMINALS 4.4.1. Onshore terminals 4.4.2. Offshore gravity based structures 4.4.3. Regasification vessels solutions 4.4.4. Environmental issues
4.5. STANDARDS 4.6. SAFETY – EXPORT AND IMPORT TERMINALS 4.7. SAFETY - LNG TRANSFER 4.8. SAFETY - LNG CARRIER
4.8.1. Design and Operation 4.8.2. Sea staff training 4.8.3. Best operational practices 4.8.4. Port operations
4.9. SECURITY APPENDIX 4.1: Safety Questionnaire APPENDIX 4.2: Available Legislation and Recommendations
Information APPENDIX 4.3: Study Group Mandate and Work Programme APPENDIX 4.4: study group meeting list APPENDIX 4.5: Containment Systems APPENDIX 4.6: Propulsion systems APPENDIX 4.7: LNG Reliquefaction onboard LNG carriers

75
ABSTRACT
This report details the work undertaken by Study Group D 2 during the triennium 2003–2006.
The development of new LNG import and export terminals and LNG vessels meets many environmental hurdles not least the perceived high safety and security risk. Criteria differ from one country to another. The efficiency improvements and development in LNG vessels technology and terminal concepts, including very large vessels and offshore regasification terminals, are moving the industry into the future. The study aims to deal with safety risk perceptions and support implementation of new technology by the industry’s actors.
The meeting schedule is listed in Annex 4.4.
RÉSUMÉ
Ce rapport détaille les travaux entrepris par le Groupe de Travail D 2 durant le Triennat 2003–2006.
Le développement de nouveaux terminaux d’exportation et d’importation de GNL et de nouveaux méthaniers se heurte à de nombreux obstacles environnementaux, la perception de risques élevés en matière de sécurité et de sûreté n’étant pas des moindres. Les critères diffèrent d’un pays à l’autre. La recherche d’amélioration des rendements et les développements de nouveaux concepts dans la technologie des méthaniers et des terminaux, incluant les méthaniers de très grande capacité et les terminaux de regazéification en mer, poussent l’industrie vers le futur.
La présente étude vise à améliorer la perception des risques en matière de sécurité et à soutenir la mise en œuvre de nouvelles technologies par les acteurs de l'industrie.
. Les dates des réunions tenues sont présentées en annexe 4.4.

76
4.1. INTRODUCTION AND SUMMARY
The world’s largest consumer of natural gas – the USA - will according to the US National Petroleum Council not be able to meet the growing demand for gas from domestic production, or via pipelines from Canada. Annual US imports of up to 5 TCF of natural gas delivered as LNG by 2025 is therefore forecasted, and will require the construction of 15 new LNG receiving terminals, and will result in over 2000 ship calls per year.
Europe is also seeking to increase and diversify its supply of natural gas. New import terminals are under construction in Spain, whereas several others are planned in the Mediterranean region and in the UK. In Asia, although Japan and Korea are the major buyers, India has joined the club and has one import terminal in place. China has two import facilities under way. Both countries are set to become important LNG importers in the future and will require several more terminals.
To meet this growing demand, liquefaction capacity is forecast to increase to close to 250
million tons per year in 2010 from around 140 million tons per year in 2004. The world LNG fleet, currently consisting of about 191 vessels and about 135 vessels on
order, is forecast to increase to more than 300 by the turn of the decade. 4.1.1. INTERNATIONAL GAS UNION (IGU) STUDY GROUP ON SAFETY AND
TECHNOLOGY
The development of new LNG import and export terminals and LNG carriers meets many environmental hurdles not least the perceived high safety and security risk. Criteria differ from one country to another. The efficiency improvements and development in LNG carrier technology and terminal concepts, including very large vessels and offshore re-gasification terminals, are moving the industry into the future.
This is the mandate of IGU Study Group D 2 aimed at dealing with safety risk perceptions and
support implementation of new technology by the industry. The study group has consisted of 18 members from 13 countries representing practically all parts of the LNG chain.
The IGU is a world-wide, non-profit organization promoting the progress of the gas industry.
Through its many member countries representing approximately 90% of global sales, IGU covers all aspects of the natural gas industry. The IGU is therefore in a position to use its weight to help and support specialized bodies such as the Society of International Gas Tanker and Terminal Operators (SIGTTO) to educate, inform and influence decision makers on issues that concern all nation members and the industry at large. The IGU therefore focus’s attention on safety and will co-ordinate closely with SIGTTO and other international organizations. If the LNG industry is to meet the forecasts of projected growth, safety issues must be addressed globally.
This study group report is submitted to the IGU World Gas Conference in Amsterdam in 2006.
Throughout the 2003-2006 triennium the study group has had a continuous emphasis on safety awareness throughout the LNG industry.
4.1.2. TECHNOLOGY DEVELOPMENTS
The study group report covers recent technology developments. Many of these developments carry not only an economical advantage as their driving force, but have new additional safety, security and environmental reasons for being pursued.
There have been efforts in the LNG industry to reduce cost considerably. Cost reductions
have largely been achieved by technology advances, scale increase, efficiency improvements and lighter construction. The increased engineering skills, computer tools and operating experience make it possible to reduce design margins. The main changes during the last 3 –5 years and ongoing developments are summarized.

77
The cost of LNG plants has fallen in the last decade, and brown field trains can now be built for 150 - 200 USD/tpa. The total plant project will cost considerably more and is site dependent. Published cost data for total plant also varies because the battery limit has been defined differently.
In LNG marine transportation we will se evolution of the containment systems through
improvement of the existing and the development of new designs. We are now also seeing alternative propulsion systems. Such as the environmental friendly diesel-electric systems and the slow speed diesel systems with reliquefaction of the ship’s boil off. There is also development of vessels capable of regasifying and delivering its cargo without berthing at a jetty. These are the major new developments.
The development frontier is being pushed with the increase in LNG carrier size. The largest to
be built is currently 153 000 cubic meters. Soon we will see ships capable of carrying more than 200 000 cubic meters of LNG. They have been feasible to build technically for some time and make a lot of sense economically as it is clear that the transportation cost per unit can be considerably reduced. So why have they not been built before? There are two simple reasons. Firstly, there are today very few port facilities that are capable of handling these very large LNG carriers. Secondly, very few existing export and import facilities have the storage capacity to handle such large volumes, nor the opportunity to expansion tank capacity. However, we see that future port facilities are being scaled to handle very large vessels and new green field plants and terminals will be built to handling such large vessels and cargoes.
There are some 50 LNG terminals proposed in the US and Mexico in addition to many around
the world. Finding a suitable location and obtaining permission to build a new traditional onshore LNG receiving terminal is proving to be difficult for environmental, safety, security and political reasons.
New offshore, fixed or floating, receiving systems are therefore under development. Several
oil and gas and shipping companies are investigating, designing and planning for the establishment of the first ever offshore LNG receiving system. A floating receiving terminal system based on onboard re-gasification was put into operation in March 2005 in the Gulf of Mexico as the world’s first floating receiving terminal for LNG.
Besides the development of offshore based fixed gravity based or floating turret moored
offshore receiving terminals, other issues that is under way in terminal developments (both export and import terminals) are: large super-size trains of +7 million tons per year; new liquefaction processes; refrigeration compressor electric drivers; new hose based loading and discharge systems in competition with the pipe and swivel solutions of the “chiksan” arms; and large in-ground storage tanks, just to mention a few of the major new developments covered by this report. 4.1.3. SAFETY IN THE LNG CHAIN
In collaboration with the Society of International Gas Tanker and Terminal Operators (SIGTTO), IGU conducted a survey of standards and guidelines used at LNG production, transportation and receiving facilities world-wide.
The invitation was been sent to an extended list of IGU and SIGTTO members in October
2004. IGU and SIGTTO Members were asked to contribute by identifying which safety standards are
used at their plant, terminal or onboard their vessels. The list was to be as comprehensive as possible, including both international as well as national standards and guidelines. The invitation letter and the survey (questionnaire) matrix are enclosed in 4.1.
The study group report covers operational safety, process safety, storage safety, marine
facilities and interface safety and regasification safety, as well as security at the export and import terminals. Furthermore, on the LNG carrier side the study will cover operational safety, hull and machinery, berthing safety and security.

78
The”LNG chain” is for the purpose of this report defined as the chain of inter-dependent infrastructures elements from the inlet of the LNG liquefaction process to the outlet of the LNG vaporizers that re-gasifies the natural gas, including storage and marine facilities and the vessels transporting the LNG.
The study group has made a concerted effort to establish an overview of the standards,
recommendations and rules and legislation throughout the LNG chain in order to identify gaps. Areas not covered by adequate standards and rules are exposed to widely variable operating practices and should be addressed to encourage best practice and uniform operating environments.
Accidents at two liquefaction plants have raised safety concerns. A train at Malaysia LNG's
Tiga’s facility was damaged by fire in August 2003, and in January 2004, the Skikda LNG plant in Algeria built in the early 1970’s was damaged by an explosion that claimed 27 lives and injured a further 74. Three of the six trains at the plant were destroyed. Investigations on the latter incident have not lead to the real cause of the incident, but it is thought that a release of hydrocarbons had taken place in the liquefaction section of one of the trains. Vapours had been then sucked by the nearby boiler FD fan and ignition would have been initiated inside the boiler furnace.’ 4.1.4. SECURITY
Following the 9/11 terrorist attack on the twin towers of the world trade centre in New York, increased attention has been put on security and safety aspects of many industries, including that of marine transportation and ports and terminals. For seven weeks LNG carriers were denied entry into Boston harbour. Time magazine, in its March 11, 2002 issue, reported that “the US Coast Guard is arming itself against a possible terrorist attempt to destroy major U.S. coastal city by detonating a tanker loaded with liquefied natural gas”.
In the aftermath of 9/11 several new security issues related to the transportation and storage
of LNG has been brought forward. As a result we have seen the implementation of the new International Ship and Port Security (ISPS) Code adopted by the International Maritime Organisation.
Fear of terrorist attacks has caused the general public to worry about the perceived hazard of
LNG vessels. Unfortunately there is a lot of misinformation and misconceptions. What happens if the tanks of an LNG carrier are ruptured by an explosion, will the LNG
explode? Experts seems to agree that damaging overpressures (explosion) are unlikely, but that a pool fire is highly likely due to multiple ignition sources near the ruptured tanks. Fortunately, no LNG vessel has ever been exposed to such an event.
We know however what happened to an LPG carrier - the 40 000 m3 “Gaz Fountain” during
the Iran/Iraq war. The ship was hit by 3 air-to-ground armour piercing missiles while transiting the Arabian Gulf. One missile hit and damaged the deck area in the forward part of the vessel, but did not ignite the cargo. The other two missiles hit the area around the aftermost tank no. 3 and one penetrated the cargo tank resulting in a severe fire that also engulfed the superstructure. Its cargo of Butane is more easily ignited than Methane. However, there was no explosion. The crew shut down all systems and abandoned the vessel. A salvage team subsequently managed to extinguish the fire and restart the cooling system. 93% of the cargo and the vessel were subsequently salvaged.
Several simulation modelling studies of LNG spills have been carried out in recent years, but
the methods carry with them a lot of uncertainties. A US Federal Energy Regulatory Commission (FERC) has recently issued a report study carried out by American Bureau of Shipping (ABS) which concluded that models have limitations, consequence assessment is only one piece of the risk picture and risk perception and risk acceptance are complex issues.
However, according to the ABS study, no pool spread models are available that account for
wave actions or currents and relatively few experimental data are available for validation of models involving LNG spills on water, and there are no data available for relatively large spills. Therefore
79
there may be significant uncertainty in the application of modelling, and the industry is starting to consider a large scale experiment involving an LNG carrier scheduled to be scrapped. 4.1.5. SUMMARY
Safety and security in the LNG chain can not be looked upon as segregated regional or commercial concerns. It is something that affects the whole LNG industry, directly or indirectly, everywhere and in all parts of the LNG chain. The LNG industry must address this to move forward. We must educate, inform and hopefully influence decision makers on issues that concern the industry as a whole. It is therefore good to register that in addition to this study group report, a number of initiatives have recently been undertaken to address and study safety and security issues.
World LNG trade has been the safest form of sea transportation throughout its 40 year history
and we in the business strive very hard to maintain this record. Good co-operation through international bodies such as SIGTTO or GIIGNL, etc. is one important factor for the LNG industry in maintaining its outstanding safety record as it is set for tremendous growth over the next 25 years. 4.2. TECHNOLOGY DEVELOPMENTS IN EXPORT TERMINALS 4.2.1. LIQUEFACTION PROCESS 4.2.1.1. Introduction
Baseload LNG plants have been in operation for more than 40 years. There has been a continuous development and efforts to reduce the cost. Cost reductions have largely been achieved by technology advances, scale increase and efficiency improvements. The engineering skills, computer tools and operating experience result in reduced design margins. However, present steel prices and the high level of activity may be curbing the development in cost reductions. The main technology changes during the last 3 –5 years and ongoing developments are summarized. 4.2.1.2. Pre-treatment
The removal of CO2 has traditionally been performed using an amine absorbent and the trend is now towards using tertiary amines as they need less energy than the primary and secondary amines. The choice is influenced by the amount of CO2 in the gas and the possible presence of H2S. The Snøhvit LNG plant, Norway, presently under construction will sequester CO2 from feed gas and will be re-injected. Current practice is to release CO2 to atmosphere.
Water is removed by adsorption using molecular sieves, typically by zeolites. Mercury is removed by adsorption using sulphur-impregnated activated carbon to avoid attack
of the aluminium in the cryogenic heat exchangers (amalgamation and amalgam corrosion). 4.2.1.3. NGL recovery
The USA and UK market request a leaner LNG than traditionally to the Asian markets. Commercial reasons may also result in a deeper recovery of the natural gas liquid fractions.
There is a large variation in the optimization of the liquid recovery and a move away from the
traditional front end recovery. Alternatives can be categorized as:
• a straddle type position, i.e. between the pre-cooling and the liquefaction section • a fully integrated process
Typically turbo-expanders are used instead of Joule-Thompson valves in order to recover energy.Integration with the refrigeration in the LNG process may result in energy saving of up to 30%.

80
4.2.1.4. Liquefaction Process
The large train sizes in operation per end of 2005 are in the range of 4.2 – 5 MMTPA responding to processing of more than 0.56 – 0.71 MSm3/d of gas.
The majority of existing plants are using the well proven C3/MCR® process, licensed by Air Products and Chemicals, Inc., APCI. The main equipment items are 1 LNG main cryogenic heat exchanger and 2 or more turbines for driving the compressor in the pre-cooling loop (propane refrigerant) and the compressor in the main liquefaction loop (mixed refrigerant). Process Licensors and Oil and Gas companies have developed variations which lead to more capacity and improved efficiency.
The major increase in capacity is based on the selection of the appropriate compressor trains (compressors and drivers) and by adding a third cycle to the 2 cycle refrigeration process, or using parallel trains within a 2 cycle process.
• 3 refrigeration cycles in series The existing process and equipment sizes are maintained but with reduced cooling duty. The final refrigeration is performed in the 3rd refrigeration loop using nitrogen as refrigerant, and this process is proven in the air separation/liquefaction industry.
• 2 refrigeration cycles and 2 parallel liquefaction trains
One main advantage is that the proven Frame 7 turbines may be used to drive each of the compressors in the pre-cooling and in the 2 parallel refrigeration loops. The parallel train also improves availability as 60 % of production can be maintained if one liquefaction train trips.
Both processes give the opportunity of adding the 3rd or the parallel train later. Expansion turbines are replacing the JT valve for the final flash of LNG for better efficiency. These main changes, combined with other changes, result in new expected train sizes of 8-9
MMTPA. The first plant in this category is Qatargas II 2008 using a 3rd refrigerant loop (N2) and 3 Frame 9 turbines.
The auto consumption in the new LNG trains is expected to be 5-6 % of the energy in the feed
depending on the air and seawater temperature.

81
Source:Shell Global Solutions - Note to the figure: The Linde MCF process have also a configuration which can be extended > 7 MMTPA. 4.2.1.5. Compressor drivers
The LNG industry has typically used GE’s turbines and the size has increased and today Frame 7 is widely used. The Frame 7 duty can be supplemented by using the starter motor as a helper when operating in normal production.
Designs based on Frame 9 have been developed and the first one to be implemented is planned for Qatargas II 2008. The availability is expected to decrease and subsequent production loss may occur. The cooling duty is improved by reducing the compressor speed from 3600 rpm to 3000 rpm, which is possible when using Frame 9.
Arguments for installing 2 x 50% machines are to increase availability and then Frame 5 gas
turbines are also an alternative. Electric motors for the main compressors are another alternative. A dedicated power plant
with heat recovery reduces energy loss and removes the limited vendor situation of today when using gas turbines for direct drive. The Snøhvit plant will be the first LNG plant with electric motors, 4.2 MMTPA each.
Combined cycle gas turbine (CCGT) power plants and the use of variable speed motors add
to operational flexibility and energy efficiency. The CCGT efficiency of 58% combined with electric motors of 96% efficiency will drive the power efficiency up towards 56% (from 20-35% typically today). 4.2.1.6. Heat exchangers
Plate and fin heat exchangers are commonly used for the refrigeration prior to the main LNG heat exchanger. In the Phillips cascade process they are used throughout the whole process. The same is the situation for the proposed Liquefin™ process from Axens of France.
Spiral wound type of heat exchanger (SWHE) consists of aluminium tubing in a spiral wound
configuration. These have mainly been delivered by Air Products. The Linde spiral wound heat exchanger has entered the market and changed this situation of a single source vendor. Linde has currently delivered SWHEs to North West Shelf Expansions 4 & 5, Brunei (replacement of APCI Heat Exchangers) and to the two LNG plants currently under construction, Snøhvit LNG and Sakhalin LNG.
Shell and tube designs have been used for the pre-cooling heat exchangers (typically for the
C3 exchangers in the C3 MR process). The Heatrix printed circuit heat exchanger is used in Oman LNG. Other micro channel heat exchangers have been mentioned in the context of LNG. 4.2.1.7. Influence of site

82
The site conditions, ambient temperature, air or water cooling and the location of the plant in
relation to infrastructure, the society, ground conditions and harbour facilities have a profound effect on the concept, timing and the cost.
The thermodynamic efficiency decreases by a rule of thumb factor of 0.7 % per degree C
increase in cooling medium temperature. The gas turbine power is reduced similarly by ~1% per degree C increase in air temperature. Thus, sites located in areas with cold climate, like Snøhvit, Sakhalin and Shtokman, Russia; have therefore some advantages regarding LNG plant efficiency. 4.2.1.8. Instrumentation
The LNG industry has benefited from developments in the field of instrumentation and controls. The Distributed Control System (DCS) is the main system used for regulatory control, sequential control and discontinuous control such as interlocks. It is supported by PLC’s (Programmable Logic Controllers) for functions such as ESD (Emergency Shut Down) systems, BMS (Burner Management System), and other special applications requiring dedicated systems. Standalone digital controllers are also often used for specific applications such as anti-surge control for compressors.
The Fire & Gas Detection Systems (using gas detectors, fire detectors, smoke detectors and
cold temperature detectors) can be linked to PLC systems that run logics to warn plant personnel through appropriate human-machine interface devices or to automatically shutdown a plant or part of it.
The main improvements brought by the DCS can be summarized as follows:
• Better control accuracy
• Increased speed of response
• More information available for the operators
• User friendly Human-Machine Interfaces
• Better ability to design and implement advanced control strategies
• Availability of history data over long periods of time
• Lead to communication standards such as Ethernet, OPC, etc., that have enabled different systems to exchange information easily
• Interface other Information Technology systems 4.2.2. STORAGE 4.2.2.1. Introduction
LNG is stored at atmospheric pressure in large insulated tanks, the design of which has been developed over the last six decades to provide the high level of integrity which is required by the LNG industry. Storage provides a buffer between the “continuous” flow of LNG from/to a process facility, and the “batch” flow to/from a LNG carrier. The volume of storage provided is dependent on the capacity of the LNG carrier, the throughput of the terminal and other operational factors.
Primary and secondary containment barriers ensure that, in the unlikely event of a release to atmosphere, any spilled LNG is controlled within specified boundaries:
• Primary – the principal container for the LNG, the innermost shell of the tank • Secondary - to contain a release from a breach in the primary containment
A number of design concepts are currently in use, which is outlined below:

83
Primary (inner) Containment Secondary (outer) Containment Type Contains Type Contains Single containment
Shell (structural)
liquid and vapour external bund liquid
Double containment
Shell (structural)
liquid and vapour
shell (structural) liquid
Full containment
Shell (structural) liquid shell
(structural) liquid and
vapour
Membrane Membrane (non-structural) liquid shell
(structural) liquid and
vapour
Inner shells are usually made of 9% nickel steel, although some older tanks are of aluminium, and a few have concrete shells. Membranes are non-structural and are of either stainless steel or invar (36% nickel steel). The LNG industry is currently researching the use of alternative designs and materials (eg concrete).
Material for outer shells is concrete, and may extend to the roof structure, or this may be
formed of carbon steel with appropriate fire protection provisions. 4.2.2.2. Design Evolution
The first bulk storage facility for refrigerated, liquefied natural gas was built for the East Ohio Gas Co in Cleveland, Ohio in the early 1940’s. The tanks were constructed from 3½ % Ni steel, and the failure of one of them in 1944 was responsible for 128 fatalities and plant and local property losses.
The cause of failure was a catastrophic brittle fracture which resulted in the uncontrolled
discharge of LNG liquid and gas into the plant area and also the local drainage system, causing explosions and fires. By far the most critical lesson which came from this catastrophe was the realisation that 3½% Ni steel had inadequate resistance to brittle fracture at -165°C and subsequent designs utilised 9% Ni steel, aluminium alloy or concrete.
In the late 1950’s and early 1960’s, tanks were “single containment” design constructed from
aluminium alloy with a carbon steel outer wall to contain and protect the loose perlite powder insulation. Most tanks had a bottom or side entry (inlet/outlet), in accordance with the practice normally adopted at that time for atmospheric tanks.
Through the 1960’s and 1970’s tanks increased in capacity, and a double containment design was developed to reduce the land areas required for single containment designs. During this period the concept of the top entry was developed to locate potentially weakening penetrations in the the roof, thereby avoiding the higher stressed areas at the bottom of the tank. Inner tanks were made of aluminium or 9% Ni depending on local contractor preference or economics. In the late 70’s, however, the high cost of aluminium meant that most tanks employed 9% Ni steel and this was to remain the preference for onshore tankage.
Membrane designs, employing stainless steel or very high nickel content steels (‘invar’)
membrane liners based largely on the technology used for LNG carriers, were developed using concrete as the primary load-bearing element protected by internal insulation. However the failure of a membrane tank at Staten Island, New York in 1973 during repairs to the internal mylar membrane, killing 40 workers, meant that subsequent membrane development concentrated on the use of special steels.
LNG trade developed around the world and up to the late 70’s the majority of tanks were of
single containment design, although experiments had been carried out successfully with a variety of other designs. Many tanks employed side and bottom entry connections, although top entry connections with internal submerged pumps were used in the development of double, full and membrane designs.

84
In 1977 there was a major and catastrophic brittle failure of a single containment LPG tank in
Qatar. Shell, who had an interest in the terminal, and a dominant position in the world LNG market, reacted strongly and concluded that so-called “full containment” designs would be necessary for all future LNG storage tanks in which they had an interest. Another impact of the failure was the introduction of full height hydrotests to reduce the chance of similar events.
Thereafter new tankage was dominated by full containment and membrane designs. The volume of membrane tankage in particular increased significantly, notably in the Far East, although world-wide the number of single containment tanks remained superior.
In 1978 a brittle fracture was experienced in the outer tank bottom of one of two single
containment, double-wall LNG tanks in UAE in March 1978. Although a potential catastrophe was avoided by the judicious actions of the operating company and their technical staff, the incident had the effect of reinforcing the commitment to full containment designs. It also raised further questions about the desirability of bottom/side wall penetrations.
The design of the tanks for the North West Shelf LNG Project in Australia provides an
illustration of Shell’s strong reaction to these incidents. The tanks were full containment design with a full height earth mound constructed around the outer reinforced concrete shell for additional protection. The capital cost of this design was very high and has not since been repeated for LNG tanks - although the LPG tanks at Moss Moran, Scotland (constructed at about the same time) are similar. 4.2.2.3. Current practice
Current standards reflect the lessons learnt from the above incidents, however because they are national standards they also reflect national experience and preferences. The three internationally recognised standards are:
European Standard EN 1473: Installation and equipment for liquefied natural gas - Design of onshore installations. Currently under revision
• Covers all containment designs. • Does not permit side/bottom entry
pipework.
American Petroleum Institute API 620 Appendix Q: Design and Construction of Large, Welded, Low-Pressure Storage Tanks.
• Covers single containment designs.
• Permits side/bottom entry pipework.
British Standards Institution BS 7777: Flat-bottomed vertical, cylindrical storage tanks for low temperature service. To be replaced by EN 14620
• Covers all containment designs except membrane.
• Does not permit side/bottom entry pipework.
Over the last few decades the capacity of LNG tanks has steadily increased in order to realise
economies of scale. Limitations to this growth in size are primarily structural and availability of the special materials available to construct them. Currently the largest surface tanks in the world hold a capacity of about 190,000 m3, although tank manufacturers claim to have designs for 200,000 m3 and larger.
Buried tanks with capacities up to about 200,000 m3 have been built in-ground (ie buried), and
these are generally of membrane construction for economic reasons. They are built below ground level for a variety of reasons, but most commonly to enhance safety or to provide environmental protection by reducing visual impact. Most tanks have a low-rise domed roof which, like most surface tanks, is raised by air pressure.
85
The majority of tanks constructed in recent years are full containment design because of space limitations and security concerns, as well the inherent safety features. The industry is developing alternative design concepts which incorporate ‘novel’ materials; the driver here is cost reduction through clever use of materials and economies of scale. 4.2.2.4. Future developments
Following a number of studies by the industry, new designs for large capacity all-concrete full containment tanks have been developed. Unlike existing concrete tank designs, which are essentially single containment design, and have a pin joint between the side wall and bottom slab, these new designs will have a rigid joint to enhance economic efficiency and liquid-tightness. Pre-stressed concrete construction is used extensively, and is incorporated in both inner and outer tank walls. These designs have been realised by combining civil engineering and structural technology, with extensive use of 3-dimensional nonlinear analysis. They will probably be constructed using slip forming techniques and self-compacting concrete
The development of full-scale designs for the storage of LNG in underground caverns has not
so far been successful. However a prototype of a new development is presently being tested in Daejon, South Korea. The design is essentially a membrane tank formed within a mined cavern which has been lined with concrete. Insulation is placed directly against the concrete lining, and a thin metal membrane contains the LNG. (Need to update when results of tests are available)
Several countries use underground caverns for the storage of free gas, and some of this is
derived from re-gasified LNG. The construction of salt caverns for such storage is much cheaper and quicker than rock caverns and is likely to be become more widely used with the development of offshore re-gasification terminals such as Excelerate’s terminal in the Gulf of Mexico.
The above developments offer the opportunity to construct larger capacity tanks. However it is
also possible to increase the working volume of a tank by providing a simple pump pit for the in-tank pumps. Installing the pit for the pump in bottom slab, and lowering the pump position, has already been successfully implemented in Japan. 4.2.2.5. Salt cavern storage
Liquefied natural gas (LNG) receiving terminals combined with salt cavern gas storage are moving closer to commercial reality. The previously unknown combination of gas storage in manmade salt caverns with LNG importation are said to present the possibility for LNG receiving terminals with large storage capacity and gas send out flow rates. Technical validations through field tests of the critical components of a salt cavern-based LNG receiving terminal are part of a U.S. Department of Energy (DOE) cooperative research project commissioned by the National Energy Technology Laboratory (NETL).
For a receiving terminal the LNG tanks are the most expensive and visible component of the
facility. Significant scale increases have been introduced into the world’s LNG business in liquefaction and shipping, but tank-based terminals can be are difficult to scale up because of the tank cost and space required to site them. For some areas where the conditions are right, salt cavern based terminals can provide the corresponding scale increases needed with storage capacity and send-out volumes exceeding the tank-based terminal model. Offshore mooring and unloading of the LNG ships into offshore salt caverns could reduce port congestion and avoid some of the not-in-my-backyard problems faced by facility siting in some coastal communities.
Salt formations will not tolerate direct LNG injection because of the low temperatures. In September 2003, the DOE, through the NETL, expanded the cooperative research
agreement to include field tests of the critical components (high-pressure LNG pumps, Bishop Process™ Heat Exchanger, and offshore mooring and product transfer) and conceptual designs of their application in the Bishop Process™ salt cavern-based LNG receiving terminal. The goal of the DOE’s cooperative research program is to move technology from concept to commercialization as

86
rapidly as possible using the industry’s joint financial participation with the DOE to fund the process and provide technical and operating expertise.
There are three distinct components to an offshore LNG receiving terminal: the LNG ship
mooring and transfer systems; the process design and equipment; and the gas storage salt caverns. The DOE research has made considerable progress toward the goal of a workable and safe basis of design. Field tests of the mooring system; the high-pressure pumps; and a high-capacity, high-efficiency, water-warmed heat exchanger have been successfully completed. The field test results are being analyzed and will be incorporated into the mathematical models of these systems. The final product of the research project is the integration of the test results into designs, operability and maintainability studies, environmental studies, and cost analyses on the construction and operation of salt cavern-based LNG receiving terminals. 4.2.3. LNG TRANSFER
LNG is currently transferred in bulk across fixed berth structures through all-metal articulated
arms which can be equipped with sophisticated alarm and control systems to prevent spillage of LNG. The design of these arms is usually in accordance with the OCIMF “Design and Construction Specification for Marine Loading Arms”, or the European Standard EN1474 “Installation and equipment for liquefied natural gas - Design and testing of loading/unloading arms”. The latter publication is currently under revision and will be more consistent with the OCIMF document when it is reissued in 2007.
Floating production of LNG allows for development of remote gas fields and utilization of
associated gas from oil production. At the other end of the LNG chain the concept of the floating storage and regasification units will allow for import of LNG in locations where siting of new shore based terminals are difficult for environmental or political reasons or simply because not enough space on land are available. Common to these concepts are that they both rely on offshore transfer of LNG either to or from LNG carriers.
Technology developments, both for export and import, have been focused in the area of
offshore LNG transfer where a number of concepts have been conceived in recent years. In addition to GBS (gravity base structures) concepts, which employ conventional transfer arm designs, floating concepts with submarine or aerial transfer systems have been proposed. Both side- by-side and tandem (e.g. stern to bow) transfer systems are under consideration and the technology for these systems, e.g. cryogenic hoses (floating and aerial) and cryogenic swivels, is currently under development. The possibility for a reliable stern-to-bow transfer system will greatly improve the operating envelope of loading and discharge of LNG in open sea conditions. Examples of these concepts are briefly outlined below:
• The Amplitude LNG Loading System (ALLS) JIP has developed a system for transfer of LNG through a flexible hose with specially designed end-connectors. The light and compact multifunction connecting system includes a "no spill" Double Butterfly Valves & Emergency Release Coupler, a Quick Connect/Disconnect Coupler and guiding and handling devices. As a generic equipment, it is suitable for both dedicated and non-dedicated (i.e. mid-ship manifold) LNG carriers. The equipment will also have an important safety function, allowing emergency transfers of cargo at sea, improving the already high safety standards of the industry. A variant of the system, a cryogenic floating hose, which would eliminate the need for the support gantry, is currently under development.
• Designed for more exposed conditions, Big Sweep employs a single point moored floating
pontoon which is used to position the transfer equipment at the LNG carrier’s midships manifold. The single point mooring, which could be a FPSO (Floating Production, Storage and Offtake) or FSRU (Floating Storage and Regasification Unit), also provides the bow mooring point for the LNG carrier. The pontoon carries aerial hoses similar to the ALLS concept and is self-positioned using DP (dynamic positioning), it can be manoeuvred clear of the LNG carrier during mooring operations, maximising marine safety.
87
• The HiLoad Technology is built up around a semi-floating L-shaped loading terminal that can dock onto any ship in a similar way as a forklift picks up a pallet. The HiLoad is equipped with thrusters, and will be easy to maneuver into position on a slow-moving or moored ship. The HiLoad will attach to the LNG carrier using buoyancy as well as the hydrostatic pressure present at the draft of the vessel’s bottom.
4.2.3.1. Cryogenic lines
The recent activities in the field of liquefied natural gas (LNG) have induced considerable interest in the possibility of piping natural gas in its liquid, rather than gaseous, form. Many national and international LNG projects are already commercially established. These plants are presently piping LNG within the plant and to and from loading terminals. Expansion of these facilities including piping LNG between widely separated storage depots is an anticipated future step in the advance of the LNG industry.
Subsea cryogenic pipeline systems are an emerging technology that is essential for the new
generation of offshore LNG loading and receiving terminals. It is a continuation of the pipe-in-pipe (PIP) technologies that were developed for subsea tie-backs of wells that ensured the flow of the hot well effluent to remote production platforms. There are two major design issues: pipe contraction due to the low temperature of the LNG, and thermodynamic performance to ensure that LNG can be transferred without an excessive amount of boil-off.

88
4.2.4. OFFSHORE TERMINALS
A number of offshore LNG plants have been designed, but no projects have yet been sanctioned.
For a train size of 4-5 MMTPA, mounted on top of a ship hull including storage, the vessel
would be 4-500 m long, 70-75 m wide, and would carry a topside load of 45 000 to 55 000 tonnes dry weight – this is significantly larger than the oil production FPSO’s of today.
Barge type design is also being developed. The Snøhvit plant is partially a barge, but without
storage tanks and the barge is grounded on the site. However, a smaller LNG train may be the answer for processing the stranded gas in a remote
oil production FPSO. As the storage tanks will be in a state of partially filling or emptying, sloshing will occur as the
FPSO moves with the sea state. For the prismatic tanks, both membrane type and independent, the resulting forces from the sloshing have to be carefully investigated. The spherical tank and the SPB types are not affected by sloshing to the same extent. Current developments indicate that membrane type storage tanks are feasible and further studies are conducted for the effects of sloshing in prismatic LNG tanks.
A number of systems are being developed for LNG transfer to ship based on cryogenic hoses
and based on piping systems. 4.2.5. ENVIRONMENTAL ISSUES
The main environmental issues for the export terminals are mentioned briefly below. 4.2.5.1. Discharge to Sea
The LNG plant will commonly include condensate production and off-loading. The plant is designed to protect against condensate spillage on land and sea.
The discharge of large volumes of cooling water with a temperature higher than the sea water
at the export terminals needs attention to reduce the impact on the local biological species. Biocide in the cooling water is to be avoided. Air cooling can be an alternative for some plants.
Produced water from the wellstream is normally of small quantities and treated biologically
before dispersion to ensure a rapid dilution. Simulation models have been developed to check the dispersion of the effluent. The sludge from the process is treated as a hazardous waste.
There has been a major shift in the development and use of more environmentally friendly
chemicals when there is a chance of exposure. The firefighting foams used in the condensate sections of the export terminal is one example where new chemicals are used and were development is ongoing, especially in cold climates. 4.2.5.2. Emissions to Air
The hydrocarbon gas (VOC) from the loading and unloading operations are recovered and returned to the gas process stream (loading) or liquefied (unloading) to minimize the discharge.
CO2 removed from the feed gas or created when running the gas turbines are customarily
vented to atmosphere. Efforts should be made to reduce emissions through energy efficiency measures. However, CO2 gas from the feed gas may be injected into a suitable reservoir, e.g. an aquifer, as at the Snøhvit plant, Norway. The cost of capturing the CO2 from the gas turbines is
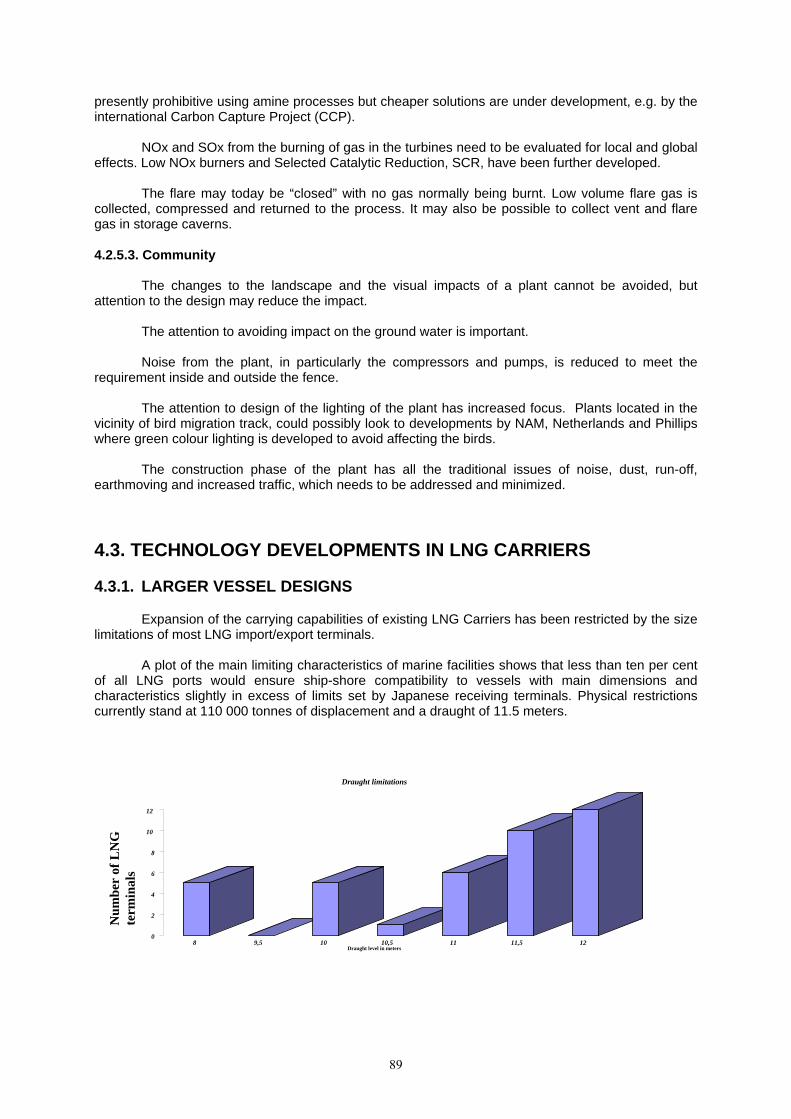
89
presently prohibitive using amine processes but cheaper solutions are under development, e.g. by the international Carbon Capture Project (CCP).
NOx and SOx from the burning of gas in the turbines need to be evaluated for local and global
effects. Low NOx burners and Selected Catalytic Reduction, SCR, have been further developed. The flare may today be “closed” with no gas normally being burnt. Low volume flare gas is
collected, compressed and returned to the process. It may also be possible to collect vent and flare gas in storage caverns. 4.2.5.3. Community
The changes to the landscape and the visual impacts of a plant cannot be avoided, but attention to the design may reduce the impact.
The attention to avoiding impact on the ground water is important. Noise from the plant, in particularly the compressors and pumps, is reduced to meet the
requirement inside and outside the fence. The attention to design of the lighting of the plant has increased focus. Plants located in the
vicinity of bird migration track, could possibly look to developments by NAM, Netherlands and Phillips where green colour lighting is developed to avoid affecting the birds.
The construction phase of the plant has all the traditional issues of noise, dust, run-off,
earthmoving and increased traffic, which needs to be addressed and minimized. 4.3. TECHNOLOGY DEVELOPMENTS IN LNG CARRIERS 4.3.1. LARGER VESSEL DESIGNS
Expansion of the carrying capabilities of existing LNG Carriers has been restricted by the size limitations of most LNG import/export terminals.
A plot of the main limiting characteristics of marine facilities shows that less than ten per cent
of all LNG ports would ensure ship-shore compatibility to vessels with main dimensions and characteristics slightly in excess of limits set by Japanese receiving terminals. Physical restrictions currently stand at 110 000 tonnes of displacement and a draught of 11.5 meters.
0 2 4 6 8
10 12
8 9,5 10 10,5 11 11,5 12 Draught level in meters
Draught limitations
Num
ber
of L
NG
te
rmin
als

90
The maximum ship’s capacity achievable, under these limits, is about 155 000 m3 for membrane vessels and some 145 000m3 for spherical tanks (capacities at arrival conditions for both containment systems). A vessel with a carrying capacity of 160 000m3 would most probably only be able to trade between 2-3 existing loading and unloading terminals.
Currently, the fleet of LNG carriers in service stands in January 2006 at some 193 ships and
another 135 have been ordered for construction and deliveries before end 2009, counting only for the known and firm orders.
During the first decade of commercial LNG, carriers were built to capacities ranging from
25,000 to 87,600m3; until the psychological threshold of the 100 000m3 cap was exceeded with the ordering in 1972 of the “Ben Franklin”, a 120 000m3 membrane vessel constructed with six tanks, which was delivered in 1975.
Since the turn of the new century, capacities have expanded from 138 000m3 to about
155,000m3 approaching an asymptotic value located at around 160 000m3, as a result of the dimensions of the largest marine facilities. A rapid gain in capacity, which is comparable, in magnitude, to the increase achieved previously in twenty-five years.
A distribution by capacity shows that eighty-six per cent of all vessels have their capacities in
a range of 120 000 to 155 000 m3. These vessels are commonly referred to as “Standard LNG carrier”. The rest of the fleet consists of smaller vessels, a few purpose-built vessels, and, last but not least the newly ordered “Large” LNG carriers with capacities in excess of 210 000m3, for which new and larger terminal facilities are needed.
The main dimensions of the “Standard LNG carrier” have been kept relatively unchanged. The
overall length did not go beyond 300 metres, breadth has remained below 49 metres while the design draught did not exceed 11, 5 metres.
The recent increase in the demand for LNG has been answered by a sharp and
unprecedented increase in the number of orders for “Standard LNG carrier”. With these orders a modest increase in the carrying capacity of the ships within the limits set by the existing marine facilities.
The appropriate sizing of the marine facilities in terms of storage capacities, water depth,
diameter of the turning basin, strength of the pier, size and strength of the loading/unloading arms, towing power, etc., will set each projects maximum ship capacities.
Issues such as available shipbuilding technology, strength of hull structure, or of dry-docking
facilities have not been addressed. The largest envisaged LNG carrier presents moderate main dimensions compared to the largest oil tankers and bulk carriers.
Today, tanks of LNG carriers are the largest by capacity of all vessels handling cargo in a
liquid form; further enlargement of size will need to be thoroughly studied and investigated for effects such as liquid motion and counter-measures for sloshing maybe required.
LNG carriers can be categorised in three distinct segments: vessels in a capacity range of 20
000 to 75 000m3, a “standard” size up to 160,000m3 and Large LNG carriers with a maximum carrying capacity yet to define. Currently LNG carrier projects up to 270 000m3 are being discussed.
The evolution in the length overall and displacement, as the cargo capacity is expanded, are
illustrated in the next graph.

91
Size expansion
75000
125000
175000
225000
275000
152000 152300 216000 216000 220000 400000Capacity in cbm
Dis
plac
emen
t in
tonn
es
200
250
300
350
400
Leng
th o
vera
ll in
m
Displ vs Cap length overall vs capacity
4.3.2. HULL
A number of the LNG carriers currently in order will be equipped with hull stress monitoring and online damage control and fore ship slamming impact pressure control. In addition, the introduction of larger LNG carriers has lead to increased reinforcement of insulation systems for membrane tanks, and the installation of systems to monitor the sloshing loads that occur in the larger cargo tanks. Both of these systems will contribute to safer and more reliable operations and minimize the risk for damage to the cargo tanks and the potential release of LNG. 4.3.2.1. Condition Assessment Programme (CAP)
CAP is an independent and thorough verification of the actual condition of a vessel, based
upon detailed inspection and function/performance testing, thickness measurements and strength calculations.
The Condition Assessment Programme has been created out of a wish from the serious ship
owners to document the quality of their vessels beyond the scope of classification. The Programme is designed for tankers older than 20 years and bulk carriers older than 15 years, but may well be used for other types of tonnage and at any age.
A rating scale ranging from 1 (best) to 4 (lowest) has been established. CAP rating 2 has
become a requirement on older vessels from many charterers. The CAP rating reflects the condition of the vessel at the time of inspection. Charterers have introduced their own acceptance periods related to the ratings stated in the CAP Declaration.
4.3.3. PROPULSION SYSTEMS Close to all LNG carriers today are equipped with steam propulsion system. However, the industry does now see a trend towards alternative propulsion systems. Both slow speed diesel engines with LNG reliquefaction system (SSR) and Dual Fuel Diesel electric (DFDE) systems are on order. Almost 40% of the LNG carriers on order have been specified with either DFDE or SSR. The propulsion systems are described in appendix 7. 4.3.4. LNG RELIQUEFACTION
The introduction of alternative propulsion systems on LNG carriers has also lead to the introduction of LNG reliquefaction systems to handle the LNG boil off that was previously used as
92
propulsion fuel. LNG Reliquefaction has also earlier been proposed, but did not succeed due to poor efficiency. With improved efficiency and higher natural gas prices, reliquefaction systems are now much more beneficial. LNG reliquefaction is described in appendix 8. 4.3.5. ENVIRONMENTAL ISSUES 4.3.5.1. Air emissions
The new propulsion alternatives for LNG carriers will have a bearing on the air pollution from LNG carriers. The slow speed diesel alternative offers significantly improved efficiency compared to the traditional steam turbine propulsion, which results in reduced CO2 emissions. However, if comparing the slow speed diesel alternative with steam propulsion exclusively on natural and forced boil off, the fuel oil is not such a clean fuel and will thus result in higher SOx and NOx emissions when compared to the traditional alternative. In addition the diesel engine process in general increases the emissions of other pollutants when compared to the steam boiler on same fuel. The dual fuel diesel electric solution offers a combination of higher efficiency than the steam turbine alternative and use of the more clean LNG fuel.
In addition to the above, the steam turbine itself are being made more environmentally friendly
through the use of new boiler and burner designs, that will significantly reduce emissions when running on fuel oil.
All ships to have tank capacity for storage and usage of low sulphur fuel on diesel engines
when MARPOL Annex 4.5 is made effective. Low NOx burners are being contemplated for existing and ordered LNG carriers with steam
turbine propulsion.
Selective Catalythic Reduction (SCR) has also been introduced to reduce the NOx emissions to a minimum. This method makes it possible to reduce the NOx level by more than 95% by adding ammonia or urea to the exhaust gas before it enters a catalytic converter. 4.3.5.2. Ballast Water Treatment System
The world LNG fleet is growing in number of vessels and will by the end of the decade have doubled in size. Circling the globe in ever greater and more diversified voyage patterns, brings with it to an increasing degree the problem of ballast water discharge.
Ballast water usage and quality has gained increasing attention over the last few years. This is
in particular an important issue in relation to LNG carrier operation given their generally large ballast to cargo capacity ratio. Aquatic organisms transferred to areas where they do not naturally occur are considered one of the most serious threats to biodiversity. Ship’s use of ballast water represents the most common pathway to the introduction of non-indigenous organisms. Recognising the seriousness of this issue, IMO initiated work on the development of a regulatory framework, materialising in guidelines introducing the concept of ballast water exchange between ports. Later, IMO adopted the Convention for the Control and Management of Ship’s Ballast Water and Sediments in 2004.
As a consequence of the new ballast water convention LNG carriers are in increasing number equipped with ballast water treatment technology such as the OceanSaver ® Ballast Water Treatment System. The OceanSaver uses a combination of physical processes exposing ballast water to multi-shock pulse wave sequences leaving the ballast water supersaturated and hypoxic during the voyage and in this way minimizes the transfer of aquatic organisms.
Ballast water discharge introducing non-native aquatic organisms to an area represents
environmental challenges of enormous proportions. This has been identified as one of the four greatest threats to the world’s oceans. The total world fleet transports between 3 and 5 billion tons of ballast water every year.

93
The International Maritime Organization (IMO) has adopted an International Convention for the control and management of ballast water and sediments. The main requirements are:
• Ships constructed after January 1st 2009 will have to conduct ballast water management. • From 2016, all existing and new vessels are obliged to have onboard treatment of ballast
water prior to discharge.
Further to the environmental problems caused by ballast water, corrosion in ballast tanks is one of the single most cost demanding maintenance issues for ship owners and loss of integrity caused by corrosion is the most frequent cause of loss of ships.
There is tremendous industrial interest worldwide to solve the technological challenges. A
number of companies are working to find a technical solution that will meet the minimum requirements of the IMO.
One of solutions believed to meet the requirements of IMO is called OceanSaver®, developed
by Metafil of Norway. It is based on a 3-step technology:
1. Automatic filtering where larger organisms are separated and flushed back into the waters of origin.
2. Nitrogen super saturation which has a two-sided effect; First, nitrogen terminates most kinds of organisms (except on bacteria) and second, nitrogen will displace oxygen in the ballast water and thus reduce the corrosion rates of ballast tanks and piping systems.
3. Hydrodynamic cavitation which will terminate most all organisms and bacteria
OceanSaver® is a “clean” product. No chemicals or poisonous materials are used in the process. The nitrogen super saturation will in addition substantially reduce the corrosion rate of the ballast tanks and piping system. 4.3.5.3. Antifouling paint
In order to limit the friction between the hull of a vessel and the water, it is important that the hull is as smooth as possible. A smooth hull contributes to increased speed and a reduction in fuel consumption. In order to protect the vessels' hull against any kind of marine growth, such as algae, a toxic antifouling paints have traditionally been used to prevent such adhesion. Tributyl tin (TBT) has been the most common toxic substance in these paints for large vessels. Gradually it was discovered that TBT also has a considerable negative impact on other organisms in the ocean.
In 2001, the use of TBT in antifouling paints was banned from 1 January 2003. According to
this convention, shipowners will have to remove or seal all TBT paints on their vessels by 2008. Several alternative antifouling paints such as those based on copper and silicon have therefore been developed and are introduced to a growing number of existing vessels during dry-docking and to new vessels to be delivered. 4.4. TECHNOLOGY DEVELOPMENTS IN IMPORT TERMINALS 4.4.1. ONSHORE TERMINALS
The main elements of the terminal are: provide a protected harbour for LNG tankers during unloading, storage of LNG, re-gasification facilities and metering the gas being piped into gas lines. Storage of LNG and environmental issues are covered above.
Re-gasification (vaporizer) units currently employed are open rack heat exchanger using sea
water, closed loop heat exchanger and submerged combustion unit. Very little energy is expended if sea water is used. Gas combustors use around 3 % of the gas’ energy content. The use of air warming systems for larger scale applications is being developed.
94
The major improvement in energy efficiency occurs if the cold content of the LNG can be
used. One example is Osaka Gas who has developed a project to drive low temperature separation processes at an adjacent petrochemical plant. They also include chilling inlet air and cooling water for gas turbines and power plants. 4.4.1.1 Corrosion control
Aluminium alloys and stainless steel which have excellent characteristics for low-temperature use are used in the piping and heat exchangers. Corrosion protection against seawater is provided by Zinc alloys coatings in heat exchangers.
Flange connections between the aluminium alloy and the stainless steel, used as respectively
vaporizer and LNG piping material, has been a source of corrosion. A transition coupling without a seal part has been adopted by many terminals. 4.4.1.2. LNG with different specifications in the same storage tank
While the number of LNG liquefaction plants has been increasing in recent years, LNG with different specifications is stored in the same LNG tanks on the receiving terminal. LNG stratified layer may appear resulting in roll-over that produces large amounts of boil-off gas. Roll-over may be prevented by:
• Selection of the top / bottom feed to the storage tank depending on the cargo condition. • LNG circulation in the tank • The transfer of LNG between storage tanks
4.4.2. OFFSHORE GRAVITY BASED STRUCTURES
A number of proposals for offshore receiving terminals, based on grounded concrete platforms with integrated storage tanks, have been put forward in recent years. For example the Isola di Porto Levante regasification terminal (Rovigo) to be located offshore the coast of Italy in the North Adriatic Sea is designed and currently under construction by AkerKvaerner. 4.4.3. REGASIFICATION VESSELS SOLUTIONS 4.4.3.1. Introduction
Offshore discharge terminals, where safe off-loading can take place far from densely populated areas and busy ports and estuaries, may be the future preferred option for LNG discharge terminals. This means regasification onboard the gas carrier and offloading via offshore buoys or a platform system to shore ready for distribution into the onshore gas grid. From an LNG shipping perspective, the regasification alternative offer distinct possibilities that can be managed within the scope of, or as an extension to, traditional LNG shipping operations. To serve a certain trade and for gas send-out continuity three or more vessels will be necessary depending on transport distance and send-out rate. Two buoys or platforms need to be placed at the natural gas discharge location in order to provide for overlap in gas delivery between the outbound and the inbound carrier. 4.4.3.2. Technology components of the regasification vessel solutions
In general, regasification vessel solutions are divided into two main categories:
The first category includes LNG carriers modified to allow onboard regasification at an offshore location and send-out of natural gas through an unloading buoy system to shore via pipeline, examples are Excelerate Energy’s Energy Bridge™ and Höegh LNG’s Shuttle and Regasification Vessel™. Both these systems are developed such that the carrier that transports LNG from the liquefaction facility itself also performs the regasification process and the send-out of natural gas once arriving at the offshore location near the gas import area.
95
The other main category includes the so-called Floating Storage and Regasification Unit
(FSRU) concepts. In principle the FSRU can is an enlarged regasification vessel permanently moored at the regasification site and send-out site, receiving LNG from more or less standard LNG carriers.
Operation of regasification vessels in open seas requires containment systems and tank
configurations that allows for operation without tank filling restrictions in order to run a continuous offshore discharge operation with a minimum of downtime and to avoid the risk of sloshing damages inside the cargo tanks. Alternatively, they need to be restricted to operation in benign waters and/or operated according to carefully planned cargo handling and discharge procedures. The cargo tanks may also be equipped with customized cargo pump system to ensure the pumps remain LNG suction when the tank is close to empty and the ship is moving with the waves.
Onboard LNG processing/regasification plant will typically have a capacity in the range 70 to
280 mill sm3/d. The LNG is boosted to a required discharge pressure, before regasification and discharge from the vessel. The selection of regasification system e.g. closed loop or open loop system will depend on environmental conditions and regulatory requirements.
The natural gas may be discharged to a subsea pipeline system via a turret mooring system
or to an onshore distribution via a conventional fixed berth with dedicated equipment for the high pressure gas.
In an offshore harsh environment, the unloading buoy of the submerged turret loading (STLTM)
type designed by Advanced Production & Loading (APL) is a proven technology that has been applied successfully for many years in oil production in several areas.
In addition to vaporization and gas discharge equipment the regasification vessels will
typically also differ from standard LNG carriers by onboard metering system and odorisation equipment installed. 4.4.4. ENVIRONMENTAL ISSUES
The main environmental issues for import terminals are the use of sea water for vaporisation, visual impacts and air emissions. Reference is made to section 2.5 for further details. 4.5. STANDARDS
The design of shipping, including Floating Storage and Regasification/Production Units (FSRU)/(FPSO), is carried out in accordance with the requirements of a small number of Classification Societies (CS). Although these Societies are essentially national organisations, they produce standards for the construction of all types of shipping, including LNG, which are recognised internationally. Shipping operations are carried out in accordance with the requirements of the International Maritime Organisation (IMO), which have the status of international law.
This situation is a consequence of the international nature of the shipping trade, and the need
for a mechanism to enforce safe maritime practices. Conversely, a terminal is a national entity, which needs to satisfy only national legal and regulatory requirements. Nonetheless, the fact that international organisations trade at most terminals means that the design and operation of them must meet international expectations.
In practice, therefore the design of LNG terminals is governed by a range of national and
internationally recognised standards, none of which has the level of authority of the CS or IMO standards. The mix of standards used is generally dependent on the level of LNG experience in country, but commonly the following mix is applied:
96
• Infrastructural elements of the plant, e.g. roads, buildings, are commonly designed to national standards, since these will usually reflect local environmental conditions and construction practices. Similarly structural and other elements not specific to the oil and gas industries will also be designed to national standards.
• Non-cryogenic elements of the plant are often designed to American oil/gas industry standards for
historical reasons, although some countries have developed their own suite of standards which are applied in preference. Examples of these are the American ASTM and API standards, and the European CEN standards.
• Cryogenic elements of the plant are usually designed to the national standards of a limited number of
countries. For example, two such standards which are commonly applied to the design of LNG facilities are NFPA 59A (American) and EN 1473 (European).
There are, in addition a number of international standards (eg ISO) and industry
recommendations which are widely applied to the design and operation of oil and gas installations worldwide. Examples of the latter are those published by SIGTTO (Society of International Gas Tanker and Terminal Operators) and OCIMF (Oil Companies International Marine Forum).
In most cases the use of appropriate local (ie national) practices will be mandatory, and any
differences between these and internationally recognised standards will have to be accommodated. In some cases, language and cultural differences may make it difficult to assess whether local or national codes can provide a sufficient level of technical assurance, and it may then be appropriate to carry out design checks of critical parts of the design against internationally recognised codes and standards. This needs to be identified early in the design process. 4.6. SAFETY – EXPORT AND IMPORT TERMINALS 4.6.1. INTRODUCTION
The excellent safety performance of the LNG industry has been achieved within a framework of standards that have applied to the oil and gas industry in general, in addition to specific LNG design criteria and operational processes. These processes have been improved as industry participants have become more experienced.
In order to define LNG safety, it is essential to understand that LNG is considered a different
hazard and therefore not only subject to the same routine hazards and safety considerations that occur in any industrial activity.
Beyond routine industrial hazards and safety considerations, LNG presents specific safety
considerations. In many such instances, worst-case scenarios are assumed without taking into considerations the numerous steps taken to prevent them. Risk is a combination of not only the consequence of an event, but also the probability of the event occurring. In the majority of cases, the focus on worst case events overshadows the real probability that such event will occur, driving the industry to consistently raise the level of the safety expectations. Consequently, the process of determining and designing safe LNG plants often requires not only the elimination of gross risks, but also the appraisal and elimination of wide range of extremely low-probability risks.
The result of this has been the development and strict enforcement of mandatory regulations,
such as numerous codes, standards and guidelines. In other cases, industry guidelines on recommended specifications and operational practices have been established through industry bodies, forums of common interest groups, such as the American Petroleum Institute, the National Fire Protection Association, the European Committees, the International Gas Union, and various other recognized bodies. Safety has also built on a large body of accumulated in-house knowledge and skill based expertise from the gas industries. This is understandable in the context of an industry that, despite its scale, still only contains a relatively small number of individual production facilities.
97
4.6.2. SAFETY CONCEPT
A safe design concept approach in the LNG industry requires multiple layers of protection in order to create four critical safety conditions, all of which are integrated with a combination of industry standards and regulatory compliance:
• Primary containment: o The first and most important safety requirement for the industry is to contain LNG. This is
accomplished by employing suitable materials for storage tanks and other equipment, and by appropriate engineering design.
• Secondary containment:
o This second layer of protection ensures that if leaks or spills occur, the LNG can be contained and isolated. For onshore installations dikes surround liquid storage tanks to capture the product in case of a spill. In some installations, a reinforced concrete tank surrounds the inner tank. Secondary containment systems are designed to exceed the volume of the storage tank. Double and full containment systems for onshore storage tanks are now the preferred means to eliminate the need for dikes, and the potential spill fires.
• Safeguard systems:
o In the third layer of protection, the goal is to minimize the release of LNG and mitigate the effects of a release. For this level of protection, LNG operations use systems such as gas, liquid and fire detection to rapidly identify any breach in containment and remote and automatic shut operational systems (procedures, training and emergency response) also help prevent/mitigate hazards. Regular maintenance of these systems is vital to ensure their reliability.
• Separation distance:
o Regulations have always required that LNG facilities be sited at a safe distance from adjacent industrial communities and other public areas. The same principle also applies within the plants in order to minimize the cascade effect. The safe distances or exclusion zones are based on LNG vapour dispersion data, and thermal radiation contours and other considerations as specified in regulations. For the offshore applications, the safety distance issue is approached differently. An offshore terminal will apply a safety zone around it where no ship or vessel is allowed. Within the terminal, stringent safety measures as per Class ship/offshore rules have to be implemented.
No systems are complete without appropriate operating, maintenance procedures and
standards being in place and with insurance that these adhered to, and that the relevant personnel are appropriately trained. Organizations such as the National Fire Protection Association (NFPA), American Institute of Chemical Engineers, American Petroleum Institute, produce guidance which results from industry best practices. 4.6.3. SAFETY CULTURE
Finally, safety has also been supported by the particular culture of the LNG industry. LNG has always been regarded as a special product. The culture tends to support, for example, a rigorous attitude to design, operations and maintenance, and a collaborative attitude to problem solving, within the industry producers. This attitude is also supported by the specificity of the commercial contract frameworks which require long term supplies with high reliability through safety.
As a consequence of this, there has been the establishment of a culture of compliance,
resulting in a refinement of best practices. This culture is seen in hydrocarbon processing as a whole, but with much reinforced awareness in the LNG industry. This culture is further supported by LNG buyers, many of which are utilities companies and who want to demonstrate the highest safety standards to the public.

98
Thus the safety performances of the industry has moved forward not only on conformity to
mandatory standards, but also on a large proven accrued experience, on industry best practices, on the professional expertise of the participants in the industry in ensuring safe practices and in general on the establishment of a culture within the LNG industry. 4.6.4. SAFETY STUDIES
A number of safety studies have been conducted during the triennial period by various Classifications Societies and Institutions. Most of these studies are freely available on websites. The results of these studies have not changed the focus of the industry. However, they have alerted the general public to the LNG industry and cause a heightened awareness to the need for education and improved openness from the industry. 4.6.5. BEST OPERATIONAL PRACTICES
Most companies have adhered to the process of Quality Management (such as ISO 9000 and 14 000) which requires that, for all critical activities within the company, procedures/instructions should be formalised, implemented and updated when necessary. Audits are conducted on a regular basis in order to check conformity over time and to maintain the certification.
Operation personnel (operations, maintenance, safety, technologists) in the plant are often
required to go through a certification process or competence assessment. Most plants owners today use training simulators to maintain good operator response. Upsets
and/or incidents are simulated and the operator is asked to react in order to re-establish stable operation or avoid the incident or mitigate its effects.
It has been found that more efficient operations can be achieved when all operators, and
sometimes even technology/maintenance staff, are housed in the same control room and/or adjacent rooms.
Taking advantage of the digital control systems, alarm management policies can be defined
and implemented for better operator efficiency. Alarm flooding can be avoided relieving the stress on the operators and results in better and safer operation.
The installation and use of TV cameras on critical locations has contributed significantly to
speedily information to a panel operator in the control-room and therefore give him the ability to limit the extent of an incident without involvement of outside staff in a dangerous area. 4.7. SAFETY - LNG TRANSFER 4.7.1. INTRODUCTION
The marine facility for ship berthing and cargo transfer provides the interface between the ship and the shore terminal. Since the transfer of cargo between ship and shore entails a closely combined operation between the visiting ship and the terminal installation, each under different management and having different responsibilities, the marine facility, in its design, construction and operation, has unique characteristics which require special consideration.
The safety systems for the transfer operations are integrated into the terminal systems, these
include the ESD (emergency shut down) system which can be initiated manually or automatically. A powered emergency release coupling (ERC) on each transfer arm is designed to activate the ESD and then release the arm automatically from the ship if it moves outside the operating envelope of the arm. The coupling is located between a double valve arrangement which minimises any spillage of LNG as a result of the disconnection. Other safety equipment commonly found on the marine facilities

99
includes environmental monitoring systems, mooring line load monitoring, gas detection, fire (cooling) water, spill collection and dispersal systems.
The following lists some of the special considerations in the site selection and design of ship
berthing facilities and in the operation of cargo transfer. 4.7.2. SITE LOCATION
Ideally the LNG terminal site is separate from other shipping and operations, but if this is not possible then risk assessments are carried out to identify the probability of occurrence and consequences of potential hazards. Risk mitigation measures may be required to ensure that an adequate level of safety is maintained, these could include physical changes to the terminal, or the adoption of specific operational procedures.
This subject is covered in some detail in the SIGTTO publication “Site Selection and Design
for LNG Ports and Jetties”. Wherever possible, the dimensions of the navigation channels and manoeuvring areas should
comply with the International Navigation Association (PIANC) recommendations “Approach Channels – A Guide for Design”.
The location and orientation of the berthing facilities take into consideration local
environmental conditions, and also the possible need to evacuate the berth in an emergency. The berth should be orientated so that ships can leave with a minimum of assistance, and ships often berth facing towards the open sea or port entrance to provide a quick route to open water. 4.7.3. BERTH DESIGN
The berth and its transfer facilities will be designed for a specific range of vessel sizes and types, and the layout optimised for the full range of shipping envisaged to use it. Recommendations for berth layout are included in the OCIMF publication “Mooring Equipment Guidelines”, and there are a number of internationally recognised standards which cover the design of the structures – e.g. British Standard BS 6349: Code of Practice for Maritime Structures. 4.7.4. TRANSFER OPERATIONS
The transfer platform accommodates the transfer equipment, e.g. transfer arms and associated manifold piping, safety equipment such as gas detection, cooling water and sprays. It provides the primary means of access onto the ship across a dedicated access tower. A spill containment basin is usually located off the platform; the need for, and configuration of, spill containment is determined from local regulations and a risk assessment.
All metal articulated arms are the only type of cargo connection currently in operation for the
normal ship/shore transfer of large quantities of LNG. Over-travel alarm systems are actuated when the arm extension approaches pre-determined limits based upon the acceptable movements of the ship at the berth. This alarm will also normally automatically cause shut down of cargo transfer. If the arm continues its movement in excess of the pre-determined limits, a second alarm is sounded and may also automatically actuate an emergency release system. In this latter case there are hydraulically operated ball valves or butterfly valves on both sides of the emergency release coupling which are arranged to close fully before the release coupling can operate so preventing any spillage.
At least two lines of communication are provided between the ship and shore through radio
and telephone links. In addition, a ship-shore link is provided which enables mutual shut-down of the transfer operation through the respective Emergency Shut-Down (ESD) systems. Several versions of this are recognised internationally, and efforts are currently in place to standardise this link more effectively.
100
4.8. SAFETY - LNG CARRIER 4.8.1. DESIGN AND OPERATION 4.8.1.1. Introduction
The overall layout of an LNG carrier is similar to that of a conventional oil tanker from which it evolved. The cargo containment system and its incorporation into the hull is, however, very different due to the need to carry cargo under refrigerated conditions.
LNG carriers come in two main types. The spherical or ‘Moss’ type are easily recognisable
with the protruding spherical tanks above the main deck level. Membrane and Self-supporting Prismatic type vessels are less easily distinguishable from oil
tankers except for their freeboard which is significantly greater. The International Code for the Construction and Equipment of the Ship Carrying Liquefied
Gases in Bulk, the ICG Code, is the fundamental standard for carriage at sea of gases. Severe collisions or groundings could lead to cargo tank damage and result in uncontrolled
release of the product. Such release could result in evaporation and dispersion of the product and, in some cases, cause brittle fracture of the ship’s hull. The requirements of the Code are intended to minimise this risk as far as is practical, based upon present knowledge and technology.
To verify compliance with the code ships will have on board a ‘Certificate of Fitness for the
Carriage of Liquefied Gases in Bulk’ 4.8.1.2. Owner / Operator
The responsibility of ensuring the safety of ships and those who sail in them must initiate from
the Owners/Operators. A Company’s safety policy should be founded on the principle that safety is everyone’s responsibility. This can be done for corporate, moral, legal, personal or any other reasons, so long as at the end of the day, everyone knows that no job is done unless it is done correctly.
Companies should demonstrate their competence with accreditation for various IMO and ISO
Codes and Standards. This competence is promulgated in Policies and Procedures covering all parts of the operation. 4.8.1.3. Master
The Master has a responsibility firstly to the crew for the safety of their lives and health; to the cargo owners and interests for safe delivery of their cargo without loss or damage; to his owners for the safe, efficient and economic operation of the ship; to the marine environment keeping it safe and clean; and to third parties for avoiding damage or accident to property or lives. The Master must be foremost on the ship in setting example, and must observe all the safety policies and rule he has implemented for the ship. 4.8.1.4. Classification Societies
The Classification Societies have a dual role to play, they are firstly involved through ‘class rules’ in the design and construction of ships of al types. Class can grant the Certificate of Fitness noted earlier. The far greater role is the role they play in the daily assurance of the vessel on going capability to perform. The operator is primarily responsible for the compliance with regulations and

101
class is the safety net to ensure that this does in fact happen. Class will provide an independent assessment of the vessels condition and serve as a back up to the operators’ maintenance program.
Ship classification may be regarded as the development and worldwide implementation of
published rules and regulations which, in conjunction with proper care and conduct on the part of the ship owner and operator, will adequately provide for: the structural strength of (and where necessary the watertight integrity of) all essential parts of the hull and its appendages; the safety and reliability of the propulsion and steerage systems; and the effectiveness of the features and auxiliary systems which have been built into the ship in order to establish and maintain basic conditions on board whereby appropriate cargoes and personnel can be safely carried whilst the ship is at sea, at anchor, or moored in harbour.
After verifying compliance with the appropriate constructional requirements, Classification
societies maintain these provisions by way of the periodical visits by their surveyors to the ship as defined in the regulations. Should significant defects become apparent or damages be sustained between the relevant visits by the surveyors, the owner and operator are required to inform the society without delay.
A ship is said to be in Class when the Rules and Regulations which pertain to it have, in the
opinion of the Society, been complied with, or when special dispensation from compliance has been granted by the society. 4.8.1.5. Flag State
By means of periodical surveys and renewal of the various certificates, the administration ascertains that the ship meets the requirements laid down in the national legislation. On completion of a survey and recertification, it is a prerequisite that the conditions are maintained during the period of validity and that no items covered by the certificate shall be changed without the sanction of the administration.
In addition to the periodical surveys, intermediate surveys and endorsements on the
certificates are prescribed. The administration may also stage additional surveys and unscheduled inspections to make sure that the ships are in compliance with the regulations.
Whenever an accident occurs to a ship or a defect is discovered, either of which affects the
safety of the ship or the efficiency or completeness of its lifesaving appliances or other equipment, the master or owner of the ship shall report at the earliest opportunity to the administration, the nominated surveyor or recognised organisation responsible for issuing the relevant certificate, who shall cause investigations to be initiated to determine whether a survey is necessary. If the ship is in a port of another State, the master or owner shall also report immediately to the appropriate authorities of the port State and the nominated surveyor or recognised organisation shall ascertain that such a report has been made.
For nations having a large fleet in overseas trade or engaged in regular trade between foreign
nations, it is evident that an administration may find it impractical and far too costly to cope with all mandatory surveys entirely by its own corps of surveyors. In accordance with the provisions of international conventions, the government of a country may entrust the inspections and surveys either to surveyors nominated for the purpose or to organisations recognised by it. 4.8.1.6. Authorisation of Statutory Work
The recognised classification societies have extensive resources of manpower and technology deployed in a global net of survey offices. More than 100 governments around the world have taken advantage of this and have authorised the classification societies to carry out various surveys on their behalf. Such authorisation of statutory work is based on national legislation in which the internationally adopted standards are laid down.
However, the government has to guarantee fully the completeness and efficiency of the
surveys performed by authorised bodies. In order to meet this obligation, an administration must

102
establish systems for the supervision of work carried out on its behalf. The range and extent of authorisation may differ and the system for monitoring and supervision of work carried out by authorised organisations could differ accordingly.
The simplest form of authorisation is delegation of parts of or all statutory surveys and the
issue of provisional certificates. The full-term certificates would in such case be issued by the administration itself, subsequent to a thorough examination of the survey reports. The delegation may include all categories of vessels or the administration may choose to exclude certain types, like passenger ships, mobile offshore units and, similarly, vessels with a high damage potential.
The authorisation may for certain categories of ships are extended to allow the issue of full-
term certificates while the administration confine their supervision to a posterior examination of the survey documentation. If any irregularities are found, the authorised organisation will be instructed to rectify the matters. 4.8.1.7. Types of Survey
An initial survey is a complete inspection of all the items relating to the particular certificate before the ship is put into service to ensure that they are in a satisfactory condition and fit for the service for which the ship is intended.
A periodical survey is an inspection of the items relating to the particular certificate to ensure
that they are in a satisfactory condition and fit for the service for which the ship is intended. A renewal survey is the same as a periodical survey but also leads to the issue of a new
certificate. An intermediate survey is an inspection of specified items relevant to the particular certificate
to ensure that they are in a satisfactory condition and fit for the service for which the ship is intended. An annual survey is a general inspection of the items relating to the particular certificate to
ensure that they have been maintained and remain satisfactory for the service for which the ship is intended.
An additional survey is an inspection, either general or partial according to the circumstances,
to be made after a repair resulting from investigations or whenever any important repairs or renewals are made. 4.8.1.8. Port State
Concurrent with the national administrations’ efforts to establish through their international collaborations uniform safety standards and control measures on a global basis, efforts are also made to ensure that all ships comply with the widely-accepted international convention provisions.
In several conventions, there are articles and regulations stating that every ship when in a port
of another party is subject to control by officers duly authorised by such government in so far as this control is directed towards verifying that the certificates issued in accordance with the provisions of the convention referred to are valid.
Such certificates, if valid, shall be accepted unless there are clear grounds for believing that
the condition of the ship or of its equipment or manning does not correspond substantially with the particulars of any of the certificates or that the ship or its equipment or many are not in compliance with the provisions.
The Memorandum of Understanding on port State control - In 1981, a regional conference in
Europe agreed on a memorandum of understand (MoU) between the maritime authorities of 14 European countries, aimed at the establishment of a harmonised and efficient system of port State control. The main objectives of the memorandum are to assist in securing the compliance of ships

103
with international standards regarding safety of life at sea, prevention of pollution of the marine environment as well as the working and living conditions on board. The MoU has been in operation since July 1982 when it took the place of The Hague Memorandum which had been effective from July 1978 with more or less the same objectives.
The maritime authorities of the 14 countries committed the administrations to maintain an
effective system of port State control to ensure that foreign merchant ships visiting its ports comply with the standards laid down in the international conventions related to safety, pollution prevention and living conditions on board.
Merchant vessels calling at ports in the MoU region may be inspected to ensure compliance
with all provisions of the relevant international conventions, irrespective of whether the ship is flying the flag of a State party to relevant international conventions, or not. Where the conventions in question leave certain provisions to the approval or permission of the flag State administration or to be fulfilled to its satisfaction, the flag State’s requirements will be respected. Up-to-date information on the flag State’s requirements for such items which the conventions leave to a State’s discretion should therefore be readily available on board the ship. 4.8.2. SEA STAFF TRAINING
The principal officers on LNG carriers (master, chief officer, cargo engineer, cargo officer, chief engineer, second engineer and, where they will have sole responsibility for a cargo watch, the second officer and third officer) should:
• Have attended an approved fire-fighting course. • Have attended a specialised liquefied gas course. • Where possible have attended on the job training at LNG plant to ensure basic knowledge on
LNG handling and safety operation. • Have obtained the necessary approval from the appropriate administration, e.g. in the form of
a dangerous cargo endorsement (liquefied gas).
This is a sound training package, providing the necessary knowledge for the safe control of cargo operations. Furthermore, the program includes checks and balances, where each leg of the process requires individual courses or program to be of an approved nature. This means that the course has been assessed and approved by a national administration. Other recommended training is ship-specific and the company should develop such program within the framework of its safety management system.
The STCW (Standard Training Certificate for Watchkeeping) Convention specifies additional
requirements for the proper certification of deck and engineering officers on gas carriers. In common with all ship's officers, the gas carrier officer must have the standard certification for a ship of the size and trading pattern engaged upon.
The ratings too have responsibilities under the Convention. A crewmember's original
certification is dependent on the correct proof of sea-service, age, medical fitness, training, qualification and examination, including the need for Certificate revalidation at intervals not exceeding five years. Seafarer certification is often endorsed by the Flag State of the ship in which he is serving.
Junior officers on LNG carriers should also be suitably experienced and should have been
issued with an appropriate Tanker Familiarisation Certificate and Certificates of Competency should show this endorsement. Company files should hold copies of the Tanker Familiarisation Certificate, as issued by the seafarer's national system.
For senior officers qualified only for non-tanker trades, being without previous tanker
experience, at least two familiarisation voyages on oil, gas or chemical tankers is recommended. This should be achieved before completing the specialised liquefied gas course. Such voyages should include at least one training voyage in a supernumerary capacity following a training programme.

104
For endorsements, flag state administrations interpret the requirement for experience differently. The training voyage requirement may be 28 days, or it may require at least one loading and one discharge operation. Both are sensible approaches and should be considered in addition to the requirements of any particular administration.
For senior officers already experienced in the tanker trades, but not the gas trades, only the training voyage, as mentioned above, should be necessary.
It is recommended that companies require, through their safety management system, that
LNG vessels produce a training document, which will guide the supernumerary through a training voyage. 4.8.3. BEST OPERATIONAL PRACTICES
Operational Practice will come from underpinning knowledge of the operators and the Policies and Procedures provided for the vessel/fleet by the Owners/Operators.
The fundamental element of operational practise is training and this training should be carried
out on a regular basis on board and on-shore. All training should be accredited and certified. 4.8.3.1. Safety Management Systems
The ISM Code requires the shipowner, ship manager, or the bareboat charterer to structure a safety management system (SMS) meeting the requirements of the ISM Code. This should be documented, implemented, reviewed and maintained according to set procedures concerning, the safety of the ship and the prevention of pollution.
Safety management systems aim to foster a safety culture among employees. This can prove
difficult where the turnover of crews is high or where management commitment is weak. The development and maintenance of a sound SMS is, therefore, dependent on a continual drive for improvement from shipping company and shipboard management teams alike. This focus should constantly encourage shipmasters on LNG carriers to be well acquainted with shore management people and practices.
Managers of LNG Fleets should have access to resources of appropriate experience and
expertise. The ISM code mandates shipping companies to follow the principles of safe management and
specifies training program. The ISM Code requires company procedures for:
• Manning by experienced, qualified, certificated and medically fit seafarers. • Essential instruction for new personnel. • Appropriate knowledge of rules by all seafarers. • Identification of training needs for all personnel.
The ISM Code also requires proper definition of the responsibilities, authorities and
interrelation of all personnel who manage, perform and verify work relating to and affecting safety and pollution prevention. By defining the responsibilities of all officers and ratings, training needs are better gauged.
A ship management company, surveyed under the terms of the ISM Code, will be issued with
a Document of Compliance (DOC) and this should be displayed in its managerial headquarters. The SMS, as covered by the DOC, is company-wide while individual procedures applicable to each vessel or each ship-type are collected onboard for review and verification at another time and in accordance with internal and external auditing procedures. It is recommended that the master and the chief engineer in particular, have sufficient experience with their current company in order to be familiar with the company's safety management system.
105
Where practical, operational procedures should be established in writing, for cargo handling in
each port, for each ship, and operations should be managed accordingly. Ship and terminal staff should jointly draft these procedures so ensuring a safe system of operation across the ship/shore interface. The ship's safety management system should reference these procedures and officers training programmes should include this data.
Ship-related documentation should include manufacturers’ manuals such as those issued by
pump makers or level gauge suppliers. Equally important are management documents (for shipboard carriage) such as the shipowner-supplied or shipyard-supplied documents. The company's safety management system, when addressing LNG carriers, should refer to a series of company produced manuals vital to safe operations within the trade. Such manuals should include where appropriate:-
• Bridge and engine room and cargo procedures. • Shipmaster's guide. • Cargo Operations Manual. • Information and instruction books for bridge, deck and engine room.
Current practice on LNG carriers is to integrate, as far as possible, all shipboard manuals into
one volume and, where possible, to distil the contents for ease of reference for ships officers into a task-based system. Computer-based help and search facilities often help to achieve this aim. In either case, good quality manuals should be made easily available to all crewmembers and should be considered a vital part of operations and training. The manuals which should benefit from better integration are as follows:
• The safety management system manuals • Safety Training Manual, as required by SOLAS Chapter III, Regulation 35 • Onboard training aids, as required by SOLAS Chapter III, Regulation 35 • Operating manuals, as required by the IGC Code • Programmed or planned maintenance system • Shipboard Oil Pollution Emergency Plans (SOPEP) • Stability Information • Security Manual
4.8.3.2. Maintenance Systems
LNG vessels represent a very significant financial investment that has to be protected in an optimal way for an extended operational life expectancy of about 40 years. The objective of the maintenance system should be to protect the integrity of the hull structure to achieve a long life and by comprehensive and rigorous inspection and maintenance of cargo and propulsion systems ensure that the vessel operates safely and reliably between planned repair periods, without incurring downtime.
The Maintenance System should consider all aspects of vessel inspection and maintenance of
the following:
• Hull integrity • Structure • Coatings • Cargo containment system • Cargo handling systems • Electrical systems • Propulsion systems • Safety systems
A number of different techniques should be applied and controlled under an overall Planned
Maintenance System (PMS). The Classification Society survey schedules should be used as a basic

106
framework on which to build the overall scheme and this may itself be tailored to the particular requirements of the LNG Project that employs the vessel. Thus major maintenance events will be the Class special and intermediate surveys during which inspection and maintenance of those systems that are in continuous use or unreachable during operation will be dealt with.
Although in some areas of the shipping industry dry-docking is carried out at 5 year intervals
with intermediate in-water inspections this is not the usual practice for LNG carriers because of the requirement for maximum reliability of all systems. It is recommended that vessels be dry-docked at approximately 30-month intervals.
The inspection and maintenance activities should be based on the maintenance check lists of
all equipment which require regular inspection. The check list must be signed and approved by an appropriate body for verification that regular inspection and maintenance have been carried out. 4.8.3.3. Dry-dock Periods
These are the best opportunities to conduct detailed examinations of hull structure and access systems will allow close up examination of locations that are particularly sensitive to fatigue that are not easily reached with the vessel in service. It is recommended that the maintenance system also includes regular hull inspections in service by both ship’s crew and specialists at intervals not exceeding 12 months. The inspection routines should detail precisely the location of all structural details that are critical.
The longevity of LNG carriers is highly dependent upon the maintenance of water ballast tank
coatings. These should be inspected at 12 month intervals and maintenance work carried out during dry-docks periods when optimum conditions of humidity can be achieved to give the best results.
Cargo containment and handling systems should be comprehensively inspected and
overhauled at the dry-dock periods. Cargo pumps and spray pumps should be removed for overhaul so that they are all overhauled at 5-year intervals; it is recommended that duplicated pumps are overhauled in a stagger at successive dry-docking and that manufacturers or approved specialists carry out the work in dedicated ‘clean’ workshops. The same philosophy should apply to cryogenic valves and vapour compressors. Cargo safety valves should all be overhauled, tested and reset by specialists at every dry-docking and again the use of clean dedicated facilities is recommended.
Machinery surveys that are carried out during docking include main boilers, propulsion
turbines and gears, main generators and pressure vessels. The extent of examination may be reduced if a Class approved condition monitoring system is in use, this may allow pumps and turbines to be credited without disturbance provided that documented operating conditions are all in order. Condition Monitoring Systems (CMS) will form a part of the overall Planned Maintenance System (PMS) and may include vibration monitoring, lubricating oil analysis including wear element analysis, thermographic surveys and recording of operating parameters. 4.8.3.4. In Service periods
The Planned Maintenance System (PMS) is fundamental to the reliable operation of the vessel and is usually based on a proprietary software system. The software contains the maintenance routines, intervals and history for all vessel systems and equipment items; additionally it may include modules to keep track of spare parts inventory and purchase orders.
The initial compilation of the data in the system is of great importance and is sometimes given
insufficient attention or resources. The integrity of the system and ship itself depends upon the entry of accurate and comprehensive, vessel-specific data. The system should be available for use from the date of delivery of the vessel and resources should be assigned to its population with data during the shipbuilding period. A system that is seen to contain non vessel-specific data and inadequate or inappropriate routines immediately loses credibility and the support and interest of ship’s staff.
107
Adjustments and additions may be found to be necessary once the vessel enters service and it is important that a change management process controls such changes.
Maintenance routines are carried out at intervals determined by:
• Calendar – fixed intervals of time. • Running hours – hours are normally entered manually at monthly intervals from meters or
logbook records. Routines are as recommended by equipment manufacturers. • Condition – monitoring of vibration or oil quality is carried out at fixed calendar intervals and
maintenance is triggered when indicated by the recording of an abnormal condition. Useful monitoring tools for electrical systems are routine insulation tests and the thermographic survey of switchboards in particular.
The PMS should be Class approved and periodically audited by Class surveyors. The
comprehensive recording of maintenance and inspection of equipment, both scheduled and unscheduled together with condition monitoring data allows Class to credit many items of machinery for survey without needless dismantling.
The PMS should also be used to record the routine inspections of any part of the vessel, for
example ballast tank coating inspections, as well dry-docking specifications and reports. In this way a complete history of the vessels maintenance and condition is built up. 4.8.4. PORT OPERATIONS
Gas tanker and terminal operations carry a range of operational risks arising from transport, storage and transfer of liquefied natural gas and petroleum gasses. These risks are unique to liquefied gas operations and require specific measures to manage them within tolerable limits.
Many gas terminals are situated within the environs of established ports. Hence their
operations and those of the gas tankers serving them necessarily share a common operational environment with other port users. Such situations have existed for many years. Consequently industry members have acquired valuable experience in conducting gas operations in port environments that also host numerous other port users and other industrial activities.
Operators therefore have a need for both a systematic assessment of operating risk and a
range of risk reduction measures that can be tailored to be effective in specific situations. Nevertheless change in operational risk profiles may not always be manageable solely by gas
businesses adjusting their operating procedures. In many situations the co-operation of port administrations and service providers will be required to achieve the required degree of security. This will be especially true of risks arising from the movement of gas tankers in port areas and other activities conducted in the vicinity of gas tankers and terminals, including the movement of other ships.
During its transits from the open sea to its terminal berth and return to sea, an LNG tanker will
be exposed to the same profile of operational risks as any other ship of similar size in the same operational theatre. However the consequences of severe structural damage to the LNG tanker may be far more serious than those of similar incidents involving other types of ship.
Hence every phase of the port transit must be analysed with the express purpose of
eliminating any credible probability of the ship sustaining serious hull damage. This approach requires an analysis of the physical features of the transit – e.g. approach channels – and an examination of associated port services, such as pilotage, tugs and Vessel Traffic System (VTS).
The security of LNG tanker transit operations rests on two distinct but related sets of activity.
First, a systematic analysis and preparation of the operational environment with a view to eliminating all potent threats to the transiting tanker and, second, establishing a set of operational procedures that effectively manage any residual risk still extant in the operational theatre.
108
This paper expounds a doctrine of protective location for gas terminals, arguing for the elimination of major risk elements by locating gas operations in places where they will not be exposed to uncontrolled threats from without their own operating environments. Under this doctrine operational risks are removed from the operational aspects of gas shipping. Such risks as then remain are assessed and afterwards addressed by the implementation of procedures derived specifically from the risk assessment. Hence gas-shipping operations are to be managed within tolerable limits – i.e. residual risk exposures are reduced to manageable proportions. In order to fulfil this requirement, the following aspects can be used as the guidelines to prevent the operational risks of the LNG tanker:
• Anchorage • Approach Channel • Turning Basins • Ships Inspection • Passage Planning • Bridge Team Management • Pilotage • Vessel Traffic System • Safety Zone • Towage
4.8.4.1. Anchorages
When a LNG carrier is obliged to lie at anchor off a port, waiting to progress to her berth, the circumstances prevailing at the anchorage should be analysed to determine if it is likely to be exposed to unacceptable risk. Above all there should be a careful scrutiny of the possibility for its being struck by other ships passing in and out of the port – particularly high displacement ships moving at speed.
Whatever the specific circumstances, no anchorage should be designated for use by laden
LNG carriers if it carries a risk of a threatening encounter with heavy displacement vessels travelling at speed, in the context of normal operations of the port.
Port Authorities generally recognise a need to keep ships carrying hazardous cargoes
segregated from other classes of ship. Hence it is not uncommon for a specific anchorage area to be designated for such ships, often, but not always, outside port limits away from other port traffic. It is not uncommon therefore to have LNG carriers sharing an anchorage area with oil and chemical tankers.
An anchorage designated for use by LNG carriers should clearly be indicated, on charts and
on site. The area should be prohibited to all other transiting ships. The characteristics of the anchorage should be compatible with the characteristic behaviour of LNG tankers under prevailing conditions of wind and tide. Above all, it should not expose a LNG carrier to the prospect of a hull penetration – e.g. by grounding on rock pinnacles - in the event that it drags anchor. 4.8.4.2. Approach Channel
The configuration of an approach channel designated for use by LNG carriers should be determined by the same elementary factors that inform the use of restricted channels by any other class of ship. In broad terms these address the depth of water required, the manoeuvring characteristics of the contemplated ships within expected operating conditions, while maintaining effective control of transiting ship. Thus:
• The ship’s draught, including any increase in draught caused by the decrease in water density.
109
• Squat, which is related to the speed of the ship, water depth and channel profile. • Reduction of under keel clearance as a result of pitching or rolling. • The interaction between the sea bed and the ship’s bottom as a consequence of trim of the
ship.
In designing the final approach to the berth it is essential that there be adequate scope to reduce speed, while still retaining directional control over the incoming tanker. It is also essential that the final approach can be made without requiring incoming tankers to be steered directly at the berth while still having to maintain significant headway. 4.8.4.3. Turning Basins
If LNG carriers are required to be turned around, either prior to berthing at a terminal, or after departure, the size and shape of the turning basin should be consistent with manoeuvring the ship under the maximum specified operating limits for conducting berthing operations. Generally benign weather conditions might predicate a smaller turning basin than would be required if strong winds and significant current effects are anticipated. In general the stronger the weather and current forces the larger the basin should be. 4.8.4.4. Ship Inspections
Pre-arrival inspections are a common feature of bulk oil trading, but not at all common in LNG shipping, where tankers generally have been dedicated to regular trading between a small number of ports. Consequently ports are familiar with the ships and, perhaps more importantly, the ships’ crews are familiar with the ports.
The proliferation of vetting inspections in the oil trades has giving rise to excessive demands
on ships staff in port. The industry seeks to minimise this burden by sharing inspection data through the OCIMF’s Ship Inspection and Reporting Exchange (SIRE) system. Ship owners and all parties involved in LNG carrier inspections are urged to take advantage of having reports posted on this system to help prevent a proliferation of repetitive inspections. 4.8.4.5. Passage Planning
Active planning is calculated to provide continuous monitoring of a ship’s track, early warning of deviation from plan rapid and effective response to deviations from track and the approach of dangers – e.g. collision risk. Expected speeds also should be marked for each part of the transit. No tanker should be committed to successive stages of the transit unless speed and position in the channel conform to plan and, if meeting tugs, their number and readiness have been confirmed. 4.8.4.6. Bridge Team Management
Having a plan is essential but it will be ineffective unless progress of the vessel is continuously monitored against the plan. This is the function of the bridge team who should ensure that the guidance given by the Pilot is appropriate to the position and intended movements of the vessel, taking into account any dangers to navigation in the vicinity of the vessel and along its intended track
The aim of bridge team management is to create a proactive culture for managing the
navigation, one in which the master and pilot are fed the information they require in advance of an intended manoeuvre and are given adequate warning of a developing situations that might undermine the integrity of the plan for the passage. Thus all officers on the bridge play active contributory roles in the piloting the vessel, with the Master in a supervisory or managerial role.

110
4.8.4.7. Pilotage
For large ships the services of a licensed pilot are mandatory for the conduct of port transits in virtually every port in the world, unless granted an exemption certificate.
Professional standards and experience profiles among pilots vary considerably port to port,
yet it is essential they all be familiar with handling characteristics of the ships they serve. LNG tankers are rare in the world’s merchant fleets and it is unlikely, when operations are first introduced in a port, that its pilots will have had experience of them.
Before LNG operations begin at a port with no previous history of the trade it is prudent for
simulator training to be provided for pilots and, perhaps, tug masters. Such training would aim to ensure all involved parties are thoroughly au fait with the proposed operation and are practised in handling emergency procedures and deviations from plan. 4.8.4.8. Vessel Traffic Systems
These schemes monitor traffic flows within a port and issue advice to transiting ships on the movements of other traffic in the area.
They are shore based with Vessel Traffic System (VTS) operators observing traffic on radar
and advising other traffic, by radio, of movements within the area. Recently developed Automatic Information Systems (AIS) may have a growing role in the future – providing the same service.
For transiting gas tankers, who must avoid threatening encounters with other traffic, the
advice flowing from such a service can be critical to their security in ports having dense and random traffic patters. 4.8.4.9. Safety Zone
It is sound practice to establish an exclusion zone around a transiting gas carrier. In this way an area of sea space is established around the tanker into which no other traffic is permitted to enter. Hence the tanker’s progress will never be immediately hindered by encounters with other traffic, nor will it encounter traffic having the potential to penetrate its hull.
The dimensions and shape of an exclusion zone should be determined in the context of the
specific conditions of a port. 4.8.4.10. Towage
Following the same weather which determines port design parameters, the operating limits for LNG carriers should also be specified in terms of wind speed and current drift. These parameters are then used to calculate the maximum wind forces acting on the largest LNG carrier using the port, and thence the number and power of the tugs needed for berthing manoeuvres is specified. There must always be sufficient tug assistance to control LNG carriers in the maximum permitted operating conditions and this should be specified assuming the ship's engines are not available. This method gives different results from one terminal to another. Accordingly, minimum tug power is not an absolute value. Nevertheless, it has been found that for LNG carriers of 135,000 m3 capacity, acceptable standards are usually in the range of three or four tugs having a combined bollard pull between 120 to 140 tonnes. These tugs should be able to exert approximately half of this total power at each end of the ship. Given that four tugs are provided, in terms of tug propulsion, this suggests that each tug should have engines capable of a minimum of 3,000 horsepower, although this is dependant on propeller configuration. 4.8.4.11. Mooring

111
The foundation of safe LNG transfer is secure mooring of the berthed tanker. Without this the
security of the transfer arms is compromised, rendering all LNG transfers exposed to an inherent risk of LNG escape through rupture – with the defences of emergency shut down and Powered Emergency Release Couplers (PERCs) remaining to mitigate the consequences.
Effective mooring is achieved by an array of breast lines led to secure points lying within the
length of the ship, at angles no more than 15 degrees from the perpendicular to a ships centre line and springs lying as near to parallel to the centre line as possible. 4.9. SECURITY 4.9.1. INTRODUCTION
Since the events of the 11th September 2001 security has come to the fore in all aspects of life including the shipping industry. None more so than for an LNG carrier entering a US port. This paper defines the security risks for both vessels and terminals and highlights the preventative measures in place.
Security is a term mentioned in everyday life but what does security actually mean? The
Oxford English dictionary defines security as “the state or feeling of being secure”. However what is it we need to be secure against? The threat to modern day industry and shipping comes in several forms: 4.9.2. TERRORISM
This is the obvious threat and the one most normally associated with security. The biggest threat to a ship comes from a suicide attack by a small boat packed with explosives. This has happened twice recently, to the VLCC Limburg off Yemen (2002) and the USS Cole off Aden (2000). Terrorists could also plant a remote activated or timed bomb onboard, drop a bomb on a vessel from a bridge, crash a plane into a vessel or initiate a hand held missile attack against a vessel from the shore or a boat. Likewise a bomb or missile attack could be made on a terminal with or without a vessel alongside. Ships could also be used to smuggle weapons of mass destruction into a country.
A vessel could be hijacked for terrorism or for criminal reasons. The most infamous hijacking
occurred in 1985 when the cruise ship Achille Lauro was taken over by Palestinian terrorists and an elderly American passenger was killed. A vessel commandeered by terrorists and used to intentionally ram another vessel or to ground in order to cause pollution or block a port entry could have considerable consequences. 4.9.3. OTHER SECURITY ISSUES
The number of pirate attacks on merchant vessels in recent years has given considerable cause for concern especially where seafarers have been killed or injured. There are certain parts of the world where these attacks occur, mainly by groups of heavily armed men boarding from speedboats while the vessel is underway at night or while the vessel is at anchor. The vessel’s cargo, equipment or crew belongings are all liable to theft as is the vessel itself. The same applies to equipment within the terminal. A ship is a means of importing illegal drugs into a country. This can be achieved by a variety of means and in varying quantities. One vessel was even found with a torpedo shaped container welded to its keel containing drugs. Political and economic refugees have hidden themselves in a variety of locations onboard merchant vessels in order to seek better living conditions abroad. As in all industries, ships and terminals may be subject to acts of industrial espionage.

112
4.9.4. PREVENTATIVE MEASURES
A gas tanker terminal has traditionally been a secure area, normally in a isolated location, with strict restriction of access and identification checks, security fences and cameras. This has been the case long before 9/11 or the ISPS code become realities.
The terminal restrictions automatically reduce the amount of access to a gas tanker alongside
as compared to, for example, a cargo vessel on a open berth. The anchorages for gas tankers are, like most of the terminals, isolated from residential areas
and, quite often, several miles offshore. Gas carriers are also designed with extremely high freeboards which deter persons attempting to make unauthorised boarding either at anchor or while the vessel is alongside. It is also normal practice to keep the vessel’s gangways raised to deck level when at anchor except when authorised personnel are boarding.
Preventative measures for deterring pirates have been documented for several years. They
include, but are not limited to, the following:
• Early detection of suspicious persons or craft approaching the vessel • Ensuring by means of lights, alarm bells, crew activity etc that potential robbers are aware that
they have been detected • Preventing robbers gaining access to the ship - i.e. by the use of fire hoses • Ensuring the safety of the ship’s crew • Ensuring that, if boarders do gain access, the opportunity to steal cargo, stores or personal
effects is minimised 4.9.5. SOLAS
Recent amendments to the Safety Of Life At Sea convention (SOLAS) require vessels to have:
• Automatic Identification System (AIS) - This is short range tracking made by a continuous broadcast system on marine VHF frequencies.
• Long range tracking system. - This is worldwide tracking such as the “Purplefinder” web based tracking system.
• Continuous Synopsis record – A record of the vessel’s history with respect to owners, flag name, etc
• Ship identification number – this is to be marked on the ship’s hull and the transverse bulkhead
4.9.6. INTERNATIONAL SHIP AND PORT FACILITY SECURITY (ISPS) CODE
On the 1st July 2004 the International Ship and Port Facility Security (ISPS) Code came into force for all foreign going vessels over 500 gross tonnes and to all port facilities serving vessels on international voyages. This legislation requires vessels to have the following:
• A approved ship security plan • A ship security assessment • A ship security officer • A company security officer • A system of conducting appropriate drills and exercises • Appropriate resources to enable the security plan to be carried out
113
• Ship security alert system (A “panic” button which is silent onboard but which will alert the operators and flag state to a hostile act)
• A International Ship Security Certificate • Identification of restricted areas • Measures for the prevention of unauthorised access to the ship • Procedures for responding to security threats or breaches of security • Procedures for evacuation in case of security threats or breaches of security • Duties of shipboard personnel assigned security responsibilities and of other shipboard
personnel on security aspects • Procedures for reporting security incidents
The ISPS Code is significant in that it is the first IMO legislation also aimed at ports. The
requirements for ports are similar to those for ships. Ports are required to have the following:
• Port facility security assessment • Port facility security plan • Port facility security officer • Means of establishing identity of those using the port facility. IE through the use of ID cards
The ISPS code dictates three levels of security with level one being the lowest and level three
the most stringent. There is also provision for the port and the vessel to be able to issue a declaration of security regarding any concerns over the ship/shore interface. 4.9.7. SUMMARY
The ISPS code is a very stringent set of regulations which will enhance maritime security. Strict enforcement controls are in place and there have been a few cases of vessels being delayed berthing due to deficiencies in onboard security management.
Restriction of access remains the greatest tool to both the vessel and the terminal. It is also
imperative that all packages, stores, spare gear etc are checked and verified. Modern day terrorists appear to favour attacks which inflict large scale loss of life. Contrary to
popular belief, an attack on an LNG carrier is unlikely to produce this. A missile would have to penetrate the double hull, the thick cargo insulation and the cargo tank wall to get to the cargo. Even then, uncontrolled burning from the escaping natural gas vapour, rather than an explosion is the most likely scenario. This would not produce the large scale loss of life sought by the perpetrators.
An LNG carrier does, however, remain a high profile target which would generate publicity
and, most likely, even stricter regulation should an attack occur. All concerned with the gas industry at sea and in the terminals should continue to take all
possible measures to maintain the security of ships and terminals and to preserve the excellent record that the industry possesses. It should be emphasised that the likelihood of a major attack against shipping is low.

114
APPENDIX 4.1: Safety Questionnaire
Regulations and Recommendations take many forms and emanate from a number of internationally recognized organisations. Many of these are listed on the attachment.
Over laid on this raft of requirements are rules laid down by Flag State and Port State of
individual Countries. Finally there are individual Harbour, Port and Local Authority Regulations specific to particular
terminals and adjacent land areas. All must be adhered to when preparing a site, building a terminal, trading and operating a
vessel. Demonstration of compliance indicates considerable knowledge of the requirements. The IGU / SIGTTO questionnaire went to over 130 operators in the liquefied gas business and
the responses assessed. The two organizations are very grateful for the time and effort taken by many operators in completing the questionnaire and the results have demonstrated a high level of knowledge and compliance which indicate a well, but not over, regulated industry which takes a pride in its achievements and record of safety.
The divide between terminal operators and ship operators was roughly 50/50 with more
terminals under the membership of the IGU whereas SIGTTO covered the later. Terminals adhered to National and Local Regulations and recommendations whereas ship
operators covered International, National and Local regulations. Reflecting the nature of the business ship operators provided a more comprehensive
response and total adherence to the recommendations promulgated by the International Maritime Organisation.
Similarly the recommendations and guidelines promulgated by non-governmental
organizations are well recognized and used throughout. Summary
The questionnaire was a useful exercise which clearly demonstrated a commitment to the regulations and recommendations presently in place for the liquefied gas marine terminal and shipping business.
Although the overall response was disappointing, those companies who did find time to
complete the questionnaire indicated a well operated and managed operation.
115
Safety questionnaire letter To: Plant and Terminal managers and Vessel owners and operators 4th quarter 2004 Dear colleague, SURVEY OF SAFETY STANDARDS The International Gas Union (IGU) is a world-wide, non-profit organisation promoting the progress of the gas industry. Through its many member countries representing approximately 90% of global sales, IGU covers all aspects of the natural gas industry. In collaboration with the Society of International Gas Tanker and Terminal Operators (SIGTTO) IGU is conducting a survey of standards and guidelines used at LNG production, transportation and receiving facilities world-wide. This invitation has been sent to an extended list of IGU and SIGTTO members, and we would appreciate your participation. The result of the survey will be part of a report prepared by a study group comprising 18 members from 13 different countries representing all parts of the LNG industry and will be presented at the World Gas Conference in 2006. The study will cover design and operational safety of all LNG facilities (e.g. process, storage, marine interface) as well as security at the production and receiving terminals. Furthermore, on the LNG vessel side the study will cover operational safety, hull and machinery, berthing safety and security. The world LNG industry has sustained an excellent safety record throughout its 40 year history and we should strive hard to maintain this record. Safety and security in the LNG chain can not be looked upon as segregated regional or commercial concerns. It is something that effects the whole industry, directly or indirectly, everywhere and in all parts of the chain. The LNG industry must continue to focus on this to move forward. The IGU is in a position to use its weight to educate, inform and influence decision makers on issues that concern all nation members and the industry at large. The purpose of this letter is to ask you to contribute by identifying which safety standards are used at your plant, terminal or onboard your vessel. We would therefore ask you to please send us a list of the standards and guidelines you follow. The list should be as comprehensive as possible, including both international as well as national standards and guidelines. Attached is a table of activities to help answer this request. Your contribution by letter or e-mail will be very valuable to the industry. Please forward your information before 31st December 2004 to the following address:
116
International Gas Union c/o SIGTTO London Liaison Office 17 St. Helen’s Place EC3A 6DG, London, UK Attn: General Manager or, [email protected] We will ensure complete anonymity with regard to the information you send us. Your organisation or company name (or that of your owner) will not be mentioned in the final report or used in the presentation of the report at the WGC in 2006 without your prior consent. Should you have any queries, please contact any of relevant study group members listed in the attachment. Yours sincerely, Ø. Bruno Larsen Chairman of Study Group D2 International Gas Union

SAFETY QUESTIONNAIRE MATRIX
A B C A B C
Recommendations/Regulations
INTERNATIONAL
NATIONAL LOCAL Recommendations/Regulations
INTERNATIONAL
NATIONAL LOCAL
1 Gas production 8 Berthing / Unberthing a Drilling/Operating a Jetty Construction b Planning designing construction platforms b Berthing velocity c Drilling and well servicing c Berthing Displacement d Subsurface safety valves d Gangway e Design and hazard analysis-offshore e Mooring hooks f Occupational safety oil and gas well drilling f Wind Loads 2 Liquefaction Plant g Manifolds a Design of onshore installations h Security b Gas producing and processing i Design Guidelines c Liquefaction j Jetty Construction 3 Storage a Loading 9 Alongside a Loading Arms 4 Fire/explosion protection b Fenders c Ship Shore Meetings d Weather Parameters 5 At Sea Manpower e Fire Fighting Equipment a Crew Qualifications f Overall operations b Crew Training g Cargo Calculations c Crew Numbers h Odourisation d Crew Conditions i Contingency Planning e Lifesaving j Relief Valves

118
A B C A B C
Recommendations/Regulations
INTERNATIONAL
NATIONAL LOCAL Recommendations/Regulations
INTERNATIONAL
NATIONAL LOCAL
6 At Sea Vessels 10 Cargo Operations a Construction a Pressure Relief b Classification b Surge Pressures c Flagging c ESD d Operation d Custody Transfer e Safety e Fire Hazard Management f Navigation f Strainers g Security h Documentation 11 Terminal Operations i Risk Assessment a Mooring j Maintenance b Security c Contingency Planning
7 Arrival at Port d Training a Pilotage e Manning/Personnel b Tugs f Fi Fi Equipment c Mooring Boats g Safety, trips and alarms d Mooring gangs h Transfer Arms e Inspection i Calibration of LNG Tanks f UKC j Liq Hydroc. Fl. Level Meas. g Channel Dimensions k Jetty Maintenance h Contingency Planning l Sprinkler Systems i Conservancy/Buoyage m Storage Tanks j VTS n Operation
119
APPENDIX 4.2: Available Legislation and Recommendations Information Organisation Website SIGTTO Society of International Gas Tanker and Terminal Operators www.sigtto.org OCIMF Oil Companies International Marine Forum www.ocimf.org IMO International Maritime Organisation www.imo.org ICS International Chamber of Shipping www.marisec.org GiiGNL Groupe Internationale des Importateurs de Gas Naturel Liquefie www.giignl.org ISO International Standards Organisation www.iso.org PIANC Permanent International Association of Naviagtion Congresses IAPH International Association of Ports and Harbours www.iaphworldports.org USCG US Coast Guard www.uscg.mil Flag State Port State Class Classification Societies Lloyds Register www.lr.org DNV www.dnv.no ABS www.eagle.org BV www.bureauveritas.com CEN European Standards www.cenorm.be NFPA National Fire Protection Association www.nfpa.org HSE Health and Safety Executive Factories Act BSI British Standards Institute API American Petroleum Institute www.api.org JGA Japanese Gas Association www.jsanet.or.jp ANSI American National Standards Institute ASTM American Society for Testing Materials

APPENDIX 4.3: Study Group Mandate and Work Programme
International Gas Union Programme Committee D – LNG
STUDY GROUP D 2 WORK PROGRAMME
A. Mandate Safety and Technology Developments in LNG Terminals and Vessels
The development of new LNG import and export terminals and LNG vessels meets many environmental hurdles not least the perceived high safety and security risk. Criteria differ from one country to another. The efficiency improvements and development in LNG vessels technology and terminal concepts, including very large vessels and offshore regasification terminals, are moving the industry into the future. The study aims to deal with safety risk perceptions and support implementation of new technology by the industry. (Approved by PGC D at its meeting in London on 11 September 2003) B. Study scope of work 1. Study Report to be delivered and presented at World Gas Conference (WGC) 2006. 2. Workshop(s) on safety and security (under the auspices of IGU PGC D) to be held during
the triennium (2003-2006) 3. Continue to emphasise safety awareness during the triennium throughout the LNG
industry. Study Group members or their national organisations/companies should seek to speak about the issue at various LNG industry conferences. (Either on behalf of IGU SG D2 or organisation/company)
C. Study Group meeting schedule Kick-off 19 & 24 March 2004 Doha 2nd 23 June 2004 London 3rd 26 September 2004 Algeria 4th 15 March 2005 Bilbao 5th 14 June 2005 London 6th 5 October 2005 Hammerfest 7th 27 January 2006 Oslo
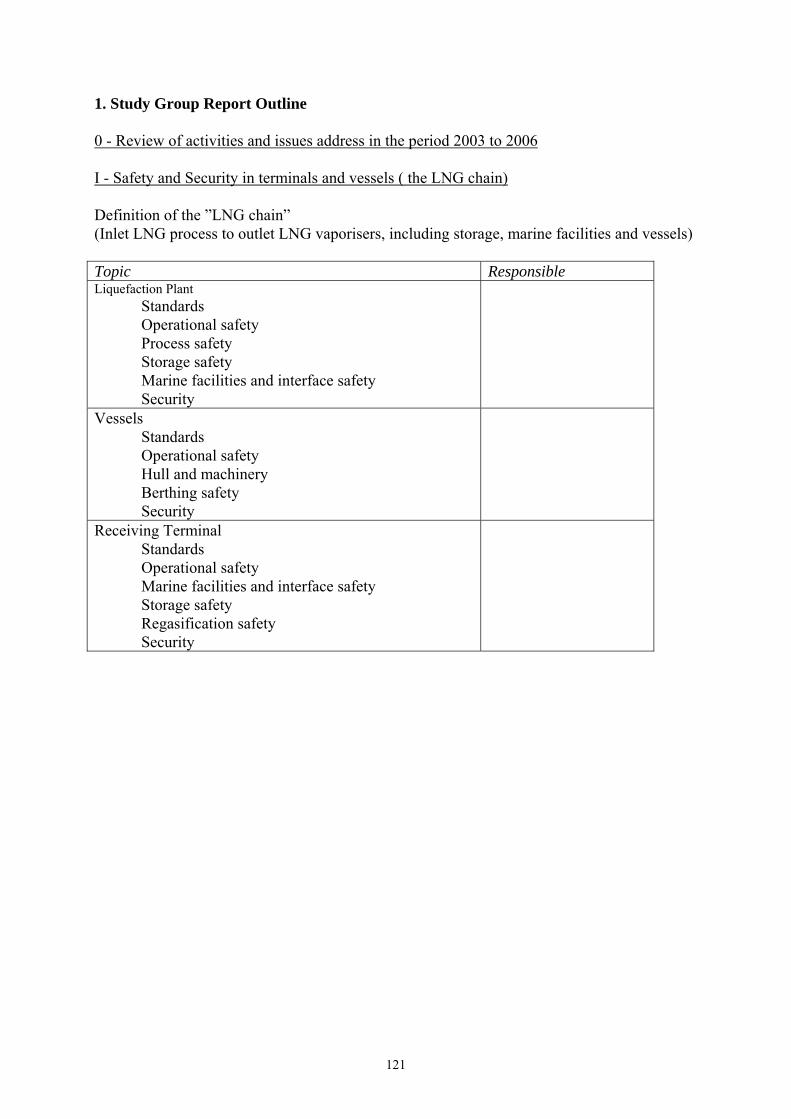
121
1. Study Group Report Outline 0 - Review of activities and issues address in the period 2003 to 2006 I - Safety and Security in terminals and vessels ( the LNG chain) Definition of the ”LNG chain” (Inlet LNG process to outlet LNG vaporisers, including storage, marine facilities and vessels) Topic Responsible Liquefaction Plant Standards Operational safety Process safety Storage safety Marine facilities and interface safety Security
Vessels Standards Operational safety Hull and machinery Berthing safety Security
Receiving Terminal Standards Operational safety Marine facilities and interface safety Storage safety Regasification safety Security

122
II - Technology Developments in terminals and vessels IIA. Terminals developments (export and import terminals) Topic Responsible Larger Trains Offshore terminals Environmental issues Loading/discharge systems Liquefaction process Storage IIB. LNG vessels developments Topic Responsible Larger vessel designs Containment systems Propulsion systems Reliquefaction Regasification vessels solutions Turret moored gas export terminals LNG transfer to and from offshore terminals
Environmental Issues

123
APPENDIX 4.4: study group meeting list Kick-off 19 & 24 March 2004 Doha 2nd 23 June 2004 London 3rd 26 September 2004 Algeria 4th 15 March 2005 Bilbao 5th 14 June 2005 London 6th 5 October 2005 Hammerfest 7th 27 January 2006 Oslo

APPENDIX4.5: Containment Systems
Over the last 3 years a new development in containment system has occurred. GTT has developed the Combined System 1 (CS1), which is a combination of their two existing containment systems, the No. 96 and the Mark III. A brief technical description
3 ships equipped with the CS1 containment system have been ordered by Gaz de France at the Chantier d’Atlantique shipyard in france. They are all due for delivery in 2006.
The 1976 “International Code for the Construction and Equipment of Ships Carrying Liquefied
Gases in Bulk” (IGC Code) came to confirm the main design characteristics of the containment systems developed in the nineteen sixties and to issue further requirements which did not jeopardize the earlier designs that have proved their reliability at sea carrying LNG loads. Containment systems are classified by the Code into two main families, as shown in the next picture:
Designs of containment systems fall into two predominant families:
• “Independent Self Supporting Tanks” sometimes referred to as “free standing tanks”; it is a tank with sufficient structural strength in itself to withstand loads imposed by the cargo. They are three types distinguishable by the requirement regarding the extent of the secondary barrier and the internal pressure it can withstand in operation.
• “Integrated tank system” covering exclusively Membrane tanks which contain LNG within a thin
metallic liquid-tight lining supported completely by a load bearing insulation which is itself supported by the inner hull of the ship.
The Code makes provisions for other possibilities such as the “Semi-membrane tanks”; a
design which is a non-self-supporting one in the loaded condition and consists of a layer, parts of which are supported through insulation by the adjacent hull structure, whereas the rounded parts of this layer connecting the above-mentioned supported parts are designed also to accommodate the
IMO Classification of LNG Carriers
Independent Self Supporting Tanks
Integrated TankSystems
TYPE A P0 = 70kPa
Full Secondary Barrier
TYPE BP0 = 70kPa
Partial SecondaryBarrier
CONCH Prismatic
Al MOSS
SphericalAl or 9%Ni
IHI SPBPrismatic
Al
MembranesP0 = 25kPa
Full Secondary Barrier
G.T.T NO 96InvarInvar
G.T.T Mark IIIS.S 304LTriplex
G.T.T CS 1Invar
Triplex
TYPE CP0 = 200kPa
No SecondaryBarrier
Cylindrical Tanks KHI
IMO Classification of LNG Carriers
Independent Self Supporting Tanks
Integrated TankSystems
TYPE A P0 = 70kPa
Full Secondary Barrier
TYPE BP0 = 70kPa
Partial SecondaryBarrier
CONCH Prismatic
Al MOSS
SphericalAl or 9%Ni
IHI SPBPrismatic
Al
MembranesP0 = 25kPa
Full Secondary Barrier
G.T.T NO 96InvarInvar
G.T.T Mark IIIS.S 304LTriplex
G.T.T CS 1Invar
Triplex
TYPE CP0 = 200kPa
No SecondaryBarrier
Cylindrical Tanks PNG
International Gas Carriers Code

125
thermal and other expansion or contraction. Another containment possibility under the dispositions of the IGC Code is the “Internal insulation tanks” which are non-self-supporting and consist of thermal insulation materials which contribute to the cargo containment and are supported by the structure of the adjacent inner hull or of an independent tank. The inner surface of the insulation is exposed to the cargo; two different categories of “Internal insulation tanks” are outlined in the Code.
In the next section the main features of the containment systems with seagoing experience
shall be briefly depicted. Independent Self Supporting Tanks Type A
Independent tanks Type “A” are tanks which are designed primarily using Recognized
Standards of classical ship-structural analysis procedures. Where such tanks are primarily constructed of plane surfaces (gravity tanks), the design vapour pressure should be less than 70 kPa. A full secondary membrane is required for prismatic and cylindrical shaped tanks.
Three alternative containment systems of type “A” have been successfully utilised in 1960’s
and early seventies to build ships up to a maximum capacity of 40,000m3, Conch I, Worms/GdF and Esso Aluminium.
Since 1970 neither the Worms/GDF nor the Esso Aluminium/McMullen tanks have been
further used. These two containment tank systems can therefore be regarded as obsolete and passed on to the history of the development of LNG cargo containment systems on board LNG tankers. Type B
Independent tanks Type “B” are tanks which are designed using model tests, refined analytical tools and analysis methods to determine stress levels, fatigue life and crack propagation characteristics. Where such tanks are primarily constructed of plane surfaces (gravity tanks) the design vapour pressure should be less than 70 kPa.
Independent Self Supporting Type “B” Tanks does not require a full secondary membrane
under the requirements of IGC Code, a simple dip tray calculated to be able to collect and vaporise the largest foreseeable liquid leaking through crack and its theoretical propagation.

126
Independent Self Supporting Type “B” Spherical Tanks
To the public at large ships with spherical tanks protruding above main deck is the representative of the image that it has of how an LNG carrier should look like.
The first two vessels utilising Moss Rosenberg (MR) insulation system were built and
delivered in Norway in 1973 designed in a five tanks configuration made of 9% nickel steel alloy and with a sphere diameter of 33 meters. All the subsequent vessels built to this containment system have used aluminium (Al-5083-0).
By the end of 2005, the world LNG carrier fleet shall count 87 vessels utilising spherical tanks
system and 21 others are under construction. The MR system that has changed successively its denomination to Kvaerner-Moss and finally
to Moss, is a Type B independent containment system consisting of a number of welded Aluminium spheres which are installed in the cargo holds on a raised foundation deck by means of skirts supporting the spheres via equatorial rings of the spheres.
The upper and the lower part of the skirts are thermally isolated by a four-layer transition joint.
The spheres and the skirts are insulated externally. Panel insulation systems are currently preferred to the spiral generation insulation system.
Polystyrene is used as insulation material in a thickness of about 290 mm for a design boil-off rate of 0.15 % per. day calculated for IMO and USCG conditions The outer surface of the insulation is covered by a thin aluminium sheathing which functions as a vapour barrier and a mechanical protection for the polystyrene insulation slabs.
For a 4 tanks, 140,000 m³ class LNG carrier the thickness of the tank plating varies from
about 30 mm on the top to just below 50 mm immediately above the equator ring and, below the equator ring and from just under 60 mm down to about 40 mm. The equator ring itself has a thickness of about 165mm, in case of 147,500m3 ships. Ship capacity is usually indicated at -162°C; as the spheres loose approximately 1% of their capacity when cooled to cryogenic conditions.
127
Moss proposes to achieve a capacity expansion by inserting cylindrical rings above the equator rings; thus achieving greater tank volumes without increasing the diameters of the spheres. An order with this innovation was very quickly placed with Kawasaki H.I. by a Japanese shipowner. Independent Self Supporting Type “B” Prismatic Tanks
Two vessels utilising IHI SPB system have been delivered during the nineteen nineties. The picture above, on the right hand side shows the mean features of the system. The tanks are made of aluminium. It is our understanding that the builder of this system did not compete for all the tenders that were issued after he has delivered its two 87 500m3, the Artic Sun and the Polar Eagle. Rumours says that for large floating platforms such as FSRU and FPSO the builder would tender with a system in which aluminium is replaced by stainless steel. Type C
Independent tanks Type “C” (also referred to as pressure vessels) are tanks meeting pressure vessel criteria and a design vapour pressure above two bars.
The first LNG carrier built with spherical tanks and no secondary barrier is the 4 000m3
designed for a pressure of 6bars, the vessel was used as a semi-pressurized LPG tanker. More recently two small ships have been delivered to their owners the “Knutsen Pioneer” and a Kawasaki Heavy Industries design, respectively with capacities of 1 300m3 and 2 400m3. Membrane tanks
“Membrane tanks” are non-self-supporting tanks which consist of a thin layer (membrane) supported through insulation by the adjacent hull structure. The membrane is designed in such way that thermal and other expansion or contraction is compensated for without undue stressing of the membrane.
The definition of membrane tanks does not exclude designs such as those in which non-
metallic membranes are used or in which membranes are included or incorporated in insulation. Such designs require, however, special consideration by the Administration. In any case the thickness of the membranes should normally not exceed 1.0 mm.
Gaztransport & Technigaz (G.T.T) has developed three membrane systems, namely the NO
type containment systems, the Mark type and the CS1 type.
All these membrane systems have the following common features:
• A full double hull. • A secondary insulation made of a load bearing insulation material. • A secondary membrane liquid tight. • A primary insulation made of load bearing insulation material. • A primary membrane liquid and gastight.
Both secondary and primary insulation spaces are kept under an inert atmosphere at a
positive pressure in order to prevent any atmospheric air ingress into these spaces. The design insures that there is no source of ignition in the insulation spaces. Nitrogen used to inert the spaces is analysed at a half an hour interval for any hydrocarbon contents even in traces.
The two systems with long standing sea experience are shown in the next two figures:

128
The GT integrated tank NO type technique includes two identical metallic membranes forming two independent barriers and arranged as follows:
• A primary membrane made of Invar, which is a 36% Ni steel alloy supported by insulation boxes made up of plywood and filled with perlite,
• A secondary membrane in Invar absolutely identical to the primary membrane is too
supported by similar insulation boxes.
These two identical metallic membranes are liquid-tight and gas-tight. They constitute two totally independent insulation spaces maintained under inert gas in operation and in a controlled positive pressure to prevent any air ingress. The atmosphere in the insulated spaces is continuously monitored allowing any small defect to be detected within half an hour after its occurrence.
The design currently proposed by GTT, the NO 96, benefits from improvements made
necessary after defects on the previous designs (NO 82, 85 and 88) were discovered soon after their deliveries. The major improvements are outlined in the next table:
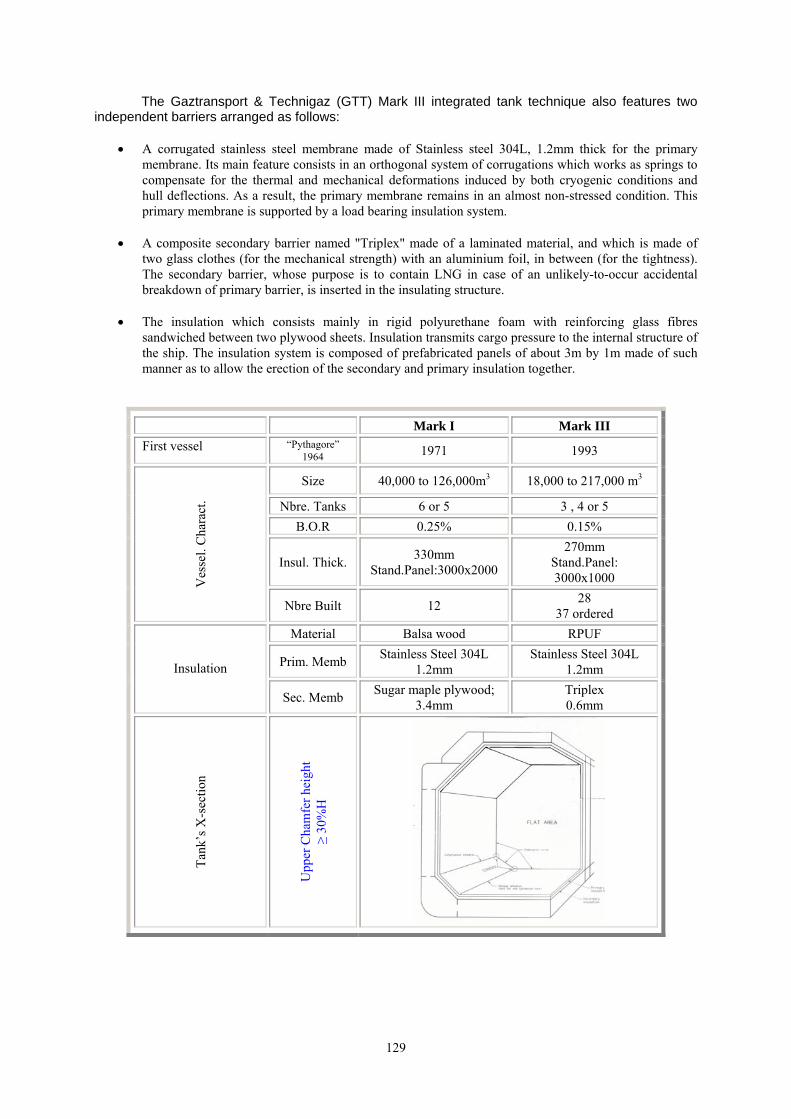
129
The Gaztransport & Technigaz (GTT) Mark III integrated tank technique also features two independent barriers arranged as follows:
• A corrugated stainless steel membrane made of Stainless steel 304L, 1.2mm thick for the primary membrane. Its main feature consists in an orthogonal system of corrugations which works as springs to compensate for the thermal and mechanical deformations induced by both cryogenic conditions and hull deflections. As a result, the primary membrane remains in an almost non-stressed condition. This primary membrane is supported by a load bearing insulation system.
• A composite secondary barrier named "Triplex" made of a laminated material, and which is made of
two glass clothes (for the mechanical strength) with an aluminium foil, in between (for the tightness). The secondary barrier, whose purpose is to contain LNG in case of an unlikely-to-occur accidental breakdown of primary barrier, is inserted in the insulating structure.
• The insulation which consists mainly in rigid polyurethane foam with reinforcing glass fibres
sandwiched between two plywood sheets. Insulation transmits cargo pressure to the internal structure of the ship. The insulation system is composed of prefabricated panels of about 3m by 1m made of such manner as to allow the erection of the secondary and primary insulation together.
Mark I Mark III First vessel “Pythagore”
1964 1971 1993
Size 40,000 to 126,000m3 18,000 to 217,000 m3
Nbre. Tanks 6 or 5 3 , 4 or 5 B.O.R 0.25% 0.15%
Insul. Thick. 330mm Stand.Panel:3000x2000
270mm Stand.Panel: 3000x1000 V
esse
l. C
hara
ct.
Nbre Built 12 28 37 ordered
Material Balsa wood RPUF
Prim. Memb Stainless Steel 304L 1.2mm
Stainless Steel 304L 1.2mm Insulation
Sec. Memb Sugar maple plywood; 3.4mm
Triplex 0.6mm
Tank
’s X
-sec
tion
Upp
er C
ham
fer h
eigh
t ≥
30%
H

130
The two barriers constitute two independent and complete all around the tanks insulation spaces maintained in an inert atmosphere in operation.
Each insulation panel is fixed to the inner hull steel plating by means of load bearing mastic
sticking to the inner hull steel plating. The Mark III system is based on an extensive use of bonding of the materials, including the secondary barrier continuity between panels.
Gaztransport & Technigaz membranes systems and the MOSS spherical systems represent
together more than 97% of the world LNG trading fleet by vessels count. The three percent remaining have been constructed to containment systems which can now be safely qualified of obsolete.
By the end of the year 2005, 98 existing vessels utilise the membrane containment systems
and 114 other shall be delivered before the end of 2009. Statistics appear to indicate that as of the mid nineties of the last century and the beginning of
this century there is a trend perceivable which signifies the preference for membrane type LNG carrier over Moss Rosenberg LNG carrier. This trend has certainly to do with the Korean shipyards that successfully entered the LNG shipbuilding market in the mid nineties and had chosen to build membrane tank ships.
131
APPENDIX 4.6: Propulsion systems
All LNG ships currently in service are driven by steam turbine propulsion systems. The first generation of LNG carriers built in the 1960’s employed steam turbine plants and, in doing so, established the technical basis for burning boil-off gas in boilers. The steam turbine systems have proved extremely reliable however, compared to diesel engines, they are inefficient in terms of fuel consumption. It should be noted, that the oil price shocks of the 1970’s brought about the demise of steam turbines in virtually all other merchant marine applications.
For LNG ships built up to about 20 years ago, there was little incentive to seek more efficient
propulsion plants because the state of the cargo tank insulation technology was such that, on a laden voyage, the natural boil-off gas flow provided about 100 % of the fuel requirements. i.e. even if more efficient plants were available, they could not be used without wasting boil-off gas.
Whilst the main ‘driver’ to consider alternatives has been fuel efficiency, there are other issues
arising which support the need to consider change. In considering powering options for significantly larger LNG vessels, say, 250 000 m3 LNG
carriers, the power for propulsion may be in excess of MW 40. This leads to two specific issues for the large LNG carriers. At this power level, it is well above that for which there is any experience in manufacture and operation of a single-screw classical marine steam turbine plant. Additionally, this amount of power is unlikely to be successfully delivered through a single propeller. Whilst twin-screw designs are available, the hull form needed to achieve a reasonable efficiency precludes the use of twin steam turbine installation. These two factors effectively rule out the traditional steam plant as an option for very large LNG carriers.
A further point of concern for the future of the steam turbine plant is the fact that, out of a
world population of about 40 000 registered merchant vessels, the 160 LNG carriers are the only ones to employ steam plant (there are one or two elderly steam turbine VLCC’s, but these will come out of service in the next few years). This introduces issues surrounding retention of expertise, not only to operate these plants, but also to design, build and maintain them.
Over the years, various propulsion options for LNG vessels have been proposed. For an
alternative to be attractive, it must obviously be economically ‘better’ than the traditional steam turbine option whilst delivering similar high levels of reliability, redundancy and maintainability. The four main contenders, which are considered technically feasible, are:
• Duel Fuel Medium Speed Diesel Electric (DFD • Gas Turbine Electric (GT) • Slow Speed Diesel with Reliquefaction (DRL) • High Pressure Gas Injection Slow Speed Diesel (GID)
Dual Fuel Medium Speed Diesel Electric
The basic concept is to employ multiple dual fuel diesel generators, typically four, to provide all the vessel’s power requirements, including main propulsion, on a ‘power station’ principle. This concept is comparable to that commonly found on modern cruise liners, the main difference being the fuel for the diesel generator engines.
Burning methane in a diesel engine presents technical challenges. The main problem is that
of controlling the detonation characteristics (‘knocking’) of methane in an engine cylinder. The development of DFD engines has been the subject of Research and Development
programmes for many years. This work has finally led to a technically feasible engine using low pressure gas injection developed by Wärtsilä and designated ‘DF’. The first ‘DF’ engine entered service in a shore plant about 6 years ago and currently two LNG ships using this technology are under construction.

132
To comply with IGC “International Code for the Construction and Equipment of Ships Carrying Liquefied Gases in Bulk” 1993 edition with 1998 Supplement and 2000 and 2002 Amendments requirements for a means of managing boil-off gas when the ship is not under way, a thermal oxidizer or incinerator may be installed. This has the capacity to incinerate boil-off gas at a rate equivalent to the normal laden boil-off rate.
The provision of multiple independent diesel generator sets provides a strong guarantee
against total loss of propulsion power in event of plant upset. The most likely consequence of an unscheduled engine shut down is a relatively small loss of speed. It is considered that this concept meets all requirements for reliability, redundancy and maintainability. Slow Speed Diesel with Reliquefaction
This option employs conventional low speed diesel engine technology for propulsion purposes and a reliquefaction plant to turn the boil-off gas back to liquid and return to the cargo tanks. At a conceptual level, this is similar to the practice for fully refrigerated LPG vessels. Various designs for LNG reliquefaction plant have been proposed, all of which work on a nitrogen cycle based on the ‘Brayton’ principle whereas LPG carriers usually employ either direct refrigeration plants with reciprocating compressors or indirect refrigeration plants using a common refrigerant, e.g. R407c, in the primary cycle. For current sized LNG vessels, this implies an additional electrical load of 2 to 4 MW.
Low speed diesel engines have been promoted for larger vessels and were specified for the
210 000-215 000 orders for the Qatar projects. The MAN B&W engines feature twin low speed diesel engines with twon screws and a reliquefaction plant. They are thought to be cheaper in operation than the diesel electric engine. 20 ships are ordered. Gas Turbines
Over the years, one may note the increased application of gas turbines to merchant vessels. This has been the result of, much research on gas turbines which has produced significant improvements in thermal efficiency and reliability.
Today, the thermal efficiency of an aero-derivative simple cycle gas turbine is around 40 %
and, at this level, can show a real advantage compared to a steam turbine. Additionally, the low installation weight and the potential to design shorter engine rooms will give added advantages to the gas turbine concept. The efficiency can be improved to that of a modern diesel by inclusion of extensive waste heat recovery systems to make a combined cycle plant, however this increases the CAPEX and complexity of the plant
In applying gas turbine technology, the choice lies between direct-coupled mechanical drive
and electric drive systems similar to that employed in the DFD concept. Most commentators seem to favour the electric drive route. The gas turbine generator sets would be provided in sound-proof enclosures and positioned relatively high up in the ship, say at aft sunken deck level, to facilitate removal for maintenance.
Of the concepts described, this is probably least developed in the LNG ship application, but
potentially offers a most attractive solution. High Pressure Injection Diesel
The difficulties associated with burning gas in diesel engines have been noted above. A different solution to low pressure injection is to inject the gas at high pressure at the end of the compression stroke in a similar manner to that for liquid fuel. Pilot injection of liquid fuel is necessary to give reliable combustion. Much work was done on this in the 1980’s culminating in a full sized low speed B & W diesel being built by Mitsui Engineering and Shipbuilding at Chiba. The demonstrator performed satisfactorily from the technical point of view but the Achilles’ heel of the design is that the fuel gas has to be compressed to a high pressure, of the order of several hundred bars, before it can

133
be injected. The technology is applied in special applications where high pressure gas is available, e.g. from re-injection compressors on offshore facilities.
MAN B&W have recently announced plans to re-offer to the marine market an engine based
on high pressure gas injection. Conclusion
Whilst the steam turbine plant has provided excellent service in the LNG trade, there are increasing pressures towards change. The main differentiator is the choice of fuel for propulsion of the vessels. The use gas (boil-off gas plus vaporised LNG) or heavy fuel oil as the primary fuel will ultimately be resolved by an economic argument. A secondary factor which may significantly affect the choice is that of maintenance. At one extreme, there is the gas turbine, where major maintenance is carried out by replacement of the unit, to the other, where the number of diesel engine cylinders installed will necessitate very careful maintenance planning to achieve the necessary reliability.

134
APPENDIX 4.7: LNG Reliquefaction onboard LNG carriers
Ever since LNG was first carried on board a vessel in 1959 (and indeed before that in design stage) the question of how to deal with boil-off gas (BOG) has always been one of the dominant features of in the marine transportation of natural gas.
The original option chosen was to adapt the steam turbine propulsion with two marine boilers
into which the BOG could be safely and easily burned within the confines of the engine room. Furthermore this rather inefficient, although reliable, propulsion system could consume all of the BOG. However, as improvements were made in the ship construction along with the use of more efficient thermal insulation materials, the level of BOG was reduced which resulted in the vessels requiring supplementing the BOG with heavy fuel oil. The last generation of steam driven LNG carriers has an overall fuel equivalent requirement of about 180 tons per day, which when broken own is about 1 10 tons BOG and 70 tons heavy fuel oil.
With rising fuel oil prices and the longer voyages there was clearly a need to reduce the fuel
consumption of these ships which triggered the ultimate re-think in moving away from the traditional and reliable steam turbine to what is commonly referred to as "alternative propulsion".
For many engineers this alternative meant keeping the gas out of the engine room or
choosing an alternative to steam that could safely use BOG in the main engine. Thus two main options have been developed:
i) Dual fuel diesel electric (DFDE) ii) Slow speed diesel with re-liquefaction (SSR)
The particular trade economics have dictated which option is to be selected, and to a certain
extent particular preferences of individuals within the companies concerned. Those companies choosing the DFDE alternative appear to have gone for proven technology
where the Wartsila engines have thousands of running hours on rigs and shore based power plants. GdF have done extensive testing on these engines and were very satisfied with the results. Exxon/Qatar on the other hand appears to have taken the riskier route by adopting as yet unproven design with the onboard reliquefaction. One such reliquefaction plant exists on the steam ship LNG Jamal, but this is not used on a full-time operational basis and is not the same as that to be installed on the large Qatari ships.
There has always been some concern within the industry surrounding the level of vibration
from the slow speed diesel plants and the impact on the membrane containment system. These concerns have apparently been addressed at the design stage, but like any prototype ship the final proof will only be accepted once these vessels enter service. Certainly there are theoretical savings in fuel consumption as there is no BOG loss (except for energy loss in reliquefaction) but the vessel can only burn fuel oil all of the time. The true economics of this move to SSR will be affected if there are further rises in fuel oil prices although if gas prices continue to rise this cost will be offset by the higher volume of gas delivered and hence net revenue increase.
There are several manufacturers of the slow-speed diesel engines whilst there is currently
only Wartsila making the DFDE which means that there should be some negotiating power with the engine makers when choosing which engine for the SSR: not only for the main engine purchase but the ongoing cost of spare parts. The question of engine maintenance on these slow speed engines will pose several operational challenges as it is most unlikely that engine immobilisation whilst alongside in port will be readily accepted by terminal or port operators.
The other main area of concern with the SSR is the operation of the reliquefaction plant. How
complex and difficult to operate as a full-time plant is yet to be fully tested. Certainly there are some in the LNG industry with the opinion that the plant will be too complex - whilst this may be somewhat over -exaggerated there will be a need for extensive training. From our perspective our comment is more a question as to whether there will be sufficient expertise available and time to train new

135
entrants into the industry who will be using new propulsion systems and reliquefaction plants. It should not be ignored that in our sister gas industry, LPG, the most difficult plants that they operate are the reliquefaction units.
So to conclude, the LNG Shipping industry is embarking on the biggest change since the
arrival of the Moss tanks with a move away from steam but there is perhaps a similarity with the video industry, when Betamax format was in competition with VHS: ultimately VHS won convincingly but who is the Betamax of the engines?

136
5. THE FUTURE OF THE LNG SPOT MARKET
REPORT OF STUDY GROUP D3
“The future of the LNG spot market”
RAPPORT DU GROUPE DE TRAVAIL D3
“Le futur du Marché Spot de GNL”
Study Group Chairman/Président du Groupe de Travail
Boyoung KIM
Korea

137
ABSTRACT During the triennium, Study Group D3 has examined and analyzed developments concerning “The future the LNG spot market.” We recognize that LNG spot trade is still an emerging and highly fluid dimension of the natural gas market given that the volume of LNG spot trades is quite small when compared with natural gas total trading. However, as LNG infrastructure investment expands LNG spot trade will also grow in significance and assume a more prominent role in the LNG market. While long- term contracts will continue to dominate the LNG industry, in light of the need to finance a highly capital intensive value chain, the spot market continues to be an attractive mechanism for managing the supply-demand balance while at the same time creating the potential for short-term profits in niche markets. This report is just a small initial step toward a better understanding of the dynamics behind the growing spot market. We anticipate that additional research and analysis will be required as LNG trade expands.
RESUME Durant le triennat, le groupe PGCD3 a examiné les développements récents et les perspectives du marché spot de GNL. Ce marché est encore émergent et il reste une composante relativement mineure du commerce international de gaz naturel, en particulier à l’aune des volumes effectivement échangés. Néanmoins, avec l’expansion des infrastructures GNL, le marché spot de GNL va croître progressivement et jouer un rôle plus important. Si les contrats long terme vont continuer à dominer l’industrie du GNL du fait la nature intensément capitalistique de la filière et de ses besoins de financement, le marché spot constituera un mécanisme indispensable pour palier aux déséquilibres entre l’offre et la demande. Il offrira également une source significative d’opportunités de profit à court terme. Ce rapport n’est qu’une première étape faisant le point sur les résultats de l’analyse. D’autres recherches seront sans doute utiles pour appréhender de manière plus exhaustive les ressorts de ce marché en plein développement.
138
TABLE OF CONTENTS
5.1. INTRODUCTION 5.2. DEFINITION AND GLOBAL STATISTICS 5.3. KEY DRIVERS & CONSTRAINTS FOR THE DEVELOPMENT OF
THE LNG SPOT MARKET 5.4. AREA REPORT
5.4.1 Asia 5.4.2 Europe 5.4.3 USA
5.5. CONCLUSION APPENDICES

139
5.1. INTRODUCTION
For the purposes of this report we define “LNG spot trade” as “less than one-year period contract trading”.
According to GIIGNL, although the market share of LNG spot trade accounted for 18.8% of global
gas trade volumes in 2004, this still represents an extraordinary growth if this ratio is compared with the ratio for 2003 i.e. 8.7%. This marked growth is due to several factors such as cold weather in Korea, several accidents at nuclear power plants in Japan and growing demand for scarce LNG cargoes in European and North American markets.
Study Group D3 has attempted to address the future of LNG spot trade because of its growing
importance to the total LNG market and particularly in regulating the gas supply-demand imbalance. Spot trade also can play a role in the development of more flexible contract and market terms
(and vice versa). It is clear that although spot trade plays a relatively minor role today, it will be of much greater importance in the near future. .
This report attempts at analyzing the conditions of the development of such “spot” trade of LNG and
to evaluate if the trend observed today will continue in the future and what are the drivers for such a situation.
5.2. DEFINITION AND GLOBAL STATISTICS
The LNG spot trade is still in its infancy. However the growth potential observed since the last decade reveals the possibility of significant developments in the coming years. The aim of this report is to overview the trends of spot LNG supply and demand and transactions. Therefore, we will focus on the main drivers of spot LNG trading during the period 1992-2004.
Natural gas markets are highly regionalized due to the costs associated with transporting natural
gas over long distances. Indeed, more than 76% of all LNG is still produced and sold within the original two regional markets: Atlantic/Mediterranean & Pacific basins.
Growth of world LNG trade is driven by increasing demand and declining domestic natural gas
resources in gas-consuming countries and by the willingness of gas-producing countries to commercialize their resources.
The main question is what will be the most probable future for the development of spot LNG trade? But first, it is necessary to analyze the recent expansion of the spot LNG trade during the period
from 1992 to 2004.
5.2.1 Definition of “Spot LNG”
For the purpose of this report, the Study Group agreed to adopt the definition of a spot LNG transaction is based on that of PetroStrategies, given that it is one of the main suppliers of LNG statistical market data.
Spot LNG is the defined as LNG transactions or contracts of a duration less than one year.
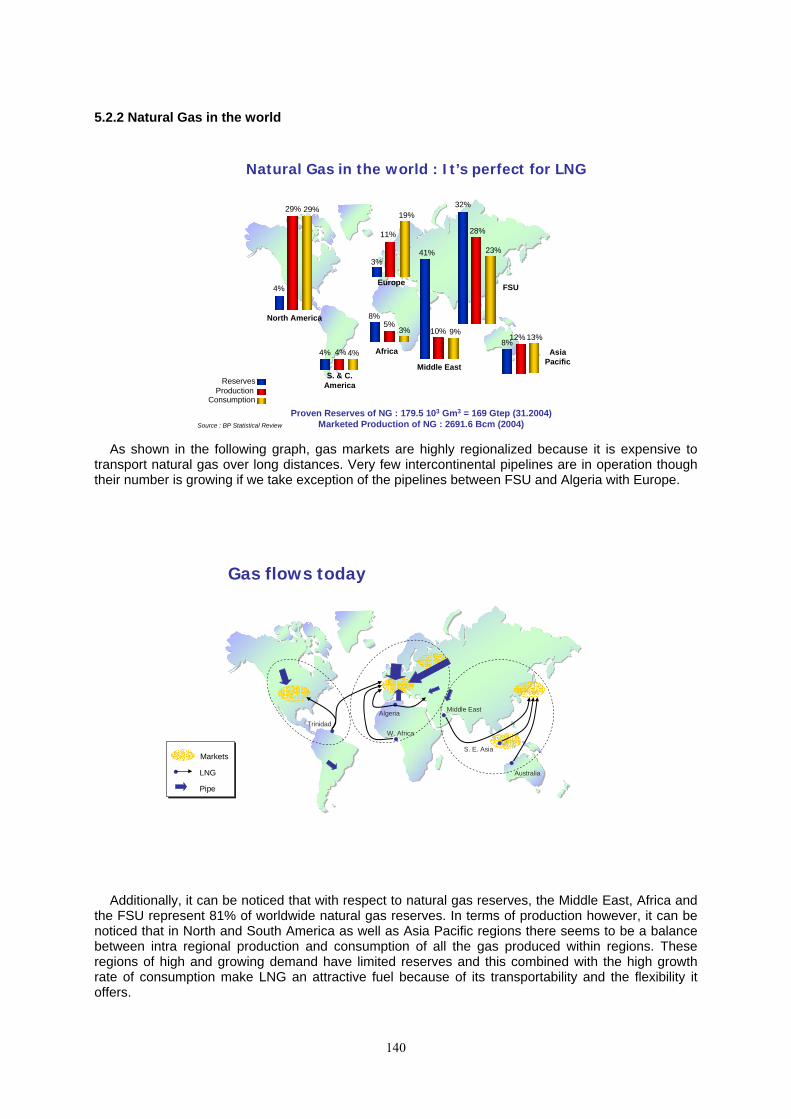
140
5.2.2 Natural Gas in the world
North America
Asia Pacific
Europe
Africa
FSU
S. & C. America
Middle East
Reserves
32%
41%
8%
8%
4%
4%
3%
Production
29%
28% 11%
12%10%
4%
5%
Consumption
29%
23%
19%
13%9%
4%
3%
Source : BP Statistical Review
Proven Reserves of NG : 179.5 103 Gm3 = 169 Gtep (31.2004)Marketed Production of NG : 2691.6 Bcm (2004)
Natural Gas in the world : It’s perfect for LNG
As shown in the following graph, gas markets are highly regionalized because it is expensive to
transport natural gas over long distances. Very few intercontinental pipelines are in operation though their number is growing if we take exception of the pipelines between FSU and Algeria with Europe.
Gas flows today
Markets
LNG
Pipe
TrinidadAlgeria
W. Africa
S. E. Asia
Middle East
Australia
Additionally, it can be noticed that with respect to natural gas reserves, the Middle East, Africa and the FSU represent 81% of worldwide natural gas reserves. In terms of production however, it can be noticed that in North and South America as well as Asia Pacific regions there seems to be a balance between intra regional production and consumption of all the gas produced within regions. These regions of high and growing demand have limited reserves and this combined with the high growth rate of consumption make LNG an attractive fuel because of its transportability and the flexibility it offers.
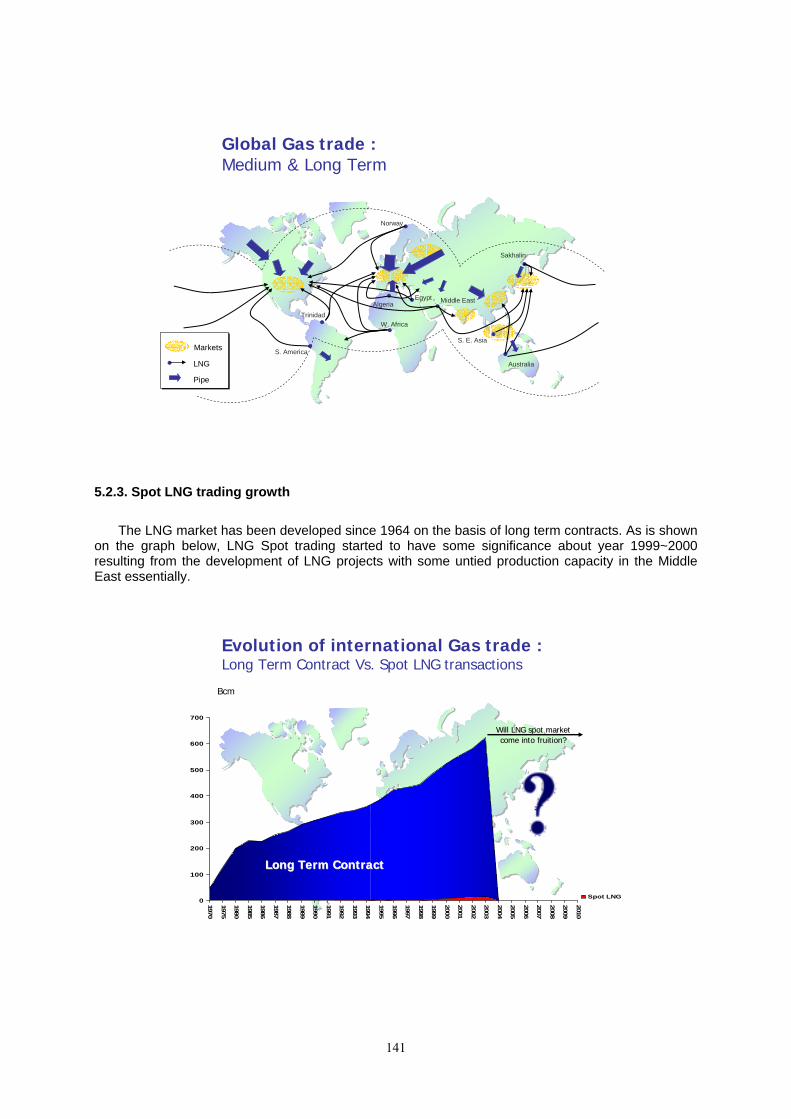
141
Global Gas trade : Medium & Long Term
Markets
LNG
Pipe
TrinidadAlgeria
W. Africa
S. E. Asia
Middle East
Australia
Norway
S. America
Sakhalin
Egypt
5.2.3. Spot LNG trading growth
The LNG market has been developed since 1964 on the basis of long term contracts. As is shown on the graph below, LNG Spot trading started to have some significance about year 1999~2000 resulting from the development of LNG projects with some untied production capacity in the Middle East essentially.
Evolution of international Gas trade :Long Term Contract Vs. Spot LNG transactions
Bcm
0
100
200
300
400
500
600
700
1970
1975
1980
1985
1986
1987
1988
1989
1990
1991
1992
1993
1994
1995
1996
1997
1998
1999
2000
2001
2002
2003
2004
2005
2006
2007
2008
2009
2010
Spot LNG
Long Term ContractLong Term Contract
Will LNG spot marketWill LNG spot marketcome into fruition?come into fruition?
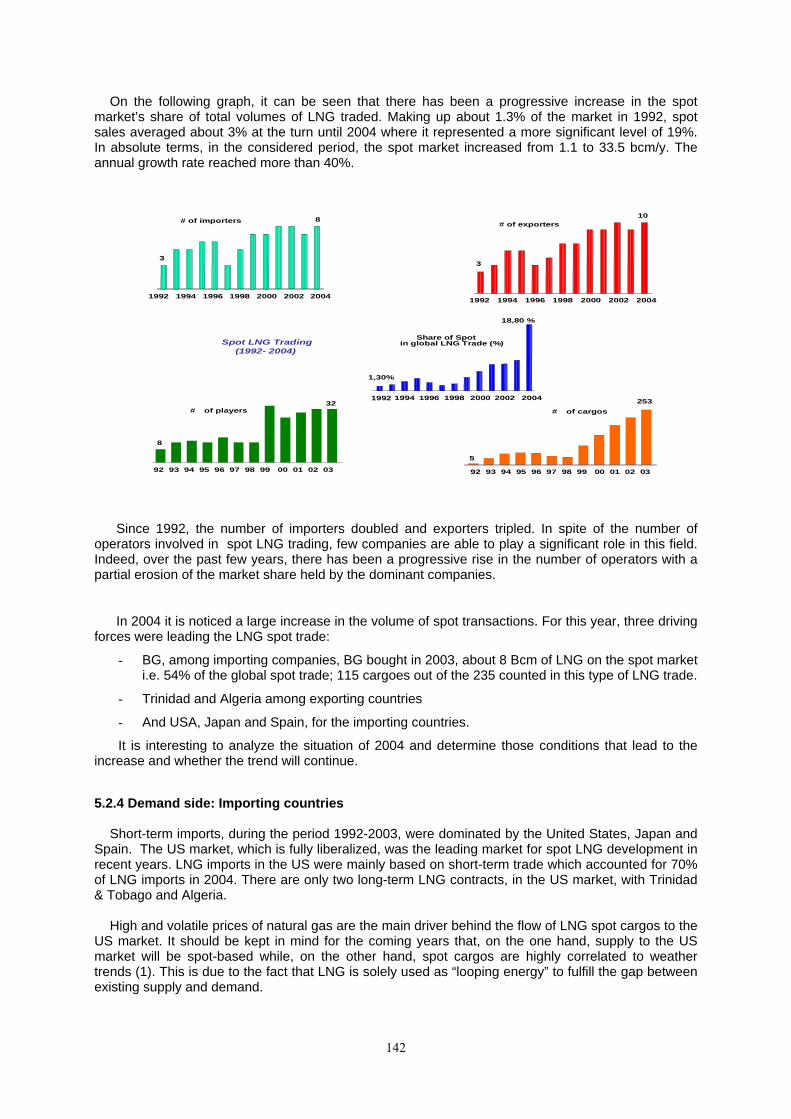
142
On the following graph, it can be seen that there has been a progressive increase in the spot market’s share of total volumes of LNG traded. Making up about 1.3% of the market in 1992, spot sales averaged about 3% at the turn until 2004 where it represented a more significant level of 19%. In absolute terms, in the considered period, the spot market increased from 1.1 to 33.5 bcm/y. The annual growth rate reached more than 40%.
Spot LNG Trading(1992- 2004)
1992 1994 1996 1998 2000 2002 2004
3
8# of importers
1992 1994 1996 1998 2000 2002 2004
3
10# of exporters
Share of Spot in global LNG Trade (%)
1,30%
18,80 %
1992 1994 1996 1998 2000 2002 2004
92 93 94 95 96 97 98 99 00 01 02 03
# of cargos
5
253# of players
8
32
92 93 94 95 96 97 98 99 00 01 02 03
Since 1992, the number of importers doubled and exporters tripled. In spite of the number of operators involved in spot LNG trading, few companies are able to play a significant role in this field. Indeed, over the past few years, there has been a progressive rise in the number of operators with a partial erosion of the market share held by the dominant companies.
In 2004 it is noticed a large increase in the volume of spot transactions. For this year, three driving forces were leading the LNG spot trade:
- BG, among importing companies, BG bought in 2003, about 8 Bcm of LNG on the spot market i.e. 54% of the global spot trade; 115 cargoes out of the 235 counted in this type of LNG trade.
- Trinidad and Algeria among exporting countries
- And USA, Japan and Spain, for the importing countries.
It is interesting to analyze the situation of 2004 and determine those conditions that lead to the increase and whether the trend will continue.
5.2.4 Demand side: Importing countries
Short-term imports, during the period 1992-2003, were dominated by the United States, Japan and Spain. The US market, which is fully liberalized, was the leading market for spot LNG development in recent years. LNG imports in the US were mainly based on short-term trade which accounted for 70% of LNG imports in 2004. There are only two long-term LNG contracts, in the US market, with Trinidad & Tobago and Algeria.
High and volatile prices of natural gas are the main driver behind the flow of LNG spot cargos to the
US market. It should be kept in mind for the coming years that, on the one hand, supply to the US market will be spot-based while, on the other hand, spot cargos are highly correlated to weather trends (1). This is due to the fact that LNG is solely used as “looping energy” to fulfill the gap between existing supply and demand.

143
Which LNG Import Countries are active in Spot Trading ?
1,1 1,62,3
3,32,3
1,6 2,1
4,7
7,6
10,8 11,4
14,8
0
2
4
6
8
10
12
14
16
1992 1993 1994 1995 1996 1997 1998 1999 2000 2001 2002 2003
Belgique Corée Espagne France Italie JaponPorto Rico Portugal Taiwan Turquie USA
BcmUS, Japan & Spain are leading the way
Asian crisis
Start of the operation of newliquefaction plants1997: Qatar Ga s1999: Niger ia LNG, At lan t ic LNG, Ras Laffan Ga s2000: Om a n LNG
Source : Based on data fromPetrostrategies
Rise in the LNG demand in Europe and North America
At present, there are four on-shore receiving LNG terminals already operating in the continental
United States, namely in Massachusetts (Everett), in Louisiana (Lake Charles), in Maryland (Cove Point reopened in 2001), and in Georgia (Elba Island reopened in 2003). The last three LNG terminals with a total capacity of 24 Bcm (17.2 Mt/y) are under expansion. The existing LNG terminals are expected to be at full capacity by 2007 (about 40 Bcm).
Several other LNG terminals are planned for North American (19 in USA, 5 in Mexico and one in Canada) with some of the terminals already approved. By 2007 Spot LNG deliveries will be constrained by available regasification capacity. Indeed, the first greenfield US LNG regasification terminals on the Gulf Coast and Energía Costa Azul (Baja California) are expected to come online by 2007 (2). 5.2.5 Supply side: Exporting countries
The leading spot LNG sellers in 2004 were Trinidad, Algeria, Qatar and Oman. For exporters, the spot sales of LNG are seen as a complement of contractual long-term trade outlets.
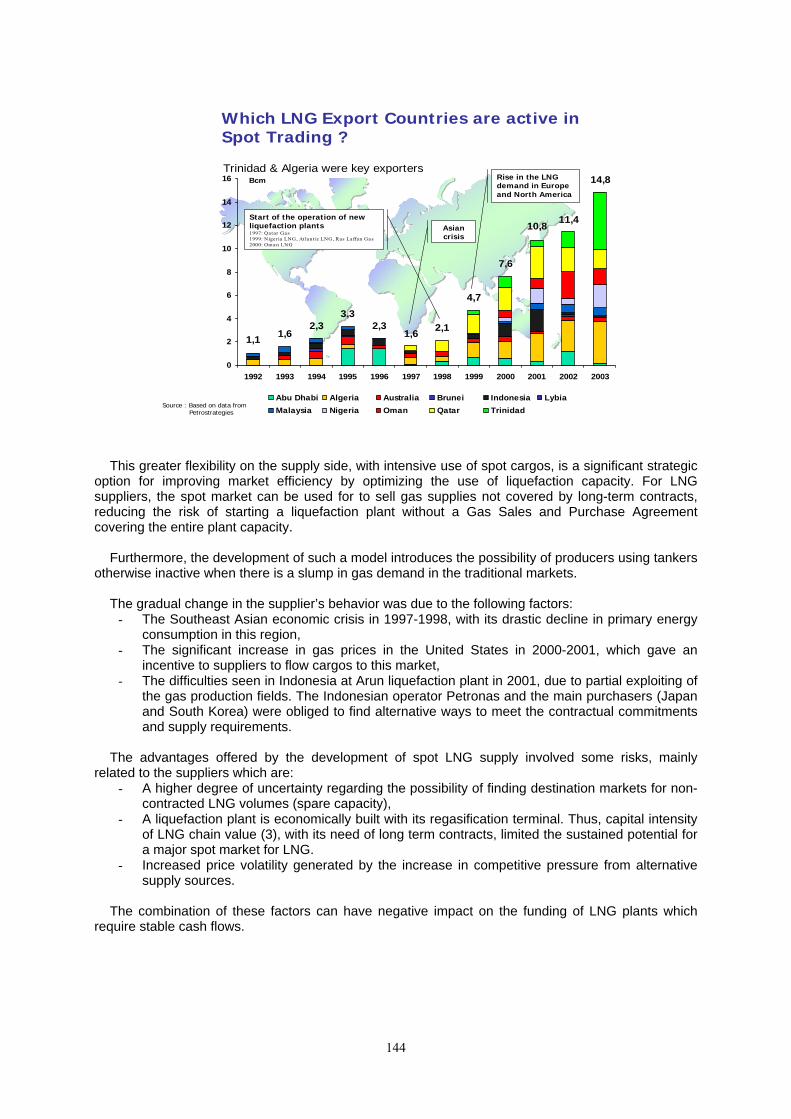
144
Which LNG Export Countries are active in Spot Trading ?
1,1 1,62,3
3,32,3
1,6 2,1
4,7
7,6
10,8 11,4
14,8
0
2
4
6
8
10
12
14
16
1992 1993 1994 1995 1996 1997 1998 1999 2000 2001 2002 2003
Abu Dhabi Algeria Australia Brunei Indonesia LybiaMalaysia Nigeria Oman Qatar Trinidad
BcmTrinidad & Algeria were key exporters
Start of the operation of newliquefaction plants1997: Qatar Ga s1999: Niger ia LNG, At lan t ic LNG, Ras Laffan Ga s2000: Om a n LNG
Source : Based on data fromPetrostrategies
Asian crisis
Rise in the LNG demand in Europe and North America
This greater flexibility on the supply side, with intensive use of spot cargos, is a significant strategic
option for improving market efficiency by optimizing the use of liquefaction capacity. For LNG suppliers, the spot market can be used for to sell gas supplies not covered by long-term contracts, reducing the risk of starting a liquefaction plant without a Gas Sales and Purchase Agreement covering the entire plant capacity.
Furthermore, the development of such a model introduces the possibility of producers using tankers
otherwise inactive when there is a slump in gas demand in the traditional markets. The gradual change in the supplier’s behavior was due to the following factors:
- The Southeast Asian economic crisis in 1997-1998, with its drastic decline in primary energy consumption in this region,
- The significant increase in gas prices in the United States in 2000-2001, which gave an incentive to suppliers to flow cargos to this market,
- The difficulties seen in Indonesia at Arun liquefaction plant in 2001, due to partial exploiting of the gas production fields. The Indonesian operator Petronas and the main purchasers (Japan and South Korea) were obliged to find alternative ways to meet the contractual commitments and supply requirements.
The advantages offered by the development of spot LNG supply involved some risks, mainly
related to the suppliers which are: - A higher degree of uncertainty regarding the possibility of finding destination markets for non-
contracted LNG volumes (spare capacity), - A liquefaction plant is economically built with its regasification terminal. Thus, capital intensity
of LNG chain value (3), with its need of long term contracts, limited the sustained potential for a major spot market for LNG.
- Increased price volatility generated by the increase in competitive pressure from alternative supply sources.
The combination of these factors can have negative impact on the funding of LNG plants which
require stable cash flows.

145
5.3. KEY DRIVERS AND CONSTRAINTS FOR THE DEVELOPMENT OF THE LNG SPOT MARKET
The statistics compiled in paragraph 5.2 show that the share of LNG traded on a short-term basis
tends to increase regularly. However, tracking the number of cargoes actually traded on a spot basis remains a challenging exercise, as those statistics cover very different types of “spot cargoes”. Examining the actual drivers of these spot transactions, their constraints and their evolution may help us better understand the future of this trade.
The development of the spot LNG market is preconditioned by
- The availability of product for spot transactions - The existence of a short term demand for LNG - The availability of the necessary logistics (shipping capacity and re-gasification capacity).
Let us first examine each of these factors and then evaluate how the global LNG market evolutions may affect them in the future. 5.3.1. The sources of LNG for spot transactions
The sources of LNG for spot transactions are:
(a) Liquefaction capacity not committed under long term contracts
This “primary source” of spot LNG includes in particular - The excess capacity resulting from capacity re-rating or de-bottlenecking.
The plant capacity guaranteed by EPC contractors usually includes some margin which cannot, at least initially, be sold on a long-term basis. A 10% margin is frequently observed. Similarly, the plant capacity can often be increased by marginal investments eliminating bottlenecks in the plants.
- The wedge quantities resulting from SPA build-ups Sales and Purchase contracts often include a build-up period of several years, in particular when the contract addresses new or developing markets. The available “wedge capacity” must then be sold on a short-term basis.
- The capacity made available by the exercise of downward allowances Traditional long-term contracts are known to be rigid, but they almost always include downward allowances for the benefit of buyers who can reduce their Annual Contract Quantities within certain limits at the time of the yearly Annual Delivery Program. Those volumes then become available for spot sales.
- The capacity available as a result of seasonality patterns While levelized off-take is often imposed in long term contracts, some include a seasonal delivery pattern which creates, for the seller, the need to find a complement market for the low season.
- The extra capacity resulting from annual program optimization - The capacity voluntarily reserved by producers for the spot market and not sold on a long-
term basis. The volumes of LNG so available for spot transactions have varied significantly in the past. The spare capacity was estimated at 17 Bcm in 2000, was reduced to 12 Bcm in 2001 due to the closing of Arun plant in Indonesia for seven months, rising back to 18 Bcm in 2002. In that year, the largest share of spare capacity was located in in the Middle East and in Africa where several important projects came on-stream. The share of plant capacity dedicated to multi-year sales contract ranged between 83% and 94%.
146
(b) Volumes initially committed to long term contracts but then released
This “secondary source” of spot LNG includes in particular - Off-spec quality LNG which needs to be re-directed, - LNG made available for spot as a result of Force Majeure (buyers facilities and/or ships,
strikes, …) - LNG voluntarily redirected to the spot market to generate a commercial margin. Until the mid-nineties, the LNG spot trade was basically supply driven, and supplied by the primary
source described above. The spot market was there to solve short-term misfits between available supply and long-term contract off-take patterns. It was perceived as a necessity rather than as an opportunity.
The secondary source of spot LNG (re-direction) was dry, as long-term contracts severely restricted re-direction of cargoes. Buyers insisted on maintaining supply security and sellers insisted on protection of their marketing position. Spot cargoes, to the extent available, were often priced at a discount. The future outlook is somewhat different as we will see in § 3.4. 5.3.2. The demand side of the spot transaction
The traditional function of the LNG spot market is also to satisfy imbalances between the actual demand on a given market and the LNG contracted on a long-term basis and delivered on this market. That includes:
- Seasonal peak demand which could not be purchased long-term (typical example is winter spot purchases in Korea – around 40 in 2004/2005 )
- Additional demand not contracted on a long-term basis because of its uncertainty (and the risk of Take or Pay attached to it)
- Long-term supplier Force Majeure event curtailing supplies
Beyond this traditional market for spot LNG, margin driven spot transactions tend to develop with their own logics and economic benefit. The penetration of LNG into more liquid markets with a growing import demand like the US and UK is perhaps the most powerful driver for the future development of spot LNG. 5.3.3. The availability of midstream logistics
The development of the LNG spot market requires surplus capacity in shipping and receiving terminals.
Shipping capacity has usually not been a bottleneck, except for limited time periods. The main reasons for this are the following:
- In many cases, ships are ordered ahead of the liquefaction projects, for scheduling or opportunistic reasons. While shipping projects are generally completed on time, liquefaction investment decisions are much more often delayed, and sometimes cancelled.
- Many ship-owners are attracted by the high growth LNG business and have entered the business on the assumption that LNG was a commodity. This resulted in a large number of speculative orders for ships which then became available for short-term transactions.
- The older fleets from the late seventies are being progressively replaced as initial long-term contracts are extended, but the scrapping of LNG ships remains very limited. Older ships may not be suitable for new long-term employment but, if their maintenance has been appropriate, they may serve shorter term trades.

147
In 2004, among 158 tankers in operation, 17 were not dedicated to long term employment.
The availability of receiving capacity is a relatively more stringent constraint for spot transactions. While terminal utilization rates remain, in general, far below theoretical maximum, the ability to receive spot cargoes on short notice is seriously constrained by scheduling constraints, storage constraints and downstream pipeline constraints. The lack of regasification capacity in the USA in 2000 was constraining the development of the US spot LNG market. Since the reopening of Elba Island and Cove Point, this obstacle was removed. In Europe, the situation is contrasted: some terminals have no spare capacity (La Spezia in Italy and Huelva in Spain), other have very limited spare capacity (like Fos sur Mer, Barcelona and Cartagena), some have significant capacity available for short term transactions (like Zeebrugge, Montoir de Bretagne and Ereglisi).

148
5.3.4. Outlook: The main factors driving a continued growth of the LNG spot market
As the LNG markets mature and become more global, the following key factors will foster an accelerated development of the LNG spot activity in the future.
The share of “liquid markets” in the overall LNG market mix increases
In our view, this is the most fundamental driver. The accelerated growth of LNG imports in the US and in the UK and the progressive integration of the European gas markets are changing radically the world LNG map. Those are very deep markets, where LNG only represents a small share of the gas consumption and where gas hubs and associated trading tools allow the gas buyers to manage their day to day price risk. Those markets can absorb large quantities of spot cargoes (subject of course to logistics), at the spot price.
They can also become a significant secondary source of spot supply as LNG contracted for the US (for instance) can be re-directed to more profitable markets elsewhere, if circumstances allow, without curtailing the US final customer who can be supplied with domestic gas.
The need for flexibility increases as a result of liberalization process
A liberalization process is underway or completed in many developed gas markets. The end of
the regional or national import monopolies has resulted in a much more diverse group of LNG buyers and has created more uncertainty for such buyers. The uncertainty now relates not only to gas demand growth, but also to the share of the demand which each buyer will control.
Faced with this uncertainty and with the take or pay risk on the supply side, buyers tend to balance their supply portfolio with fewer -long-term contracts and more short-term contracts.
The margins derived from opportunistic spot transactions increase
Regional LNG markets are priced on very different indices:
- Henry Hub in the US - NBP in the UK - Petroleum Products + spot gas prices in Continental Europe - Crude Price for Asia It can be argued that those indices are all related on a long-term basis. However, on a short-
term basis they are not, and as the volatility of each of these indices tend to increase, the potential margin generated by arbitrage and the overall profitability of the LNG trading activity increases.
LNG spot trading will play an increasingly important role in this globalizing LNG world.
The acceptability of spot LNG risk for LNG producers (and lenders) increases
While most LNG producers continue to seek long-term off-take commitments for a significant share of their capacity, keeping some of it for short-term or spot sales becomes more and more acceptable.
More buyers, more options, more transparent markets, a high energy price environment and decreasing unit costs along the chain are factors which tend to make the spot market a more acceptable option for the producers (and their lenders), at least for a reasonable portion of the capacity.
Midstream and Downstream investments will offer room for spot
LNG tankers and receiving terminals cannot be financed without a long-term contract However;
we believe that shipping and re-gasification capacity will be available for the spot LNG trade, even at a larger scale than today.
Shipping capacity: Many ships are being ordered on “speculation”, without a dedicated LNG
trade to serve. Many ships are also built in anticipation of a liquefaction project which is then

149
delayed, sometimes for years. And generally speaking, ship-owners are not risk averse players (do you mean that they are risk averse – that would make more sense).
Regas capacity: It may be difficult to site and build a new terminal. However the marginal cost of
expansion of the receiving terminals is generally very low, giving an incentive to the developer to oversize its investment.
5.3.5. Outlook: The potential impediments to the spot market development
The following are the main obstacles to the development of the spot market
LNG Quality issues
The difference of LNG quality standards on the various markets results in rigidity and makes spot transactions more difficult. It is a particular challenge for producers targeting markets both east and west of Suez.
A number of organizations are working on this inter-operability issue with a view to reduce this constraint.
Ship compatibility issues
The compatibility of ships with receiving terminals may become more problematic as the range
of ship sizes gets broader. The new standards selected by Qatar for its expansions (210,000 cbm and 260,000 cbm) certainly result in reduced unit costs. But the use of this type of vessel means less flexibility in the delivery chain until they become the new standard for all receiving facilities.
The contractual constraints
The ability for sellers and buyers to be active in the spot markets is often constrained by
contractual limitations: - On Seller’s side, by the so called “Club Rules” often included in the long-term SPAs which
give long-term buyers a first call on additional capacity which could otherwise be placed on the spot market,
- On Buyer’s side, by the destination clauses which prevent them from freely reselling on the spot market the cargoes purchased under term contracts.
The traders’ creditworthiness
For most LNG producers, dealing with long-term LNG buyers like Japanese or European utilities
remains much safer than dealing with LNG traders. In the late 1990’s, independent marketers like Enron and Dynegy emerged to participate in the trading of natural gas, electricity and other energy commodities.
These market participants increased market liquidity, selling risk management services to both producers and consumers. Many of those “asset light” players then fell into bankruptcy following the California electricity crisis in 2001 and subsequent scandals. The lesson was learned by the producers who now put much more stringent constraints on the qualification of their counterparts.
In many cases, this role is now assumed by oil & gas majors already involved in the upstream segment of the chain and who now play more often the role of market aggregators.
The volatility and the need for security
Finally, and maybe most importantly, what will limit the development of the share of spot in the
global LNG trade is LNG buyers’ need for supply security. The times where LNG spot only meant cheaper LNG are long gone. Having to call on the spot market can be very expensive, as experienced recently by Asian and Spanish buyers who had to match Henry Hub prices to supply their markets.

150
The spot market price can be higher or lower than long-term contract prices, depending on whether the market is a “sellers’ market” or a “buyers’ market”. But the impact on buyers of being LNG short can be dramatic and recent shortages have led many of them to reconsider the value of long-term supply security, a traditional value of the LNG industry which had been for awhile downgraded as a feature of the past.
The word “spot” should be used with care as the concept itself may cover many different types of
transactions. A short-term LNG market will definitely continue to develop in parallel with the traditional long-term business,- which does not appear to be on the verge of disappearing.
Beyond the traditional spot market driven by excess production capacity, the secondary spot market driven by margin opportunity, arbitrage and revenue optimization will develop significantly as the LNG markets become more global and more transparent.
What share will this spot market take in the global LNG trade? Can it become dominant and turn LNG into a real commodity? We believe it is unlikely, at least in term of volumes. An increase of the current 11% share is possible, and even likely, but the long-term contractual relationship between sellers and buyers will, in our view, remain the basis for the future LNG industry development.
However, the impact of the spot LNG market on the global LNG trade is likely to grow faster than
its strict market share. It will also deeply influence the terms and conditions of long-term contracts and the business model of long-term players. 5.4. AREA REPORT 5.4.1 Asia 5.4.1.1. Market environment
Asia is the largest LNG importing region, representing about 70% of LNG trade in the world. Japan has been a major LNG importer since the first introduction of Alaska LNG to the country in 1969. The import volume in 2003 was 79.8BCM, accounting for 47.2% of the world LNG trade. Korea and Taiwan follow Japan, by importing 26.2BCM and 7.5BCM respectively.
In this region, LNG has been traded mostly under long-term contracts. The LNG importers are
public utilities so that they have strong obligations to provide a stable supply natural gas or electric power to their customers. From the viewpoint of supply security, long-term contracts had therefore met with not only LNG producers’ needs but also the LNG importers’ needs. Japan, Korea and Taiwan heavily rely on long-term LNG contracts because of very limited indigenous natural gas production. In addition to that, the absence of international pipeline gas supply makes the three countries commit to LNG contracts over the long run.
As the energy market is gradually liberalized in Japan, competition with natural gas and other fuels
is intensifying. Thus, price considerations are becoming even more critical. The progress of market liberalization will create increased volatility in the demand for natural gas.
LNG importers in Japan have strongly asked their LNG suppliers to agree to more volume flexibility on the LNG contracts. Considering demand uncertainty, the LNG importers find it difficult to make a commitment to long-term LNG procurement.
LNG importers have sought to shorten contractual periods from 20 years or more for conventional
LNG contracts. The new contract between Malaysia LNG and Tokyo Electric/Tokyo Gas was a first signal of a change in LNG marketing in Asia, with seasonal flexibility addressed through medium-term supply contracts. Thanks to spare production capacity of LNG suppliers, a few years ago Korea Gas successfully introduced medium-term contracts which are based on less than ten years.
There is firm recognition by both LNG suppliers and importers of high demand potential in Asia.
LNG consumption increased by 7% per year for power generation during the period of 1991 to 2001. Power generation using Combined Cycle gas turbine applications is the primary driver of this growth.

151
In 2004, India, the latest new emerging LNG importer in this region, started receiving LNG at the Dahej terminal.
China will be coming next with the Guangdong project whose first phase is slated in 2006. LNG outlets on the West coast of North America will be emerging as a new importer in the Asia-Pacific basin. In October 2004, Indonesia’s Tangguh project and Russia’s Sakhalin II project reached an agreement to supply LNG to the Costa Azul terminal in Mexico.
An increase in the number of LNG importers in this region may create more opportunities for the spot LNG trading and have an impact on traditional LNG trade in Asia. 5.4.1.2. Infrastructure Capacities in the LNG Value Chain
Supply/Demand situation The LNG demand in Asia is estimated to continue increasing due to new entrants such as India
and China as well as a stable surge in imports into Japan, Korea and Taiwan. The figure below indicates the demand/supply outlook for 2010 and 2015.
The estimated demand for 2010 is 109 MT in a low case scenario and 132 MT in a high case one.
The estimate for 2015 is between 147 MT and 184 MT. LNG demand could experience double-digit growth through 2015. Supply capacities for Asia could be divided into three parts: 1) production capacities from existing LNG projects; 2) new LNG projects which have already signed Sales and Purchase Agreements or Heads of Agreements with LNG importers; and 3) potential capacity from future LNG projects which are under feasibility study.
LNG demand/supply looks well balanced at this stage. However, some of the new projects are
subject to the risk of delay of LNG delivery even though commitments have already been received from the LNG buyers. The Sakhalin II project, a new LNG supply source for Asia, has undergone revisions to the delivery schedule in light of concerns about delay in the project commencement. Once these delays become a certainty, LNG importers will have to secure additional cargoes from the spot market.
91.36 91.36 83.76
24.7224.72
26.7
78.7
109
147
184
132
84.05
0
20
40
60
80
100
120
140
160
180
200
2003 2010 2015
Million tons
LNG supply capacitiesunder feasibility study
Future supply capacitiesfrom LNG projects withSPA or HOA
Existing LNG projects'supply capacities
High case demand
Low case demand
Figure 1. LNG Demand/Supply balance in the Asian region in 2010 and 2015 Source: IEEJ

152
LNG pricing system in Asia is primarily linked with the Japanese Crude Cocktail (JCC). LNG outlets on the West coast of North America will have an impact, not only on cargo movements in this region, but also on a pricing system for spot LNG trading. In 2004, Japanese trading houses signed long-term LNG purchase agreements with Oman’s LNG suppliers.
Liquefaction capacities
Liquefaction capacities for Asian importers are reflected below:
Table1. Liquefaction capacities for Asia as of 2004 Capacity
Region Country (Million tons/y)
Main destinations
USA 1,30 Japan Brunei 7,20 Japan, Korea Indonesia 29,15 Japan, Korea, Taiwan Malaysia 22,40 Japan, Korea, Taiwan Australia 11,70 Japan, Korea
Asia-Pacific
Sub-total 71,75 Adu Dhabi 5,50 Japan, Spain Oman 6,60 Japan, Korea, Spain
Qatar 19,30 Japan, Korea, Spain, India
Middle East
Sub-total 31,40
Existing (2004)
Total 103,15 Asia-Pacific Indonesia, Russia, Aus 19,10 Asia-Pacific Middle East Oman 3,30 Europe, Asia-Pacific Signed
SPA/HOA Total 22,40
Asia-Pacific
Aus, Indonesia, Brunei,Papua New Guinea, USA, Peru, Bolivia
73,55 Asia-Pacific
Middle East Yemen, Iran 38,30 Asia-Pacific, Eupore
Under feasibility Study
Total 111,85
Total 237,40 Source: IEEJ
All of the existing capacities have been committed by Asian importers under long-term contracts.
Capacities from LNG projects which have signed SPA/HOA are also secured by long-term importers in Asia.
Regasification capacities
The following is a total of existing and future regasification capacities for LNG traded in this region.
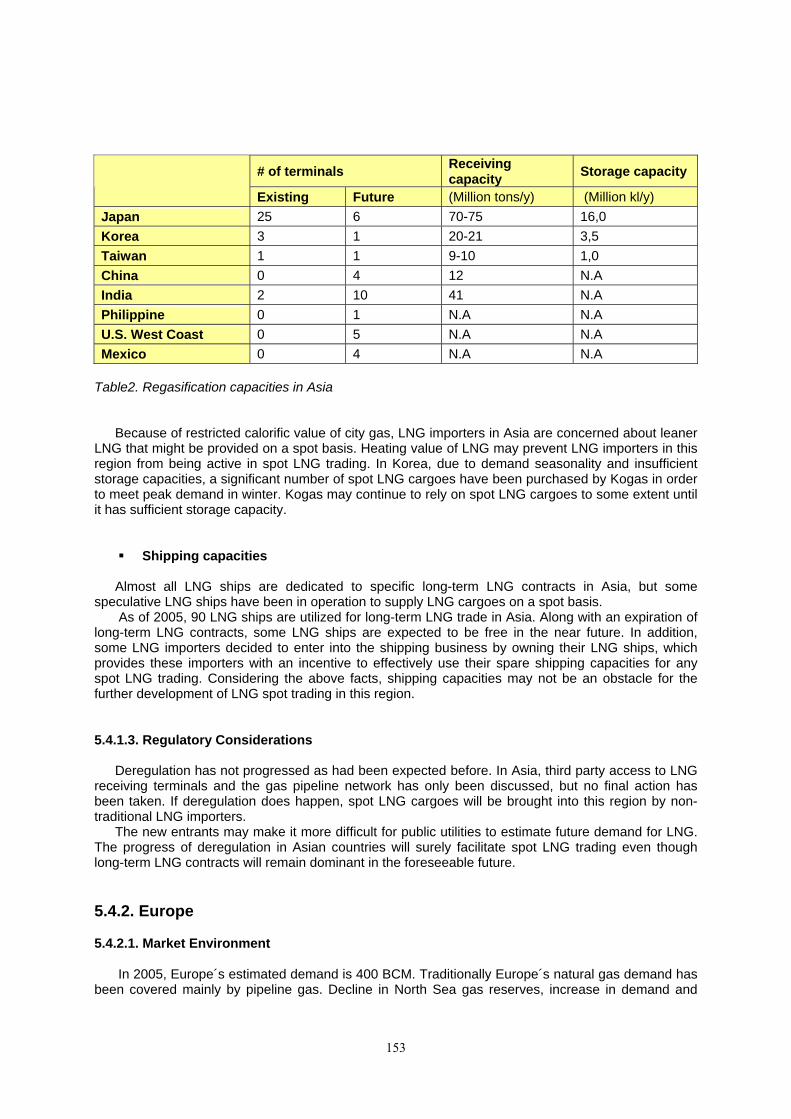
153
# of terminals Receiving capacity Storage capacity
Existing Future (Million tons/y) (Million kl/y)
Japan 25 6 70-75 16,0 Korea 3 1 20-21 3,5 Taiwan 1 1 9-10 1,0 China 0 4 12 N.A India 2 10 41 N.A Philippine 0 1 N.A N.A U.S. West Coast 0 5 N.A N.A Mexico 0 4 N.A N.A
Table2. Regasification capacities in Asia
Because of restricted calorific value of city gas, LNG importers in Asia are concerned about leaner
LNG that might be provided on a spot basis. Heating value of LNG may prevent LNG importers in this region from being active in spot LNG trading. In Korea, due to demand seasonality and insufficient storage capacities, a significant number of spot LNG cargoes have been purchased by Kogas in order to meet peak demand in winter. Kogas may continue to rely on spot LNG cargoes to some extent until it has sufficient storage capacity.
Shipping capacities
Almost all LNG ships are dedicated to specific long-term LNG contracts in Asia, but some speculative LNG ships have been in operation to supply LNG cargoes on a spot basis.
As of 2005, 90 LNG ships are utilized for long-term LNG trade in Asia. Along with an expiration of long-term LNG contracts, some LNG ships are expected to be free in the near future. In addition, some LNG importers decided to enter into the shipping business by owning their LNG ships, which provides these importers with an incentive to effectively use their spare shipping capacities for any spot LNG trading. Considering the above facts, shipping capacities may not be an obstacle for the further development of LNG spot trading in this region. 5.4.1.3. Regulatory Considerations
Deregulation has not progressed as had been expected before. In Asia, third party access to LNG receiving terminals and the gas pipeline network has only been discussed, but no final action has been taken. If deregulation does happen, spot LNG cargoes will be brought into this region by non-traditional LNG importers.
The new entrants may make it more difficult for public utilities to estimate future demand for LNG. The progress of deregulation in Asian countries will surely facilitate spot LNG trading even though long-term LNG contracts will remain dominant in the foreseeable future. 5.4.2. Europe 5.4.2.1. Market Environment In 2005, Europe´s estimated demand is 400 BCM. Traditionally Europe´s natural gas demand has been covered mainly by pipeline gas. Decline in North Sea gas reserves, increase in demand and

154
production cost and deregulation of European gas and electricity markets have all combined to create new opportunities for LNG. In 2004, LNG represented 16% of natural gas in Europe. It is expected to increase to 25% in 2009. Main suppliers are from North Africa. New suppliers from the Atlantic, Middle East and Central Asia are likely to tap the European market, reducing dependence on a single region. Considering global LNG trade, in 2004 Europe imported about 23% (Spain accounting for 10%). LNG brings to the European market flexibility and reliability of supply, contributes to diversification of gas supply and energy security, and enhances competition. Incremental LNG flows should complement large, long-term flows in case of a temporary tightness in the market. Traditional LNG contracts were focused on security of supply for the buyer and investment retribution for the seller:
• Long-Term Period. • Take or Pay Conditions. • Destination Clause. • Profit Sharing Mechanism. • Price related to Brent and Oil Products.
Those characteristics can be summarized as a lack of flexibility for buyers. Costs of liquefaction, shipping, and regasification have declined over time, lowering costs to producers. Since the LNG market is primarily driven by long-term contracts with pricing mechanisms pegged to petroleum products, lower operating costs do not necessarily translate into lower LNG prices, at least in the short term. At present, the European market is undergoing structural changes resulting from the liberalization process that is taking place. Liberalization policies are based on two factors:
• Creation of a level playing field for new entrants through the principle of third party access.
• Development of a competitive environment. Examples of current status are:
• UK: Market completely liberalized since 1998, high competition. • Belgium: Market completely liberalized in Flanders since 2003, competition limited
(dominated by Distrigas). • Italy: Market completely liberalized since 2003, competition still limited (dominated
by ENI). • Spain: All Customers can choose supplier since 2004.
5.4.2.2. Infrastructure Capacities in LNG Value Chain
Liquefaction Capacities Table 1 shows the liquefaction plants used as a supply source for Europe.
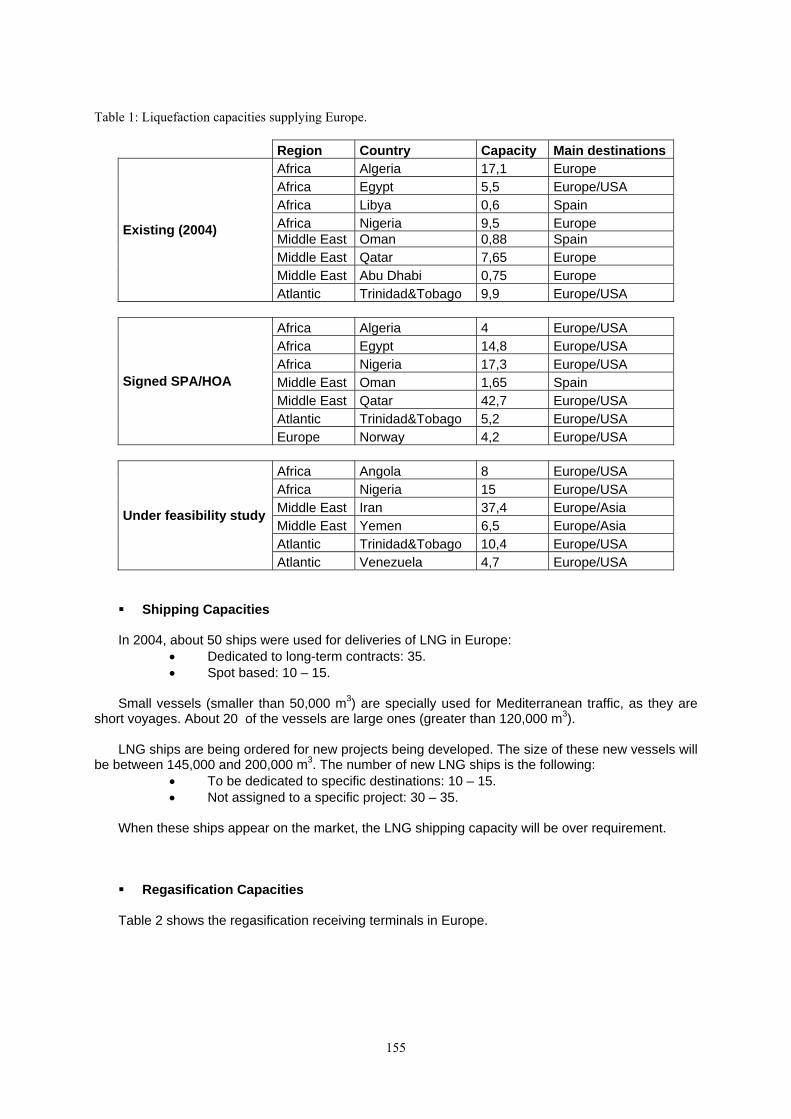
155
Table 1: Liquefaction capacities supplying Europe.
Region Country Capacity Main destinations Africa Algeria 17,1 Europe Africa Egypt 5,5 Europe/USA Africa Libya 0,6 Spain Africa Nigeria 9,5 Europe Middle East Oman 0,88 Spain Middle East Qatar 7,65 Europe Middle East Abu Dhabi 0,75 Europe
Existing (2004)
Atlantic Trinidad&Tobago 9,9 Europe/USA
Africa Algeria 4 Europe/USA Africa Egypt 14,8 Europe/USA Africa Nigeria 17,3 Europe/USA Middle East Oman 1,65 Spain Middle East Qatar 42,7 Europe/USA Atlantic Trinidad&Tobago 5,2 Europe/USA
Signed SPA/HOA
Europe Norway 4,2 Europe/USA
Africa Angola 8 Europe/USA Africa Nigeria 15 Europe/USA Middle East Iran 37,4 Europe/Asia Middle East Yemen 6,5 Europe/Asia Atlantic Trinidad&Tobago 10,4 Europe/USA
Under feasibility study
Atlantic Venezuela 4,7 Europe/USA
Shipping Capacities In 2004, about 50 ships were used for deliveries of LNG in Europe:
• Dedicated to long-term contracts: 35. • Spot based: 10 – 15.
Small vessels (smaller than 50,000 m3) are specially used for Mediterranean traffic, as they are short voyages. About 20 of the vessels are large ones (greater than 120,000 m3). LNG ships are being ordered for new projects being developed. The size of these new vessels will be between 145,000 and 200,000 m3. The number of new LNG ships is the following:
• To be dedicated to specific destinations: 10 – 15. • Not assigned to a specific project: 30 – 35.
When these ships appear on the market, the LNG shipping capacity will be over requirement.
Regasification Capacities Table 2 shows the regasification receiving terminals in Europe.

156
Table 2: Refasification Capacities in Europe. Terminals Receiving Capacity
Existing Future (Mton/y) Belgium 1 3,35 - 10,1 France 2 1 11,2 - 24,85 Greece 1 1,5 - 3,36 Italy 2 3 5 - 31,9 Portugal 1 3,88 - 6,34 Spain 4 2 32 - 35,2 Turkey 1 1 4,6 - 9,1 United Kingdom 1 2 3,3 - 32,3
5.4.2.3. Regulatory Considerations Changes in the LNG market have trended towards increased flexibility.
• Loosening terms on both price and volume. • Shorter periods of time (helped by flexibility in LNG shipping). • Short-term contracts and spot purchases cover peaks in demand. • Loosening destination clause: the European Union is negotiating with producers to
state Europe as an only [??] destination without differentiating between the countries inside it.
• Changes in LNG Pricing Structure • Price related to the final market • LNG is starting to be linked to natural gas spot and futures market prices. New
indices considered are: NBP, Zeebrugge and NYMEX. LNG will raise its market share in Europe. New liquefaction projects will enter into operation. Spot volumes available will increase and price will be the key factor for their assignment to final customers. LNG spot trading will take a growing share, even when long-term contracts will remain dominant. New players will emerge, pushing their way onto the market, leading to more intense competition among suppliers and putting pressure on margins. Buyers and sellers will take on new roles:
• Buyers investing in the upstream, including liquefaction plants. • Traditional Sellers leasing capacity at terminals and extending their role into trading. • Buyer to Buyer deals taking place.
Gas “hubs” involving both LNG and pipeline gas will be developed in Belgium, and the United Kingdom, presenting opportunities for price arbitrage and eventual convergence of price. Lack of enough liquidity has limited its use until now. Prices in different markets will converge as a consequence of the competition between buyers leading to LNG market globalization. An international price reference will emerge. The existence of an organized market and sufficient level of liquidity are conditions to make an international price reference.
5.4.3 USA

157
5.4.3.1. Market Environment While LNG today accounts for a relatively small component of the total supply picture there are
predictions that this will rise dramatically, to over one-fourth of total supply, as existing import terminals are expanded and new ones come on-line. The confluence of the emerging trends of increased demand for natural gas, declining production from mature indigenous supply basins, and declining costs along the LNG value chain has given rise to the growth of LNG.
As a result, there has been a flurry of proposals to build receiving terminals and record levels of imports set in 2003 and 2004, with supplies coming from seven countries, Trinidad serving as the leading supplier.
The North American natural gas market today is characterized by strong and growing demand from over 68 million customers, an extensive pipeline grid with numerous options for transportation and trading, and dwindling domestic supplies. Natural gas accounts for about one-fourth of the energy use in the U.S. and consumption is forecast to increase 40% by 2025. About 84% of gas used in the U.S. is produced in the U.S., with 13% coming from Canada and only 3% delivered as LNG, most of which is delivered pursuant to short-term contracts.
Lower 48 production will continue to dominate the supply picture and record price levels have set in motion record rates of drilling rigs directed at natural gas formations. While significant resources remain in place throughout North America, there are often numerous roadblocks in the way that prevent access and development. Exports from Canada are expected to decline and Alaskan gas remains stranded until a pipeline is constructed. Thus, there is a great deal of excitement about the role that LNG can play in filling the looming supply gap.
5.4.3.2. Infrastructure Capacities the LNG Value Chain
A great deal of the current excitement centers around the numerous proposals for regas in the
U.S. With the proposed expansion of the four existing import terminals in the lower-48 and over 50 projects on the drawing board (see project map below) there is no shortage of ideas and concepts, including proposals for facilities onshore (using private lands, public lands and even sovereign Indian lands), offshore and floating. While many of these projects are backed by solid players and represent commercially viable options, the market is sure to weed out the fatal flaws of the weak and inferior business models.
There are signs that the talk about LNG is beginning to match the reality. The first new terminal in over 20 years went into operation in March of 2005. Excelerate’s Energy Bridge was the first to cross the finish line due, in large measure, to the fact that this technology is able to overcome NIMBY (not in my backyard) concerns by keeping the terminal out of sight and out of mind. The U.S. presently has 117 LNG related infrastructure facilities which is more than any other country in the world. LNG facilities can be used for baseload, providing long, steady supply of LNG to customers. However, they can also be used to meet system peaks. U.S. gas utilities use LNG extensively for “peak-shaving” with facilities located near population centers. Peak-shaving LNG facilities liquefy and store natural gas in the summer for eventual regasification during the coldest days of winter and have been constructed for use by local utilities.

158
The storage tank volume in these facilities can be very large, capable of storing up to 4 Bcf of natural gas equivalent. LNG has been utilized for peak-shaving in the U.S. for more than 60 years.
5.4.3.3. Regulatory Considerations
Regulatory changes have been a key driver of the growth in LNG projects. In the U.S. the LNG
industry was given a jump-start with some policy changes concerning the regulatory treatment of new terminals. In its Hackberry decision – December 22, 2002, the Federal Energy Regulatory Commission (FERC) took a bold step by removing the open access and open season requirements for new onshore LNG terminals and the need for regulated cost of service rates.
While the Regas terminal is still considered the weak link in the delivery chain, this policy shift gave the much needed assurance to project sponsors that their substantial investment would not be subject to unacceptable levels of regulatory risk. FERC is also in the process of addressing the looming issues surrounding gas quality including “interchangeability” which refers to a measure of the degree to which the combustion characteristics of vaporized LNG are the same as those of domestic pipeline gas. While there are various proceedings where these issues are in the process of being addressed, there was also an industry collaborative effort where the LNG industry worked with other segments of the natural gas industry and regulators to try and identify and resolve the technical issues surrounding gas quality prior to adoption of new regulations on either a system by system or generic basis.
The energy bill recently passed by Congress and signed by the President includes provisions favorable to the development of LNG infrastructure. With respect to LNG the energy bill attempts to resolve the jurisdictional uncertainty over terminal siting stemming from a lawsuit pending in the Court of Appeals over the terminal proposed for Long Beach California by Sound Energy Solutions.
2
2
CONSTRUCTED A. Everett, MA : 1.035 Bcfd (Tractebel - DOMAC) B. Cove Point, MD : 1.0 Bcfd (Dominion - Cove Point LNG) C. Elba Island, GA : 0.68 Bcfd (El Paso - Southern LNG) D. Lake Charles, LA : 1.0 Bcfd (Southern Union - Trunkline LNG) E. Gulf of Mexico: 0.5 Bcfd, (Gulf Gateway Energy Bridge - Excelerat e Energy) APPROVED BY FERC 1. Lake Charles, LA: 1.1 Bcfd (Southern Union - Trunkline LNG) 2. Hackberry, LA : 1.5 Bcfd, (Sempra Energy) 3. Bahamas : 0.84 Bcfd, (AES Ocean Express)* 4. Bahamas : 0.83 Bcfd, (Calypso Tractebel)* 5. Freeport, TX : 1.5 Bcfd, (Cheniere/Freeport LNG Dev.) 6. Sabine, LA : 2.6 Bcfd (Cheniere LNG) 7. Elba Island, GA: 0.54 Bcfd (El Paso - Southern LNG) 8. Corpus Christi, TX: 2.6 Bcfd, (Cheniere LNG) APPROVED BY M ARAD/COAST GUARD 9. Port Pel ican: 1.6 Bcfd, (Chevron Texaco) 10. Louisiana Offshore : 1.0 Bcfd (Gulf Landing - Shell) PROPOSED TO FERC 11. Fall River, MA : 0.8 Bcfd, (Weaver's Cove Energy/Hess LNG) 12. Long Beach, CA : 0.7 Bcfd, (Mitsubishi/ConocoPhillips - Sound Energy Solutions) 13. Corpus Christi, TX : 1.0 Bcfd (Vista Del Sol - ExxonMobil) 14. Sabine, TX : 1.0 Bcfd (Golden Pass - ExxonMobil) 15. Logan Township, NJ : 1.2 Bcfd (Crown Landing LNG - BP) 16. Bahamas : 0.5 Bcfd, (Seafarer - El Paso/FPL ) 17. Corpus Christi, TX: 1.0 Bcfd (Ingleside Energy - Occidental Energy Ventures) 18. Providence, RI : 0.5 Bcfd (Keyspan & BG LNG) 19. Port Arthur, TX: 1.5 Bcfd (Sempra) 20. Cove Point, MD : 0.8 Bcfd (Dominion) 21. LI Sound, NY: 1.0 Bcfd (Broadwater Energy - TransCanada/Shell) 22. Pascagoula, MS: 1.0 Bcfd (Gulf LNG Energy LLC) 23. Bradwood, OR: 1.0 Bcfd (Northern Star LNG - Northern Star Natural Gas LLC) 24. Pascagoula, MS: 1.3 Bcfd (Casotte Landing - ChevronTexaco) 25. Cameron, LA: 3.3 Bcfd (Creole Trail LNG - Cheniere LNG) 26. Port Lavaca, TX: 1.0 Bcfd (Calhoun LNG - Gulf Coast LNG Partners) PROPOSED TO MARAD/COAST GUARD 27. California Offshore: 1.5 Bcfd (Cabrillo Port - BHP Billiton) 28. So. California Offshore : 0.5 Bcfd, (Crystal Energy) 29. Louisiana Offshore : 1.0 Bcfd (Main Pass McMoRan Exp.) 30. Gulf of Mexico: 1.0 Bcfd (Compass Port - ConocoPhillips) 31. Gulf of Mexico: 2.8 Bcfd (Pearl Crossing - ExxonMobil) 32. Gulf of Mexico: 1.5 Bcfd (Beacon Port Clean Energy Terminal - ConocoPhillips) POTENTIAL SITES IDENTIFIED BY PROJECT SPONSORS 33. Coos Bay, OR: 0.13 Bcfd, (Energy Projects Development) 34. Somerset, MA: 0.65 Bcfd (Somerset LNG) 35. California - Offshore: 0.75 Bcfd, (Chevron Texaco) 36. Pleasant Point, ME : 0.5 Bcf/d (Quoddy Bay, LLC) 37. St. Hele ns, OR: 0.7 Bcfd (Port Westward LNG LLC) 38. Offshore Boston, MA: 0.8 Bcfd (Northeast Gateway - Excelerate Energy) 39. Galveston, TX: 1.2 Bcfd (Pelican Island - BP) 40. Philadelphia, PA: 0.6 Bcfd (Freedom Energy Center - PGW) 41. Astoria, OR: 1.0 Bcfd (Skipanon LNG - Calpine) 42. Freeport, TX: 1.5 Bcfd, (Cheniere/Freeport LNG Dev. - Expansion) 43. Offshore Boston, MA: 0.4 Bcfd (Neptune LNG - Tractebel) CANADIAN APPROVED AND POTENTIAL TERMINALS 44. St. John, NB : 1.0 Bcfd, (Canaport - Irving Oil) 45. Point Tupper, NS 1.0 Bcf/d (Bear Head LNG - Anadarko) 46. Quebec City, QC : 0.5 Bcfd (Project Rabaska - Enbridge/Gaz Met/Gaz de France) 47. Rivière-du- Loup, QC: 0.5 Bcfd (Cacouna Energy - TransCanada/PetroCanada) 48. Kitimat, BC: 0.61 Bcfd (Galveston LNG) 49. Prince Rupert, BC: 0.30 Bcfd (WestPac Terminals) 50. Goldboro, NS 1.0 Bcfd (Keltic Petrochemicals) MEXICAN APPROVED AND POTENTIAL TERMINALS 51. Altamira, Tamulipas : 0.7 Bcfd, (Shell/Total/Mitsui)** 52. Baja California, MX : 1.0 Bcfd, (Sempra & Shell)** 53. Baja California - Offshore : 1.4 Bcfd, (Chevron Texaco) 54. Lázaro Cárdenas, MX : 0.5 Bcfd (Tractebel/Repsol) 55. Puerto Libert ad, MX: 1.3 Bcfd (Sonora Pacific LNG)
Existing, Proposed and Potential North American
LNG Terminals
As of April 14, 2005
FERC
Office of Energy Projects
A
3 4
4
1
5
8
21
2
2
44
3
5
1
55
1
B
3
3
1
2
4
31
5
US Jurisdiction FERC US Coast Guard
44
* US pipeline approved; LNG terminal pending in Bahamas ** These projects have been approved by the Mexican and Canadian authorities
5
2
1 3241
2
4
7C
2D
11 339
5 41
6
3
4323
E
159
The California PUC had attempted to assert jurisdiction over the facility while the Federal Energy Regulatory Commission claimed exclusive jurisdiction pursuant to Section 3 of the Natural Gas Act. The energy bill designates FERC as the lead agency for siting of onshore terminals.
This should provide LNG project developers with greater regulatory certainty going forward and help speed the pace of development. The energy bill also codified FERC’s Hackberry decision which provides further assurance that new terminals can be used on a proprietary basis and not be made subject to open access rules and regulations.
5.5. CONCLUSION
The market share of spot trade in LNG accounted for 18.8% in 2004. It showed a very exciting growth rate comparing with 8.7% in 2003. Nevertheless, the 20 -25year long-term contracts still comprises a majority of the LNG market.
There are different factors that produce the growth in spot demand in the various market regions of
Asia, Europe and the USA. However we have sought to examine in this report not only the quantity but the role of LNG spot trade in LNG market
The conditions that might lead to accelerated development of the LNG spot market are as follows:
The share of “liquid markets” in the overall LNG market mix increases
The need for flexibility increases as a result of the liberalization process
The margins derived from opportunistic spot transactions increase
The acceptability of spot LNG risk for LNG producers (and lenders) increases
Midstream and downstream investments will offer room for spot
Next, those factors that might constrain the development of the LNG spot market are as follows:
LNG Quality issues
Ship compatibility issues
Contractual constraints
Traders’ creditworthiness
Market volatility and the need for security
As a matter of course, these conditions will have a different impact according the nuances of the various regional markets. However we can observe that there is a trend for the LNG spot price to be unified with the Henry Hub gas price in the LNG market. Therefore, going forward we need to pay even closer attention to the role of LNG spot trade
This report should be considered a first step in examining the scope and role of the LNG spot
market within the broader markets for LNG and natural gas. It is our hope that additional research and examination on the topic will be forthcoming in the next Triennium.
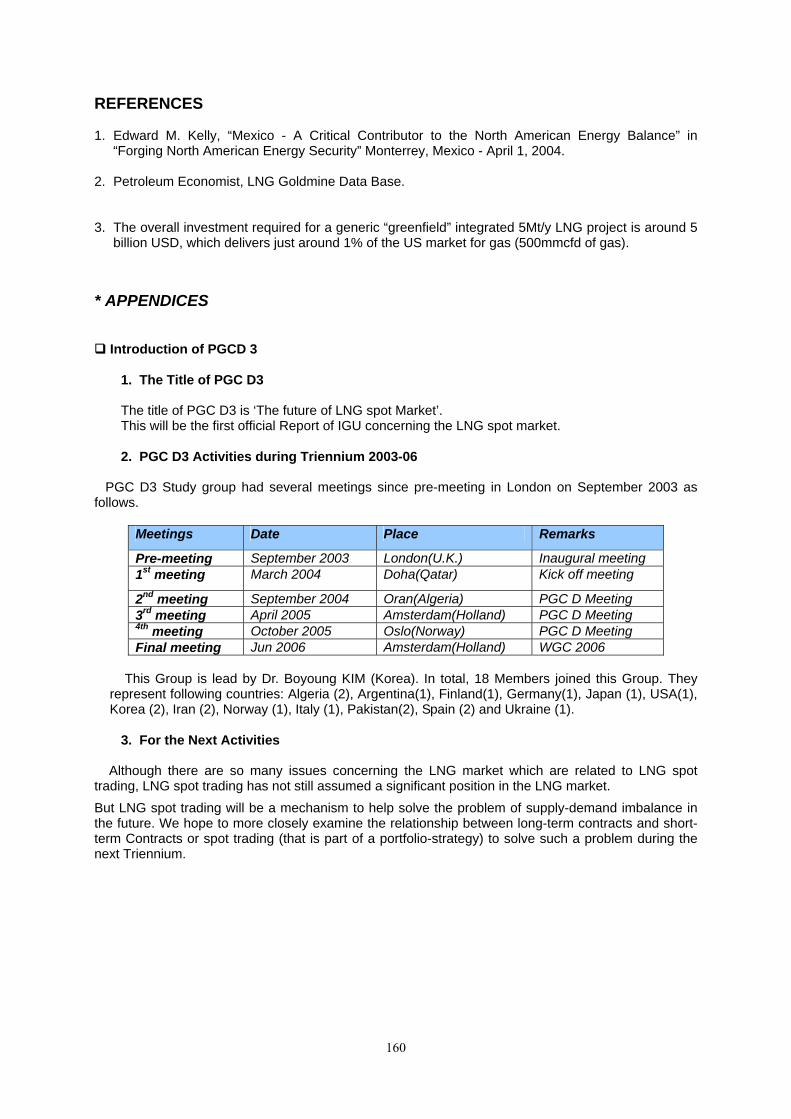
160
REFERENCES
1. Edward M. Kelly, “Mexico - A Critical Contributor to the North American Energy Balance” in “Forging North American Energy Security” Monterrey, Mexico - April 1, 2004.
2. Petroleum Economist, LNG Goldmine Data Base. 3. The overall investment required for a generic “greenfield” integrated 5Mt/y LNG project is around 5
billion USD, which delivers just around 1% of the US market for gas (500mmcfd of gas). * APPENDICES
Introduction of PGCD 3
1. The Title of PGC D3 The title of PGC D3 is ‘The future of LNG spot Market’. This will be the first official Report of IGU concerning the LNG spot market.
2. PGC D3 Activities during Triennium 2003-06
PGC D3 Study group had several meetings since pre-meeting in London on September 2003 as follows.
Meetings Date Place Remarks
Pre-meeting September 2003 London(U.K.) Inaugural meeting 1st meeting March 2004 Doha(Qatar) Kick off meeting
2nd meeting September 2004 Oran(Algeria) PGC D Meeting 3rd meeting April 2005 Amsterdam(Holland) PGC D Meeting 4th meeting October 2005 Oslo(Norway) PGC D Meeting Final meeting Jun 2006 Amsterdam(Holland) WGC 2006
This Group is lead by Dr. Boyoung KIM (Korea). In total, 18 Members joined this Group. They
represent following countries: Algeria (2), Argentina(1), Finland(1), Germany(1), Japan (1), USA(1), Korea (2), Iran (2), Norway (1), Italy (1), Pakistan(2), Spain (2) and Ukraine (1).
3. For the Next Activities
Although there are so many issues concerning the LNG market which are related to LNG spot trading, LNG spot trading has not still assumed a significant position in the LNG market. But LNG spot trading will be a mechanism to help solve the problem of supply-demand imbalance in the future. We hope to more closely examine the relationship between long-term contracts and short-term Contracts or spot trading (that is part of a portfolio-strategy) to solve such a problem during the next Triennium.

161
6. ACNOWLEDGMENTS
The Management team of PGC D wishes to thank all the active Members of the Committee for the efforts performed during this triennium. These efforts match the extraordinary growth of the LNG industry world wide. Particular thanks are directed to those invited members experts and specialists who have contributed greatly to the quality of the work performed between 2003-2006,
Special thanks should also go to the organizations that kindly invited PGC D to host its meetings
in the various countries visited during the triennium, namely the Japan Gas Association, the Algerian Association of Gas Industry, the Dutch Gas Association, the Norwegian Gas Association, the French Gas Association, as well as to Qatar’s QGPC, Gasunie, Total, Höegh LNG, Statoil, Norsk Hydro ASA Shell Global Solutions and Sonatrach. It is this support that has contributed to the success of the meetings held during this triennium combining work and local as well as technical visits.

162
ANNEX A TRIENNIAL WORK PROGRAM
PROGRAMME COMMITTEE D : LNG
LNG as a form of energy is presently seeing much renewed interest in the world and this will be an ongoing trend for the coming years as natural gas is more and more appreciated for its environment friendly quality.
While it is widely accepted that the growth in the demand for gas exceeds that for other sources of energy, LNG is expected to have a share in the satisfaction of these needs and can contribute greatly to the enlargement of the gas markets simply because it offers the flexibility required for energy storage for transportation as well as for international trading. PGC D will, as part of its activities in this triennium, continue to monitor the LNG business by issuing a report, which will provide statistics as well as highlight the trends of the LNG trade to which both the traditional actors (exporters and importers) and the new ones will contribute. This report will also address LNG Chain developments providing an update on perspectives in the future but also the share of inter-regional trading.
In this respect, PGC D has set itself the task of attracting old and new actors to participate or take an active role in the IGU activities. PGCD will also, throughout the triennium, monitor and support the activities of the Working Committees 1-5 as well as those of the other Programme Committees by providing the necessary expertise in the field of LNG.
PGC D was assigned a major task in order to rationalise the LNG activities of IGU in cooperation with the other international LNG organisations. PGCD will during this triennium contact will identify all those which are susceptible to cover the LNG field in some way and attempt to define together with them an understanding of cooperation, coordination and exchange of information on important studies and research.
In this respect, PGCD will establish contact with organisations such as the LNG-x Conferences, its two other Sponsors, the Gas Technology Institute (GTI) and the International Institute of Refrigeration (IIR), the International Group of Liquefied Natural Gas Importers (GIIGNL), the Society of International Gas Tanker and Terminal Operators (SIGTTO), the International LNG Alliance (ILNGA), the World Energy Council (WEC), the International Association of Natural Gas Vehicles (IANGNV) and any other organisation identified which may be covering an area of the LNG Industry. A part from establishing closer links with these organisations, PGC D will attempt at combining meetings, at using the same individuals and at offering the possibility for these organisations to participate in the LNG activities in the Study Groups or during the World Gas Conference, the goal to be achieved being enhanced coordination of the respective LNG activities and projects and avoidance of work duplication.
PGC D will also perform, during this triennium, studies on LNG topics of interest to IGU Members. After a large consultation of the IGU Members, taking into account the strategic guidelines set out for 2003-2006, the following three topics have been selected to be studied during this triennium. S.G. D.1: THE STANDARDISATION OF LNG QUALITIES
This topic deals about the need to challenge the narrow requirements on LNG quality, that is to say to look at the possibility of the definition of a standard LNG trade quality to avoid unnecessary
163
and expensive processing at the LNG export and import ends, and thus promote LNG trading flexibility and lower LNG costs. S.G. D.2: Safety and Technology Developments in LNG Terminals and Vessels
The development of new LNG import and export terminals and LNG vessels meets many environmental hurdles not least the perceived high safety and security risk. Criteria differ from one country to another. The efficiency improvements and development in LNG vessels technology and terminal concepts, including very large vessels and offshore regasification terminals, are moving the industry into the future. The study aims to remove undue safety risk perceptions and support implementation of new technology by the industry. S.G. D.3: The future of LNG Spot Market
There is a definite trend towards the development of spot and short term trading of LNG. Apart from analysing the recent development of this market, the role of this market in the energy balance, the future trends, the conditions and limits of its development will be analysed. Approved by Members at 1st PGC D Meeting London 11 September 2003. Dr. Chawki Mohamed RAHAL, Chairman Programme Committee D, Director General, Sonatrach Petroleum Corporation, Algeria.

164
ANNEX B B.1. ORGANISATION OF PGC D
International Gas U
nion (IGU
) International G
as Union (IG
U) -- U
nion Internationale de lU
nion Internationale de l ’’ Industrie du Gaz (U
IIG)
Industrie du Gaz (U
IIG)
Program C
omm
ittee D: LN
G
Program C
omm
ittee D: LN
G ––
Com
itC
omit éé
Programm
e Program
me D
: GN
L (PGC
D); Triennium
D
: GN
L (PGC
D); Triennium
--TriennatTriennat 2003
2003 -- 20062006
PGC
D O
RG
AN
ISATIO
N C
HA
RT
PGC
D O
RG
AN
ISATIO
N C
HA
RT
UCH
INO
SeiichiP
GC D Vice C
hairman
Japan
Dr TALEB
Moham
med
PGC
D SecretaryA
lgeria
Dr. M
ANS
FIELD ChristopherUK
SJO
EN Karl
Norw
ay
KAIJANSIN
KKO
JukkaFinland
SWEET David
USA
GR
ANLI O
ttoN
orway
CAR
IBOTTI P
iero LuigiItaly
OLIVIER
PhilipB
elgium
HO
SA
NSK
I Jean Marc
France
NOG
UG
HI Eiji
Japan
JOS
TEN Martin
BP
-U.K.
TAFF Peter
UK
SH
ARIFI Ahm
ad RezaIran
AO
UAD
ENE B
oualemAlgeria
DJELLAS Nasreddine
Algeria
BERG
AMAS
HI PaoloItaly
AL-THAN
I HassanQ
atar
AL-ISSA M
ajidQ
atar
DO
MNICK A
ndreasThe Netherlands
DA
M W
inThe Netherlands
KLEIN
NAG
ELVO
OR
T Rob
SG
D 1 JobleaderThe Netherlands
BEN
MO
SBA
H Toufik
Qatar
SWEET David
US
A
LOP
EZ ZURITA
Juan Manuel
Spain
Ms O
RS
TEIN UnnN
orway
MA
NGIA CarloItaly
KIM
Young UngK
orea
Dr HO
NG
SeonghoK
orea
KLEIN NA
GELVO
OR
T Rob
The Netherlands
HO
LLYOA
K JohnB
P -U.K.
WEI ZhouC
hina
HASSA
NI M
asoudIran
SATO
TakehitoJapan
TAND
JAO
UI Mourad
Algeria
CH
OULAI-C
HEIK Mansour
Algeria
MacHA
RDY
James
UK
DA
HM
GA
ZZOLA
Ricardo
Italy
DH
ELLEMM
ES JacquesFrance
LARS
EN Bruno O
ysteinS
G D 2 Jobleader
Norw
ay
LAN
GE Eberhard
Ruhrgas-Germ
any
Ms FERN
AN
DEZ Angélica
Argentina
LOG
ATSKI V
ictorU
kraine
SWEET David
USA
KAIJA
NSIN
KKO
JukkaFinland
THO
MAS
SEN S
teinarNorw
ay
KIM Keym
anKorea
HAJ K
ADDO
UR Arslen
Italy
GO
NZA
LEZ SAN
TOS
AlbertoSpain
RAM
EZAN
I AzizollahIran
BAN
B. M
ohomm
adIran
MA
ZARI B
OU
FAR
ES M
ohamed
Algeria
ARA
BI FethiA
lgeria
OK
ADA
Tomoo
Japan
PIRACH
A SaleemPakistan
Dr K
IM Bo Young
SG
D 3 JobleaderK
orea
Dr RAH
AL Chaw
ki M.
OCIM
FAlgeria
CAR
IBO
TTI Piero LuigiG
TEItaly
LANG
E EberhardEasee
Gas
Ruhrgas-Germ
any
JOSTEN
Martin
GP
AB
P -U.K
.
ING
RA
IN Dom
iniqueIAN
GV
France
SWEET David
ILNGA
USA
SWEET David
WEC
USA
Dr RA
HAL C
hawki M
.G
TiA
lgeria
Dr HO
NG Seongho
IIRKorea
LARS
EN Bruno O
ysteinSIG
TTON
orway
LAN
GE EberhardG
IIGN
LR
uhrgas-Germany
KLEIN
NA
GELV
OO
RT Rob
LNG
Conferences
The Netherlands
TBD
LLN
G O
rganisations
Dr R
AH
AL Chaw
ki M.
IGRC
(Vancouver)A
lgeria
SWEET David
WEC
19th (Sydney)U
SA
KLEIN
NAG
ELVO
OR
T Rob
LNG
14/15The Netherlands
TBDL
CO
NFER
ENC
ES
Dr TA
LEB M
ohamm
edAlgeria
HO
SANS
KI Jean-Marc
New
Actors
France
LOP
EZ ZURITA
Juan Manuel
TaskForce R
DS
pain
EBELS Theo
PG
C B
The Netherlands
ING
RAIN D
ominique
WO
C 5France
TBDL
Coordination w
ithinIG
U
Dr R
AHAL C
hawki M
.P
GC
D Chairman
Algeria

165
B.2. PGC D MEMBERSHIP As of 31st December 2005, the number of PGC D Members and Experts in Study Groups reached 87. PGC D experts reached 19 Members and 68 Members represented the nominated Members to PGC D. Statistics at this date for PGC D Members were as follows: B.2.1. PGC D Members statistics
ITEM Nominated
Represented Countries to PGC D 30Represented Gas Associations to PGC D 28
Represented Associated Members to PGC D 6
Nominated PGC D Members, distributed as follows: 68
- Members 37 - Alternate Members 19
- Corresponding Members 2
- Associated Members Representatives 7 - PGC D Staff (Chair+Vice C.+ Secretary) 3
B.2.2. PGC D Members distribution per area
North South Item Americ
a Americ
a Africa Europ
e Australi
a Asia Total
Represented Countries to PGC D 1 1 1 16 1 10 30
Represented Gas Associations to PGC D 1 1 1 14 1 10 28
Represented Associated Members to PGC D
1 5 6
PGC D Members, nominated as follows:
2 1 4 35 1 25 68
- Members 1 1 19 1 15 37 - Alternate Members 1 9 9 19
- Corresponding Members 1 1 2
- Associated Members 1 6 7
- PGC D Staff (Chair+Vice C.+ Secretary)
2 1 3
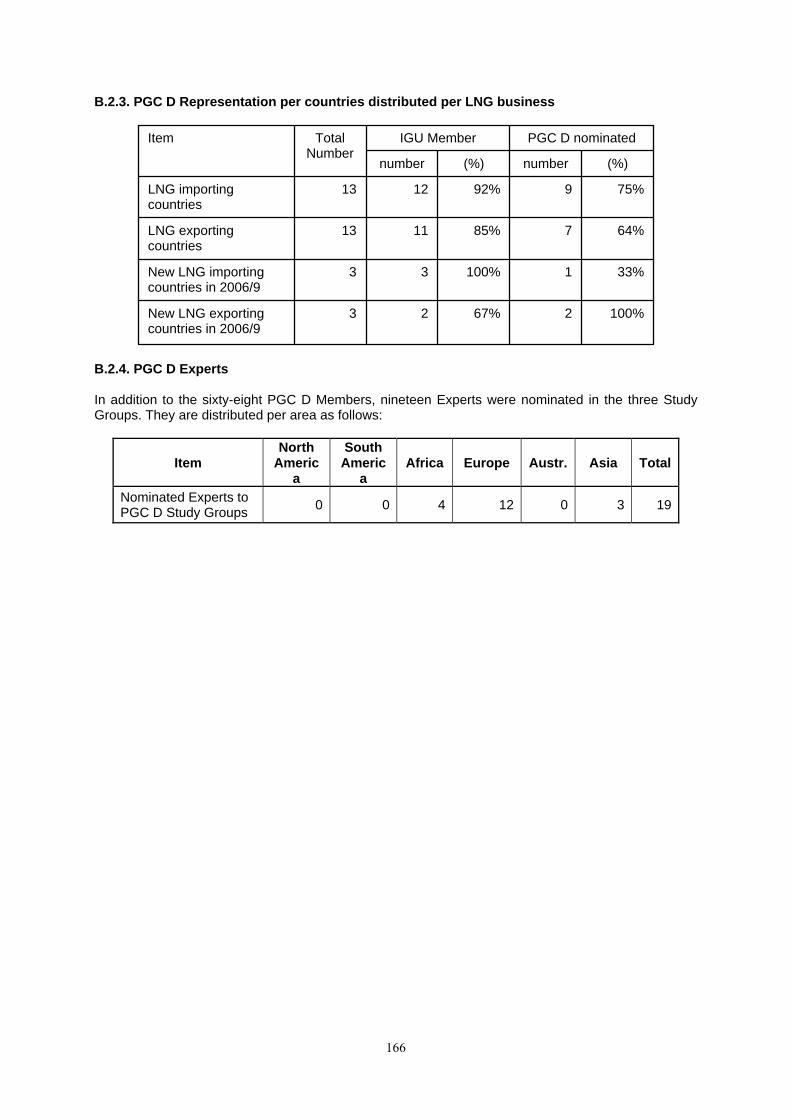
166
B.2.3. PGC D Representation per countries distributed per LNG business
B.2.4. PGC D Experts In addition to the sixty-eight PGC D Members, nineteen Experts were nominated in the three Study Groups. They are distributed per area as follows:
Item North
America
South Americ
a Africa Europe Austr. Asia Total
Nominated Experts to PGC D Study Groups 0 0 4 12 0 3 19
100% 2 67%23New LNG exporting countries in 2006/9
33% 1 100%33New LNG importing countries in 2006/9
64% 7 85%1113LNG exporting countries
75% 9 92%1213LNG importing countries
(%) number (%)number
PGC D nominated IGU MemberTotal Number
Item
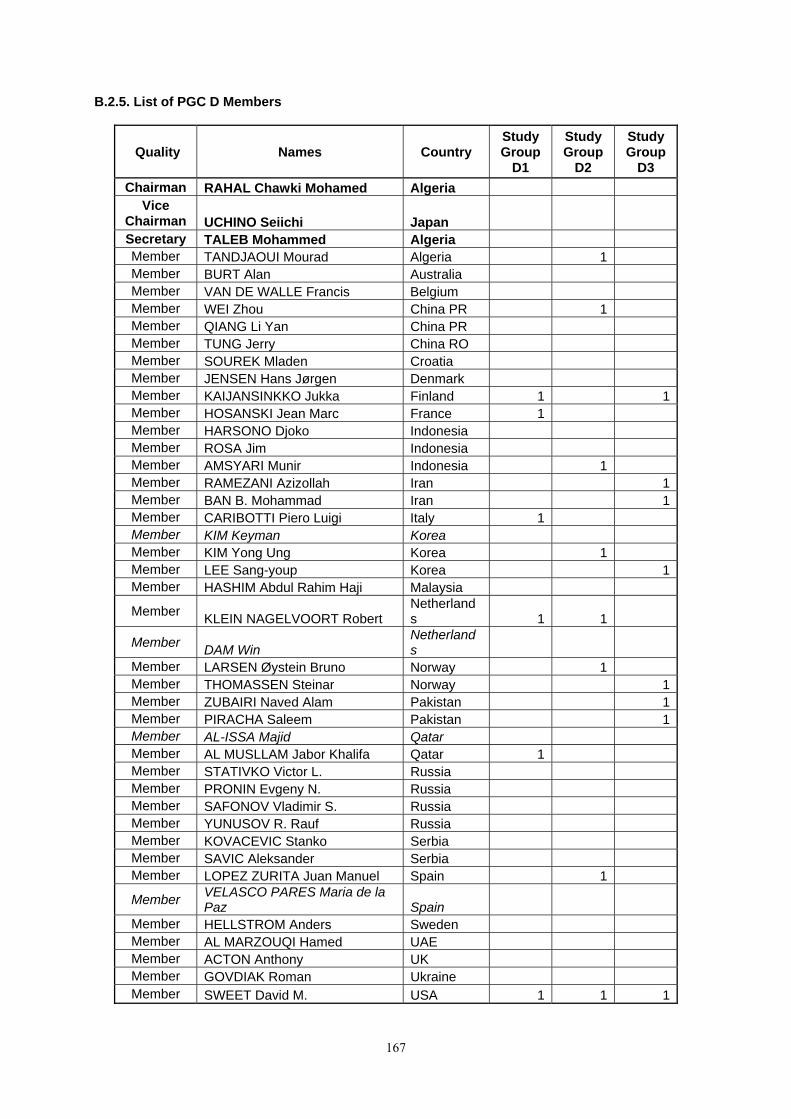
167
B.2.5. List of PGC D Members
Quality Names Country Study Group
D1
Study Group
D2
Study Group
D3 Chairman RAHAL Chawki Mohamed Algeria
Vice Chairman UCHINO Seiichi Japan Secretary TALEB Mohammed Algeria Member TANDJAOUI Mourad Algeria 1 Member BURT Alan Australia Member VAN DE WALLE Francis Belgium Member WEI Zhou China PR 1 Member QIANG Li Yan China PR Member TUNG Jerry China RO Member SOUREK Mladen Croatia Member JENSEN Hans Jørgen Denmark Member KAIJANSINKKO Jukka Finland 1 1Member HOSANSKI Jean Marc France 1 Member HARSONO Djoko Indonesia Member ROSA Jim Indonesia Member AMSYARI Munir Indonesia 1 Member RAMEZANI Azizollah Iran 1Member BAN B. Mohammad Iran 1Member CARIBOTTI Piero Luigi Italy 1 Member KIM Keyman Korea Member KIM Yong Ung Korea 1 Member LEE Sang-youp Korea 1Member HASHIM Abdul Rahim Haji Malaysia
Member KLEIN NAGELVOORT Robert Netherlands 1 1
Member DAM Win Netherlands
Member LARSEN Øystein Bruno Norway 1 Member THOMASSEN Steinar Norway 1Member ZUBAIRI Naved Alam Pakistan 1Member PIRACHA Saleem Pakistan 1Member AL-ISSA Majid Qatar Member AL MUSLLAM Jabor Khalifa Qatar 1 Member STATIVKO Victor L. Russia Member PRONIN Evgeny N. Russia Member SAFONOV Vladimir S. Russia Member YUNUSOV R. Rauf Russia Member KOVACEVIC Stanko Serbia Member SAVIC Aleksander Serbia Member LOPEZ ZURITA Juan Manuel Spain 1
Member VELASCO PARES Maria de la Paz Spain
Member HELLSTROM Anders Sweden Member AL MARZOUQI Hamed UAE Member ACTON Anthony UK Member GOVDIAK Roman Ukraine Member SWEET David M. USA 1 1 1

168
Note : Name in italic means member replaced during triennium B.2.6. List of Associate PGC D Members
Quality Names Country Study Group
D1
Study Group
D2
Study Group
D3 Associate Member HERAI Shammi Belgium 1
Associate Member LANGE Eberhard Germany 1
Associate Member ROTAR Dumltru Roumania
Associate Member FERNANDEZ Javier Spain
Associate Member VARELA Juan Spain
Associate Member JOSTEN Martin UK 1
Associate Member HABELKO F. Paul USA
Note : Name in italic means member replaced during triennium
B.2.7. List of Corresponding PGC D Members
Quality Names Country Study Group
D1
Study Group
D2
Study Group
D3 Corresp Member FERNANDEZ Angélica Argentina 1Corresp Member EBELS Theo
Netherlands
Note : Name in italic means member replaced during triennium
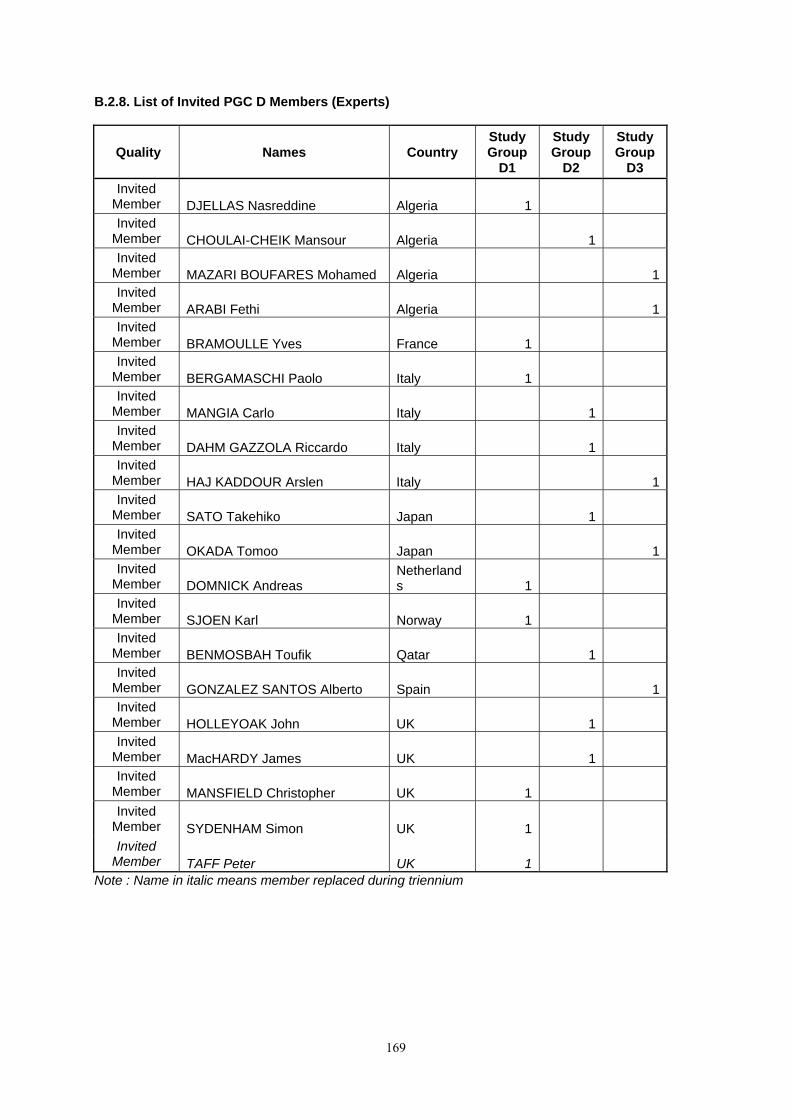
169
B.2.8. List of Invited PGC D Members (Experts)
Quality Names Country Study Group
D1
Study Group
D2
Study Group
D3 Invited
Member DJELLAS Nasreddine Algeria 1 Invited
Member CHOULAI-CHEIK Mansour Algeria 1 Invited
Member MAZARI BOUFARES Mohamed Algeria 1Invited
Member ARABI Fethi Algeria 1Invited
Member BRAMOULLE Yves France 1 Invited
Member BERGAMASCHI Paolo Italy 1 Invited
Member MANGIA Carlo Italy 1 Invited
Member DAHM GAZZOLA Riccardo Italy 1 Invited
Member HAJ KADDOUR Arslen Italy 1Invited
Member SATO Takehiko Japan 1 Invited
Member OKADA Tomoo Japan 1Invited
Member DOMNICK Andreas Netherlands 1
Invited Member SJOEN Karl Norway 1 Invited
Member BENMOSBAH Toufik Qatar 1 Invited
Member GONZALEZ SANTOS Alberto Spain 1Invited
Member HOLLEYOAK John UK 1 Invited
Member MacHARDY James UK 1 Invited
Member MANSFIELD Christopher UK 1 Invited
Member SYDENHAM Simon UK 1 Invited
Member TAFF Peter UK 1 Note : Name in italic means member replaced during triennium

170
B.2.9. List of Alternate PGC D Members
Quality Names Country Study Group
D1
Study Group
D2
Study Group
D3 Alternate Member AOUADENE Boualem Algeria 1 Alternate Member DUMONT Pierre Belgium Alternate Member OLIVIER Philip Belgium Alternate Member SABBE Luc Belgium 1 Alternate Member LING Pan Yi China PR Alternate Member LIAO Jane China RO Alternate Member VRANESIC Milan Croatia Alternate Member DHELLEMMES Jacques France 1 Alternate Member INGRAIN Dominique France Alternate Member HASSANI Masoud Iran 1 Alternate Member SHARIFI Ahmad Reza Iran 1 Alternate Member NOGUCHI Eiji Japan Alternate Member OKI Masanori Japan 1 Alternate Member KIM Bo-Young Korea 1Alternate Member HONG Seongho Korea 1 Alternate Member KARIM Abdullah Malaysia Alternate Member ORSTEIN Unn Norway 1 Alternate Member GRANLI Otto Norway 1 Alternate Member KNEZEVIC Zivojin Serbia Alternate Member AL MAZROUEI Rashed UAE Alternate Member LOGATSKI Victor Ukraine 1
Note : Name in italic means member replaced during triennium

171
ANNEX C SCHEDULE OF PGC D MEETINGS DURING TRIENNIUM 2003-2006
SCHEDULE OF PGC D MEETINGS
Year PGC D Steering
Committee SG 1 SG 2 SG 3
Tokyo (Japan)
04/06/2003 - - - -
2003 London
(UK) 11/09/2003
- - - -
- Doha
(QATAR) 19/03/2004
The Hague (NETHERLANDS)
03/03/2004
Doha (QATAR)
19/03/2004
Doha (QATAR)
19/03/2004
2004
- - - London
(UK) 24/06/2004
-
Arzew (ALGERIA) 27/09/2004 - Arzew (ALGERIA)
27/09/2004
Arzew (ALGERIA) 27/09/2004
Arzew (ALGERIA) 27/09/2004
Nordwijkerhout (NETHERLANDS)
20/04/2005
Nordwijkerhout (NETHERLANDS)
20/04/2005
Nordwijkerhout (NETHERLANDS)
19/04/2005
Bilbao (SPAIN)
15/03/2005
Nordwijkerhout (NETHERLANDS)
19/04/2005
- - - London
(UK) 14/06/2005
-
2005
Hammerfest (NORWAY) 06/10/2005
- Hammerfest (NORWAY) 05/10/2005
Hammerfest (NORWAY) 05/10/2005
Hammerfest (NORWAY) 05/10/2005
- Paris
(FRANCE) 18/01/2006
- Oslo
(NORWAY) 27/01/2006
-
2006
- Amsterdam
(NETHERLANDS) 04/06/2006
- - -
(*) Meeting to be held on the eve of the World Gas Conference