Embed Size (px)
Citation preview

1
Liquefaction of waste – Optimization of the use of products to produce renewable polyurethane foams
Dinis Guerreiro Victor
Instituto Superior Técnico, Lisboa, Portugal
October 2016
Abstract
The present dissertation studied the process of direct liquefaction of almond and eucalyptus waste for producing polyurethane foams from the resulting polyol. Initially, the aim of this work was the optimization of the direct liquefaction and the influence of temperature, reaction time and the amount of catalyst used. To obtain the liquefied, 20% of biomass, 60% of diethylene glycol (DEG) and 20% of 2-ethyl-hexanol were mixed together, for both biomasses. In the eucalyptus waste, the catalyst used was 3% of the total biomass weight. For the other biomass, the liquefaction contained the same mass ratio of solvents but the amount of catalyst changed alongside temperature and reaction time, parameters to be examined. The analysis of this process was performed by a factorial experiment plan to estimate the conversion as a function of temperature, time and percentage of catalyst used. The resulting liquefied product was characterized through OH and acid values, through a spectroscopy technique called ATR-FTIR and SEM. The extraction of polyols took place to eliminate the sugar molecules present in the liquefied product. Finally, the foams of polyurethane were obtained and consequently evaluated. Keywords: liquefaction, liquefied, polyol, response variables, polyurethane foams.
1. Introduction In recent decades, the energy consumption has increased dramatically due to population growth and global mobility, industrialization, and changes in lifestyle. These factors contribute to the increase in demand and consequent exhaustion of energy sources that will always have an associated cost. Nowadays, people are getting more conscious about this issue and thus promoting more debates to increase the interest in renewable energy. The aim is to overcome the low sustainability of common natural sources, excessive consumption and consequent exhaustion.1 The main concern of the consumption of these resources is associated with the release of certain gases, known as greenhouse gases, mainly carbon dioxide, CO2, from the burning of these fuels, that are released into the environment. In Europe, 14% of greenhouse gas emissions come from the chemical industry. There is a constant effort to reduce this number and encourage people to use clean and safe energy, implement methods for waste recycling, discover new products to protect the environment and increase energy efficiency of processes, consequently
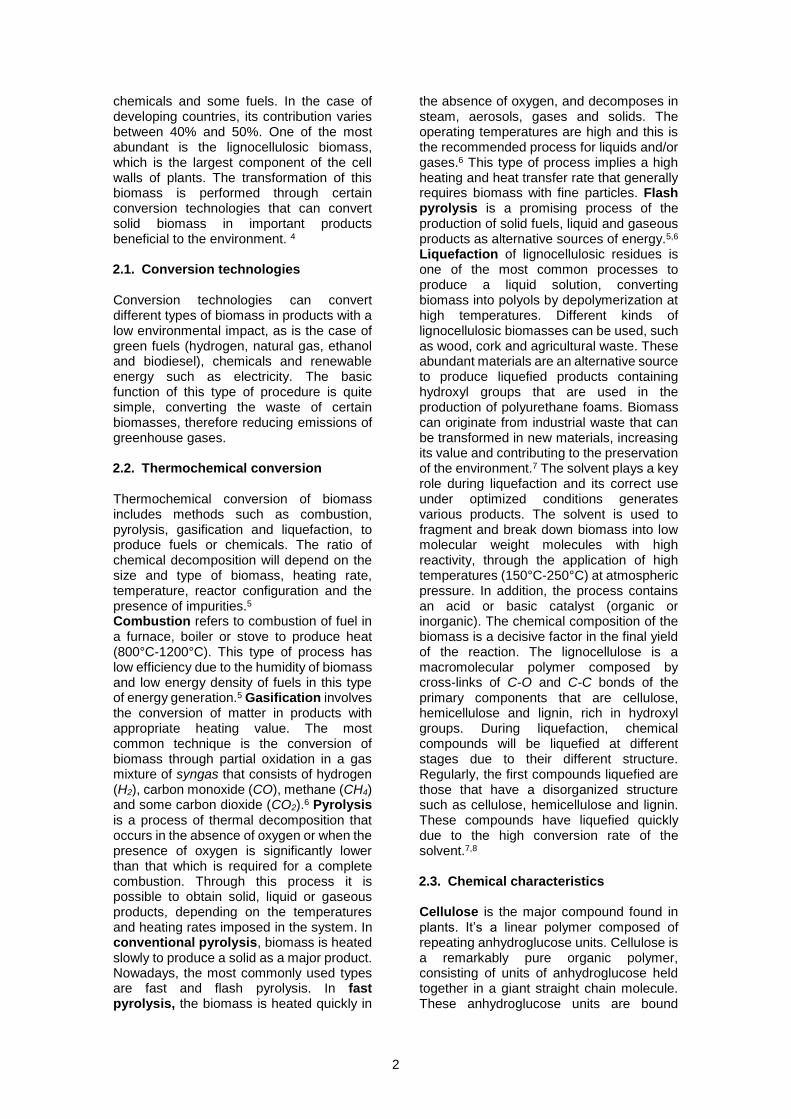
reducing the emission of greenhouse gases.1,2 2. Sources of biomass The diversity of species available in Portugal leads to a potential interest of the use of these biomasses as alternative sources of energy to fossil fuels, getting increasing attention due to environmental considerations. So, the energy from this biomass is increasingly being used and it requires only a small investment. 1
Figure 1 – Distribution of total forest area by
species of plants.3
Biomass is defined as being organic matter of natural or vegetal origin in different forms: liquid, solid and gas. Can be used as a renewable raw material to produce
Pinus pinaster23%
Stone pine6%
Softwoods2%Cork oak
23%Holm oak
11%Oak tree
2%
Chestnut1%
Eucalyptus26%
Hardwoods6%
2
chemicals and some fuels. In the case of developing countries, its contribution varies between 40% and 50%. One of the most abundant is the lignocellulosic biomass, which is the largest component of the cell walls of plants. The transformation of this biomass is performed through certain conversion technologies that can convert solid biomass in important products beneficial to the environment. 4 2.1. Conversion technologies Conversion technologies can convert different types of biomass in products with a low environmental impact, as is the case of green fuels (hydrogen, natural gas, ethanol and biodiesel), chemicals and renewable energy such as electricity. The basic function of this type of procedure is quite simple, converting the waste of certain biomasses, therefore reducing emissions of greenhouse gases. 2.2. Thermochemical conversion Thermochemical conversion of biomass includes methods such as combustion, pyrolysis, gasification and liquefaction, to produce fuels or chemicals. The ratio of chemical decomposition will depend on the size and type of biomass, heating rate, temperature, reactor configuration and the presence of impurities.5 Combustion refers to combustion of fuel in a furnace, boiler or stove to produce heat (800°C-1200°C). This type of process has low efficiency due to the humidity of biomass and low energy density of fuels in this type of energy generation.5 Gasification involves the conversion of matter in products with appropriate heating value. The most common technique is the conversion of biomass through partial oxidation in a gas mixture of syngas that consists of hydrogen (H2), carbon monoxide (CO), methane (CH4) and some carbon dioxide (CO2).6 Pyrolysis is a process of thermal decomposition that occurs in the absence of oxygen or when the presence of oxygen is significantly lower than that which is required for a complete combustion. Through this process it is possible to obtain solid, liquid or gaseous products, depending on the temperatures and heating rates imposed in the system. In conventional pyrolysis, biomass is heated slowly to produce a solid as a major product. Nowadays, the most commonly used types are fast and flash pyrolysis. In fast pyrolysis, the biomass is heated quickly in
the absence of oxygen, and decomposes in steam, aerosols, gases and solids. The operating temperatures are high and this is the recommended process for liquids and/or gases.6 This type of process implies a high heating and heat transfer rate that generally requires biomass with fine particles. Flash pyrolysis is a promising process of the production of solid fuels, liquid and gaseous products as alternative sources of energy.5,6 Liquefaction of lignocellulosic residues is one of the most common processes to produce a liquid solution, converting biomass into polyols by depolymerization at high temperatures. Different kinds of lignocellulosic biomasses can be used, such as wood, cork and agricultural waste. These abundant materials are an alternative source to produce liquefied products containing hydroxyl groups that are used in the production of polyurethane foams. Biomass can originate from industrial waste that can be transformed in new materials, increasing its value and contributing to the preservation of the environment.7 The solvent plays a key role during liquefaction and its correct use under optimized conditions generates various products. The solvent is used to fragment and break down biomass into low molecular weight molecules with high reactivity, through the application of high temperatures (150°C-250°C) at atmospheric pressure. In addition, the process contains an acid or basic catalyst (organic or inorganic). The chemical composition of the biomass is a decisive factor in the final yield of the reaction. The lignocellulose is a macromolecular polymer composed by cross-links of C-O and C-C bonds of the primary components that are cellulose, hemicellulose and lignin, rich in hydroxyl groups. During liquefaction, chemical compounds will be liquefied at different stages due to their different structure. Regularly, the first compounds liquefied are those that have a disorganized structure such as cellulose, hemicellulose and lignin. These compounds have liquefied quickly due to the high conversion rate of the solvent.7,8 2.3. Chemical characteristics Cellulose is the major compound found in plants. It’s a linear polymer composed of repeating anhydroglucose units. Cellulose is a remarkably pure organic polymer, consisting of units of anhydroglucose held together in a giant straight chain molecule. These anhydroglucose units are bound

3
together by beta-(1,4)-glyosidic linkages. By forming intramolecular and intermolecular hydrogen bonds between OH groups within the same cellulose chain and the surrounding cellulose chains, the chains tend to be arranged in parallel and form a crystalline supramolecular structure. Cellulose is insoluble in most solvents and due to its crystallinity is less susceptible to liquefaction.7
Hemicellulose is the second major chemical component and an amorphous polysaccharide. Hemicellulose molecules, unlike cellulose, contain not only glucose units, but are also composed by several different pentose and hexose monosaccharides. Hemicelluloses tend to be much shorter in length than cellulose, and the molecular structure is slightly branched. Due to its amorphous structure, hemicellulose is only partially soluble in water.8 Lignin is a chemical compound that is most commonly derived from wood and is an integral part of cell walls in plants. Lignin is a highly irregular polymer of phenol subunits (derived from the stable benzene molecule with an alcohol functional group).8 Polysaccharides of plant cell walls are highly hydrophilic and so are permeable to water unlike the lignin that is more hydrophobic.8 3. Polyurethane The polyurethanes (PU) are an important class of thermoplastic and thermoset polymers due to their mechanical, chemical and thermal properties. The main structural element is the urethane group which links result mainly from the reaction of isocyanate (N = C = O) with an alcohol (-OH).
The formation of polyurethane isocyanates requires two or more isocyanate groups (NCO) per molecule.
3.1. Polyurethane market The request for polyurethane is mainly generated by the increasing in demand from the construction industry dominated by Asia. The PU market is segmented based on product types such as flexible and rigid foam, coatings, adhesives, sealants and elastomers, to use in furniture, construction, automotive and electronics. 12 3.2. Polyurethane chemistry Polyurethane comes from the reaction between polyol (alcohol containing multiple OH groups) and isocyanate (NCO functional group). The result is a polymer with multiple urethane groups (-NH-COO-). The main reaction of the PU is the polyfunctional isocyanates and hydroxyl compounds resulting in the formation of linear, branched or crosslinked polymers. The isocyanate also reacts with water and is responsible for the foaming of urethane polymers by the liberation of carbon dioxide and the simultaneous formation of urea groups (during cure process).13 3.3. Polyurethane foams Flexible foams represent the largest market segment of polyurethanes and can be obtained in block or mold. They can be produced with different densities and applied mainly in the production of mattresses and car seats. Rigid foams are the second most important commercialized polyurethanes. They are used as thermal insulation in household appliances and construction of buildings and are originated from polyol and isocyanates.12, 13 3.4. Polyurethane foams production For a polymer with useful properties, you need more than a simple mixture of polyol, isocyanate and additives. It is necessary to introduce some changes to obtain, from a simple mixture of two components, a polymer with industrial value. There are two different ways to prepare the polyurethanes: one shot method and prepolymer method. The first one consists in the reaction of the isocyanate with the other components. In the prepolymer method, the isocyanate reacts first with the polyol to originate the prepolymer that then reacts with the other components to obtain the final polymer.13
Figure 2 – Structure of cellulose.
Figure 3 – Urethane group formation.10

4
4. Experimental planning tools In the industry, especially in product development, it is necessary to obtain as much information about the products and processes involved as possible. The responses of the system were evaluated using a mathematical model that allows the modelling of linear or curved responses since the study of the factors (2 or more) is held on at least three levels. From here, the polynomial equations will reflect the influence of significant variables in the response of the system (response surfaces). One of the drawings used was Face Composite Circumscribed (FCC). 14
Response surfaces are described by a polynomial equation. Generally, this equation is of second order and relates the answer (y) with the variables or factors (F1, F2, ..., Fn).
𝑦 = 𝑏0 + ∑ 𝑏𝑖𝐹𝑖
𝑛
𝑖=1
+ ∑ 𝑏𝑖𝑗𝐹𝑖𝐹𝑗
𝑛
1≤𝑖≤𝑗
+ ∑ 𝑏𝑖𝑖𝐹𝑖2 (1)
𝑛
𝑖=1
in which n is the number of factors used, bo
is intercept parameter and bi, bij and bii are linear intercept parameters of first and second order (quadratic) regression that are estimated using the method of least squares. These models were applied in the program MODDE (Modeling and Design) that produces drawings of the response surfaces. The MODDE software package is embodied of useful tools to calculate the fractions of variation of the response that can be explained by the model (R2) as well as those predicted by the model (Q2). Both statistical indicators should be 1 for a perfect model, which is usually not attainable, so values higher than 0.99 allow the build of a strong, robust and reliable model.14
5. Experimental section
5.1. Liquefaction
Almond and eucalyptus waste were used as a raw material. DEG, 2-Ethylhexanol from the chemical company Sigma-Aldrich were used as reagents. The liquefaction was carried in a wide-necked reaction flask, equipped with a multiple socket lid, starring head, proper stirring shaft, thermopar, a Dean-Stark separator/condenser and a solid dropping funnel; the biomass waste/solvent mixture and the catalyst were placed in the reaction flask. The quantity of catalyst used was 3% w/w of the total biomass (biomass, DEG and 2-EH) in the case of eucalyptus waste. The second biomass, almond waste, contained the same mass ratio in solvents, but the amount of catalyst was a condition to be evaluated. The flask was put on a heating mantle preheated at a specific temperature. After the reaction, the product was left to cool to 80°C. The resulting reaction mixture was filtered in a kitasato apparatus until a colorless residue was obtained in the filter. The liquefied residue collected was oven-dried at 120°C until its weight was constant, to determine the liquefaction mass yield (α).
𝛼 = (100 −𝑊𝑓
𝑊𝑖
) ∗ 100 (2)
In which Wf is the final dry weight and Wi is the initial weight of the biomass waste. 5.2. Sugar extraction To produce PU foams, the sugars from the liquefied biomass waste were extracted. This procedure improves the reaction with the isocyanate to produce PU. The extraction was carried out in a decanter flask where the liquefied biomass waste with approximately the same quantity of water was mixed and stirred. 5.3. Polyurethane foams The production of the PU foams involved 3 important steps. First, the liquid components were mixed inside the can. Then, the foam was put in the paper and the froth was evaluated during the curing. Finally, the foam was obtained and cured. Two different compositions of foams were used: liquefied waste and polyols.
Temperature (°C)
Catalyst (w/w %)
Time (min)
Figure 4 - Face Composite Circumscribed (FCC).

5
5.4. Characterization 5.4.1. Acid and OH values To do the characterization of the liquefied biomass waste, the following experimental tests were performed: acid value (AV) and
hydroxyl value (OHV), obtained by the follow equations:
𝑂𝐻𝑉 =(𝑉𝑏 − 𝑉𝐾𝑂𝐻)×𝐶𝑡𝑖𝑡𝑟𝑎𝑛𝑡×56,1
𝑚𝑠𝑎𝑚𝑝𝑙𝑒
+ 𝐴𝑉 (3)
𝑉𝐴 =𝑉𝐾𝑂𝐻×𝐶𝑡𝑖𝑡𝑟𝑎𝑛𝑡×56,1
𝑚𝑠𝑎𝑚𝑝𝑙𝑒
(4)
in which Vb and VKOH are the volumes of titrant needed for the titration of the blank solution and the acetylated sample,
respectively; Ctitrant is the concentration of titrant and msample is the mass of titrated sample. 5.4.2. Attenuated total reflectance -
Fourier transform infrared (ATR-FTIR)
FTIR spectrums were recorded on a Nexus-Thermo Nicolet spectrometer (64 scans and resolution of 4 cm-1) in the range of 400-4000 cm-1. 5.4.3. SEM Scanning Electron Microscopy (SEM) was used to observe the liquefaction residue and polyurethane foams. The images were obtained using a Hitachi S-2400 equipment, with a 15 kV beam. Samples were coated with a thin layer of gold to avoid electrostatic charging during scanning. 5.4.4. Quick tests The three different compositions were evaluated by the research center of the company Greenseal Research. The properties of a foam can be analyzed with quick tests. The foam samples were obtained by two different dispensing procedures: foam on paper and on mold. The tests were performed in two different temperature conditions, 23°C and 5°C, and the evaluation were done with the naked eye.
6. Results and discussion In this section are presented the results from the characterization of the obtained liquefied biomasses and polyurethane foams. 6.1. Liquefaction Almond waste To study the behavior of this biomass, the parameters examined were the time of reaction, temperature and the amount of catalyst used. The optimization of liquefaction was investigated through these independent variables (factors) and the obtained results produce an evaluation considering the three parameters. To describe the effect and interaction of these three independent parameters a mathematical model, via software MODDE, was used to evaluate the experimental indicators and optimize the process of liquefaction. The experimental design was the factorial design of faces centered composite (figure 4). Each vertex of the cube (factorial points), centered facial points and the three replicas of the center point of the cube correspond to 17 experiences. A multiple linear regression (MLR) was used to adjust the data acquired from the tests defined by experimental design. This mathematical model can be validated with the identification and deletion of any wrong answer resulting from operational errors. Table 1 lists the important parameters analyzed and the experiences of the experimental design (experience and resulting yield provided by the template).
Table 1 – Coefficient contribution and its
significance to the developed model.

6
Another condition is the evaluation of the experimental and predictable indicators which should be as close as possible to the unit (R2=1 and Q2=1, at best). Model 1 has a R2 of 0,938 therefore it’s a good approximation of the model. The ability of predictability of the model is low because only 46.9% of the reaction could be predicted (Q2 = 0,469). In addition, the model considered coefficients that were not significant for high p-values, at 95% confidence level. For a better analysis of the experimental data, the tools of the program MODDE identified the presence of data with any discrepancy that were then rejected in a new model (model 2). This removal happens to refine the actual model. The new equation provided indicates an excellent correlation concerning the data obtained (R2=0,992) and the ability to generalize the model for new results once the predictability is 87% (Q2=0,870). The coefficients R2 and Q2 analyzed must have a value close to 1 and their difference shouldn’t be more than 20% and, in this case, is about only 14%. Also, they should both have high values and not be separated by more than 0.2-0.3. Since the difference is below the limit (R2-Q2 = 0.12), the model obtained is appropriate and valid. However, this model is still not considered the best because the value of the predictability (Q2 > 0,5) indicates that it’s just an acceptable model, but the aim is to obtain a value of Q2 > 0,9 to consider it as an excellent model. Regarding the value of this coefficient, it’s still possible to improve and refine model 2. The significant level of experimental design was set at 95% so that the p-value determines the impact of each parameter in the expression of the mathematical model (non-significant terms have a p-value greater than 0.05). Therefore, the terms of model 2, temp*temp, time*time, cat*cat and temp*cat were removed from the model due to their high p-value. The remaining terms are statistically significant (p<0,05), resulting in a new model. It’s considered a good model when its validation is greater than 0,25 and in this case it’s 0,61. In the case of reproducibility, the value is 0,99 and it indicates that the pure error associated is zero. The model can be generated by equation 5.
Y (%) = 39,74301 + 16,22312T + 3,04250t + 18,11282C – 5,05684T2 +
7,89153tC + 3,95610TC
(5)
in which Y is the liquefaction yield (%), T is
the temperature (ºC); t is the time (min) and
C is the amount of catalyst (% w/w). The predictive ability of the model can be judged by plotting the predicted versus experimental values of the liquefaction yield. The experimental data exhibits a high correlation coefficient (R2 = 0,985) which means that they fit the trend-line, as seen in figure 5.
To validate the quality of predictability of the developed model, an additional experience was performed, with random values generated by the program, and was compared with the mathematical model. After this experience the conclusion was that the model expressed by the mathematical equation 2 is a reliable model fitting quite well to the experimental data and predicting the outcome of the liquefactions. This model facilitated the obtainment of contour plots (figure 6) of liquefaction yields attained by varying of the parameters considered for this study.
Figure 6 – Contour plots.
The contour plot provided the 2D view of the surface, connecting the zones with the same behavior, producing contour lines. These charts are very useful for predicting the liquefaction outcome according to the reactional conditions considered or available. The statistical data revealed a good evaluation concerning the liquefaction of this biomass. The best result was achieved when the almond waste was stirred for 200 min at 180°C with 5 %w/w of
the catalyst resulting in a yield of 80%.
Figure 5 – Correlation of the observed vs. predicted values of almond waste liquefaction.

7
Eucalyptus waste Liquefaction of this biomass was carried out according to two parameters (factors), temperature and reaction time. Table 2 indicates the conditions and respective results.
Table 2 – Conditions and results of the
eucalyptus waste liquefaction.
As seen on table 2, the highest yield was obtained when the residue was 180 min stir at a temperature of 150°C. Regarding the reaction time, it’s possible to obtain a reaction profile of the three temperatures: 120°C, 150°C and 180°C (figure 7). This means that to maintain the reaction at constant temperature, the different reaction times incremented, causing an increase in the yield of liquefaction, which reaches a maximum value and decreases after.
At a temperature of 120°C, the amount of liquefied biomass increases until a reaction time of 85 min, reaching a yield of 50%. At this point, there is a decrease and it stabilizes near 35%. The other temperatures, have higher yields. In the case of liquefied residue at a temperature of 150°C, there’s a maximum at 180 min
(91,99%) decreasing from this point on. At a temperature of 180°C, the maximum yield was obtained sooner, at 85 minutes, with about 87,15%. One of the products that results from the decomposition of lignocellulosic biomass is the humidity that will decrease the yield of biomass conversion. At low temperatures, the decomposition process starts to be dominant and the formation of solid waste increases causing low yields. The lack of homogeneity of the biomass and the variability inherent to the processes of liquefaction makes it impossible to build a model of predictability and behavior of biomass. 6.2. OH and acid values The values obtained for the value OH and acid value of almond and eucalyptus residues are listed in table 3.
Table 3 – OH and acid values.
As seen on table 3 the acid values decrease initially because there is a high consumption of acid catalyst. Then, there is an increase of acid value due to the decomposition (predominantly at the temperature of 180°C) in its acid derivatives (originated from the breakdown of sugars). This behavior is seen in the two liquefied biomasses. Acid and OH values are consistent with the theoretical ones. This can be explained by the high polarity of cellulose and hemicellulose in the liquefied and other compounds that can be easily extracted with water.
Figure 7 - The variation of the curve for the different reaction times at a
constant temperature.

8
6.3. ATR-FTIR
The resulting spectrum of liquefied almond residue is represented.
The presence of these hydroxyl groups can be overcome through depolymerization of cellulose, hemicellulose and/or other residues. The peak at 2890 cm-1 corresponds to the C-H bond that is dispensed by the existing structure of the liquefied mixture. The peak at 1732 cm-1 can result from a carbonyl bond that corresponds to the decomposition of cellulose and related compounds. The presence of this signal in these products indicates that the material was effectively liquefied. The intense band at 1038 cm-1 represents C-O in O-CH3 found in the structure. The next spectrum is related to liquefied eucalyptus.
There is a common band at both temperatures that corresponds to OH links present in the liquefied. The presence of these hydroxyl groups can be overcome through the depolymerization of compounds present in the biomass. As seen in figure 9, there is a peak at 2900 cm-1, for both temperatures, characteristic of C-H bonds of existing structures in the mixture of
liquefaction. At 1500-1600 cm-1 there are some peaks that correspond to the vibration of aromatic rings and between 1470-1033 cm-1 the peaks appear due to the vibration of the C-O bonds. In this case, there is an intense band for both temperatures at 1033 cm-1 that refers to the vibration of the -C-O in O-CH3. 6.4. Polyurethane foams The evaluation was performed using quick and visual tests during foam dispersion and after the curing process. These foam evaluation tests are divided in two parts: the first is the quick test that consists in the evaluation of dispersion of foam from the can at 23°C and 5°C, before and after the cure process. The next table refers the designation of the liquefied and polyols products used.
Table 4 – Designations of the products.
The measure of the debit value of the foam was performed with a full can. Before the test, the can was in a refrigerator at 5°C during 4h to achieve a homogenous temperature. The can was weighted and the foam was dispensed in a piece of paper. At this point, the can agitation rate and the output flow were measured.
The output rate depends on the viscosity of the prepolymer and this rate decreased with the increase in viscosity. This test was performed at 5°C because low temperatures compromise the properties of the foam, allowing the collection of useful data about it. The A-1 has the highest viscosity, with a low output rate. A-2 e B-2 show an output rate like the reference foam.
Figure 8 – ATR-FTIR spectrum of
liquefied almond waste.
Tra
nsm
itta
nce
(a
.u.)
Wave number (cm-1)
Figure 9 – ATR-FTIR spectrum of liquefied eucalyptus waste.
0
2
4
6
8
10
Outp
ut
rate
(g/s
)
Figure 10 – Output rate of foams.

9
6.4.1. Quick tests After the output rate, the foam was dispensed in the paper and mold at 5°C and 23°C and evaluated as seen on table 5.
Table 5 – Classification of PU foams.
A-1 A-2 B-1 B-2
Temperature (°C) 23 5 23 5 23 5 23 5
Pa
per
Shaking rate 4 4 5 5 5 4 5 5
Froth shrinkage
5 5 5 5 5 5 5 5
Froth outflow 3 1 3 3 3 1 3 3
Crumbling 1h 3 3 5 5 3 4 5 5
Crumbling 2h 1 1 5 5 0 1 5 5
Crumbling 24h
2 -1 5 4 1 -1 5 4
Glass bubbles 4 5 4 4 5 4 4 5
Cell structure 4 -4 5 2 4 1 5 2
Voids & pinholes
4 -2 4 3 4 4 5 3
Base holes 5 5 3 5 5 5 4 5
Curing shrinkage/ warping
5 5 5 5 5 5 5 5
Curing streaks 5 -2 5 5 5 3 4 4
Cell collapse 5 -4 5 4 5 4 3 2
Mo
ld
Shrinkage mold
5 4 4 3 4 4 3 3
Glass bubbles 4 3 3 3 5 4 3 3
Cell structure 2 0 3 3 2 4 3 3
Voids & pinholes
3 1 4 4 2 3 4 4
Base holes 5 5 4 3 5 4 4 3
Cell collapse 3 1 3 3 3 5 3 3
Curing streaks 4 5 4 4 4 4 4 4
A-1 e B-1 have the worst classification on paper substrate mostly because they were obtained from rich in sugar liquefied wastes, and are easily crumbled. Foams A-2 and B-2 present the best classification comparing to A-1 and B-1, respectively, due to the presence of a higher quantity of additives in their composition. A higher quantity of surfactant agents allows a better emulsification of the system and the flame retardant reduces the effects of bubble coalescence. A-2 and B-2 foams are richer in polyol and therefore more ecofriendly when compared with traditional ones. Regarding the molds, A-1 and B-1 deliver acceptable properties but they can still easily crumble and cannot be used in future applications. A-2 and B-2 present better properties on paper than on the mold because of the geometric confinement and less contact with air. 6.4.2. ATR-FTIR The foams were analyzed using the technique of Attenuated Total Reflectance – Fourier Transform Infrared Spectroscopy, obtaining the spectrums in figure 11.
B-1 and A-1 represent the foams produced using the liquefied wastes of almond and eucalyptus, respectively. They both have intense bands that correspond to the asymmetric links of C-O-C, aromatic rings and C-H bonds present in the foam. B-2 and A-2 have the same bands but much more intense than the bands produced with the liquefied wastes.
6.4.3. SEM The next tables refer to the SEM images of the liquefied, polyol and standard PU foams.
Wave number (cm-1) Wave number (cm-1)
Wave number (cm-1) Wave number (cm-1)
Figure 11 – ATR-FTIR spectrum of PU foams at 5ºC (blue) and 23ºC (orange).
Table 6 – SEM imagens.

10
The SEM analysis leads to the conclusion that the resulting morphology of PU foams are consisting with the visual and quick tests. It’s possible to observe that foam cells are smaller and more homogeneous, and that means that the surface is well distributed.
7. Conclusion
This work allowed the study of two biomasses that were successfully liquefied. In the case of almond waste, the conversion yield had a maximum value of 81,95% being stirred for 200 minutes at 180°C with 5% w/w of catalyst. These good results permitted the development of a mathematical model, via software MODDE, using three independent parameters (reaction time, temperature and amount catalyst) of the liquefaction process. The aim of this model was to determine the reproducibility and predictability of the process. Unfortunately, it was impossible to make a mathematical model with eucalyptus waste because of its diverse morphology. However, the conversion yield was acceptable using the reaction time and temperature as parameters. In the case of eucalyptus waste, the conversion yield had a maximum value of 91,99% being stirred for 180 minutes at 150°C. The OH values were between 287 and 429 mg KOH/g and the acid values were between 0,8 and 5,61 mg KOH/g. The ATR-FTIR analyses showed the presence of aromatic compounds, with OH and carbonyl groups that are supposed to be originated from the lignin. The foams were produced successfully and it was possible to distinguish them based on their origin: liquefied waste or polyol. With the quick tests, it was possible to verify that PU foams derived from liquefied waste had the worst results, such as a weak cell structure, presence of voids and pinholes and high crumbliness. The PU foams derived from the polyols showed better results, for instance, these have less crumbliness and therefore are less likely to break. Results show that it is possible to use polyols from eucalyptus and almond waste as a biodegradable and cheaper source for production of industrial foams, when comparing with traditional chemically originated foams.
8. Future work For future works it would be interesting to experiment with different grain sizes of almond waste to study the effect of the superficial area in the obtained conversion
yield. Additionally, the process should be upscaled, optimized and different catalysts should be tested. To be commercially viable, foams must have a rating of 3 or more and for that it’s necessary to produce a large quantity to increase the polyol amount present in the foam. 9. References
1. Balat,M., Kirtay,E., Balat,H., Main routes for the thermos-conversion of biomass into fuels and chemicals, Energy Conversion and Management, 2009a, 503, 3158-3168.
2. Dermibas, A., Mechanisms of liquefaction and pyrolysis reactions of biomass, Energy Conversion & Management, 2000, 41, 633-646.
3. 6º Inventário Florestal Nacional: Áreas dos usos do solo e das espécies florestais de Portugal continental, 2013
4. Demirbas,A., Green energy and technology, Biofuels, 2009.
5. Balat,M., Kirtay,E., Balat,H., Main routes for the thermos-conversion of biomass into fuels and chemicals Part1:Pryolysis systems, Energy Conversion and Management, 2009b, 50, 3147-3157.
6. Rezzoug,S., Capart,R., Liquefaction of wood in two successive steps: solvolysis in ethylene-glycol and catalytic hydrotreatment, 2002, 631-644.
7. Stevens, J., An overview of biomass thermochemical liquefaction research sponsored by the U.S. Departament of energy, 2000.
8. Huang,H, Yuan,X., Recent progress in the direct liquefaction of typical biomassa, Progress in Energy and Combustion Science, 2015,49,59-80.
9. Brandt, A., Gräsvik, J., Hallett, J. P., & Welton, T., Deconstruction of lignocellulosic biomass with ionic liquids. Green Chemistry, 2013, 15(3), 550–583. http://doi.org/10.1039/c2gc36364j.
10. Hu,S., Luo,X., Li, Y., Polylos and Polyurethanes from the liquefaction of lignocellulosic Biomass, 2014, 7, 66-72. Doi: 10.1002/cssc.201300760
11. Krevelen, D.W., Van & Nijenhuis, K.T., Properties of Polymers, Elsevier, 2009.
12. Sonnenschein, M. F. Polyurethanes: Science, Technology, Markets and Trends. (John Wiley & Sons, Inc.).
13. Claro, J. C., Poliuretanos, UTAD, 2001, 30, 68.
14. Braz, A.I., Liquefação de Madeira de Pinho, Tese de Mestrado – IST, 2015.