Embed Size (px)
Citation preview
LIQUEFACTION-INDUCED GROUND DISPLACEMENT MAPPING
FOR THE SALT LAKE VALLEY, UTAH
by
Daniel W. Hinckley
A thesis submitted to the faculty of The University of Utah
in partial fulfillment of the requirements for the degree of
Master of Science
Department of Civil and Environmental Engineering
The University of Utah
May 2010

Copyright © Daniel W. Hinckley 2010
All Rights Reserved
ABSTRACT
This paper presents liquefaction-induced lateral spread and ground settlement
maps for the Salt Lake Valley for a M7.0 scenario event on the Wasatch fault and for two
probabilistic-based events: (1) peak ground acceleration associated with a 2 percent
probability of exceedance in 50 years and (2) peak ground acceleration associated with a
10 percent probability of exceedance in 50 years. The maps presented herein are the first
liquefaction-induced ground failure maps developed for Utah using both geotechnical and
geological data in conjunction with deterministic and probabilistic estimates of strong
motion. These maps have been developed to aid engineers, developers and city planners
identify areas that may require additional geotechnical evaluations and/or liquefaction
mitigation to reduce the liquefaction hazard. The maps were developed from an
extensive geotechnical database, geologic mapping and hazard calculations. Estimates of
lateral spread displacement were calculated from the Youd and others regression model
and ground settlement estimates were calculated from procedures developed by
Tokimatsu and Seed, and Yoshimine and others. Estimates from these methods were
plotted within their respective surficial geologic units, and the mapped units were
subsequently assigned an estimate of ground displacement based on statistical analysis.
The mapped units for the scenario event were assigned a displacement hazard that has an
85 percent probability of nonexceedance for the M7.0 Wasatch fault characteristic
earthquake while the probabilistic-based events were assigned the median displacement

v
hazard for their respective probabilistic events. The maps show relatively high lateral
spread and settlement hazards exist along and near the Jordan River and in recent
alluvial/river/stream/lake deposits found in the northern part of the Salt Lake Valley.

CONTENTS
ABSTRACT....................................................................................................................... iv
ACKNOWLEDGMENTS ................................................................................................ vii
INTRODUCTION .............................................................................................................. 1
GEOLOGIC SETTING ...................................................................................................... 3
FAULTING AND SEISMICITY ....................................................................................... 7
LIQUEFACTION HAZARDS ........................................................................................... 9
ArcGIS® GEOTECHNICAL DATABASE..................................................................... 12
LIQUEFACTION HAZARD MAPPING......................................................................... 17
Lateral Spread Map Development ................................................................................ 17
Ground Settlement Map Development ......................................................................... 19
CONCLUSIONS............................................................................................................... 32
APPENDICES A. DATABASE SUMMARY.................................................................................... 34
B. DEVELOPMENT OF ArcGIS® GROUND SETTLEMENT ROUTINES......... 66
C. HAZARD CLASS DEVELOPMENT.................................................................. 94
D. TABLULATED GROUND DISPLACEMENTS .............................................. 107
REFERENCES ............................................................................................................... 144
ACKNOWLEDGMENTS
This study is part of an ongoing United States Geological Survey (USGS)
National Earthquake Hazards Reduction Program (NEHRP) mapping project for Utah
(USGS Award 07HQGR0021). The author thanks the USGS for the funding of this
research and the Utah Liquefaction Advisory Group for its participation in guiding and
reviewing this work. Sincere gratitude also goes to Michael Olsen for developing the
ArcGIS analysis codes and Stephen Harmsen of the USGS for providing the probabilistic
strong ground motion estimates and seismic deaggregations. The Utah Department of
Transportation, local governmental agencies and private consulting companies should
also receive recognition for their donation of the borehole data used in this mapping
project.

INTRODUCTION Liquefaction can occur when excess pore pressures are generated in relatively
loose, saturated, granular soil deposits that are subjected to cyclic loading resulting from
moderate to large earthquakes. In the liquefied state, the soil’s shear resistance is
significantly reduced and such loss of strength may cause ground failure (e.g., flow
failure, lateral spread and ground oscillation). In addition, ground settlement may occur
as excess pore pressure dissipates and the soil reconsolidates to a denser configuration.
Infrastructure, embankments and retaining walls atop liquefied ground may suffer from
bearing capacity and other types of failure due to liquefied conditions of the foundation
soils.
Perhaps the most damaging type of liquefaction failure is lateral spread. During
lateral spread, blocks of relatively intact surficial soil atop liquefied soil displace down
slope or towards a free face and such displacement can cause considerable damage.
Lateral spreads generated by the 1906 San Francisco earthquake damaged or destroyed
numerous buildings, bridges, roads and pipelines (Youd and Hoose, 1978). Most
notably, lateral spread along Valencia Street between 17th and 18th Streets severed water
lines to downtown San Francisco. The resulting interruption of water greatly hampered
fire fighting during the ensuing fire and significantly added to the earthquake losses.
Lateral spreads caused by the 1964 Alaska earthquake disrupted many bridges, buildings,
pipelines and other lifelines in cities such as Anchorage, Homer, Kodiak, Valdez,

2 Seward, Portage and Whittier, Alaska. Approximately $80 million of liquefaction
damage (1964 value) was incurred by 266 bridges and numerous sections of embankment
along the Alaska Railroad and Highway (McCulloch and Bonilla, 1970; Kachadoorian,
1968). In that same year, liquefaction caused widespread damage to buildings, roads and
bridges in Niigata, Japan (Hamada and others, 1986). In addition, ground settlement
associated with liquefaction has caused extensive damage (Yoshida and others, 2001;
Kaneko and others, 1995).
The Wasatch Front in Utah has a relatively high liquefaction hazard due to the
presence of several nearby, active faults. The Salt Lake segment of the Wasatch fault is
capable of producing a M7.0 or greater event (Machette and others, 1992) which could
trigger liquefaction in several locales within the valley. In addition, the Salt Lake and
other valleys along the Wasatch Front are relatively deep, sedimentary basins with
shallow groundwater containing loose, saturated, potentially liquefiable soil deposits.
With a 2.5 percent population increase from 2007 to 2008 (Bernstein, 2008), Utah is the
nation’s fastest growing state and its infrastructure is continually expanding in
earthquake-prone areas. This requires continual assessment of geological hazards, urban
planning and earthquake-resistant design to reduce Utah’s seismic risk.
This paper focuses on the development of liquefaction-induced lateral spread and
ground settlement maps for the Salt Lake Valley, Utah for three cases: (1) a characteristic
M7.0 event on the Wasatch fault, (2) the peak ground acceleration (PGA) corresponding
to 2 percent probability of exceedance in 50 years and (3) the PGA corresponding to 10
percent probability of exceedance in 50 years. Additionally, recommendations on the
implementation and use of these maps in hazard ordinances are presented herein.
GEOLOGIC SETTING
Quaternary unconsolidated sediments in the Salt Lake Valley are generally
between 40 and 200 m thick, except for the northeastern part of the valley, where they
may be as thick as 700 m (Arnow and others, 1970; Wong and others, 2002). Localized
tilting caused by faulting and deepening of the sedimentary basin has produced the
deeper section of unconsolidated sediments found in this part of the Salt Lake Valley.
Holocene sediments, deposited after the last regression of late-Pleistocene Lake
Bonneville, and Lake Bonneville deposits dominate the surficial geology of this
intermountain basin (Figure 1, Table 1). The northern part of the Salt Lake Valley is
covered by Holocene lacustrine, marsh and alluvial sediments that were deposited after
the last major regression of Lake Bonneville, some 10,000 years before present (Lund,
1990). The northward flowing Jordan River and its tributary streams that generally flow
northwesterly across the Salt Lake Valley are the primary source of highly liquefiable
sediments (Olsen and others, 2007).
In other parts of the valley, Holocene and late-Quaternary alluvium, alluvial fan,
colluvial and glacial deposits have been deposited atop Lake Bonneville lacustrine, delta
and terrace deposits (Wong and others, 2002). In the southern part of the valley and
along its eastern margins, surficial deltaic deposits from Lake Bonneville and pre-
Bonneville alluvial-fan deposits, late Tertiary/early Pleistocene fanglomerates are
morphologically distinctive and generally thick in some areas (Wong and others, 2002).
4
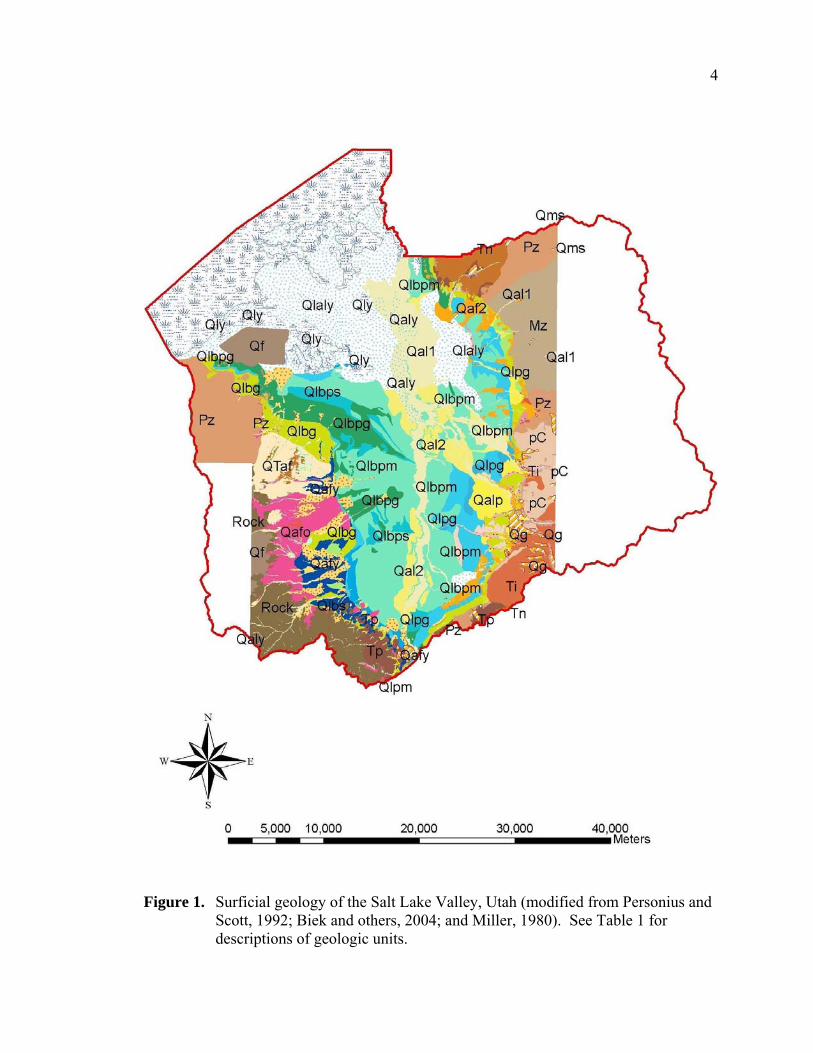
Figure 1. Surficial geology of the Salt Lake Valley, Utah (modified from Personius and
Scott, 1992; Biek and others, 2004; and Miller, 1980). See Table 1 for descriptions of geologic units.

5
Table 1
Name, description and age of major surficial geologic units in the Salt Lake Valley (Personius and Scott, 1992; Biek and others, 2004; and Miller, 1980).
Name Description Age Stream Alluvium Qal1 Modern stream alluvium 1 Upper Holocene Qal2 Modern stream alluvium 2 Upper Holocene
Qalp Stream alluvium related to the Provo (regressive) phase of Lake Bonneville
Upper Pleistocene
Qaly Stream alluvial deposits, undivided Holocene-Upper Pleistocene Alluvial Fan Deposits Qaf2 Alluvial fan deposits 2 Holocene Qafy Alluvial fan deposits, undivided Holocene-Upper Pleistocene Qafb Alluvial fan deposits of the Bonneville (transgressive) ph. Upper Pleistocene Qafo Older alluvial fan deposits, undivided Middle Pleistocene QTaf Oldest alluvial fan deposits Upper Pleistocene Young Lacustrine and Mixed-Environment Deposits Qly Lacustrine and marsh deposits Holocene Qlaly Lacustrine, marsh and alluvial deposits Holocene-Upper Pleistocene Lake Bonneville Lacustrine Deposits Qlpd Deltaic gravel of the Provo (regressive) phase Upper Pleistocene Qlpg Lac. gravel and sand of the Provo (regressive) phase Upper Pleistocene Qlps Lac. sand and silt of the Provo (regressive) phase Upper Pleistocene Qlpm Lac. clay and silt of the Provo (regressive) phase Upper Pleistocene Qlbg Lac. gravel and sand of the Bonneville (transgressive) ph. Upper Pleistocene Qlbs Lac. sand and silt of the Bonneville (transgressive) phase Upper Pleistocene Qlbm Lac. clay and silt of the Bonneville (transgressive) phase Upper Pleistocene Qlbpg Lac. gravel and sand of the Bonneville Lake cycle, undiv. Upper Pleistocene Qlbps Lac. sand and silt of the Bonneville Lake cycle, undiv. Upper Pleistocene Qlbpm Lac. silt and clay of the Bonneville Lake cycle, undivided Upper Pleistocene Colluvial Deposits Qclsp (Qmls)
Lateral spread deposits Holocene-Upper Pleistocene
Qca Colluvium and alluvium, undivided Holocene-Mid. Pleistocene Qes Eolian sand Holocene Artificial Deposits Qf Artificial fill Historical Bedrock (sometimes generalized as “Rock”) Ti Tertiary intrusive igneous rocks Oligocene Tn Tertiary sedimentary and volcanic rocks Neogene Tp Tertiary sedimentary and volcanic rocks Paleogene Mz Mesozoic sedimentary rocks Cretaceous - Triassic Pz Paleozoic sedimentary rocks Permian - Cambrian pC Precambrian metamorphic rocks Proterozoic and Archean
Rock Limestone, shale, etc. Pleistocene-Upper Mississippian

6
The groundwater table is relatively shallow (generally less than 10 to 15 feet
below the surface) in the northern part of the valley and along the Jordan River and its
tributaries (Bartlett and others, 2005). The groundwater table is much deeper along the
margins of the valley near the mountain fronts. Unfortunately, a reliable groundwater
map does not exist for the Salt Lake Valley, thus the depth to groundwater recorded on
the borehole logs from the geotechnical database was used in conjunction with an inverse
distance square interpolation method to estimate the ground water level in the valley
(Bartlett and others, 2005).

FAULTING AND SEISMICITY
The Salt Lake Valley is located in the central Wasatch Front part of the
Intermountain Seismic Belt which is a series of active, Quaternary normal faults
extending from southern Montana to northern Arizona (Smith and Arabasz, 1991). The
Salt Lake segment of the Wasatch fault poses the primary seismic hazard to the Salt Lake
Valley (Scott and Shroba, 1985; Machette and others, 1992; Personius and Scott, 1992).
This segment extends approximately 46 km from the Traverse Mountains salient (on the
south) to the Salt Lake salient (on the north) (Personius and Scott, 1992). It is a complex
normal fault system consisting of several sections that include (from north to south): (1)
the Warm Springs fault along the Salt Lake salient, (2) the East Bench fault, which is
located just east of downtown Salt Lake City, (3) the Cottonwood section along the
southern part of the Wasatch Front in the Salt Lake Valley and (4) the western part of the
Fort Canyon fault near the Traverse Mountains salient. Other faults in the north central-
part of the valley form the West Valley fault zone, which is antithetic to the Salt Lake
segment and may co-rupture with this segment (e.g., Youngs and others, 1987; Keaton
and others, 1993).
The average recurrence of faulting on the Salt Lake segment is approximately
1,300 years (Lund, 2005) with a scenario event of approximately M7.0 or larger
(Machette and others, 1992). No historical events have occurred on this segment, but
well-documented evidence of prehistoric faulting has been observed in numerous

8 paleoseismological, geological and geotechnical investigations. Expected PGA values
for surficial soil conditions vary from about 0.1 to 1.1 g according to soil conditions and
distance from the fault (Wong and others, 2002). Ground acceleration of this amplitude
will cause liquefaction-induced ground failure in many parts of the central and northern
valley, especially in the Holocene fluvial and alluvial deposits found in these areas. In
addition, the strong ground motion may be amplified and prolonged due to soft soil and
basin effects within the valley (Olsen and others, 1995).

LIQUEFACTION HAZARDS
Numerous paleoseismological, geologic and geotechnical investigations
conducted in the Salt Lake Valley have documented prehistoric ground failures, which in
part, are caused by liquefaction-induced lateral spread (e.g., Osmond and others, 1965;
Keaton and Anderson, 1995; Simon and Bymaster, 1999; Kleinfelder Inc., 1999; Cotton,
Shires and Associates, 1999; Korbay and McCormick, 1999; Black el al., 2003). The
ground displacement features at the Salt Palace Convention Center have been extensively
studied and their causal mechanism(s) are somewhat controversial (Simon and Bymaster,
1999; Kleinfelder, 1999; Cotton, Shires and Associates, 1999; Black and others, 2003;
Korbay and McCormick, 1999). These studies are important to understand the origins of
prehistoric ground failures mapped in the downtown area.
On a larger scale, subsurface information in combination with surficial geologic
maps can be compiled and interpreted to create liquefaction county hazard maps for
development, planning and natural disaster preparation. Liquefaction hazard maps have
been classified into three general types: (1) liquefaction susceptibility, (2) liquefaction
potential and (3) liquefaction ground failure maps (Youd and Perkins, 1978; Power and
Holzer, 1996). Liquefaction susceptibility maps describe the relative vulnerability or
susceptibility of the soil to liquefaction and are based on geological mapping of
depositional environments and/or descriptions of the soil’s texture and age. These maps
do not consider the level or frequency of strong motion. In contrast, liquefaction

10 potential maps combine soil susceptibility information with the seismicity of the area to
describe the likelihood or potential of liquefaction for deterministic or probabilistic
events. Lastly, liquefaction ground failure maps show estimates of the expected amount
of permanent ground displacement associated with an event or hazard level. These latter
maps are considered the most useful type of map for assessment and mitigation of
liquefaction-induced damage.
The first liquefaction potential map for the Salt Lake Valley was developed by
Anderson and others (1987) and later revised by Anderson and others (1994) and
digitized by Jarva (1994). The Anderson and others (1994) map is currently adopted by
most municipalities in Salt Lake County for hazard identification. This map was
developed from geologic mapping, Standard Penetration Test (SPT) penetration
resistance (blow count) N values and borehole soil descriptions using a relatively limited
geotechnical database. From these data, estimates of the liquefaction potential were
made and generalized to the mapped area. More recently, Solomon and others (2004)
have developed a liquefaction ground failure map that presents the Liquefaction Severity
Index (LSI) (Youd and Perkins, 1987) for the Salt Lake Valley. However, this approach
did not implement subsurface geotechnical data, but was based solely on surficial
mapping. Recently, Erickson (2007) has completed a probabilistic liquefaction potential
map for the Salt Lake Valley using subsurface geotechnical data and surficial mapping
that combines the input from the United States Geological Survey (USGS) probabilistic
seismic hazard maps (Frankel and others, 2002) with the probability of triggering
liquefaction using probabilistic curves developed by Seed and others (2003). Bartlett and
others (2005) and Olsen and others (2007) have also produced a lateral spread

11 displacement hazard map for a M7.0 Wasatch fault scenario earthquake for northern Salt
Lake Valley.
This paper extends the work of Bartlett and others (2005) and Olsen and others
(2007) and develops lateral spread displacement maps and liquefaction-induced ground
settlement maps for the entire Salt Lake Valley based on a M7.0 Wasatch fault event
(Wong and others, 2002) and for probabilistic estimates from the 2008 USGS National
Seismic Hazard Mapping Project (Petersen and others, 2008). The selected PGA
estimates correspond to a 2 percent probability of exceedance in 50 years and a 10
percent probability of exceedance in 50 years.

ArcGIS® GEOTECHNICAL DATABASE An extensive geotechnical database has been compiled in ArcGIS® for use in
liquefaction analysis in the Salt Lake Valley (Bartlett and others, 2005; Olsen and others
2007; Erickson, 2007). Efforts have been made to gather subsurface information for
nearly all major geologic units (Figure 1, Table 2) and to document the quality of data of
the borehole information. At the time of this study, the database contained subsurface
information from 963 boreholes drilled in the valley since 1959 (Figure 2; see also
Appendix A). Many of the boreholes are from recent Utah Department of Transportation
(UDOT) projects where explorations generally extend to depths of 15 m or greater,
especially near bridge structures. In other areas of the valley, the major contributors of
subsurface data were Salt Lake County, city municipalities and geotechnical consultants.
The information compiled in the ArcGIS® geotechnical database includes
borehole logs, soil descriptions, groundwater levels, SPT blow counts, fines content,
mean grain size and soil unit weights. Additionally, shear wave velocity (Vs) data for
Salt Lake Valley (Ashland and McDonald, 2003) for approximately 160 locations are
contained in the database. The Vs dataset was reduced to representative site-response
unit groups based on similar subsurface profile characteristics (e.g., near-surface soil
type, origin, deposition and age). Average Vs values (12 and 30 m) were determined for
each site-response unit. Each surficial geologic unit was assigned to the best-paired site-
response unit for use in the liquefaction analyses.

13
Table 2
Number of database boreholes in major surficial geologic units
Name Description Boreholes Stream Alluvium Qal1 Modern stream alluvium 1 288 Qal2 Modern stream alluvium 2 111
Qalp Stream alluvium related to the Provo (regressive) phase of Lake Bonneville
10
Qaly Stream alluvial deposits, undivided 15 Alluvial Fan Deposits Qaf2 Alluvial fan deposits 2 28 Qafy Alluvial fan deposits, undivided 6 Qafb Alluvial fan deposits of the Bonneville (transgressive) ph. 3 Qafo Older alluvial fan deposits, undivided 1 QTaf Oldest alluvial fan deposits 1 Young Lacustrine and Mixed-Environment Deposits Qly Lacustrine and marsh deposits 5 Qlaly Lacustrine, marsh and alluvial deposits 136 Lake Bonneville Lacustrine Deposits Qlpd Deltaic gravel of the Provo (regressive) phase 5 Qlpg Lac. gravel and sand of the Provo (regressive) phase 40 Qlps Lac. sand and silt of the Provo (regressive) phase 0 Qlpm Lac. clay and silt of the Provo (regressive) phase 0 Qlbg Lac. gravel and sand of the Bonneville (transgressive) ph. 14 Qlbs Lac. sand and silt of the Bonneville (transgressive) phase 1 Qlbm Lac. clay and silt of the Bonneville (transgressive) phase 5 Qlbpg Lac. gravel and sand of the Bonneville Lake cycle, undiv. 12 Qlbps Lac. sand and silt of the Bonneville Lake cycle, undiv. 5 Qlbpm Lac. silt and clay of the Bonneville Lake cycle, undivided 269 Colluvial Deposits Qclsp (Qmls)
Lateral spread deposits 2
Qca Colluvium and alluvium, undivided 1 Qes Eolian sand 1 Artificial Deposits Qf Artificial fill 0 Bedrock Ti Tertiary intrusive igneous rocks 0 Tn Tertiary sedimentary and volcanic rocks 0 Tp Tertiary sedimentary and volcanic rocks 0 Mz Mesozoic sedimentary rocks 1 Pz Paleozoic sedimentary rocks 2 pC Precambrian metamorphic rocks 0 Rock Pleistocene-Upper Mississippian limestone, shale, etc. 1

14
Figure 2. Locations of geotechnical boreholes contained in ArcGIS® geotechnical
database, Salt Lake Valley, Utah.

15
Because the subsurface information originated from a variety of sources and data
quality varied, a system was developed to assign data quality indicators to each individual
datum (Bartlett and others, 2005). In this system, a “1” was assigned to data where the
supporting information was well documented in the original geotechnical report. (In total
there were 2,261 fines content and 315 mean grain size measurements in the database that
had data quality rankings of “1.”) A data quality indicator of “2” was given to data that
could be reasonably estimated from nearby borehole logs for the same site, and a “3”
denoted data that were averaged from other nearby boreholes based on their soil type and
geologic unit. Missing soil unit weight, fines content and mean grain size data that could
not be estimated from nearby boreholes were averaged from high quality data within the
entire database. For these averages, a “4” was assigned to data that represent averaged
properties for the same soil type and geologic unit; and a “5” was assigned to data that
represent averaged properties for the same soil type irrespective of the geologic unit. (No
SPT penetration resistance data were averaged for this study; if such data were missing,
the borehole information was not used.)
A groundwater depth map is required for liquefaction, lateral spread and ground
settlement calculations. A comprehensive groundwater map did not exist for the mapped
area, nor was there sufficient historical data to accurately model groundwater depths and
fluctuations throughout the valley. Thus, the recorded groundwater depths from the
borehole logs were used to generate a groundwater map using an inverse distance square
interpolation method (Bartlett and others, 2005). To account for seasonal fluctuations,
the depth to groundwater was conservatively decreased by 5 feet in all boreholes. In

16 addition, if part of a soil layer was indicated on the borehole log to be saturated, the entire
layer was assumed to be saturated in the analyses.
Surface slope and nearby topographical features are important factors in
estimating lateral spread (Bartlett and Youd, 1992). A digital elevation model (DEM)
from the USGS and free face features such as river channels and canals were used in
ArcGIS® routines to approximate the surface slope and distance and height of a nearby
free face, if present, for each borehole location (Bartlett and others, 2005; Olsen and
others, 2007).

LIQUEFACTION HAZARD MAPPING Liquefaction ground failure maps were created for the Salt Lake Valley for lateral
spread and liquefaction-induced ground settlement based on a scenario M7.0 Wasatch
fault earthquake and for probabilistic events associated with PGA values corresponding
to a 2 percent probability of exceedance in 50 years and a 10 percent probability of
exceedance in 50 years. The PGA estimates for the M7.0 Wasatch fault scenario event
were obtained from Wong and others (2002) and the PGA estimates for the probabilistic
events were obtained from the USGS National Strong Motion Hazard Mapping Project
(Petersen and others, 2008). In accordance with the method and criteria proposed by
Seed and others (2001), the Petersen and others (2008) rock-based PGA estimates were
adjusted for surface soil effects based on the averaged shear wave velocities (Vs) assigned
to the several site-response units, as previously described.
Lateral Spread Map Development
The lateral spread maps presented herein are a continuation of work completed for
the northern part of the Salt Lake Valley by Bartlett and others (2005) and Olsen and
others (2007). The methods used for this paper are consistent with the methods
developed in those reports. In short, following the methods outlined in Youd and others
(2001), raw SPT blow count data were normalized and corrected to (N1)60 clean sand
values and liquefaction triggering analyses were completed at each borehole location.

18 Lateral spread displacements were estimated by the Youd and others (2002)
regression model. The model requires the following input: earthquake magnitude,
horizontal distance from the seismic source, distance to free face and height of free face
(if applicable), ground slope (if applicable), and cumulative thickness, average fines
content and mean grain size of all saturated granular layers with SPT (N1)60 blow counts
less than 15. The scenario analysis was based on a M7.0 earthquake on the Wasatch fault
(Wong and others, 2002) while input magnitudes and horizontal distances for the
probabilistic analyses varied based on deaggregations of the data presented by Petersen
and others (2008). All other input variables were obtained from the ArcGIS®
geotechnical database previously described.
Displacements were estimated at each borehole location having a factor of safety
against liquefaction triggering less than or equal to 1.1. All boreholes with factors of
safety against liquefaction triggering greater than 1.1 were assigned a lateral spread
displacement of 0 m. The estimated horizontal displacements (DH) were further
categorized as “minimal” (0 m); “low” (0 to 0.1 m); “moderate” (0.1 to 0.3 m); “high”
(0.3 to 1.0 m); and “very high” (greater than 1.0 m).
Hazard categories were assigned to the major surficial geologic units by statistical
analysis of the estimated displacements from all boreholes located within each respective
geologic unit or group of units representing similar characteristics (e.g., near-surface soil
type, origin, deposition and age). Using the method discussed by Bartlett and others
(2005) and Olsen and others (2007), cumulative histograms of increasing hazard severity
were developed to determine an 85 percent nonexceedance threshold for the scenario
event (see Appendix C). The 85 percent nonexceedance criterion means that no more

19 than 15 percent of the estimated displacements exceed the upper bound of the hazard
category that was assigned to the respective geologic unit or group of units and thus
approximately represents a mean plus one standard deviation criterion. For the
probabilistic-based maps, the hazard category assigned to each geologic unit or group of
units was based on the median estimated displacement for the respective unit.
In some areas, several clearly defined homogenous or nearly homogenous clusters
of similar displacement that differed from the remaining estimates were represented in
the same geologic unit. In these cases, the geologic units were subdivided prior to
conducting statistical analysis, so that the displacement estimates were more homogenous
locally. Several examples of statistical hazard category assessments are included in
Appendix C.
The liquefaction-induced lateral spread ground displacement map for the scenario
M7.0 Wasatch fault earthquake is presented in Figure 3 and the probabilistic-based maps
are presented in Figures 4 and 5. These maps are useful in identifying areas of high
ground displacement potential and areas where site-specific geotechnical investigation
and/or liquefaction mitigation are warranted.
Ground Settlement Map Development
Liquefaction-induced ground settlements were estimated by averaging the results
of Tokimatsu and Seed (1987) and the Yoshimine and others (2006) method which is
based on the methodology originally proposed by Ishihara and Yoshimine (1992). Both
methods estimate ground settlement based on SPT N values, which conveniently suits the
data

20
Figure 3. Lateral spread displacement hazard for the Salt Lake Valley, Utah based on
M7.0 scenario earthquake on the Salt Lake segment of the Wasatch fault and an 85 percent nonexceedance probability threshold.

21
Figure 4. Lateral spread displacement hazard for the Salt Lake Valley, Utah based on
the PGA associated with a 2 percent probability of exceedance in 50 years.

22
Figure 5. Lateral spread displacement hazard for the Salt Lake Valley, Utah based on
the PGA associated with a 10 percent probability of exceedance in 50 years.

23 available in the ArcGIS® geotechnical database. The following paragraphs describe each
method and the input data required to estimate settlement.
Tokimatsu and Seed (1987) estimate volumetric strain in saturated clean sands
based on cyclic stress ratio and SPT blow counts, (N1)60 (see Figure 6). The method is
based on correlations of field and laboratory performance data to post-liquefaction
settlements recorded after the Niigata 1964, Tokachioki 1968 and Miyagiken Oki 1968
earthquakes. For the purposes of our study, the curves presented in Figure 6 were
digitized into over 1,400 interpolated data points (see Appendix B).
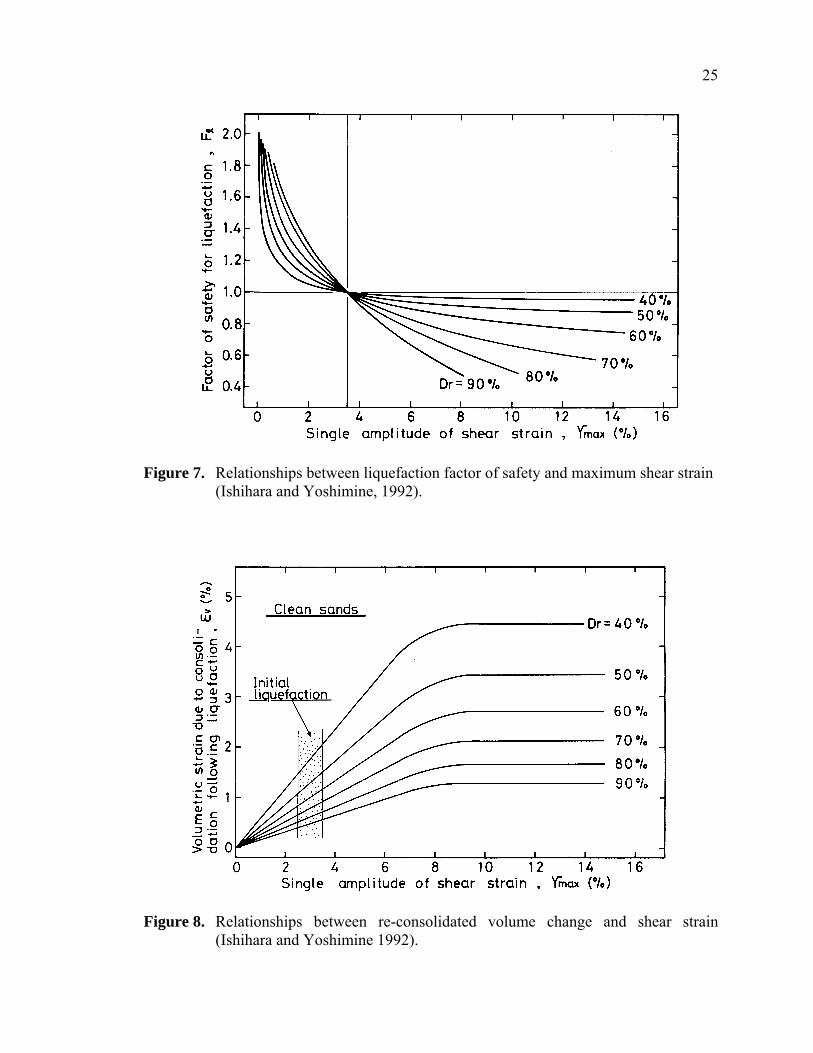
Yoshimine and others (2006) present a series of equations to describe the
liquefaction-induced volumetric strain prediction curves presented in Ishihara and
Yoshimine (1992). The curves were derived from strains observed in cyclic laboratory
testing performed by Nagase and Ishihara (1988) and correlate factor of safety against
liquefaction triggering to the maximum single amplitude of shear strain (max) based on
relative density which is estimated from Japanese-normalized blow SPT blow counts, N1
(Figure 7). The maximum single amplitude of shear strain is then used to estimate post-
liquefaction volumetric strain due to reconsolidation (Figure 8). The Yoshimine and
others (2006) equations were used in the ArcGIS® routines to facilitate rapid calculations
(see Appendix B).
To estimate liquefaction-induced settlement by Tokimatsu and Seed (1987), the
raw blow count data contained in the ArcGIS® geotechnical database were normalized
and corrected to (N1)60 clean sand values and liquefaction triggering analyses were
completed at each borehole location following the methods outlined in Youd and others
(2001). A reference table created from the data points interpolated from Figure 6 was

24
Figure 6. Relationships between (N1)60, cyclic stress ratio and volumetric strain for
saturated clean sands (Tokimatsu and Seed, 1987).
25
Figure 7. Relationships between liquefaction factor of safety and maximum shear strain (Ishihara and Yoshimine, 1992).
Figure 8. Relationships between re-consolidated volume change and shear strain
(Ishihara and Yoshimine 1992).

26 then used to estimate liquefaction-induced volumetric strains where the factor of safety
against liquefaction triggering was less than or equal to 1.1. The required input variables
consisted of (N1)60 values normalized and corrected to clean sands by Youd and others
(2001) and cyclic stress ratios calculated in accordance with the guidelines presented in
Tokimatsu and Seed (1987). Due to differences in event magnitude, the cyclic stress
ratios were scaled based on the magnitude scaling factors presented in Tokimatsu and
Seed (1987) which were taken from Seed and others (1983). The scenario analysis was
based on a M7.0 earthquake on the Wasatch fault while input magnitudes for the
probabilistic analyses varied based on deaggregations of the data presented by Petersen
and others (2008). Settlements were calculated by multiplying volumetric strains by the
thickness of each respective liquefiable soil layer. A ground settlement value of 0 m was
assigned to all locations with factors of safety for liquefaction triggering greater than 1.1.
To estimate liquefaction-induced settlement by Yoshimine and others (2006), the
raw blow count data contained in the ArcGIS® geotechnical database were normalized
and corrected to (N1)60 clean sand values following the methods outlined in Youd and
others (2001). To account for traditional Japanese sampling practices and techniques, the
(N1)60 clean sand blow count values were converted to N1 values following the guidelines
in Seed and others (1985). Following the method outlined by Yoshimine and others
(2006), the N1 values were converted to relative densities by Meyerhof (1957) and the
likelihood of liquefaction triggering was calculated based on the Japanese Design Code
for Highway Bridges (2000). Using the relative densities and the factors of safety against
liquefaction triggering, the maximum single amplitude of shear strain was calculated for
all sites with a factor of safety against liquefaction triggering less than or equal to 1.1.

27 Finally, liquefaction-induced volumetric strains were estimated by the relative densities
and the maximum single amplitude of shear strains. Settlements were calculated by
multiplying the volumetric strains by the thickness of each respective liquefiable soil
layer. A ground settlement value of 0 m was assigned to all locations with factors of
safety for liquefaction triggering greater than 1.1. Since earthquake magnitude was not a
required input variable, no magnitude scaling factors were used in this method.
The results from each method were compared at each borehole to determine if
there were significant differences in the settlement estimates. For example, the scenario
M7.0 earthquake settlement dataset showed an average difference between the two
methods of 0.004 m, with a maximum difference of 0.083 m. Of the 963 boreholes,
Tokimatsu and Seed (1987) predicted higher settlements than Yoshimine and others
(2006) in 232 boreholes and the opposite was true for 444 boreholes. Both methods
predicted no settlement in 287 boreholes. A method-to-method comparison of the
differences showed that 74 percent of the boreholes were within 0.01 m, 92 percent were
within 0.025 m and 99 percent were within 0.05 m. Hence, it was concluded that the two
methods produced relatively similar results when considering the quality of the input data
and the ultimate use of the mapping. Subsequently, the average of the two methods was
considered appropriate to estimate the ground settlement at each liquefiable borehole
location.
The ground settlement estimates were categorized as “low” (0 to 0.05 m);
“moderate” (0.05 to 0.1 m); ”high” (0.1 to 0.3 m); and “very high” (greater than 0.3 m).
Similar to the lateral spread displacement maps, hazard categories were assigned to the
major geologic units by statistical analysis of the estimated displacements from all

28 boreholes located within each respective geologic unit or group of units with similar
subsurface characteristics (e.g., near-surface soil type, origin, deposition and age). In
brief, the hazard category assignments for the M7.0 Wasatch fault scenario map were
based on an 85 percent nonexceedance criterion while the hazard categories for the
probabilistic maps were based on the median displacement within the respective geologic
unit or group of units.
The liquefaction-induced settlement ground displacement map for the scenario
M7.0 Wasatch fault earthquake is presented in Figure 9 and the probabilistic-based maps
are presented in Figures 10 and 11. These maps are useful in identifying areas of high
ground displacement potential and areas where site-specific geotechnical investigation
and/or liquefaction mitigation are warranted.
The 85 percent nonexceedance criterion used in the development of the scenario
map and the median displacements considered in the development of the probabilistic
maps represent the appropriate level of conservatism required for the proper
implementation of the maps as recommended by consensus of the Utah Liquefaction
Advisory Group (oral communs., 2009 and 2010). If a different degree of conservatism
is requested by the end-user of a respective jurisdiction, the maps can be easily and
quickly altered to reflect modified criteria. For example, a higher or lower
nonexceedance criterion could be used to create a more-conservative or less-conservative
map, respectively. However, it is recommended that the same map development methods
be used for grouping and categorizing individual geologic units. As previously
mentioned, additional details and examples of statistical hazard category assessments are
included in Appendix C.

29
Figure 9. Liquefaction-induced ground settlement hazard for the Salt Lake Valley, Utah
for a M7.0 scenario earthquake on the Salt Lake segment of the Wasatch fault and 85 percent nonexceedance probability threshold.

30
Figure 10. Liquefaction-induced ground settlement hazard in the Salt Lake Valley based
on the PGA associated with a 2 percent probability of exceedance in 50 years.

31
Figure 11. Liquefaction-induced ground settlement hazard in the Salt Lake Valley based
on the PGA associated with a 10 percent probability of exceedance in 50 years.

CONCLUSIONS The maps presented herein are the first liquefaction-induced ground failure maps
developed in Utah from an extensive geotechnical database that complements established
geological mapping. The maps were developed for a M7.0 event on the Wasatch fault
and two probabilistic-based events. The results of the hazard calculations suggest that
increased lateral spread and ground settlement hazard exists in the central part of the
valley along and near the Jordan River and in the northern eastern part of the valley. The
increased hazard in these areas is due to the presence of young, relatively loose granular
deposits and potentially shallow groundwater. The surficial geology in these areas
predominantly consists of recent alluvial/river/stream/lake deposits.
In general, the M7.0 scenario maps, which are based on an approximate 15
percent exceedance probability for ground displacement, show higher hazard than the
probabilistic-based scenario maps. In addition to nonexceedance criteria, other
differences in the displacement estimates are attributed to variations in the PGA values
used in developing the maps. Specifically, the M7.0 scenario event maps use PGA
estimates from Wong and others (2002) which are generally higher than the PGA
estimates obtained from the USGS National Seismic Hazard Mapping Project (Petersen
and others, 2008) for the 2 and 10 percent probabilities of exceedance in 50 years events.
The M7.0 scenario event maps are the preferred maps for preliminary planning
purposes because they have been developed for the characteristic earthquake on the Salt

33 Lake City segment of the Wasatch fault, and because they are conservative due to their
approximate 15 percent exceedance probability for ground displacement when compared
with the median displacement value used in developing the probabilistic-based maps.
However, some agencies such as UDOT, implement probabilistic-based events in
their design procedures. For critical or essential UDOT structures (i.e., lifeline bridges,
overpass structures and adjacent retaining walls), the 2 percent probability of exceedance
in 50 years hazard maps are more useful because the input PGA values (which represent
a 2,475-year return period) closely approximate the 3 percent probability of exceedance
in 75 years (2,462-year return period) PGA required by UDOT (UDOT, 2009).
The two probabilistic events included in this report are for a 2,475-year return
period and a 475-year return period (2 percent probability of exceedance in 50 years and
10 percent probability of exceedance in 50 years, respectively). However, for the design
of normal structures (e.g., highway retaining walls that do not impact a critical or
essential structure), UDOT has recently adopted the American Association of State
Highway and Transportation Officials (AASHTO, 2009) seismic design provisions which
are based on an approximate 1,000-year return period. Thus, it may be advantageous to
develop additional probabilistic-based ground failure hazard maps. It is recommended
that additional maps be developed following the analysis methods and map development
methods for grouping and categorizing individual geologic units detailed herein.
Lastly, it is hoped that this series of displacement-based liquefaction ground
failure maps will better aid in identifying seismic hazard and risk. Because the maps are
displacement based, they better represent the potential damage to built-environment than
previously published liquefaction maps.

APPENDIX A
DATABASE SUMMARY
35 The ArcGIS® geotechnical database used in this project contains 963 boreholes
located in the Salt Lake Valley. Because the liquefaction hazard maps are based on
established geological mapping, efforts were made to collect subsurface data from all
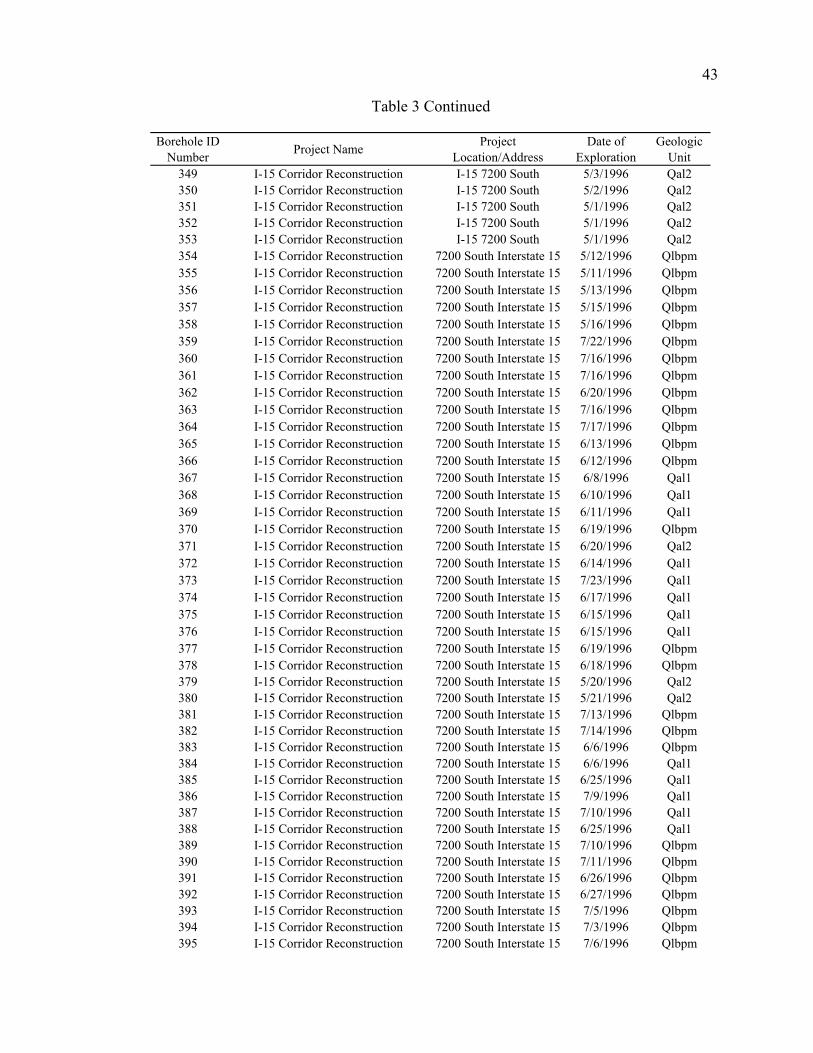
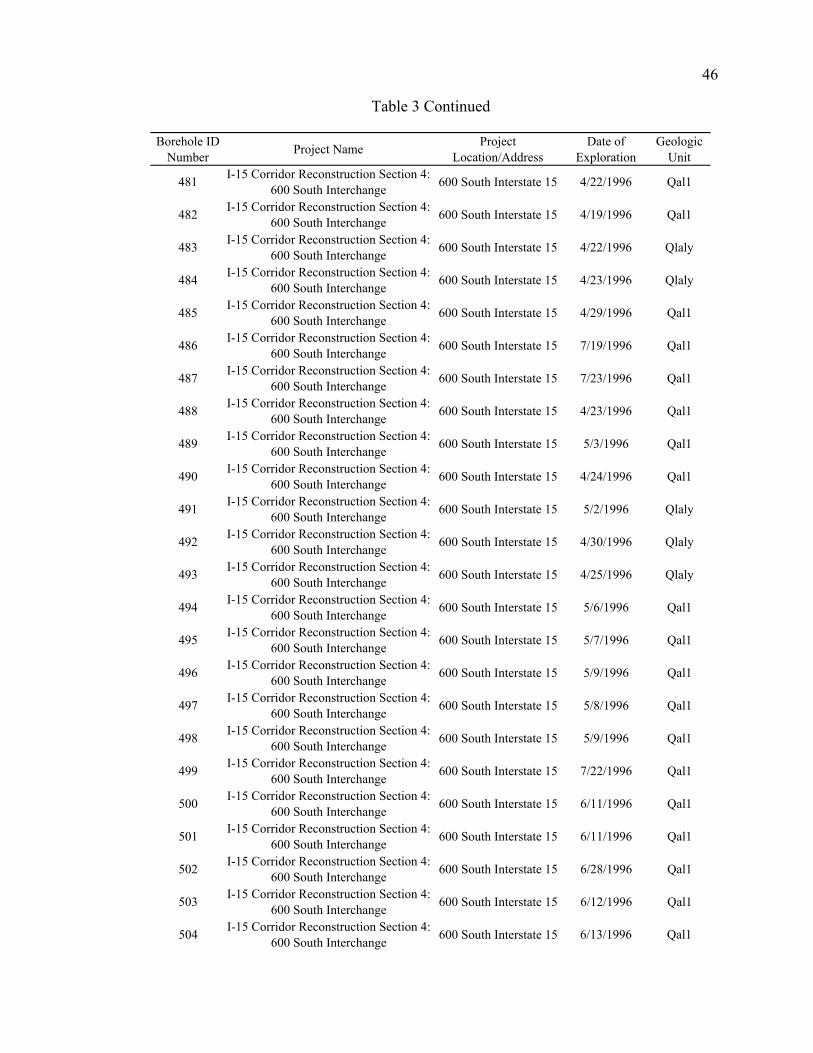
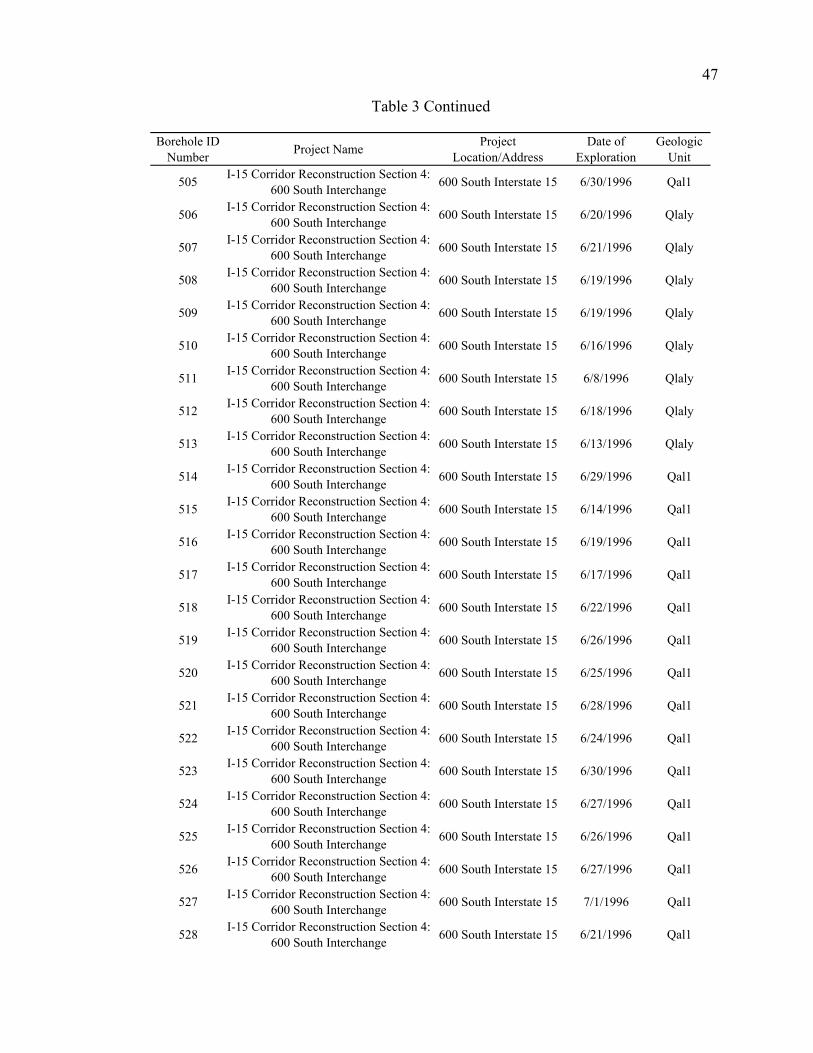
major geological units within the valley. Table 3 shows the borehole identification
number, project name, project location, date drilled (if available) and the respective
surficial geologic unit for each borehole. This information can be cross-referenced to the
tables in Appendix D where the calculated liquefaction-induced ground displacements are
listed by borehole identification number.

Borehole ID Number Project Name Project
Location/AddressDate of
ExplorationGeologic
Unit
1 SLCO- Sam Park Reservoir Improvements 3107 S 3300 E 3/11/1997 Qaf2
2 SLCO- Bennett Office 3362 S. Main St 3/17/1997 Qlbpm3 SLCO- Bennett Office 3362 S. Main St 3/17/1997 Qlbpm
4 SLCO- Salt Lake County/Jail Complex 881 W 3300 S 2/28/1996 Qal2
5 SLCO- Granite School Dist-Magna Elementary 8500 W 3100 S 1/20/1997 Qafy
6 SLCO- White Farm Village Sub 8003 W 2700 S 4/1/1999 Qafy
7 SLCO- US West Magna Building Addition 2662 S 9040 W 6/28/2000 Qafy
8 SLCO- Albertson's A-Express No. 0363-11AI 890 E 3300 S 10/20/1998 Qlaly
9 SLCO- Magna Jiffy Lube 3444 S 7200 W 2/21/2000 Qlbpm10 SLCO-Bud Bailey 3530 S Main St 3/27/1995 Qlbpm
11 SLCO- Michael Menlove Office/Warehouse Building 3555 S 700 W 12/18/1997 Qal2
12 SLCO- Alpha Trucking 1900 N Redwood Rd 6/10/1999 Qal113 SLCO-Proposed Building Addition 1805 W 500 S 3/12/1999 Qaly
14 SLCO-Sorensen Technology Park- Lots 20 and 21 1130 S 3800 W 6/26/1996 Qlaly
15 SLCO-Almond Street condominiums 255 N. Almond St 8/21/1996 Qaf216 SLCO-Union Pacific 100 S 400 W 5/1/6462 Qlaly17 SLCO- Proposed Office Warehouse 1850 S Freemont Drive 10/6/1997 Qaly18 SLCO- Praztek Partner 2100 S 4600 W 5/2/1991 Qlaly19 SLCO- Praztek Partner 1300 S 5600 W 5/8/1991 Qlaly20 SLCO- American Plaza 300 S Main St Qaf221 SLCO- Proposed Warehouse 46 S 1900 W Qaly
22 SLCO- SLC Public Utilities Water Tank 3875 S 3800 E 12/3/1991 Qafb
23 SLCO- SLC Cell Tower 2301 W 4805 S 12/18/1990 Qlbpm
24 SLCO- Dayna Office & Production Facility 4398 S Riverboat Dr 5/13/1992 Qlbpm
25 SLCO- Beckstrand & Associates 990 W Atherton Dr (4349 S) 11/18/1991 Qaly
26 SLCO- Park 'N Fly 1950 W 500 S 12/7/1998 Qaly27 DATS Trucking Inc Freight Terminal 2800 W 500 S 4/22/1998 Qlaly
28 SLCO- Salt Lake Int Center Liquefaction Study Plat 12 Lot 4 9/2/1997 Qlaly
29 SLCO- Westside Dixon Development 159 W 300 S 10/24/1997 Qlaly
30 SLCO- Hardman, Norman F Cell Comm. Facility 7462 W 2820 S 7/26/1991 Qlaly
31 SLCO- Proposed Subdivision 3411 S 700 E 5/7/1997 Qlbpm
32 SLCO- KESSLER, AL & SONS Dwelling Group 3454 S 500 E 11/18/1997 Qlbpg
33 SLCO- Joe Colosimo PUD 3362 S 1100 E 2/10/1999 Qlaly
Table 3
ArcGIS® Database Borehole Identification Information
36

Borehole ID Number Project Name Project
Location/AddressDate of
ExplorationGeologic
Unit34 SBI- Salt Palace Expansion 200 S West Temple 1/18/1999 Qaf2
35 SLCO- US West Communications Tower 2600 W 4700 S 5/1/1992 Qlbpg
36 SLCO- Superwash 4300 S Redwood Rd 8/19/1992 Qal237 SLCO-SLC Corp Water Tank 4500 S 2700 E 8/11/1998 Qaf2
38 SLCO- Robert Meyer Jay Sample PUD 7730 S. Forest Creek Lane 5/14/1999 Qlbg
39 SLCO- SLCO Fire Station 8295 S Wasatch Blvd (3680 E) 2/10/1998 Qca
40 SLCO- Kim Lamoreaux 2200 East 8200 South 8/5/1992 Qalp41 SLCO- Hercules 4797 S 9170 W QTaf
42 SLCO-Metropolitan Water District Generator Building 9000 S. Danish Rd 8/23/1996 Qaf2
43 SLCO-Duaine Rasmussen Apartment Units 7701 S Highland Dr Qes
44 SLCO-Duaine Rasmussen Apartment Units 7701 S Highland Dr Qlpg
45 SLCO-Duaine Rasmussen Apartment Units 7701 S Highland Dr Qlbg
46 SLCO-Duaine Rasmussen Apartment Units 7701 S Highland Dr Qlbg
47 SLCO- Granite Dist/Keith Bradshaw 3650 S. Montclaire St 12/17/1998 Qlbps48 SLC0- Davencourt PUD 4100 S 2200 W 2/8/1996 Qal249 SLCO-Valley View Condominiums 1850 E 3900 S 3/15/1996 Qlbpm50 UGS- East High School 840 S 1300 E 5/17/1990 Qlbpm51 UGS- Highland High School 2166 S 1700 E 5/25/1990 Qlpg52 UGS West High School 241 W 300 N 5/30/1990 Qaf253 UGS- Canyon View Park Subdivision Kennedy Drive 3/19/1985 Qlbg
54 UGS- Downhole Seismic Shear Wave Survey at IHC WVC, UT 2800 S 4600 W 4/23/1997 Qly
55 UGS- Soils Investigation High Rise Elderly Complex 2100 S State St 9/19/1972 Qlaly
56 UGS-Soil Foundation Investigation for Emergency Op Center
400 N State Office Building 8/1/1982 Qlbpg
57 UGS-Soil Foundation Report South Temple Condos 550 E South Temple 10/19/1979 Qmls
58 UGS-Geotechnical Investigation- Granite Furniture Dist Cent 3200 W Parkway Blvd 3/2/1994 Qlaly
59 UGS- Foundation Inv. LDS Hospital Parking Lot (R-H) B Street & 8th Ave 3/20/1987 Qlpg
60 UDOT- 33rd South Over I-415 33rd South and I-215 11/10/1966 Qlbm61 UDOT- Saltair to Airport 5600 W I-80 6/1/1973 Qlaly62 UDOT- Saltair to Airport 7200 W I-80 5/1/1972 Qlaly
63 UDOT- I-80 2nd West to Parley's Canyon 900 E I-80 5/21/1963 Qlaly
64 UDOT- Salt Lake City Belt Route 3500 S & I-215 11/27/1961 Qlaly65 UDOT- Salt Lake City Belt Route 2700 S & I-215 12/1/1961 Qaly66 UDOT- Salt Lake City Belt Route California Ave & I-215 12/4/1961 Qal1
Table 3 Continued
37

Borehole ID Number Project Name Project
Location/AddressDate of
ExplorationGeologic
Unit67 UDOT- Salt Lake City Belt Route 6th N & I-215 10/5/1961 Qaly68 UDOT- Salt Lake City Belt Route 17th N &I-215 10/16/1961 Qal1
69 UDOT- Salt Lake City Belt Route I-215 close to county border 10/18/1961 Qlaly
72 UDOT- Salt Lake City Belt Route I-215 North of 39th South 11/6/1961 Qalp
73 UDOT- Salt Lake City Belt Route I-215 & 3900 S 11/1/1961 Qalp74 UDOT- Salt Lake City Belt Route I-215 & 4500 S 10/31/1961 Qlbg
75 UGS- Air Traffic Control Tower and Base Building 1200 N 4000 W 7/1/1994 Qal1
76 UGS-SLC Water Reclamation Plant 1700 N 900 W 1/1/1990 Qlbpm
77 UGS- Center Street Bridge Foundation Report Cudnay Ave 11/25/1992 Qly
78 UGS-Reliance Warehouse & Office Building 1730 S 4370 W 5/17/1980 Qlaly
79 UGS- UEM 4 Property 1030 W 3110 S 9/25/1996 Qal1
80 UGS- Proposed Hotel Complex for Sinclair Oil Company 550 S Main Street 10/25/1995 Qlaly
81 UGS- Canyon Road Apartments Soil Investigation 2nd Ave Canyon Rd 1/1/1972 Qaf2
82 UGS-Fleming Foods Warehouse Addition 2205 W 1500 S 11/1/1994 Qaly
83 SLCO- Pleasant Green Subdivision 7306 W 3100 S Qlbpm84 SLCO- Copper Mountain Estates 8650 W 3500 S Qlbpg85 SLCO- 811 Housing Project 7986 W 3500 S 1/18/1996 Qlbps86 SLCO- Lambert Auto 398 E 3300 S 8/12/1996 Qlbpm87 SLCO- Michael's Mill Subdivision 900 E 3465 S 7/31/1997 Qlaly88 SLCO- Ensign Development Inc 7451 W 2820 S 11/4/1996 Qlpg
89 SLCO- Ruseler Multi-Family Development 3504 S 300 E Qlbpm
90 UGS- American Plaza 4&5 300 S Main St 9/24/1980 Qaf2
91 UDOT- 21rst So. Freeway 6th West to Pioneer Road 2100 S Redwood Rd Qaly
92 UDOT-I-80 9th West to SL Airport Foundation Investigation Jordan River I-80 Qal1
93 UDOT-I-80 9th West to SL Airport Foundation Investigation 34th West I-80 Qlaly
94 UDOT-I-80 9th West to SL Airport Foundation Investigation Railroad I-80 Qal1
95 SLCO- Amen Exist Seminary 3328 S 500 E Qlaly
96 UGS-Utah State Fairgrounds Foundation Investigation 1200 W 300 N 2/3/1981 Qal2
97 UGS- Soils Investigation for the Proposed College Inn SLC, U 100 S 1300 E 12/14/1996 Qaf2
98 UGS- Soil & Foundation Investigation Terra Tek Research Fac Wakara Way 10/24/1974 Qlbm
Table 3 Continued
38

Borehole ID Number Project Name Project
Location/AddressDate of
ExplorationGeologic
Unit
99 UGS-Soils Investigation for Fuel Op Facility UT Air National
F and E St 8th and 9th Streets SL Airport Qal1
100 UGS- Soils & Foundation Investigation Artco High Rise Struct 146 S Lincoln Ave 7/21/1980 Qaf2
101 UGS- Earth Slide Investigation Ensign School 13th Ave M St 5/31/1977 Qlbg
102 UGS0 Grand Salt Lake Mall 5600 W 700 S Qlaly
103 UGS- Foundation Investigation Tower Apartment Building No.2
Mouth of Emigration Canyon Qafb
104 UGS- S&F Investigation for LDS Church Printing Building 1700 S Industrial Rd 2/13/1986 Qaly
105 Site Characterization Report for Tailings Impoundment
Kennecott Tailings Impoundment 11/13/1990 Qlaly
106 Site Characterization Report for Tailings Impoundment
Kennecott Tailings Impoundment 11/15/1990 Qlaly
107 Site Characterization Report for Tailings Impoundment
Kennecott Tailings Impoundment 11/27/1990 Qly
108 Site Characterization Report for Tailings Impoundment
Kennecott Tailings Impoundment 12/1/1990 Qlaly
109 Site Characterization Report for Tailings Impoundment
Kennecott Tailings Impoundment 1/21/1991 Qlaly
110 Site Characterization Report for Tailings Impoundment
Kennecott Tailings Impoundment 1/12/1991 Qlaly
111 Site Characterization Report for Tailings Impoundment
Kennecott Tailings Impoundment 12/17/1990 Qlaly
112 Site Characterization Report for Tailings Impoundment
Kennecott Tailings Impoundment 12/7/1990 Qly
113 Site Characterization Report for Tailings Impoundment
Kennecott Tailings Impoundment 1/29/1991 Qlaly
134 UDOT I15 13th South I15 13th South 4/24/1996 Qal1135 UDOT I15 13th South I15 13th South 4/23/1996 Qal1136 UDOT I15 13th South I15 13th South 7/8/1996 Qal1137 UDOT I15 13th South I15 13th South 4/25/1996 Qal1138 UDOT I15 13th South I15 13th South 4/26/1996 Qal1139 UDOT I15 13th South I15 13th South 5/2/1996 Qal1140 UDOT I15 13th South I15 13th South 5/3/1996 Qal1141 UDOT I15 13th South I15 13th South 5/6/1996 Qal1142 UDOT I15 13th South I15 13th South 5/7/1996 Qal1143 UDOT I15 13th South I15 13th South 5/7/1996 Qal1144 UDOT I15 13th South I 15 13th South 4/28/1996 Qal1145 UDOT I15 13th South I 15 13th South 4/23/1996 Qal1146 UDOT I15 13th South I 15 13th South 3/29/1996 Qal1147 UDOT I15 13th South I 15 13th South 4/30/1996 Qal1148 UDOT I15 13th South I 15 13th South 4/25/1996 Qal1149 UDOT I15 13th South I 15 13th South 4/30/1996 Qal1150 UDOT I15 13th South I 15 13th South 5/1/1996 Qal1151 UDOT I15 13th South I 15 13th South 5/2/1996 Qal1152 UDOT I15 13th South I 15 13th South 5/2/1996 Qal1
Table 3 Continued
39

Borehole ID Number Project Name Project
Location/AddressDate of
ExplorationGeologic
Unit153 UDOT I15 13th South I 15 13th South 4/26/1996 Qal1154 UDOT I15 13th South I 15 13th South 6/12/1996 Qal1172 UDOT I15 24th South Section I 15 2400 S 3/18/1996 Qal1173 UDOT I15 24th South Section I 15 2400 S 3/20/1996 Qal1174 UDOT I15 24th South Section I 15 2400 S 4/3/1996 Qal1175 UDOT I15 24th South Section I 15 2400 S 3/26/1996 Qlaly176 UDOT I15 24th South Section I 15 2400 S 3/29/1996 Qlaly177 UDOT I15 24th South Section I 15 2400 S 3/28/1996 Qlaly178 UDOT I15 24th South Section I 15 2400 S 3/25/1996 Qal1179 UDOT I15 24th South Section I 15 2400 S 3/25/1996 Qal1180 UDOT I15 24th South Section I 15 2400 S 3/22/1996 Qal1181 UDOT I15 24th South Section I 15 2400 S 5/9/1996 Qal1182 UDOT I15 24th South Section I 15 2400 S 5/7/1996 Qal1183 UDOT I15 24th South Section I 15 2400 S 4/2/1996 Qal1184 UDOT I15 24th South Section I 15 2400 S 5/6/1996 Qal1185 UDOT I15 24th South Section I 15 2400 S 4/1/1996 Qal1186 UDOT I15 24th South Section I 15 2400 S 4/2/1996 Qal1187 UDOT I15 24th South Section I 15 2400 S 4/4/1996 Qal1188 UDOT I15 24th South Section I 15 2400 S 4/3/1996 Qal1189 UDOT I15 24th South Section I 15 2400 S 4/9/1996 Qal1190 UDOT I15 24th South Section I 15 2400 S 4/10/1996 Qal1191 UDOT I15 24th South Section I 15 2400 S 4/12/1996 Qal1192 UDOT I15 24th South Section I 15 2400 S 4/11/1996 Qal1193 UDOT I15 24th South Section I 15 2400 S 4/15/1996 Qal1194 UDOT I15 24th South Section I 15 2400 S 4/18/1996 Qal1195 UDOT I15 24th South Section I 15 2400 S 3/26/1996 Qal1196 UDOT I15 24th South Section I 15 2400 S 3/20/1996 Qal1197 UDOT I15 24th South Section I 15 2400 S 5/8/1996 Qal1198 UDOT I15 24th South Section I 15 2400 S 3/28/1996 Qal1199 UDOT I15 24th South Section I 15 2400 S 3/27/1996 Qal1200 UDOT I15 24th South Section I 15 2400 S 3/21/1996 Qal1201 UDOT I15 24th South Section I 15 2400 S 4/24/1996 Qal1202 UDOT I15 24th South Section I 15 2400 S 4/24/1996 Qal1203 UDOT I15 24th South Section I 15 2400 S 3/18/1996 Qal1204 UDOT I15 24th South Section I 15 2400 S 5/13/1996 Qal1205 UDOT I15 24th South Section I 15 2400 S 3/25/1996 Qal1206 UDOT I15 24th South Section I 15 2400 S 3/26/1996 Qal1207 UDOT I15 24th South Section I 15 2400 S 3/22/1996 Qal1208 UDOT I15 24th South Section I 15 2400 S 3/26/1996 Qal1209 UDOT I15 24th South Section I 15 2400 S 4/9/1996 Qal1210 UDOT I15 24th South Section I 15 2400 S 4/9/1996 Qal1211 UDOT I15 24th South Section I 15 2400 S 4/9/1996 Qal1212 UDOT I15 24th South Section I 15 2400 S 4/5/1996 Qal1213 UDOT I15 24th South Section I 15 2400 S 4/8/1996 Qal1214 UDOT I15 24th South Section I 15 2400 S 4/22/1996 Qal1215 UDOT I15 24th South Section I 15 2400 S 4/16/1996 Qal1216 UDOT I15 24th South Section I 15 2400 S 4/15/1996 Qal1217 UDOT I15 24th South Section I 15 2400 S 4/16/1996 Qal1
Table 3 Continued
40

Borehole ID Number Project Name Project
Location/AddressDate of
ExplorationGeologic
Unit218 UDOT I15 24th South Section I 15 2400 S 4/19/1996 Qal1219 UDOT I15 24th South Section I 15 2400 S 4/16/1996 Qal1220 UDOT I15 24th South Section I 15 2400 S 4/18/1996 Qal1221 UDOT I15 24th South Section I 15 2400 S 5/10/1996 Qlaly222 UDOT I15 24th South Section I 15 2400 S 4/1/1996 Qal1223 UDOT I15 24th South Section I 15 2400 S 6/10/1996 Qal1224 UDOT I15 24th South Section I 15 2400 S 4/17/1996 Qal1225 UDOT I15 24th South Section I 15 2400 S 5/9/1996 Qal1226 UDOT I15 24th South Section I 15 2400 S 5/13/1996 Qal1227 UDOT I15 24th South Section I 15 2400 S 4/4/1996 Qal1228 UDOT I15 24th South Section I 15 2400 S 5/3/1996 Qal1229 UDOT I15 24th South Section I 15 2400 S 4/3/1996 Qal1230 UDOT I15 24th South Section I 15 2400 S 4/11/1996 Qal1231 UDOT I15 24th South Section I 15 2400 S 4/8/1996 Qal1232 UDOT I15 24th South Section I 15 2400 S 4/29/1996 Qal1233 UDOT I15 24th South Section I 15 2400 S 4/29/1996 Qal1234 UDOT I15 24th South Section I 15 2400 S 7/11/1996 Qal1235 UDOT I15 24th South Section I 15 2400 S 7/11/1996 Qal1236 UDOT I15 24th South Section I 15 2400 S 4/1/1996 Qal1237 UDOT I15 24th South Section I 15 2400 S 5/14/1996 Qal1238 UDOT I15 24th South Section I 15 2400 S 3/21/1996 Qlaly239 UDOT I15 24th South Section I 15 2400 S 5/6/1996 Qal1240 UDOT I15 24th South Section I 15 2400 S 4/22/1996 Qal1241 UDOT I15 24th South Section I 15 2400 S 4/16/1996 Qlaly277 I-15 Corridor Reconstruction I-15 4500 South 5/21/1996 Qal1278 I-15 Corridor Reconstruction I-15 4500 South 5/21/1996 Qlbpm279 I-15 Corridor Reconstruction I-15 4500 South 5/21/1996 Qal1280 I-15 Corridor Reconstruction I-15 4500 South 6/17/1996 Qal1281 I-15 Corridor Reconstruction I-15 4500 South 5/22/1996 Qal1282 I-15 Corridor Reconstruction I-15 4500 South 5/23/1996 Qal1283 I-15 Corridor Reconstruction I-15 4500 South 5/16/1996 Qal1284 I-15 Corridor Reconstruction I-15 4500 South 6/4/1996 Qal1285 I-15 Corridor Reconstruction I-15 4500 South 5/28/1996 Qal1286 I-15 Corridor Reconstruction I-15 4500 South 7/14/1996 Qal1287 I-15 Corridor Reconstruction I-15 4500 South 7/14/1996 Qal1288 I-15 Corridor Reconstruction I-15 4500 South 5/22/1996 Qlbpm289 I-15 Corridor Reconstruction I-15 4500 South 5/23/1996 Qal1290 I-15 Corridor Reconstruction I-15 4500 South 6/11/1996 Qal1291 I-15 Corridor Reconstruction I-15 4500 South 5/29/1996 Qal1292 I-15 Corridor Reconstruction I-15 4500 South 5/22/1996 Qlbpm293 I-15 Corridor Reconstruction I-15 4500 South 5/23/1996 Qal1294 I-15 Corridor Reconstruction I-15 4500 South 6/17/1996 Qlbpm295 I-15 Corridor Reconstruction I-15 4500 South 6/17/1996 Qal1296 I-15 Corridor Reconstruction I-15 4500 South 6/17/1996 Qal1297 I-15 Corridor Reconstruction I-15 4500 South 5/22/1996 Qal1298 I-15 Corridor Reconstruction I-15 4500 South 5/18/1996 Qal1299 I-15 Corridor Reconstruction I-15 4500 South 5/28/1996 Qal1300 I-15 Corridor Reconstruction I-15 4500 South 5/28/1996 Qal1
Table 3 Continued
41
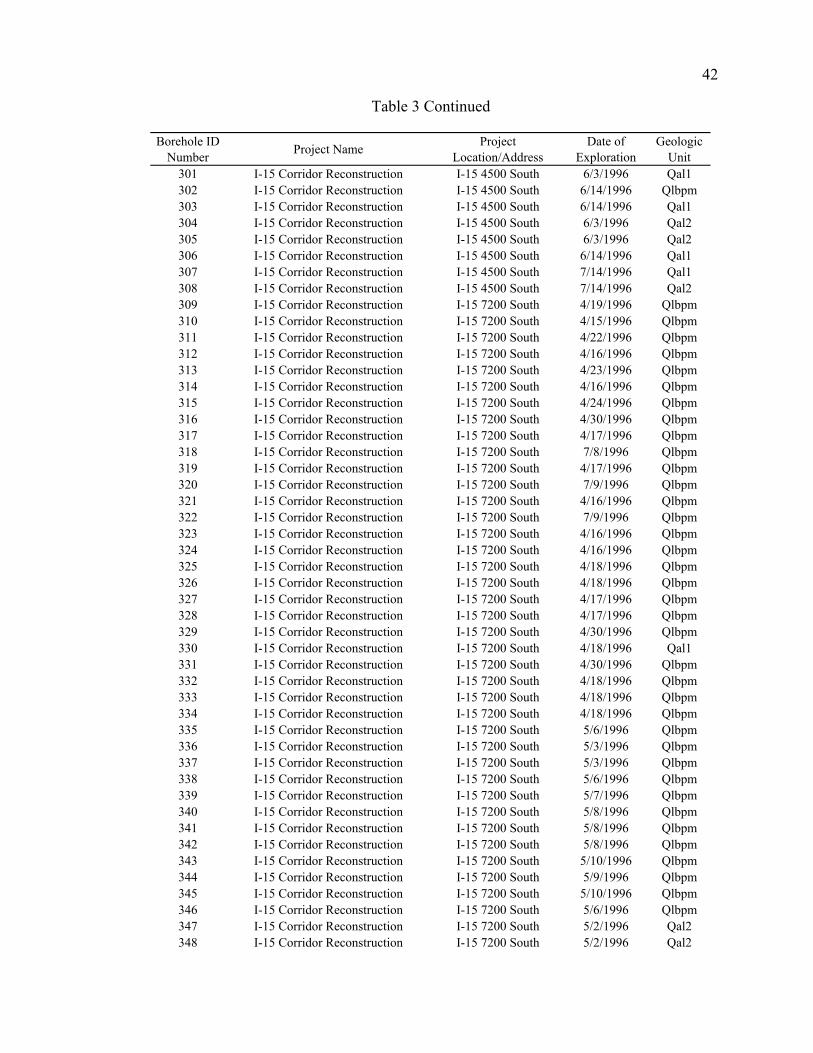
Borehole ID Number Project Name Project
Location/AddressDate of
ExplorationGeologic
Unit301 I-15 Corridor Reconstruction I-15 4500 South 6/3/1996 Qal1302 I-15 Corridor Reconstruction I-15 4500 South 6/14/1996 Qlbpm303 I-15 Corridor Reconstruction I-15 4500 South 6/14/1996 Qal1304 I-15 Corridor Reconstruction I-15 4500 South 6/3/1996 Qal2305 I-15 Corridor Reconstruction I-15 4500 South 6/3/1996 Qal2306 I-15 Corridor Reconstruction I-15 4500 South 6/14/1996 Qal1307 I-15 Corridor Reconstruction I-15 4500 South 7/14/1996 Qal1308 I-15 Corridor Reconstruction I-15 4500 South 7/14/1996 Qal2309 I-15 Corridor Reconstruction I-15 7200 South 4/19/1996 Qlbpm310 I-15 Corridor Reconstruction I-15 7200 South 4/15/1996 Qlbpm311 I-15 Corridor Reconstruction I-15 7200 South 4/22/1996 Qlbpm312 I-15 Corridor Reconstruction I-15 7200 South 4/16/1996 Qlbpm313 I-15 Corridor Reconstruction I-15 7200 South 4/23/1996 Qlbpm314 I-15 Corridor Reconstruction I-15 7200 South 4/16/1996 Qlbpm315 I-15 Corridor Reconstruction I-15 7200 South 4/24/1996 Qlbpm316 I-15 Corridor Reconstruction I-15 7200 South 4/30/1996 Qlbpm317 I-15 Corridor Reconstruction I-15 7200 South 4/17/1996 Qlbpm318 I-15 Corridor Reconstruction I-15 7200 South 7/8/1996 Qlbpm319 I-15 Corridor Reconstruction I-15 7200 South 4/17/1996 Qlbpm320 I-15 Corridor Reconstruction I-15 7200 South 7/9/1996 Qlbpm321 I-15 Corridor Reconstruction I-15 7200 South 4/16/1996 Qlbpm322 I-15 Corridor Reconstruction I-15 7200 South 7/9/1996 Qlbpm323 I-15 Corridor Reconstruction I-15 7200 South 4/16/1996 Qlbpm324 I-15 Corridor Reconstruction I-15 7200 South 4/16/1996 Qlbpm325 I-15 Corridor Reconstruction I-15 7200 South 4/18/1996 Qlbpm326 I-15 Corridor Reconstruction I-15 7200 South 4/18/1996 Qlbpm327 I-15 Corridor Reconstruction I-15 7200 South 4/17/1996 Qlbpm328 I-15 Corridor Reconstruction I-15 7200 South 4/17/1996 Qlbpm329 I-15 Corridor Reconstruction I-15 7200 South 4/30/1996 Qlbpm330 I-15 Corridor Reconstruction I-15 7200 South 4/18/1996 Qal1331 I-15 Corridor Reconstruction I-15 7200 South 4/30/1996 Qlbpm332 I-15 Corridor Reconstruction I-15 7200 South 4/18/1996 Qlbpm333 I-15 Corridor Reconstruction I-15 7200 South 4/18/1996 Qlbpm334 I-15 Corridor Reconstruction I-15 7200 South 4/18/1996 Qlbpm335 I-15 Corridor Reconstruction I-15 7200 South 5/6/1996 Qlbpm336 I-15 Corridor Reconstruction I-15 7200 South 5/3/1996 Qlbpm337 I-15 Corridor Reconstruction I-15 7200 South 5/3/1996 Qlbpm338 I-15 Corridor Reconstruction I-15 7200 South 5/6/1996 Qlbpm339 I-15 Corridor Reconstruction I-15 7200 South 5/7/1996 Qlbpm340 I-15 Corridor Reconstruction I-15 7200 South 5/8/1996 Qlbpm341 I-15 Corridor Reconstruction I-15 7200 South 5/8/1996 Qlbpm342 I-15 Corridor Reconstruction I-15 7200 South 5/8/1996 Qlbpm343 I-15 Corridor Reconstruction I-15 7200 South 5/10/1996 Qlbpm344 I-15 Corridor Reconstruction I-15 7200 South 5/9/1996 Qlbpm345 I-15 Corridor Reconstruction I-15 7200 South 5/10/1996 Qlbpm346 I-15 Corridor Reconstruction I-15 7200 South 5/6/1996 Qlbpm347 I-15 Corridor Reconstruction I-15 7200 South 5/2/1996 Qal2348 I-15 Corridor Reconstruction I-15 7200 South 5/2/1996 Qal2
Table 3 Continued
42
Borehole ID Number Project Name Project
Location/AddressDate of
ExplorationGeologic
Unit349 I-15 Corridor Reconstruction I-15 7200 South 5/3/1996 Qal2350 I-15 Corridor Reconstruction I-15 7200 South 5/2/1996 Qal2351 I-15 Corridor Reconstruction I-15 7200 South 5/1/1996 Qal2352 I-15 Corridor Reconstruction I-15 7200 South 5/1/1996 Qal2353 I-15 Corridor Reconstruction I-15 7200 South 5/1/1996 Qal2354 I-15 Corridor Reconstruction 7200 South Interstate 15 5/12/1996 Qlbpm355 I-15 Corridor Reconstruction 7200 South Interstate 15 5/11/1996 Qlbpm356 I-15 Corridor Reconstruction 7200 South Interstate 15 5/13/1996 Qlbpm357 I-15 Corridor Reconstruction 7200 South Interstate 15 5/15/1996 Qlbpm358 I-15 Corridor Reconstruction 7200 South Interstate 15 5/16/1996 Qlbpm359 I-15 Corridor Reconstruction 7200 South Interstate 15 7/22/1996 Qlbpm360 I-15 Corridor Reconstruction 7200 South Interstate 15 7/16/1996 Qlbpm361 I-15 Corridor Reconstruction 7200 South Interstate 15 7/16/1996 Qlbpm362 I-15 Corridor Reconstruction 7200 South Interstate 15 6/20/1996 Qlbpm363 I-15 Corridor Reconstruction 7200 South Interstate 15 7/16/1996 Qlbpm364 I-15 Corridor Reconstruction 7200 South Interstate 15 7/17/1996 Qlbpm365 I-15 Corridor Reconstruction 7200 South Interstate 15 6/13/1996 Qlbpm366 I-15 Corridor Reconstruction 7200 South Interstate 15 6/12/1996 Qlbpm367 I-15 Corridor Reconstruction 7200 South Interstate 15 6/8/1996 Qal1368 I-15 Corridor Reconstruction 7200 South Interstate 15 6/10/1996 Qal1369 I-15 Corridor Reconstruction 7200 South Interstate 15 6/11/1996 Qal1370 I-15 Corridor Reconstruction 7200 South Interstate 15 6/19/1996 Qlbpm371 I-15 Corridor Reconstruction 7200 South Interstate 15 6/20/1996 Qal2372 I-15 Corridor Reconstruction 7200 South Interstate 15 6/14/1996 Qal1373 I-15 Corridor Reconstruction 7200 South Interstate 15 7/23/1996 Qal1374 I-15 Corridor Reconstruction 7200 South Interstate 15 6/17/1996 Qal1375 I-15 Corridor Reconstruction 7200 South Interstate 15 6/15/1996 Qal1376 I-15 Corridor Reconstruction 7200 South Interstate 15 6/15/1996 Qal1377 I-15 Corridor Reconstruction 7200 South Interstate 15 6/19/1996 Qlbpm378 I-15 Corridor Reconstruction 7200 South Interstate 15 6/18/1996 Qlbpm379 I-15 Corridor Reconstruction 7200 South Interstate 15 5/20/1996 Qal2380 I-15 Corridor Reconstruction 7200 South Interstate 15 5/21/1996 Qal2381 I-15 Corridor Reconstruction 7200 South Interstate 15 7/13/1996 Qlbpm382 I-15 Corridor Reconstruction 7200 South Interstate 15 7/14/1996 Qlbpm383 I-15 Corridor Reconstruction 7200 South Interstate 15 6/6/1996 Qlbpm384 I-15 Corridor Reconstruction 7200 South Interstate 15 6/6/1996 Qal1385 I-15 Corridor Reconstruction 7200 South Interstate 15 6/25/1996 Qal1386 I-15 Corridor Reconstruction 7200 South Interstate 15 7/9/1996 Qal1387 I-15 Corridor Reconstruction 7200 South Interstate 15 7/10/1996 Qal1388 I-15 Corridor Reconstruction 7200 South Interstate 15 6/25/1996 Qal1389 I-15 Corridor Reconstruction 7200 South Interstate 15 7/10/1996 Qlbpm390 I-15 Corridor Reconstruction 7200 South Interstate 15 7/11/1996 Qlbpm391 I-15 Corridor Reconstruction 7200 South Interstate 15 6/26/1996 Qlbpm392 I-15 Corridor Reconstruction 7200 South Interstate 15 6/27/1996 Qlbpm393 I-15 Corridor Reconstruction 7200 South Interstate 15 7/5/1996 Qlbpm394 I-15 Corridor Reconstruction 7200 South Interstate 15 7/3/1996 Qlbpm395 I-15 Corridor Reconstruction 7200 South Interstate 15 7/6/1996 Qlbpm
Table 3 Continued
43

Borehole ID Number Project Name Project
Location/AddressDate of
ExplorationGeologic
Unit396 I-15 Corridor Reconstruction 7200 South Interstate 15 7/1/1996 Qlbpm397 I-15 Corridor Reconstruction 7200 South Interstate 15 7/5/1996 Qlbpm398 I-15 Corridor Reconstruction 7200 South Interstate 15 6/29/1996 Qlbpm399 I-15 Corridor Reconstruction 7200 South Interstate 15 6/29/1996 Qlbpm400 I-15 Corridor Reconstruction 7200 South Interstate 15 6/28/1996 Qlbpm401 I-15 Corridor Reconstruction 7200 South Interstate 15 6/28/1996 Qlbpm402 I-15 Corridor Reconstruction 7200 South Interstate 15 6/28/1996 Qlbpm403 I-15 Corridor Reconstruction 7200 South Interstate 15 7/3/1996 Qlbpm404 I-15 Corridor Reconstruction 7200 South Interstate 15 7/25/1996 Qlbpm405 I-15 Corridor Reconstruction 7200 South Interstate 15 4/19/1996 Qlbpm406 I-15 Corridor Reconstruction 7200 South Interstate 15 4/22/1996 Qlbpm407 I-15 Corridor Reconstruction 7200 South Interstate 15 4/23/1996 Qlbpm408 I-15 Corridor Reconstruction 7200 South Interstate 15 4/24/1996 Qlbpm409 I-15 Corridor Reconstruction 7200 South Interstate 15 4/25/1996 Qlbpm410 I-15 Corridor Reconstruction 7200 South Interstate 15 7/23/1996 Qlbpm411 I-15 Corridor Reconstruction 7200 South Interstate 15 4/29/1996 Qlbpm412 I-15 Corridor Reconstruction 7200 South Interstate 15 4/27/1996 Qlbpm413 I-15 Corridor Reconstruction 7200 South Interstate 15 7/24/1996 Qlbpm414 I-15 Corridor Reconstruction 7200 South Interstate 15 4/26/1996 Qlbpm415 I-15 Corridor Reconstruction 7200 South Interstate 15 5/17/1996 Qlbpm416 I-15 Corridor Reconstruction 7200 South Interstate 15 5/29/1996 Qlbpm417 I-15 Corridor Reconstruction 7200 South Interstate 15 5/27/1996 Qlbpm418 I-15 Corridor Reconstruction 7200 South Interstate 15 5/18/1996 Qlbpm419 I-15 Corridor Reconstruction 7200 South Interstate 15 7/2/1996 Qlbpm420 I-15 Corridor Reconstruction 7200 South Interstate 15 7/1/1996 Qlbpm421 I-15 Corridor Reconstruction 7200 South Interstate 15 7/6/1996 Qlbpm422 I-15 Corridor Reconstruction 7200 South Interstate 15 7/22/1996 Qlbpm423 I-15 Corridor Reconstruction 7200 South Interstate 15 6/26/1996 Qlbpm424 I-15 Corridor Reconstruction 7200 South Interstate 15 7/2/1996 Qlbpm425 I-15 Corridor Reconstruction 7200 South Interstate 15 7/1/1996 Qlbpm426 I-15 Corridor Reconstruction 7200 South Interstate 15 7/11/1996 Qlbpm427 I-15 Corridor Reconstruction 7200 South Interstate 15 7/25/1996 Qlbpm428 I-15 Corridor Reconstruction 7200 South Interstate 15 7/8/1996 Qlbpm429 I-15 Corridor Reconstruction 7200 South Interstate 15 7/12/1996 Qal1430 I-15 Corridor Reconstruction 7200 South Interstate 15 7/28/1996 Qal1431 I-15 Corridor Reconstruction 7200 South Interstate 15 6/24/1996 Qal1432 I-15 Corridor Reconstruction 7200 South Interstate 15 6/11/1996 Qal1433 I-15 Corridor Reconstruction 7200 South Interstate 15 7/20/1996 Qal1434 I-15 Corridor Reconstruction 7200 South Interstate 15 7/21/1996 Qal1435 I-15 Corridor Reconstruction 7200 South Interstate 15 5/31/1996 Qal1436 I-15 Corridor Reconstruction 7200 South Interstate 15 5/29/1996 Qal1437 I-15 Corridor Reconstruction 7200 South Interstate 15 6/1/1996 Qlbpm438 I-15 Corridor Reconstruction 7200 South Interstate 15 5/25/1996 Qlbpm439 I-15 Corridor Reconstruction 7200 South Interstate 15 7/26/1996 Qal1440 I-15 Corridor Reconstruction 7200 South Interstate 15 5/22/1996 Qlbpm441 I-15 Corridor Reconstruction 7200 South Interstate 15 5/24/1996 Qlbpm442 I-15 Corridor Reconstruction 7200 South Interstate 15 6/4/1996 Qlbpm443 I-15 Corridor Reconstruction 7200 South Interstate 15 6/1/1996 Qlbpm
Table 3 Continued
44

Borehole ID Number Project Name Project
Location/AddressDate of
ExplorationGeologic
Unit444 I-15 Corridor Reconstruction 7200 South Interstate 15 6/3/1996 Qlbpm445 I-15 Corridor Reconstruction 7200 South Interstate 15 6/8/1996 Qlbpm446 I-15 Corridor Reconstruction 7200 South Interstate 15 6/5/1996 Qlbpm447 I-15 Corridor Reconstruction 7200 South Interstate 15 5/23/1996 Qlbpm448 I-15 Corridor Reconstruction 7200 South Interstate 15 6/19/1996 Qal1
459 I-15 Corridor Reconstruction Section 4: 600 South Interchange 600 South Interstate 15 4/2/1996 Qal1
460 I-15 Corridor Reconstruction Section 4: 600 South Interchange 600 South Interstate 15 4/2/1996 Qal1
461 I-15 Corridor Reconstruction Section 4: 600 South Interchange 600 South Interstate 15 4/3/1996 Qlaly
462 I-15 Corridor Reconstruction Section 4: 600 South Interchange 600 South Interstate 15 4/30/1996 Qlaly
463 I-15 Corridor Reconstruction Section 4: 600 South Interchange 600 South Interstate 15 4/12/1996 Qlaly
464 I-15 Corridor Reconstruction Section 4: 600 South Interchange 600 South Interstate 15 5/1/1996 Qlaly
465 I-15 Corridor Reconstruction Section 4: 600 South Interchange 600 South Interstate 15 4/15/1996 Qal1
466 I-15 Corridor Reconstruction Section 4: 600 South Interchange 600 South Interstate 15 4/15/1996 Qal1
467 I-15 Corridor Reconstruction Section 4: 600 South Interchange 600 South Interstate 15 5/13/1996 Qal1
468 I-15 Corridor Reconstruction Section 4: 600 South Interchange 600 South Interstate 15 4/29/1996 Qlaly
470 I-15 Corridor Reconstruction Section 4: 600 South Interchange 600 South Interstate 15 4/18/1996 Qlaly
471 I-15 Corridor Reconstruction Section 4: 600 South Interchange 600 South Interstate 15 4/19/1996 Qlaly
472 I-15 Corridor Reconstruction Section 4: 600 South Interchange 600 South Interstate 15 4/5/1996 Qlaly
473 I-15 Corridor Reconstruction Section 4: 600 South Interchange 600 South Interstate 15 4/8/1996 Qlaly
474 I-15 Corridor Reconstruction Section 4: 600 South Interchange 600 South Interstate 15 4/10/1996 Qal1
475 I-15 Corridor Reconstruction Section 4: 600 South Interchange 600 South Interstate 15 4/16/1996 Qlaly
476 I-15 Corridor Reconstruction Section 4: 600 South Interchange 600 South Interstate 15 4/15/1996 Qlaly
477 I-15 Corridor Reconstruction Section 4: 600 South Interchange 600 South Interstate 15 4/11/1996 Qlaly
478 I-15 Corridor Reconstruction Section 4: 600 South Interchange 600 South Interstate 15 4/17/1996 Qal1
479 I-15 Corridor Reconstruction Section 4: 600 South Interchange 600 South Interstate 15 7/18/1996 Qal1
480 I-15 Corridor Reconstruction Section 4: 600 South Interchange 600 South Interstate 15 4/10/1996 Qal1
Table 3 Continued
45
Borehole ID Number Project Name Project
Location/AddressDate of
ExplorationGeologic
Unit
481 I-15 Corridor Reconstruction Section 4: 600 South Interchange 600 South Interstate 15 4/22/1996 Qal1
482 I-15 Corridor Reconstruction Section 4: 600 South Interchange 600 South Interstate 15 4/19/1996 Qal1
483 I-15 Corridor Reconstruction Section 4: 600 South Interchange 600 South Interstate 15 4/22/1996 Qlaly
484 I-15 Corridor Reconstruction Section 4: 600 South Interchange 600 South Interstate 15 4/23/1996 Qlaly
485 I-15 Corridor Reconstruction Section 4: 600 South Interchange 600 South Interstate 15 4/29/1996 Qal1
486 I-15 Corridor Reconstruction Section 4: 600 South Interchange 600 South Interstate 15 7/19/1996 Qal1
487 I-15 Corridor Reconstruction Section 4: 600 South Interchange 600 South Interstate 15 7/23/1996 Qal1
488 I-15 Corridor Reconstruction Section 4: 600 South Interchange 600 South Interstate 15 4/23/1996 Qal1
489 I-15 Corridor Reconstruction Section 4: 600 South Interchange 600 South Interstate 15 5/3/1996 Qal1
490 I-15 Corridor Reconstruction Section 4: 600 South Interchange 600 South Interstate 15 4/24/1996 Qal1
491 I-15 Corridor Reconstruction Section 4: 600 South Interchange 600 South Interstate 15 5/2/1996 Qlaly
492 I-15 Corridor Reconstruction Section 4: 600 South Interchange 600 South Interstate 15 4/30/1996 Qlaly
493 I-15 Corridor Reconstruction Section 4: 600 South Interchange 600 South Interstate 15 4/25/1996 Qlaly
494 I-15 Corridor Reconstruction Section 4: 600 South Interchange 600 South Interstate 15 5/6/1996 Qal1
495 I-15 Corridor Reconstruction Section 4: 600 South Interchange 600 South Interstate 15 5/7/1996 Qal1
496 I-15 Corridor Reconstruction Section 4: 600 South Interchange 600 South Interstate 15 5/9/1996 Qal1
497 I-15 Corridor Reconstruction Section 4: 600 South Interchange 600 South Interstate 15 5/8/1996 Qal1
498 I-15 Corridor Reconstruction Section 4: 600 South Interchange 600 South Interstate 15 5/9/1996 Qal1
499 I-15 Corridor Reconstruction Section 4: 600 South Interchange 600 South Interstate 15 7/22/1996 Qal1
500 I-15 Corridor Reconstruction Section 4: 600 South Interchange 600 South Interstate 15 6/11/1996 Qal1
501 I-15 Corridor Reconstruction Section 4: 600 South Interchange 600 South Interstate 15 6/11/1996 Qal1
502 I-15 Corridor Reconstruction Section 4: 600 South Interchange 600 South Interstate 15 6/28/1996 Qal1
503 I-15 Corridor Reconstruction Section 4: 600 South Interchange 600 South Interstate 15 6/12/1996 Qal1
504 I-15 Corridor Reconstruction Section 4: 600 South Interchange 600 South Interstate 15 6/13/1996 Qal1
Table 3 Continued
46
Borehole ID Number Project Name Project
Location/AddressDate of
ExplorationGeologic
Unit
505 I-15 Corridor Reconstruction Section 4: 600 South Interchange 600 South Interstate 15 6/30/1996 Qal1
506 I-15 Corridor Reconstruction Section 4: 600 South Interchange 600 South Interstate 15 6/20/1996 Qlaly
507 I-15 Corridor Reconstruction Section 4: 600 South Interchange 600 South Interstate 15 6/21/1996 Qlaly
508 I-15 Corridor Reconstruction Section 4: 600 South Interchange 600 South Interstate 15 6/19/1996 Qlaly
509 I-15 Corridor Reconstruction Section 4: 600 South Interchange 600 South Interstate 15 6/19/1996 Qlaly
510 I-15 Corridor Reconstruction Section 4: 600 South Interchange 600 South Interstate 15 6/16/1996 Qlaly
511 I-15 Corridor Reconstruction Section 4: 600 South Interchange 600 South Interstate 15 6/8/1996 Qlaly
512 I-15 Corridor Reconstruction Section 4: 600 South Interchange 600 South Interstate 15 6/18/1996 Qlaly
513 I-15 Corridor Reconstruction Section 4: 600 South Interchange 600 South Interstate 15 6/13/1996 Qlaly
514 I-15 Corridor Reconstruction Section 4: 600 South Interchange 600 South Interstate 15 6/29/1996 Qal1
515 I-15 Corridor Reconstruction Section 4: 600 South Interchange 600 South Interstate 15 6/14/1996 Qal1
516 I-15 Corridor Reconstruction Section 4: 600 South Interchange 600 South Interstate 15 6/19/1996 Qal1
517 I-15 Corridor Reconstruction Section 4: 600 South Interchange 600 South Interstate 15 6/17/1996 Qal1
518 I-15 Corridor Reconstruction Section 4: 600 South Interchange 600 South Interstate 15 6/22/1996 Qal1
519 I-15 Corridor Reconstruction Section 4: 600 South Interchange 600 South Interstate 15 6/26/1996 Qal1
520 I-15 Corridor Reconstruction Section 4: 600 South Interchange 600 South Interstate 15 6/25/1996 Qal1
521 I-15 Corridor Reconstruction Section 4: 600 South Interchange 600 South Interstate 15 6/28/1996 Qal1
522 I-15 Corridor Reconstruction Section 4: 600 South Interchange 600 South Interstate 15 6/24/1996 Qal1
523 I-15 Corridor Reconstruction Section 4: 600 South Interchange 600 South Interstate 15 6/30/1996 Qal1
524 I-15 Corridor Reconstruction Section 4: 600 South Interchange 600 South Interstate 15 6/27/1996 Qal1
525 I-15 Corridor Reconstruction Section 4: 600 South Interchange 600 South Interstate 15 6/26/1996 Qal1
526 I-15 Corridor Reconstruction Section 4: 600 South Interchange 600 South Interstate 15 6/27/1996 Qal1
527 I-15 Corridor Reconstruction Section 4: 600 South Interchange 600 South Interstate 15 7/1/1996 Qal1
528 I-15 Corridor Reconstruction Section 4: 600 South Interchange 600 South Interstate 15 6/21/1996 Qal1
Table 3 Continued
47

Borehole ID Number Project Name Project
Location/AddressDate of
ExplorationGeologic
Unit
529 I-15 Corridor Reconstruction Section 4: 600 South Interchange 600 South Interstate 15 7/2/1996 Qal1
530 I-15 Corridor Reconstruction Section 4: 600 South Interchange 600 South Interstate 15 6/23/1996 Qal1
531 I-15 Corridor Reconstruction Section 4: 600 South Interchange 600 South Interstate 15 6/30/1996 Qlaly
532 I-15 Corridor Reconstruction Section 4: 600 South Interchange 600 South Interstate 15 4/18/1996 Qlaly
533 I-15 Corridor Reconstruction Section 4: 600 South Interchange 600 South Interstate 15 4/29/1996 Qlaly
534 I-15 Corridor Reconstruction Section 4: 600 South Interchange 600 South Interstate 15 6/28/1996 Qal1
535 I-15 Corridor Reconstruction Section 4: 600 South Interchange 600 South Interstate 15 6/25/1996 Qal1
536 I-15 Corridor Reconstruction Section 4: 600 South Interchange 600 South Interstate 15 6/13/1996 Qal1
537 I-15 Corridor Reconstruction Section 4: 600 South Interchange 600 South Interstate 15 6/13/1996 Qal1
538 I-15 Corridor Reconstruction Section 4: 600 South Interchange 600 South Interstate 15 6/25/1996 Qlaly
539 I-15 Corridor Reconstruction Section 4: 600 South Interchange 600 South Interstate 15 6/25/1996 Qlaly
540 I-15 Corridor Reconstruction Section 4: 600 South Interchange 600 South Interstate 15 6/29/1996 Qal1
541 I-15 Corridor Reconstruction Section 4: 600 South Interchange 600 South Interstate 15 6/28/1996 Qal1
542 I-15 Corridor Reconstruction Section 4: 600 South Interchange 600 South Interstate 15 6/28/1996 Qal1
543 I-15 Corridor Reconstruction Section 4: 600 South Interchange 600 South Interstate 15 6/27/1996 Qal1
544 I-15 Corridor Reconstruction Section 4: 600 South Interchange 600 South Interstate 15 6/25/1996 Qal1
545 I-15 Corridor Reconstruction Section 4: 600 South Interchange 600 South Interstate 15 6/26/1996 Qal1
546 I-15 Corridor Reconstruction Section 4: 600 South Interchange 600 South Interstate 15 6/28/1996 Qal1
547 I-15 Corridor Reconstruction Section 4: 600 South Interchange 600 South Interstate 15 6/27/1996 Qal1
548 I-15 Corridor Reconstruction Section 4: 600 South Interchange 600 South Interstate 15 6/27/1996 Qal1
549 I-15 Corridor Reconstruction Section 4: 600 South Interchange 600 South Interstate 15 6/26/1996 Qal1
550 I-15 Corridor Reconstruction Section 4: 600 South Interchange 600 South Interstate 15 6/26/1996 Qal1
551 I-15 Corridor Reconstruction Section 4: 600 South Interchange 600 South Interstate 15 5/10/1996 Qal1
552 I-15 Corridor Reconstruction Section 4: 600 South Interchange 600 South Interstate 15 6/6/1996 Qal1
Table 3 Continued
48

Borehole ID Number Project Name Project
Location/AddressDate of
ExplorationGeologic
Unit
553 I-15 Corridor Reconstruction Section 4: 600 South Interchange 600 South Interstate 15 5/8/1996 Qlaly
554 I-15 Corridor Reconstruction Section 4: 600 South Interchange 600 South Interstate 15 5/10/1996 Qlaly
555 I-15 Corridor Reconstruction Section 4: 600 South Interchange 600 South Interstate 15 5/10/1996 Qal1
556 I-15 Corridor Reconstruction Section 4: 600 South Interchange 600 South Interstate 15 5/22/1996 Qal1
557 I-15 Corridor Reconstruction Section 4: 600 South Interchange 600 South Interstate 15 5/22/1996 Qal1
558 I-15 Corridor Reconstruction Section 4: 600 South Interchange 600 South Interstate 15 5/8/1996 Qal1
559 I-15 Corridor Reconstruction Section 4: 600 South Interchange 600 South Interstate 15 5/8/1996 Qal1
560 I-15 Corridor Reconstruction Section 4: 600 South Interchange 600 South Interstate 15 5/8/1996 Qal1
561 I-15 Corridor Reconstruction Section 4: 600 South Interchange 600 South Interstate 15 6/28/1996 Qal1
562 I-15 Corridor Reconstruction Section 10: SR 201 35-8163-01 SR 201 5/4/1996 Qal1
563 I-15 Corridor Reconstruction Section 10: SR 201 35-8163-02 SR 201 5/4/1996 Qal1
564 I-15 Corridor Reconstruction Section 10: SR 201 35-8163-03 SR 201 5/5/1996 Qal1
565 I-15 Corridor Reconstruction Section 10: SR 201 35-8163-04 SR 201 4/29/1996 Qal1
566 I-15 Corridor Reconstruction Section 10: SR 201 35-8163-05 900WC 5/13/1996 Qal1
567 I-15 Corridor Reconstruction Section 10: SR 201 35-8163-06 21S 201W 6/6/1996 Qal1
568 I-15 Corridor Reconstruction Section 10: SR 201 35-8163-07 900 WE 6/2/1996 Qal1
570 I-15 Corridor Reconstruction Section 10: SR 201 35-8163-09 700W 6/2/1996 Qal1
571 I-15 Corridor Reconstruction Section 10: SR 201 35-8163-10 SR 201 6/16/1996 Qal1
572 I-15 Corridor Reconstruction Section 10: SR 201 35-8163-11 SR 201 6/16/1996 Qal1
573 I-15 Corridor Reconstruction Section 10: SR 201 35-8163-12 SR 201 5/5/1996 Qal1
574 I-15 Corridor Reconstruction Section 10: SR 201 35-8163-13 SR 201 5/1/1996 Qal1
575 I-15 Corridor Reconstruction Section 10: SR 201 35-8163-14 SR 201 5/2/1996 Qal1
576 I-15 Corridor Reconstruction Section 10: SR 201 35-8163-15 21S 201W 5/8/1996 Qal1
577 I-15 Corridor Reconstruction Section 10: SR 201 35-8163-16 SR 201 5/7/1996 Qal1
Table 3 Continued
49

Borehole ID Number Project Name Project
Location/AddressDate of
ExplorationGeologic
Unit
578 I-15 Corridor Reconstruction Section 10: SR 201 35-8163-17 201E 15N 6/1/1996 Qal1
579 I-15 Corridor Reconstruction Section 10: SR 201 35-8163-18 SR 201 5/6/1996 Qal1
580 I-15 Corridor Reconstruction Section 10: SR 201 35-8163-19 21S 201W 5/11/1996 Qal1
581 I-15 Corridor Reconstruction Section 10: SR 201 35-8163-20 900 WA 4/30/1996 Qal1
582 I-15 Corridor Reconstruction Section 10: SR 201 35-8163-21 900WB 4/30/1996 Qal1
585 I-15 Corridor Reconstruction Section 9: State Street 35-8160 SS-I80 6/5/1996 Qlaly
586 I-15 Corridor Reconstruction Section 9: State Street 35-8160 SS-I80 6/5/1996 Qlaly
587 I-15 Corridor Reconstruction Section 9: State Street 35-8160 SS-I80 5/16/1996 Qlaly
588 I-15 Corridor Reconstruction Section 9: State Street 35-8160 SS-I80 5/20/1996 Qlaly
589 I-15 Corridor Reconstruction Section 9: State Street 35-8160 SS-15S80E 5/28/1996 Qlaly
590 I-15 Corridor Reconstruction Section 9: State Street 35-8160 SS-I80 5/15/1996 Qlaly
591 I-15 Corridor Reconstruction Section 9: State Street 35-8160 SS-15S80E 5/14/1996 Qlaly
592 I-15 Corridor Reconstruction Section 9: State Street 35-8160 SS-I80 5/15/1996 Qlaly
593 I-15 Corridor Reconstruction Section 9: State Street 35-8160 SS-I80 5/30/1996 Qlaly
594 I-15 Corridor Reconstruction Section 9: State Street 35-8160 SS-I80 6/2/1996 Qlaly
595 I-15 Corridor Reconstruction Section 9: State Street 35-8160 SS-80W15N 6/17/1996 Qlaly
596 I-15 Corridor Reconstruction Section 9: State Street 35-8160 SS-15S80E 6/2/1996 Qlaly
597 I-15 Corridor Reconstruction Section 9: State Street 35-8160 SS-15S80E 5/16/1996 Qlaly
598 I-15 Corridor Reconstruction Section 9: State Street 35-8160 SS-15S80E 6/24/1996 Qlaly
599 I-15 Corridor Reconstruction Section 9: State Street 35-8160 SS-15S80E 6/17/1996 Qlaly
600 I-15 Corridor Reconstruction Section 9: State Street 35-8160 SS-I80 5/13/1996 Qlaly
601 I-15 Corridor Reconstruction Section 9: State Street 35-8160 SS-I80 5/15/1996 Qlaly
602 I-15 Corridor Reconstruction Section 9: State Street 35-8160 SS-I80 5/28/1996 Qlaly
603 I-15 Corridor Reconstruction Section 9: State Street 35-8160 SS-I80 5/14/1996 Qlaly
Table 3 Continued
50

Borehole ID Number Project Name Project
Location/AddressDate of
ExplorationGeologic
Unit
604 I-15 Corridor Reconstruction Section 9: State Street 35-8160 SS-I80 5/30/1996 Qlaly
605 I-15 Corridor Reconstruction Section 9: State Street 35-8160 SS-I80 5/15/1996 Qlaly
606 I-15 Corridor Reconstruction Section 9: State Street 35-8160 SS-I80 5/21/1996 Qlaly
607 I-15 Corridor Reconstruction Section 9: State Street 35-8160 SS-I80 6/2/1996 Qlaly
608 I-15 Corridor Reconstruction Section 9: State Street 35-8160 SS-I80 6/3/1996 Qlaly
609 I-15 Corridor Reconstruction Section 9: State Street 35-8160 SS-I80 6/4/1996 Qlaly
610 I-15 Corridor Reconstruction Section 9: State Street 35-8160 SS-I80 5/17/1996 Qlaly
611 I-15 Corridor Reconstruction Section 9: State Street 35-8160 SS-80W15N 5/14/1996 Qlaly
612 I-15 Corridor Reconstruction Section 9: State Street 35-8160 SS-15S80E 5/14/1996 Qlaly
613 I-15 Corridor Reconstruction Section 9: State Street 35-8160 SS-I80 5/16/1996 Qlaly
614 I-15 Corridor Reconstruction Section 9: State Street 35-8160 SS-I80 5/13/1996 Qlaly
615 I-15 Corridor Reconstruction Section 9: State Street 35-8160 SS-I80 5/14/1996 Qlaly
616 I-15 Corridor Reconstruction Section 9: State Street 35-8160 SS-I80 5/15/1996 Qlaly
617 I-15 Corridor Reconstruction Section 9: State Street 35-8160 SS-I80 5/15/1996 Qlaly
618 I-15 Corridor Reconstruction Section 9: State Street 35-8160 SS-I80 5/30/1996 Qlaly
619 I-15 Corridor Reconstruction Section 9: State Street 35-8160 SS-80W15N 5/30/1996 Qlaly
620 I-15 Corridor Reconstruction Section 9: State Street 35-8160 SS-I80 5/14/1996 Qlaly
621 I-15 Corridor Reconstruction Section 9: State Street 35-8160 SS-I80 6/29/1996 Qlaly
622 I-15 Corridor Reconstruction Section 9: State Street 35-8160 SS-80W15N 5/22/1996 Qlaly
623 I-15 Corridor Reconstruction Section 9: State Street 35-8160 SS-I80 5/13/1996 Qlaly
624 I-15 Corridor Reconstruction Section 8: 3300 South Interchange I-15 5/9/1996 Qal2
625 I-15 Corridor Reconstruction Section 8: 3300 South Interchange I-15 5/23/1996 Qal2
626 I-15 Corridor Reconstruction Section 8: 3300 South Interchange I-15 6/8/1996 Qal2
627 I-15 Corridor Reconstruction Section 8: 3300 South Interchange I-15 5/30/1996 Qal2
Table 3 Continued
51

Borehole ID Number Project Name Project
Location/AddressDate of
ExplorationGeologic
Unit
628 I-15 Corridor Reconstruction Section 8: 3300 South Interchange I-15 5/22/1996 Qal2
629 I-15 Corridor Reconstruction Section 8: 3300 South Interchange I-15 6/6/1996 Qal2
630 I-15 Corridor Reconstruction Section 8: 3300 South Interchange I-15 5/16/1996 Qal1
631 I-15 Corridor Reconstruction Section 8: 3300 South Interchange I-15 5/21/1996 Qal1
632 I-15 Corridor Reconstruction Section 8: 3300 South Interchange I-15 5/15/1996 Qal1
633 I-15 Corridor Reconstruction Section 8: 3300 South Interchange I-15 5/17/1996 Qal1
634 I-15 Corridor Reconstruction Section 8: 3300 South Interchange I-15 6/4/1996 Qal1
635 I-15 Corridor Reconstruction Section 8: 3300 South Interchange I-15 6/7/1996 Qal1
636 I-15 Corridor Reconstruction Section 8: 3300 South Interchange I-15 6/3/1996 Qal1
638 I-15 Corridor Reconstruction Section 8: 3300 South Interchange I-15 5/29/1996 Qal2
639 I-15 Corridor Reconstruction Section 8: 3300 South Interchange I-15 6/6/1996 Qal2
640 I-15 Corridor Reconstruction Section 8: 3300 South Interchange I-15 7/11/1996 Qal2
641 I-15 Corridor Reconstruction Section 8: 3300 South Interchange I-15 5/31/1996 Qal2
642 I-15 Corridor Reconstruction Section 8: 3300 South Interchange I-15 5/20/1996 Qal2
643 I-15 Corridor Reconstruction Section 8: 3300 South Interchange I-15 6/19/1996 Qal2
644 I-15 Corridor Reconstruction Section 8: 3300 South Interchange I-15 6/19/1996 Qal2
645 I-15 Corridor Reconstruction Section 8: 3300 South Interchange I-15 6/25/1996 Qal2
646 I-15 Corridor Reconstruction Section 8: 3300 South Interchange I-15 6/18/1996 Qal2
647 I-15 Corridor Reconstruction Section 8: 3300 South Interchange I-15 6/18/1996 Qal2
648 I-15 Corridor Reconstruction Section 8: 3300 South Interchange I-15 5/19/1996 Qal2
649 I-15 Corridor Reconstruction Section 8: 3300 South Interchange I-15 6/9/1996 Qal2
650 I-15 Corridor Reconstruction Section 8: 3300 South Interchange I-15 5/18/1996 Qal2
651 I-15 Corridor Reconstruction Section 8: 3300 South Interchange I-15 5/22/1996 Qal2
652 I-15 Corridor Reconstruction Section 6: 5300 South Interchange I-15 6/4/1996 Qal2
Table 3 Continued
52

Borehole ID Number Project Name Project
Location/AddressDate of
ExplorationGeologic
Unit
654 I-15 Corridor Reconstruction Section 6: 5300 South Interchange I-15 6/3/1996 Qal2
655 I-15 Corridor Reconstruction Section 6: 5300 South Interchange I-15 6/1/1996 Qal2
656 I-15 Corridor Reconstruction Section 6: 5300 South Interchange I-15 6/6/1996 Qal2
657 I-15 Corridor Reconstruction Section 6: 5300 South Interchange I-15 6/11/1996 Qal2
658 I-15 Corridor Reconstruction Section 6: 5300 South Interchange I-15 5/31/1996 Qal2
659 I-15 Corridor Reconstruction Section 6: 5300 South Interchange I-15 6/1/1996 Qal2
660 I-15 Corridor Reconstruction Section 6: 5300 South Interchange I-15 6/11/1996 Qal2
661 I-15 Corridor Reconstruction Section 6: 5300 South Interchange I-15 6/10/1996 Qal2
662 I-15 Corridor Reconstruction Section 6: 5300 South Interchange I-15 6/11/1996 Qal2
663 I-15 Corridor Reconstruction Section 6: 5300 South Interchange I-15 6/5/1996 Qal2
664 I-15 Corridor Reconstruction Section 6: 5300 South Interchange I-15 6/11/1996 Qlbpm
665 I-15 Corridor Reconstruction Section 6: 5300 South Interchange I-15 5/30/1996 Qal1
666 I-15 Corridor Reconstruction Section 6: 5300 South Interchange I-15 6/13/1996 Qal1
667 I-15 Corridor Reconstruction Section 6: 5300 South Interchange I-15 6/12/1996 Qal1
668 I-15 Corridor Reconstruction Section 6: 5300 South Interchange I-15 6/12/1996 Qal2
669 I-15 Corridor Reconstruction Section 6: 5300 South Interchange I-15 6/16/1996 Qal2
670 I-15 Corridor Reconstruction Section 6: 5300 South Interchange I-15 6/4/1996 Qal2
671 I-15 Corridor Reconstruction Section 6: 5300 South Interchange I-15 6/4/1996 Qal2
672 I-15 Corridor Reconstruction Section 6: 5300 South Interchange I-15 5/29/1996 Qal2
673 I-15 Corridor Reconstruction Section 6: 5300 South Interchange I-15 5/30/1996 Qal2
674 I-15 Corridor Reconstruction Section 6: 5300 South Interchange I-15 6/12/1996 Qal2
675 I-15 Corridor Reconstruction Section 6: 5300 South Interchange I-15 6/3/1996 Qal2
676 I-15 Corridor Reconstruction Section 6: 5300 South Interchange I-15 6/5/1996 Qal2
677 I-15 Corridor Reconstruction Section 6: 5300 South Interchange I-15 6/1/1996 Qal2
Table 3 Continued
53

Borehole ID Number Project Name Project
Location/AddressDate of
ExplorationGeologic
Unit
678 I-15 Corridor Reconstruction Section 6: 5300 South Interchange I-15 6/1/1996 Qal2
679 I-15 Corridor Reconstruction Section 6: 5300 South Interchange I-15 5/30/1996 Qal1
680 I-15 Corridor Reconstruction Section 6: 5300 South Interchange I-15 6/2/1996 Qal2
681 Industrial Center 1925 W. Indiana Ave 10/15/2001 Qaly682 Industrial Center 1925 W. Indiana Ave 10/15/2001 Qaly683 Stream Lane Subdivision 3518 S. 2000 E 12/23/2003 Qaf2684 Bolton Place Subdivision 1465 W 500 N 2/9/2004 Qlbpm685 Fast Movers Warehouse 3651 S 700 W 4/20/2001 Qal2686 Proposed Water Transmission Line app 2200E 1700S 4/23/1982 Qlbpm687 Proposed Water Transmission Line app 2200E 1700S 4/23/1982 Qlbpm
688 Foothill Stake Center2100 S Between Hollywood and
Westminster4/23/1982 Qlbpm
689 Safeway Store 1638 S 900 E 12/12/1972 Qlaly690 Irving Commons Parking Structure 1200 E 2100 S Qlpg691 1700 S State St 1700 S State St 4/27/1970 Qlaly692 St. Joseph Home app 1900 S 500 E 3/18/1982 Qlaly693 First Security Bank 2100 S 1100 E Qaf2694 Foothill Drive over I-80 Structure 17 Foothill Drive I-80 1/1/1960 Mz695 I80 and 17th East 17th East I-80 Qlbm
696 Imperial 1st and 2nd Wards, Highland Stake 2700 S Fillmore St Qlbpm
697 Rosslyn School 2291 S 2000 E Qlpg
698 app 2800 E Parley's Way 7/20/1979 Qlpg
699 I-80 2300 E Ramp 2300 E I-80 1/1/1960 Qaf2700 Skipper Fish and Chips 3086 East 3300 S Qalp701 Proposed Bank 2163 E 3300 S 11/4/1975 Qlbpm702 3175 S State Street 7/20/1959 Qlaly703 Skyline High School Swimming Pool 3251 E 3760 S Qalp704 Fort Douglas Fort Douglas 9/20/1978 Qaf2705 Trolley Corners Facility 500 S 700 E Qaf2706 KSL Building 200 E Social Hall Ave Qaf2707 Salt Lake Valley Ward for the Deaf 700 S 800 E Qlaly
708 Donner Crest Condominiums850 S. Donner Way
(Mouth of Emigration Canyon)
Qafb
709 Report of Foundation investigation Gibbons and Reed Batch Pl
Gibbons and Reed Batch Plant, North Salt Lake 2/11/1977 Qly
710 Tischner-Busch warehouse 1800 N 3600 W Qlaly711 Tischner-Busch warehouse 1800 N 3600 W Qlaly
712 Dames and Moore Job no. 5471-001-06 1674 N Beck Street Qlbpg
713 Dames and Moore AMACO report Beck Street Qaf2
Table 3 Continued
54

Borehole ID Number Project Name Project
Location/AddressDate of
ExplorationGeologic
Unit714 Dames and Moore 6/16/1981 Qlbpm
715 RBG Sandrun Drive and Dorchester Drive Qlbm
716 Dames and Moore South Temple and E street 8/21/1978 Qlpg
717 21st Wards Emigration Stake 2nd Avenue 700 E Qaf2718 Proposed 11th Avenue Extension 11th Avenue 8/21/1974 Qlbg719 Proposed 11th Avenue Extension 11th Avenue 8/21/1974 Qaf2720 Proposed 11th Avenue Extension 11th Avenue 8/21/1974 Qlbm721 12/6/1966 Qlaly722 International - 2.5 North of I-80 12/18/1979 Qlaly
723 SL International Center- Easton Aluminum
Donald Douglas Road and Harold Gatty Drive
(575 N)Qlaly
724 Skagg's Office Building Charles Lindberg Dr and Amelia Earhart Drive Qlaly
725 Mervyns Brickyard Plaza 3250 S between 11th and 13th East 8/9/1979 Qlbpm
726 Standard Optical 1901 W Parkway BLVD Qaly
727 Bradshaw Condominiums app 10 E 400 S to 500 S Qaf2
728 2100 S 1300 E 2100 S 1300 E Qlpg729 Chen and Associates Job No. 301 U 300 W North Temple 4/16/1980 Qaf2730 East Redwood Subdivision 3405 S Redwood Rd Qal1731 Dura Crete Building 1475 W 3500 S Qal1732 Chevron Gas Station 4400 W 3500 S 8/26/1981 Qlbpm
733 Jordan North 5 and 12 Wards Chapel Hawkeye West Drive (app 3800 W) 4100 S Qlbpm
734 Buehner Block 2800 S 200 W 7/18/1979 Qlaly735 West Lake Apartments 3600 W 3100 S Qlaly736 McDonald's Facility 3450 W 3500 S Qlbpm737 Glendale Park School Addition 1455 W. California Ave Qal1738 Transmission Line Qlaly739 Liberty School 1092 S 200 E Qlaly
740 Parkview Elementary School 1250 W. Mead Ave (970 S) Qaly
741 Bonneville ConcentratorKennecott, West of
Magna, South of Tailings Pond.
Qlbg
742 Bonneville ConcentratorKennecott, West of
Magna, South of Tailings Pond.
Qlbg
743 Bonneville ConcentratorKennecott, West of
Magna, South of Tailings Pond.
Qlbg
Table 3 Continued
55
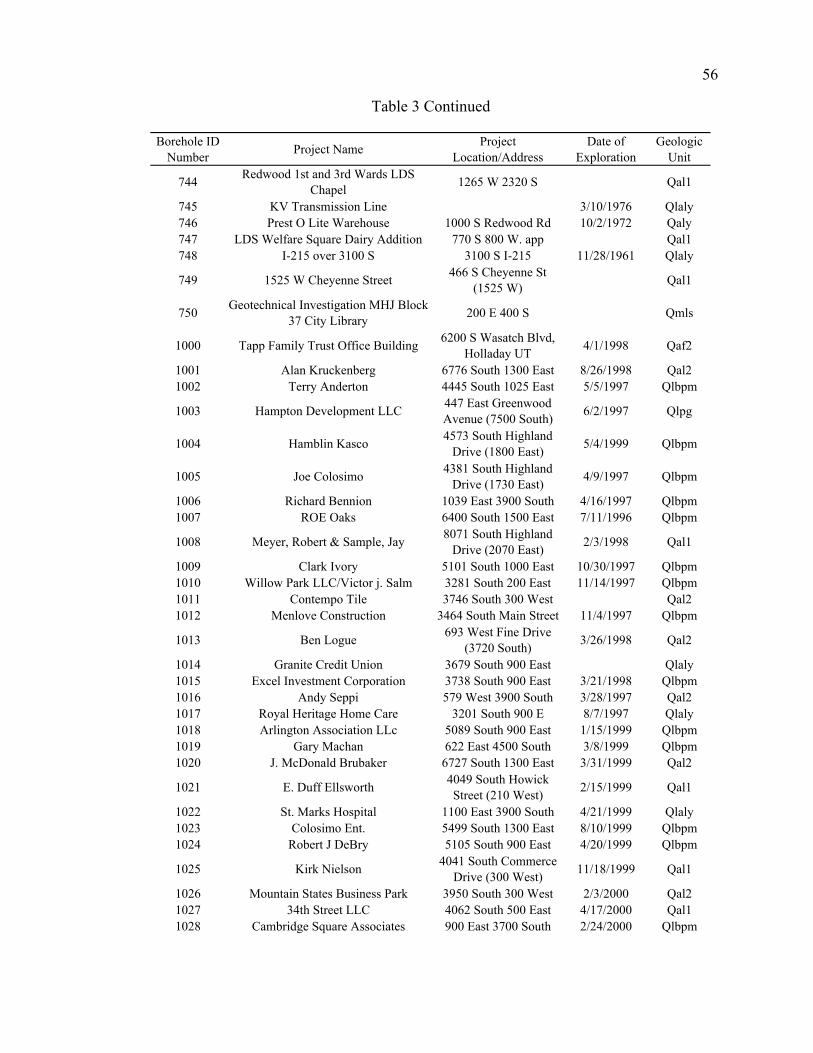
Borehole ID Number Project Name Project
Location/AddressDate of
ExplorationGeologic
Unit
744 Redwood 1st and 3rd Wards LDS Chapel 1265 W 2320 S Qal1
745 KV Transmission Line 3/10/1976 Qlaly746 Prest O Lite Warehouse 1000 S Redwood Rd 10/2/1972 Qaly747 LDS Welfare Square Dairy Addition 770 S 800 W. app Qal1748 I-215 over 3100 S 3100 S I-215 11/28/1961 Qlaly
749 1525 W Cheyenne Street 466 S Cheyenne St (1525 W) Qal1
750 Geotechnical Investigation MHJ Block 37 City Library 200 E 400 S Qmls
1000 Tapp Family Trust Office Building 6200 S Wasatch Blvd, Holladay UT 4/1/1998 Qaf2
1001 Alan Kruckenberg 6776 South 1300 East 8/26/1998 Qal21002 Terry Anderton 4445 South 1025 East 5/5/1997 Qlbpm
1003 Hampton Development LLC 447 East Greenwood Avenue (7500 South) 6/2/1997 Qlpg
1004 Hamblin Kasco 4573 South Highland Drive (1800 East) 5/4/1999 Qlbpm
1005 Joe Colosimo 4381 South Highland Drive (1730 East) 4/9/1997 Qlbpm
1006 Richard Bennion 1039 East 3900 South 4/16/1997 Qlbpm1007 ROE Oaks 6400 South 1500 East 7/11/1996 Qlbpm
1008 Meyer, Robert & Sample, Jay 8071 South Highland Drive (2070 East) 2/3/1998 Qal1
1009 Clark Ivory 5101 South 1000 East 10/30/1997 Qlbpm1010 Willow Park LLC/Victor j. Salm 3281 South 200 East 11/14/1997 Qlbpm1011 Contempo Tile 3746 South 300 West Qal21012 Menlove Construction 3464 South Main Street 11/4/1997 Qlbpm
1013 Ben Logue 693 West Fine Drive (3720 South) 3/26/1998 Qal2
1014 Granite Credit Union 3679 South 900 East Qlaly1015 Excel Investment Corporation 3738 South 900 East 3/21/1998 Qlbpm1016 Andy Seppi 579 West 3900 South 3/28/1997 Qal21017 Royal Heritage Home Care 3201 South 900 E 8/7/1997 Qlaly1018 Arlington Association LLc 5089 South 900 East 1/15/1999 Qlbpm1019 Gary Machan 622 East 4500 South 3/8/1999 Qlbpm1020 J. McDonald Brubaker 6727 South 1300 East 3/31/1999 Qal2
1021 E. Duff Ellsworth 4049 South Howick Street (210 West) 2/15/1999 Qal1
1022 St. Marks Hospital 1100 East 3900 South 4/21/1999 Qlaly1023 Colosimo Ent. 5499 South 1300 East 8/10/1999 Qlbpm1024 Robert J DeBry 5105 South 900 East 4/20/1999 Qlbpm
1025 Kirk Nielson 4041 South Commerce Drive (300 West) 11/18/1999 Qal1
1026 Mountain States Business Park 3950 South 300 West 2/3/2000 Qal21027 34th Street LLC 4062 South 500 East 4/17/2000 Qal11028 Cambridge Square Associates 900 East 3700 South 2/24/2000 Qlbpm
Table 3 Continued
56
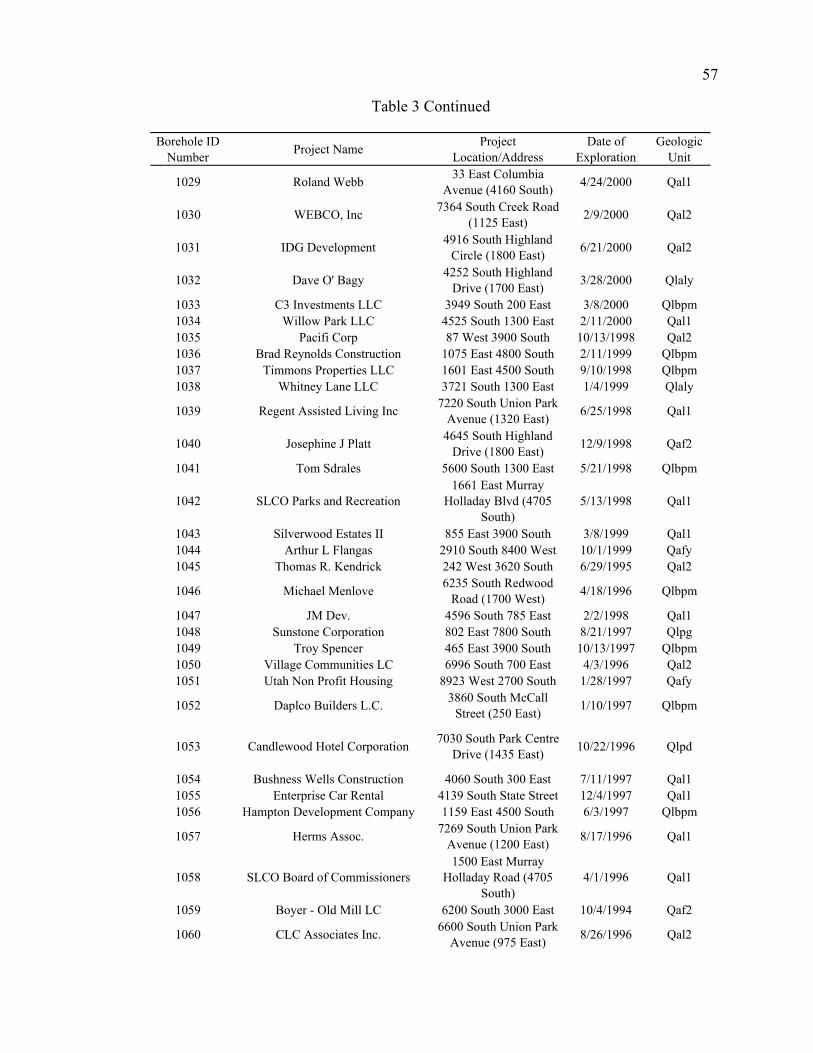
Borehole ID Number Project Name Project
Location/AddressDate of
ExplorationGeologic
Unit
1029 Roland Webb 33 East Columbia Avenue (4160 South) 4/24/2000 Qal1
1030 WEBCO, Inc 7364 South Creek Road (1125 East) 2/9/2000 Qal2
1031 IDG Development 4916 South Highland Circle (1800 East) 6/21/2000 Qal2
1032 Dave O' Bagy 4252 South Highland Drive (1700 East) 3/28/2000 Qlaly
1033 C3 Investments LLC 3949 South 200 East 3/8/2000 Qlbpm1034 Willow Park LLC 4525 South 1300 East 2/11/2000 Qal11035 Pacifi Corp 87 West 3900 South 10/13/1998 Qal21036 Brad Reynolds Construction 1075 East 4800 South 2/11/1999 Qlbpm1037 Timmons Properties LLC 1601 East 4500 South 9/10/1998 Qlbpm1038 Whitney Lane LLC 3721 South 1300 East 1/4/1999 Qlaly
1039 Regent Assisted Living Inc 7220 South Union Park Avenue (1320 East) 6/25/1998 Qal1
1040 Josephine J Platt 4645 South Highland Drive (1800 East) 12/9/1998 Qaf2
1041 Tom Sdrales 5600 South 1300 East 5/21/1998 Qlbpm
1042 SLCO Parks and Recreation1661 East Murray
Holladay Blvd (4705 South)
5/13/1998 Qal1
1043 Silverwood Estates II 855 East 3900 South 3/8/1999 Qal11044 Arthur L Flangas 2910 South 8400 West 10/1/1999 Qafy1045 Thomas R. Kendrick 242 West 3620 South 6/29/1995 Qal2
1046 Michael Menlove 6235 South Redwood Road (1700 West) 4/18/1996 Qlbpm
1047 JM Dev. 4596 South 785 East 2/2/1998 Qal11048 Sunstone Corporation 802 East 7800 South 8/21/1997 Qlpg1049 Troy Spencer 465 East 3900 South 10/13/1997 Qlbpm1050 Village Communities LC 6996 South 700 East 4/3/1996 Qal21051 Utah Non Profit Housing 8923 West 2700 South 1/28/1997 Qafy
1052 Daplco Builders L.C. 3860 South McCall Street (250 East) 1/10/1997 Qlbpm
1053 Candlewood Hotel Corporation 7030 South Park Centre Drive (1435 East) 10/22/1996 Qlpd
1054 Bushness Wells Construction 4060 South 300 East 7/11/1997 Qal11055 Enterprise Car Rental 4139 South State Street 12/4/1997 Qal11056 Hampton Development Company 1159 East 4500 South 6/3/1997 Qlbpm
1057 Herms Assoc. 7269 South Union Park Avenue (1200 East) 8/17/1996 Qal1
1058 SLCO Board of Commissioners1500 East Murray
Holladay Road (4705 South)
4/1/1996 Qal1
1059 Boyer - Old Mill LC 6200 South 3000 East 10/4/1994 Qaf2
1060 CLC Associates Inc. 6600 South Union Park Avenue (975 East) 8/26/1996 Qal2
Table 3 Continued
57

Borehole ID Number Project Name Project
Location/AddressDate of
ExplorationGeologic
Unit1061 Homestead Village 5770 South 1650 West 10/2/1995 Qlbpm
1062 David Platt 1935 East Siesta Drive (7485 South) 2/6/1997 Qalp
1063 Ivory Homes 790 East 4400 South 7/26/1996 Qlbpm1064 Spectrum Development Corporation 4141 South 700 East 6/27/1996 Qlbpm1065 William Steve Perry 328 East 3900 South Qlbpm1066 Kim Jooms 315 West 3300 South 8/27/1991 Qal21067 Kim Anderson 7155 South 540 East 11/13/1995 Qlpg1068 Sorenson Associates 815 West 4500 South 1/12/1995 Qal1
1069 Arlene Carlson 4099 South Highland Drive (1710 East) 11/20/1995 Qlaly
1070 Prime Commercial Partners LLC 7351 South Union Park Avenue (1145 East) Qal2
1071 Jaren L Davis 1282 East 4500 South 6/9/1997 Qal21072 West America Finance Corp 4605 South 900 East Qlbpm1073 Sigma Corp 777 East 3900 South Qlbpm1074 American Housing Development 4561 South 900 East 8/1/1995 Qlbpm
1075 Ron Halpern 846 East North Union Avenue (7130 South) 5/15/1995 Qal2
1076 Patricia Adams 4745 South 3200 West 7/7/1995 Qlbpm1077 Trammell Crow Residential Co. 6714 South 1300 East 4/20/1995 Qal21078 ORD Properties Inc. 910 West 3900 South 3/8/1995 Qlbpm1079 Mark Eldredge 1860 East 5600 South 4/26/1995 Qal11080 Housing Authority 290 East 4050 South Qal11081 Smith Brubaker 351 East 7500 South 10/25/1996 Qlpg1082 Village Communities 7351 South 300 East 6/26/1995 Qlbpm1083 Hamlet Development 4771 South 600 East 2/21/1995 Qal11084 Salt Lake County 177 West 3600 South 6/27/1995 Qal21085 Fourels Investment Co. 7000 South 1435 East Qlpd1086 Jim Theusch 7025 South 1435 East Qlbpm1087 Wallnet Investments LLC 2755 East 6580 South 2/4/1998 Qlpd1088 William Oswald 1075 West 3725 South 11/14/1994 Qal21089 McDonald's Corporation 3890 South 1100 East 6/7/1994 Qlaly
1090 Salt Lake County 3638 South West Temple Street 3/21/1994 Qlbpm
1091 Kent Alred 1349 East 4500 South Qal21092 Asset Network of America 1582 West 5400 South 8/9/1990 Qlbpm1093 American Equity Corporation 1052 East 7220 South Qal21094 Neal Hammond 3535 South 500 West 10/28/1994 Qal21095 Western River Expeditions 1180 East 6600 South 6/17/1994 Qal21096 Hercules Aerospace 9400 West 5050 South Qlbg1097 Salt Lake County 1820 East 6965 South 9/6/1995 Qlpg1098 Opportunity Development 7765 South 300 East 1/5/1995 Qlpg1099 Richard Sorenson 5400 South 1300 West 9/2/1994 Qlbpm1100 Sussex Group 4168 South 900 East 6/10/1994 Qlbpm1101 Locus 4805 South 2350 West Qlbpm1102 T & Z Corporation 3960 South 300 West Qal21103 Colorado Land Consultants, Inc. 7100 South 1400 East 10/27/1993 Qlpd
Table 3 Continued
58

Borehole ID Number Project Name Project
Location/AddressDate of
ExplorationGeologic
Unit1104 Civil Land Consultants 7100 South 1300 East 10/25/1993 Qlpd
1105 PGAW Architects 2145 East Creek Road (8200 South) Qalp
1106 Mountain America Credit Union1298 East Murray
Holladay Road (4785 South)
12/6/1993 Qal1
1107 Triton Investments 1355 West 4070 South Qal1
1108 McDonala 6280 South Redwood Road (1700 West) 6/17/1993 Qlbpm
1109 Holladay Hills II imited Partnership 3714 South Highland Drive 3/18/1993 Qlaly
1110 River Point Associates 925 West 3900 South 3/4/1993 Qal21111 Gordon Gygi Architects 6728 South 1300 East Qal21112 Triton Investments 4500 South 465 East Qal21113 Triton Investments 4070 South 1355 West Qlbpm1114 E BA Berger Inc. 5400 South 2510 West 7/21/1993 Qlbpm1115 S-Devcorp 4365 South State Street 12/13/2004 Qal21116 Mike Polich 3518 South 2000 East 12/23/2003 Qaf21117 Steven T. Hunt 5814 Haven Lane 7/27/1998 Qal11118 Frank Perri 3651 South 700 West 4/20/2001 Qal21119 Prince Development 1712 East 9800 South 7/22/2004 Qlpg1120 Bill Berg 791 West Kolten Road 7/15/2002 Qlbpm1121 SLC Cellular Tower 3699 South 300 West 5/26/1992 Qal21122 Kelly Sheppard 7112 South 700 East 1/25/1993 Qal21123 Duane Wright 4411 South 1300 East 10/29/1992 Qal1
1124 Mark McDougal 4360 South Redwood Road (1700 West) Qal2
1125 US West SAL - Midvale 910 East 6600 South 7/28/1992 Qal21126 William Hafeman 1200 West 5100 South 2/10/1993 Qlbpm1127 First Security Mortgage 358 East 3900 South 10/9/1992 Qlbpm1128 Utah Power and Light 1287 East 6465 South 2/28/1992 Qal21129 Mark Blair 771 East 4345 South 10/29/1992 Qlbpm1130 Hawk Park 2 1150 East 4780 South 3/19/1992 Qal11131 State of Utah DFCM 5709 South 1500 West Qlbpm1132 American Equity Corporation 1677 East 4500 South Qlbpm1133 LDS Church 2365 West 4945 South Qlbpm
1134 Val Shelley 5205 South Highland Drive 4/22/1992 Qal1
1135 Pheasant Lane Estates 7660 South Caballero Drive 8/14/1991 Qalp
1136 Brent Moon 4115 South Main Street 3/6/1992 Qal11137 Mancini & Groesbeck 194 East 3900 South 11/21/1990 Qlbpm1138 Light Touch Inc. 3550 South 700 West 4/5/1991 Qal2
1139 Salt Lake City 184 East Gordon Lane (4190 South) 12/18/1990 Qal1
1140 George Brushke 7817 South 2000 East 2/12/1991 Qal11141 Nanolia Investments 725 West 3300 South 7/27/1990 Qal2
Table 3 Continued
59

Borehole ID Number Project Name Project
Location/AddressDate of
ExplorationGeologic
Unit
1142 Cottonwood Estates Corporation 2250 East Creek Road (8200 South) 2/12/1991 Qalp
1143 Esther's Cove Subdivision 1400 East Siesta Drive 10/17/1989 Qal1
1144 Sorenson Associates 860 West Levoy Drive (4380 South) 10/16/1995 Qal1
1145 Wal-Mart Stores Inc. 5400 South Redwood Road 8/9/1990 Qlbpm
1146 Guy Mendenhall 1009 East 4800 South 9/9/1992 Qal1
1147 Westech Engineering 3639 South West Temple 5/1/1996 Qal2
1148 Edinburgh Condos 1105 East 4800 South 5/16/1985 Qal11149 Security Capital Pacific Trust 700 West 3727 South 5/3/1996 Qal21150 Learning Tree Day Care 860 East 4500 South 2/25/1985 Qlbpm1151 Chadd Ford Partnership 837 East 7440 South Qlpg1152 Bonneville Inn 315 West 3300 South 8/27/1991 Qal21153 Aramark Uniform Service 3679 South 700 West Qal21154 US West 3900 South 450 West 6/18/1992 Qlaly1155 Salt Lake Medical Investors LDT 1201 East 4500 South 1/27/1987 Qal21156 9500 South 700 West Qlbpm1157 LDS Institute @ SLCC 2200 West 4600 South Qlbpm
1158 Bangerter Highway SPTC Railroad over Bangerter Highway 3/11/1996 Qal2
1159 Bangerter Highway 1300 West S.R. 154 10/28/1996 Qal11160 Bangerter Highway Jordan River S.R. 154 10/17/1996 Qal11161 Bangerter Highway Interstate 15, S.R. 154 10/10/1996 Qlbpm
1162 LDS Church 10200 South 1300 West 5/31/1978 Qlbps
1163 Civil Land Consultants 11000 South Interstate 15 3/6/1995 Qlbpm
1164 Bingham Canyon Reservoir 10200 South 7200 West 5/22/1960 Qafo
1165 Ballard Medical Products 12300 South Lone Peak Parkway 4/15/1992 Qlbpm
1166 South Towne Office Park Partnership 10600 South Tower Boulevard 1/7/1990 Qal1
1167 Oak Financial Properties 7800 South 1275 West 5/30/1997 Qlbpm
1168 Metropolitan Water District of Salt Lake and Sandy
Interstate 15 Bluffdale Interchange 10/28/2002 Qlpg
1169 Metropolitan Water District of Salt Lake and Sandy
9000 South Danish Road (3000 East) 11/29/1999 Qal2
1170 Metropolitan Water District of Salt Lake and Sandy
Interstate 15 Bluffdale Interchange 10/30/2002 Qlpg
1171 Metropolitan Water District of Salt Lake and Sandy
Interstate 15 Bluffdale Interchange 10/30/2002 Qlpg
1172 UDOT Bangerter Highway SR-154 4100 South 3/16/1999 Qlbpm1173 UDOT Bangerter Highway SR-154 4100 South 3/19/1999 Qlbpm1174 UDOT Bangerter Highway SR-154 4100 South 4/15/1999 Qlbpm1175 UDOT Bangerter Highway SR-154 9000 South 6/30/1995 Qlbpg
Table 3 Continued
60

Borehole ID Number Project Name Project
Location/AddressDate of
ExplorationGeologic
Unit1176 UDOT Bangerter Highway SR-154 9000 South 6/30/1995 Qlbpg1177 UDOT Bangerter Highway SR-154 9000 South 6/30/1995 Qlbpm1178 UDOT Bangerter Highway SR-154 9000 South 7/3/1995 Qlbps1179 UDOT Bangerter Highway S.R. 154 9800 South 7/6/1995 Qlbpm1180 UDOT Bangerter Highway S.R. 154 9800 South 7/6/1995 Qlbpm1181 UDOT Bangerter Highway Segment 8 SR-154 3600 West 8/1/1996 Qlbpm1182 UDOT Bangerter Highway Segment 8 SR-154 3600 West 8/2/1996 Qlbpm1183 UDOT Bangerter Highway Segment 8 SR-154 3600 West 8/2/1996 Qlbpm1184 UDOT Bangerter Highway Segment 8 SR-154 3000 West 7/30/1996 Qlbpm1185 UDOT Bangerter Highway Segment 8 SR-154 3000 West 7/31/1996 Qlbpm1186 UDOT Bangerter Highway Segment 8 SR-154 2700 West 7/21/1996 Qlbpm1187 UDOT Bangerter Highway Segment 8 SR-154 2500 West 7/31/1996 Qlbpm1188 UDOT Bangerter Highway Segment 8 SR-154 2200 West 8/5/1996 Qlbpm1189 UDOT Bangerter Highway Segment 8 SR-154 2200 West 8/5/1996 Qal21190 UDOT Bangerter Highway Segment 8 SR-154 2000 West 8/1/1996 Qal21191 UDOT Bangerter Highway Segment 8 SR-154 2000 West 8/6/1996 Qal2
1192 UDOT Bangerter Highway Segment 8 SR-154 Redwood Road 8/6/1996 Qal2
1193 UDOT Bangerter Highway Segment 8 SR-154 13400 South 10/20/1998 Qlbpm1194 UDOT Bangerter Highway Segment 8 SR-154 13400 South 10/28/1998 Qlbpm
1195 UDOT I-15 Utah County Line to 10600 South I-15 14600 South 1/15/2003 Qlpg
1196 UDOT I-15 Utah County Line to 10600 South I-15 14600 South 1/22/2003 Qlpg
1197 UDOT I-15 Utah County Line to 10600 South I-15 11400 South 3/15/2000 Qlbpm
1198 UDOT I-15 Utah County Line to 10600 South I-15 11400 South 3/15/2000 Qlbpm
1199 UDOT I-15 Utah County Line to 10600 South
I-15 Salt Lake/Utah County Line 8/20/2003 Qlbpg
1200 UDOT I-15 Utah County Line to 10600 South
I-15 Salt Lake/Utah County Line 8/20/2003 Qlpg
1201 UDOT I-15 Utah County Line to 10600 South
I-15 Point of the Mountain 8/19/2003 Qlpg
1202 UDOT I-15 Utah County Line to 10600 South
I-15 Point of the Mountain 8/19/2003 Qlpg
1203 UDOT I-15 Utah County Line to 10600 South
I-15 Point of the Mountain 8/20/2003 Qlpg
1204 UDOT I-15 Utah County Line to 10600 South
I-15 Point of the Mountain 8/20/2003 Qlpg
1205 UDOT I-15 Utah County Line to 10600 South
I-15 Point of the Mountain 8/20/2003 Qlpg
1206 UDOT I-15 Utah County Line to 10600 South
I-15 Point of the Mountain 8/20/2003 Qlpg
1207 UDOT I-15 Utah County Line to 10600 South
I-15 Point of the Mountain 10/21/2003 Qlpg
1208 UDOT I-15 Utah County Line to 10600 South
I-15 Point of the Mountain 10/21/2003 Qlpg
Table 3 Continued
61

Borehole ID Number Project Name Project
Location/AddressDate of
ExplorationGeologic
Unit
1209 UDOT I-15 Utah County Line to 10600 South
I-15 Point of the Mountain 10/21/2003 Qlpg
1210 UDOT I-15 Utah County Line to 10600 South
I-15 Point of the Mountain 8/27/2003 Qlpg
1211 UDOT I-15 Utah County Line to 10600 South I-15 Bangerter Highway 9/5/2003 Qlbpm
1212 UDOT I-15 Utah County Line to 10600 South I-15 Bangerter Highway 8/28/2003 Qlbpm
1213 UDOT I-15 Utah County Line to 10600 South I-15 10800 South 10/22/2003 Qlbpm
1214 UDOT I-15 Utah County Line to 10600 South I-15 10800 South 10/23/2003 Qlbpm
1215 UDOT I-15 Utah County Line to 10600 South I-15 11400 South 8/26/2003 Qlbpm
1216 UDOT I-15 Utah County Line to 10600 South I-15 11400 South 8/27/2003 Qlbpm
1217 Proposed Carwash 1300 East Pioneer Road 3/29/2005 Qlpg
1218 Draper Commercial Property 1400 East Draper Parkway 7/29/2004 Qlpg
1219 Draper Retail Center 300 East 12450 South 2/24/2005 Qlbpm
1220 Proposed Office Building 11650 South State Street 5/16/2004 Qlbpm
1221 Southfork Estates 300 East 14200 South 4/16/2003 Qaf2
1222 Proposed Office Complex 13975 South Minuteman Drive 6/29/1999 Qlbpm
1223 U.S. Post Office 700 East Locust Street (8500 South) Qlpg
1224 LDS Church 4800 West 4170 South Qlbps1225 Kearns District 4015 West 4775 South 1/19/1977 Qlbpg1226 LDS Church 5255 South 3200 West Qlbpm1227 LDS Church 5415 South 4575 West Qlbpg1228 Playworld 7200 South State Street Qlbpm
1229 The Redwood Village Shopping Center 7000 South Redwood Road Qlbpm
1230 LDS Church 7510 South 2700 West Qlbpm1231 LDS Church 7325 South 3200 West Qlbpm1232 LDS Church 8000 South 2700 West Qlbpm
1233 Skaggs Super Center 7800 South Redwood Road Qlbpm
1234 Hart Brothers Music 8131 South Redwood Qlbpm1235 Granite Elementary School 4350 South 5400 West Qlbpg1236 Arlington School 5025 South State Street Qal1
1237 Murray High School Gymnasium Addition 5440 South State Street Qlbpm
1238 Arby's Restaurant 5830 South State Street Qal21239 Proposed Cashway Store 6000 South State Street Qal2
Table 3 Continued
62

Borehole ID Number Project Name Project
Location/AddressDate of
ExplorationGeologic
Unit
1240 Water Tank #3 10200 South 4450 West 10/8/2003 Qlbs
1241 Water Tank #1 11400 South 3200 West 11/11/2003 Qlbpm
1242 Water Tank #5 10200 South 6000 West 10/13/2003 Qafy
1243 4.5 MG Reservoir 10500 South 6300 West 6/27/2005 Qlbg
1244 I-15 Corridor Reconstruction 10600 South Interstate 15 6/20/1996 Qlbpm
1245 I-15 Corridor Reconstruction 10200 South Interstate 15 6/20/1996 Qal1
1246 I-15 Corridor Reconstruction 10000 South Interstate 15 6/21/1996 Qlbpm
1247 I-15 Corridor Reconstruction 9800 South Interstate 15 6/21/1996 Qlpg
1248 I-15 Corridor Reconstruction 9400 South Interstate 15 6/27/1996 Qlpg
1249 I-15 Corridor Reconstruction 9400 South Interstate 15 6/26/1996 Qlbpm
1250 I-15 Corridor Reconstruction 9400 South Interstate 15 6/24/1996 Qlbpm
1251 I-15 Corridor Reconstruction 9000 South Interstate 15 6/26/1996 Qlbpm
1252 I-15 Corridor Reconstruction 9000 South Interstate 15 6/24/1996 Qlbpm
1253 I-15 Corridor Reconstruction 9000 South Interstate 15 6/25/1996 Qlbpm
1254 I-15 Corridor Reconstruction 9000 South Interstate 15 7/8/1996 Qlbpm
1255 I-15 Corridor Reconstruction 9000 South Interstate 15 7/3/1996 Qlbpm
1256 I-15 Corridor Reconstruction 9000 South Interstate 15 6/27/1996 Qlbpm
1257 I-15 Corridor Reconstruction 8600 South Interstate 15 6/27/1996 Qlbpm
1258 I-15 Corridor Reconstruction 8600 South Interstate 15 7/1/1996 Qlbpm
1259 I-15 Corridor Reconstruction 8200 South Interstate 15 7/1/1996 Qlbpm
1260 I-15 Corridor Reconstruction 8100 South Interstate 15 7/1/1996 Qlbpm
1261 Blessed Sacrament Catholic Church 9800 South 1745 East 3/16/2004 Qlbg1262 Proposed Residence 2813 Ksel Drive 8/3/2004 Qlbg
1263 South Jordan Recreation Center 10800 South Redwood Road 3/4/2003 Qlbpm
1264 Best Buy Facility 11400 South State Street 6/27/2001 Qlbpm
Table 3 Continued
63
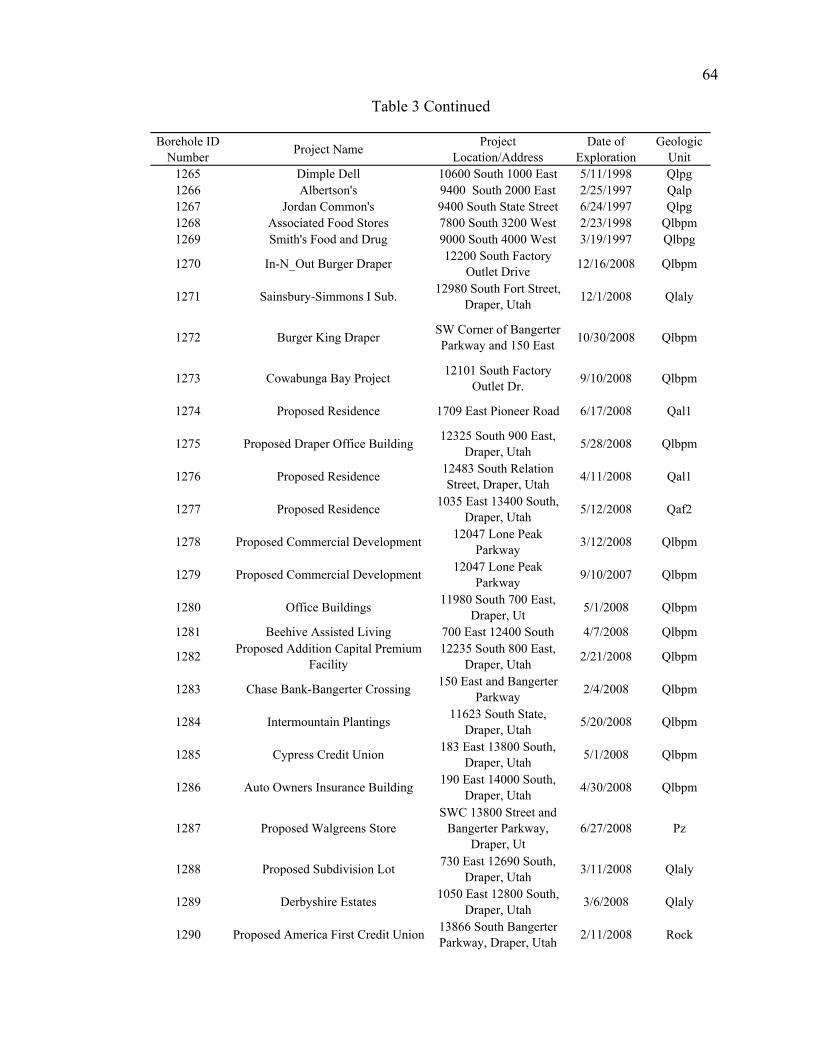
Borehole ID Number Project Name Project
Location/AddressDate of
ExplorationGeologic
Unit1265 Dimple Dell 10600 South 1000 East 5/11/1998 Qlpg1266 Albertson's 9400 South 2000 East 2/25/1997 Qalp1267 Jordan Common's 9400 South State Street 6/24/1997 Qlpg1268 Associated Food Stores 7800 South 3200 West 2/23/1998 Qlbpm1269 Smith's Food and Drug 9000 South 4000 West 3/19/1997 Qlbpg
1270 In-N_Out Burger Draper 12200 South Factory Outlet Drive 12/16/2008 Qlbpm
1271 Sainsbury-Simmons I Sub. 12980 South Fort Street, Draper, Utah 12/1/2008 Qlaly
1272 Burger King Draper SW Corner of Bangerter Parkway and 150 East 10/30/2008 Qlbpm
1273 Cowabunga Bay Project 12101 South Factory Outlet Dr. 9/10/2008 Qlbpm
1274 Proposed Residence 1709 East Pioneer Road 6/17/2008 Qal1
1275 Proposed Draper Office Building 12325 South 900 East, Draper, Utah 5/28/2008 Qlbpm
1276 Proposed Residence 12483 South Relation Street, Draper, Utah 4/11/2008 Qal1
1277 Proposed Residence 1035 East 13400 South, Draper, Utah 5/12/2008 Qaf2
1278 Proposed Commercial Development 12047 Lone Peak Parkway 3/12/2008 Qlbpm
1279 Proposed Commercial Development 12047 Lone Peak Parkway 9/10/2007 Qlbpm
1280 Office Buildings 11980 South 700 East, Draper, Ut 5/1/2008 Qlbpm
1281 Beehive Assisted Living 700 East 12400 South 4/7/2008 Qlbpm
1282 Proposed Addition Capital Premium Facility
12235 South 800 East, Draper, Utah 2/21/2008 Qlbpm
1283 Chase Bank-Bangerter Crossing 150 East and Bangerter Parkway 2/4/2008 Qlbpm
1284 Intermountain Plantings 11623 South State, Draper, Utah 5/20/2008 Qlbpm
1285 Cypress Credit Union 183 East 13800 South, Draper, Utah 5/1/2008 Qlbpm
1286 Auto Owners Insurance Building 190 East 14000 South, Draper, Utah 4/30/2008 Qlbpm
1287 Proposed Walgreens StoreSWC 13800 Street and
Bangerter Parkway, Draper, Ut
6/27/2008 Pz
1288 Proposed Subdivision Lot 730 East 12690 South, Draper, Utah 3/11/2008 Qlaly
1289 Derbyshire Estates 1050 East 12800 South, Draper, Utah 3/6/2008 Qlaly
1290 Proposed America First Credit Union 13866 South Bangerter Parkway, Draper, Utah 2/11/2008 Rock
Table 3 Continued
64

Borehole ID Number Project Name Project
Location/AddressDate of
ExplorationGeologic
Unit
1291 Proposed Exchange at 140thSW Corner of 14000 South and Bangerter
Pkwy6/2/2008 Qlbpm
1292 Proposed New Building 12607 South Minuteman Drive, Draper, Utah 7/9/2007 Qlbpm
1293 Proposed Retail Building 136 East 13800 South, Draper, Utah 7/6/2007 Pz
1294 Furniture Row IKEA Way, Draper, Utah 6/5/2007 Qlbpm
1295 Lone Peak Industrial Park 12865 South 225 West, Draper, Utah 11/10/2005 Qlbpm
1296 Proposed Residential Subdivision 12091 South 700 West 8/6/2007 Qlbpm
1297 Townhouse Development 150 East 11800 South, Draper, Utah 5/17/2006 Qlbpm
1298 Corner Creek Plaza 13420 Pony Express Road, Draper, Utah 5/1/2007 Qal1
1299 South Willow Business Park 150 West 12300 South, Draper, Utah 1/22/2007 Qal1
1300 Quest Office And Training Center 12300 South Galena Park Drive, Draper, Utah 12/8/2006 Qlbpm
1301 Proposed Draper Industrial Park 125 West 12650 South, Draper, Utah 10/16/2007 Qlbpm
1302 Tegra Health Building 11800 South State, Draper, Utah 5/11/2009 Qlbpm
Table 3 Continued
65

APPENDIX B
DEVELOPMENT OF ArcGIS® GROUND SETTLEMENT ROUTINES

67 Liquefaction-induced ground settlements were estimated by averaging the
calculated results of Tokimatsu and Seed (1987) and Yoshimine and others (2006) for all
liquefiable layers in the top 30 m of each borehole (FSliq ≤ 1.1). Both methods estimate
ground settlement based on SPT N values, which conveniently suits the data available in
the ArcGIS® geotechnical database. Additional parameters from the geotechnical
database such as fines content, soil unit weight and depth to groundwater were also used
in the settlement calculations.
The PGA estimates for the M7.0 Wasatch fault scenario event were obtained from
Wong and others (2002) and the PGA estimates for the probabilistic events were obtained
from the USGS National Strong Motion Hazard Mapping Project (Petersen and others,
2008). In accordance with the method and criteria proposed by Seed and others (2001),
the Petersen and others (2008) rock-based PGA estimates were adjusted for surface soil
effects based on the averaged shear wave velocities assigned to the several site-response
units previously described. The groundwater location and soil unit weight profiles
contained in the geotechnical database were used to calculate the overburden pressures.
Tokimatsu and Seed
Tokimatsu and Seed (1987) estimate volumetric strain in saturated clean sands
based on cyclic stress ratio (CSR) and normalized SPT blow counts, (N1)60. In
accordance with the guidelines presented in Tokimatsu and Seed (1987), CSR values
were calculated by:

68
do
o rg
aCSR
'65.0 max
(Equation 1)
where amax is the maximum horizontal acceleration at the ground surface (PGA); g is the
acceleration of gravity (9.81 m/s2); o is the total overburden pressure at the depth
considered; ’o is the effective overburden pressure at the depth considered; and rd is a
stress reduction factor that varies from 1 at the ground surface to about 0.9 at a depth of
approximately 9 m.
Following procedures recommended by Youd and others (2001), the raw blow
count data contained in the ArcGIS® geotechnical database were normalized and
corrected to (N1)60 values by:
SRBENm CCCCCNN 601 (Equation 2)
where Nm is the measured standard penetration resistance (blow count); CN is used to
normalize Nm to a common reference effective overburden stress (’o) of approximately
100 kPa (1 atm); CE varies from 0.5 to 1.3 depending on the type and efficiency of the
hammer used in the SPT testing; CB ranges from 1.0 for a 65-mm diameter hole to 1.15
for a 200-mm diameter hole; CR ranges from 0.75 for less than 3 m of rod to 1.0 for 10 to
30 m of rod; and CS varies from 1.0 for samplers with liners to a value of 1.1 to 1.3 for
samplers without liners. The data required to determine these factors was typically
included on the borehole logs used to create the ArcGIS® geotechnical database. In the
event that borehole diameter, hammer energy or sampler liner data was missing from a
particular borehole log, estimates were obtained from a table of typical values for each

69 drilling company. The typical-value tables were created based on actual data included on
other borehole logs.
As previously mentioned, the geotechnical database contains the amount of
material finer than the standard No. 200 sieve (FC). This data was used to correct the
(N1)60 values to clean sand values based on (Youd and others, 2001):
601601 NN CS (Equation 3)
where the and coefficients are determined by:
= 0 for FC ≤ 5% (Equation 4a)
= exp[1.76 – (190/FC2)] for 5% < FC < 35% (Equation 4b)
= 5.0 for FC ≥ 35% (Equation 4c)
= 1.0 for FC ≤ 5% (Equation 5a)
= [0.99 + (FC1.5/1,000)] for 5% < FC < 35% (Equation 5b)
= 1.2 for FC ≥ 35% (Equation 5c)
The soil profiles for each borehole location were screened for liquefaction
triggering using Youd and others (2001). A ground settlement value of 0 m was assigned
to all soils layers with factors of safety against liquefaction triggering greater than 1.1.
Triggering analysis was completed as follows:

70
MSFCSR
CRRFSliq
5.7 (Equation 6)
where CSR is determined by Equation 1 above; CRR7.5 is the minimum cyclic resistance
ratio for liquefaction as defined by the SPT clean-sand base curve which is approximated
by (Youd and others, 2001):
200
1
]45)(10[
50
135
)(
)(34
12
601
601
6015.7
N
N
NCRR (Equation 7)
and MSF is a magnitude scaling factor used to adjust for magnitudes other than M7.5
(Seed and others, 1983). The scenario analysis was based on a M7.0 earthquake on the
Wasatch fault while input magnitudes for the probabilistic analyses varied based on
deaggregations of the data presented by Petersen and others (2008). The MSF’s used in
the Tokimatsu and Seed analysis were interpolated from the data presented in Table 4
(Seed and others, 1983).
A reference table with approximately 1,400 data points was created from the
volumetric strain curves presented in Figure 12 (see Table 5). The table allowed
volumetric strains to be rapidly determined based on the (N1)60 clean sand blow counts
and CSR values. To account for the M7.5 calibration of the curves in Figure 12, the
MSF’s shown in Table 4 were used to adjust the CSR values to CSR7.5 by Tokimatsu and
Seed (1987):
MSF
CSRCSR 5.7 (Equation 8)
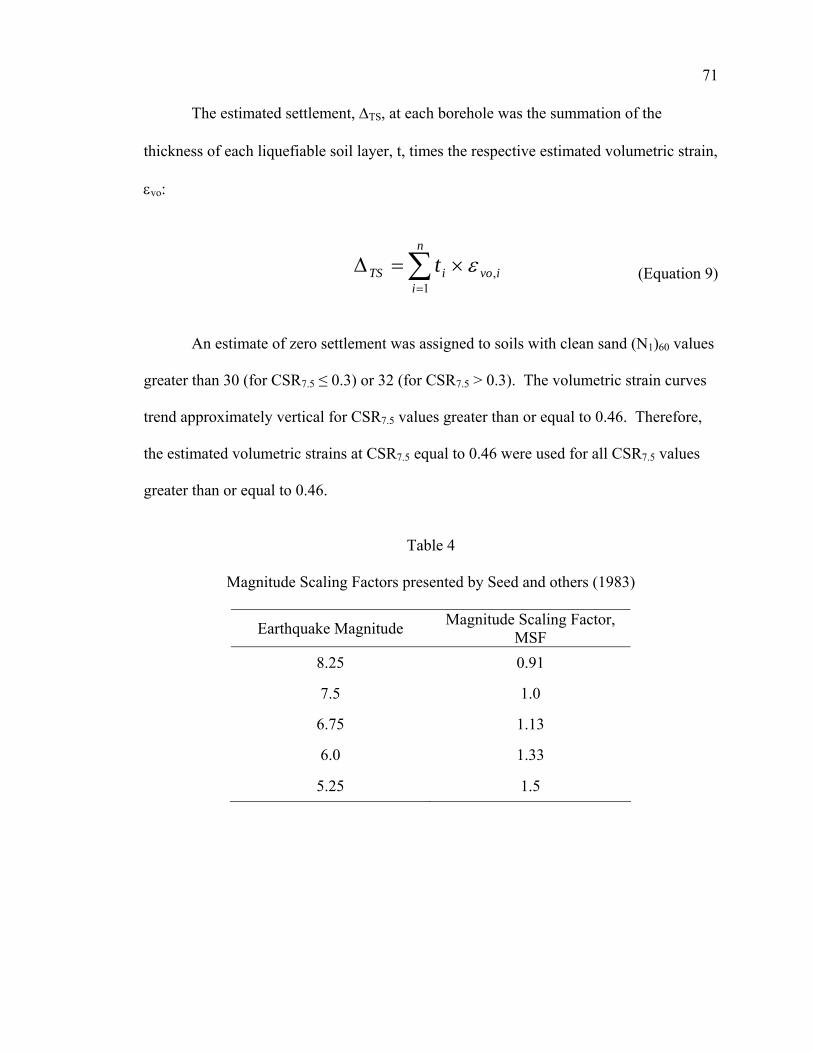
71 The estimated settlement, TS, at each borehole was the summation of the
thickness of each liquefiable soil layer, t, times the respective estimated volumetric strain,
vo:
n
iivoiTS t
1, (Equation 9)
An estimate of zero settlement was assigned to soils with clean sand (N1)60 values
greater than 30 (for CSR7.5 ≤ 0.3) or 32 (for CSR7.5 > 0.3). The volumetric strain curves
trend approximately vertical for CSR7.5 values greater than or equal to 0.46. Therefore,
the estimated volumetric strains at CSR7.5 equal to 0.46 were used for all CSR7.5 values
greater than or equal to 0.46.
Table 4
Magnitude Scaling Factors presented by Seed and others (1983)
Earthquake Magnitude Magnitude Scaling Factor,
MSF
8.25 0.91
7.5 1.0
6.75 1.13
6.0 1.33
5.25 1.5

72
Figure 12. Points used to populate Table 5, modified from Tokimatsu and Seed (1987).

Cyclic Stress Ratio, CSR
Normalized and Corrected SPT
Blow Count, (N1)60
Liquefaction-Induced Volumetric
Strain, %
Cyclic Stress Ratio, CSR
Normalized and Corrected SPT
Blow Count, (N1)60
Liquefaction-Induced Volumetric
Strain, %0.01 1 5.00 0.02 22 0.000.01 2 0.05 0.02 23 0.000.01 3 0.00 0.02 24 0.000.01 4 0.00 0.02 25 0.000.01 5 0.00 0.02 26 0.000.01 6 0.00 0.02 27 0.000.01 7 0.00 0.02 28 0.000.01 8 0.00 0.02 29 0.000.01 9 0.00 0.02 30 0.000.01 10 0.00 0.03 1 10.000.01 11 0.00 0.03 2 5.500.01 12 0.00 0.03 3 0.500.01 13 0.00 0.03 4 0.080.01 14 0.00 0.03 5 0.060.01 15 0.00 0.03 6 0.050.01 16 0.00 0.03 7 0.000.01 17 0.00 0.03 8 0.000.01 18 0.00 0.03 9 0.000.01 19 0.00 0.03 10 0.000.01 20 0.00 0.03 11 0.000.01 21 0.00 0.03 12 0.000.01 22 0.00 0.03 13 0.000.01 23 0.00 0.03 14 0.000.01 24 0.00 0.03 15 0.000.01 25 0.00 0.03 16 0.000.01 26 0.00 0.03 17 0.000.01 27 0.00 0.03 18 0.000.01 28 0.00 0.03 19 0.000.01 29 0.00 0.03 20 0.000.01 30 0.00 0.03 21 0.000.02 1 10.00 0.03 22 0.000.02 2 1.00 0.03 23 0.000.02 3 0.07 0.03 24 0.000.02 4 0.05 0.03 25 0.000.02 5 0.05 0.03 26 0.000.02 6 0.00 0.03 27 0.000.02 7 0.00 0.03 28 0.000.02 8 0.00 0.03 29 0.000.02 9 0.00 0.03 30 0.000.02 10 0.00 0.04 1 10.000.02 11 0.00 0.04 2 7.000.02 12 0.00 0.04 3 4.800.02 13 0.00 0.04 4 0.300.02 14 0.00 0.04 5 0.080.02 15 0.00 0.04 6 0.060.02 16 0.00 0.04 7 0.050.02 17 0.00 0.04 8 0.050.02 18 0.00 0.04 9 0.050.02 19 0.00 0.04 10 0.000.02 20 0.00 0.04 11 0.000.02 21 0.00 0.04 12 0.00
Digitized Settlement Curves Presented in Tokimatsu and Seed (1987)
Table 5
73
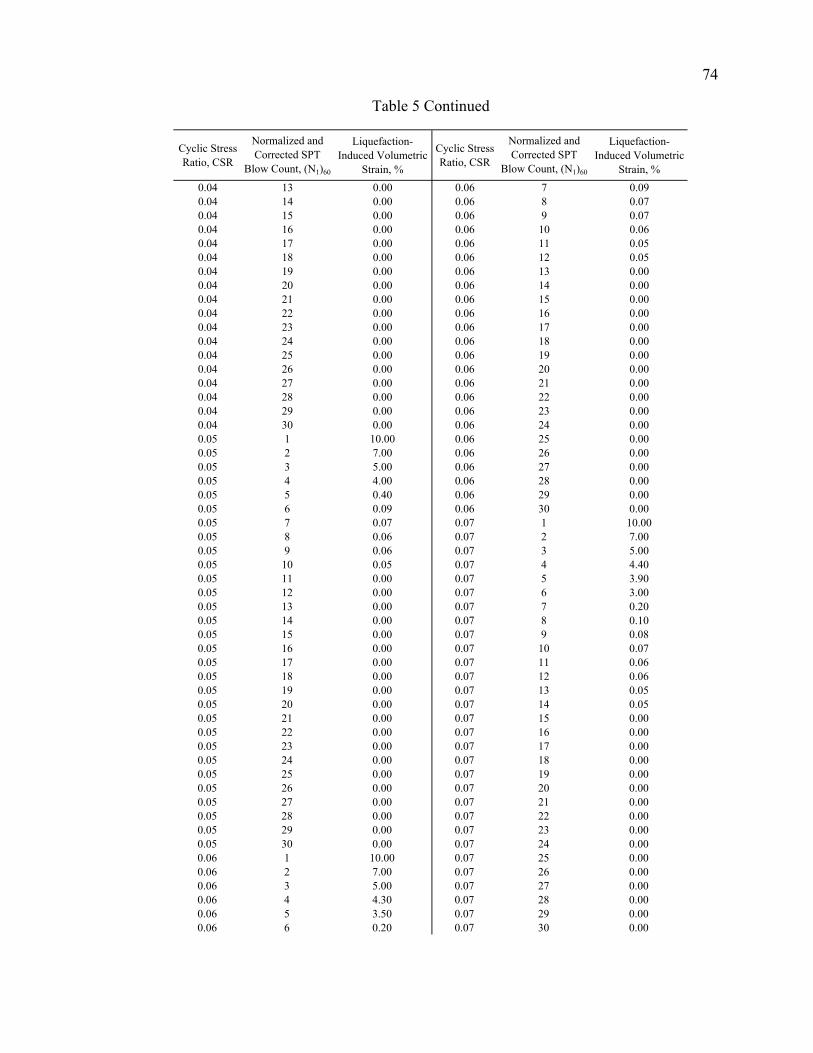
Cyclic Stress Ratio, CSR
Normalized and Corrected SPT
Blow Count, (N1)60
Liquefaction-Induced Volumetric
Strain, %
Cyclic Stress Ratio, CSR
Normalized and Corrected SPT
Blow Count, (N1)60
Liquefaction-Induced Volumetric
Strain, %0.04 13 0.00 0.06 7 0.090.04 14 0.00 0.06 8 0.070.04 15 0.00 0.06 9 0.070.04 16 0.00 0.06 10 0.060.04 17 0.00 0.06 11 0.050.04 18 0.00 0.06 12 0.050.04 19 0.00 0.06 13 0.000.04 20 0.00 0.06 14 0.000.04 21 0.00 0.06 15 0.000.04 22 0.00 0.06 16 0.000.04 23 0.00 0.06 17 0.000.04 24 0.00 0.06 18 0.000.04 25 0.00 0.06 19 0.000.04 26 0.00 0.06 20 0.000.04 27 0.00 0.06 21 0.000.04 28 0.00 0.06 22 0.000.04 29 0.00 0.06 23 0.000.04 30 0.00 0.06 24 0.000.05 1 10.00 0.06 25 0.000.05 2 7.00 0.06 26 0.000.05 3 5.00 0.06 27 0.000.05 4 4.00 0.06 28 0.000.05 5 0.40 0.06 29 0.000.05 6 0.09 0.06 30 0.000.05 7 0.07 0.07 1 10.000.05 8 0.06 0.07 2 7.000.05 9 0.06 0.07 3 5.000.05 10 0.05 0.07 4 4.400.05 11 0.00 0.07 5 3.900.05 12 0.00 0.07 6 3.000.05 13 0.00 0.07 7 0.200.05 14 0.00 0.07 8 0.100.05 15 0.00 0.07 9 0.080.05 16 0.00 0.07 10 0.070.05 17 0.00 0.07 11 0.060.05 18 0.00 0.07 12 0.060.05 19 0.00 0.07 13 0.050.05 20 0.00 0.07 14 0.050.05 21 0.00 0.07 15 0.000.05 22 0.00 0.07 16 0.000.05 23 0.00 0.07 17 0.000.05 24 0.00 0.07 18 0.000.05 25 0.00 0.07 19 0.000.05 26 0.00 0.07 20 0.000.05 27 0.00 0.07 21 0.000.05 28 0.00 0.07 22 0.000.05 29 0.00 0.07 23 0.000.05 30 0.00 0.07 24 0.000.06 1 10.00 0.07 25 0.000.06 2 7.00 0.07 26 0.000.06 3 5.00 0.07 27 0.000.06 4 4.30 0.07 28 0.000.06 5 3.50 0.07 29 0.000.06 6 0.20 0.07 30 0.00
Table 5 Continued
74

Cyclic Stress Ratio, CSR
Normalized and Corrected SPT
Blow Count, (N1)60
Liquefaction-Induced Volumetric
Strain, %
Cyclic Stress Ratio, CSR
Normalized and Corrected SPT
Blow Count, (N1)60
Liquefaction-Induced Volumetric
Strain, %
0.08 1 10.00 0.09 25 0.000.08 2 7.00 0.09 26 0.000.08 3 5.00 0.09 27 0.000.08 4 4.40 0.09 28 0.000.08 5 4.00 0.09 29 0.000.08 6 3.20 0.09 30 0.000.08 7 2.10 0.10 1 10.000.08 8 0.20 0.10 2 7.000.08 9 0.10 0.10 3 5.000.08 10 0.08 0.10 4 4.400.08 11 0.07 0.10 5 4.000.08 12 0.06 0.10 6 3.400.08 13 0.06 0.10 7 2.800.08 14 0.05 0.10 8 2.400.08 15 0.05 0.10 9 2.100.08 16 0.05 0.10 10 0.200.08 17 0.00 0.10 11 0.100.08 18 0.00 0.10 12 0.080.08 19 0.00 0.10 13 0.070.08 20 0.00 0.10 14 0.070.08 21 0.00 0.10 15 0.060.08 22 0.00 0.10 16 0.060.08 23 0.00 0.10 17 0.050.08 24 0.00 0.10 18 0.050.08 25 0.00 0.10 19 0.050.08 26 0.00 0.10 20 0.000.08 27 0.00 0.10 21 0.000.08 28 0.00 0.10 22 0.000.08 29 0.00 0.10 23 0.000.08 30 0.00 0.10 24 0.000.09 1 10.00 0.10 25 0.000.09 2 7.00 0.10 26 0.000.09 3 5.00 0.10 27 0.000.09 4 4.40 0.10 28 0.000.09 5 4.00 0.10 29 0.000.09 6 3.30 0.10 30 0.000.09 7 2.60 0.11 1 10.000.09 8 2.00 0.11 2 7.000.09 9 0.20 0.11 3 5.000.09 10 0.09 0.11 4 4.400.09 11 0.09 0.11 5 4.000.09 12 0.07 0.11 6 3.500.09 13 0.06 0.11 7 2.900.09 14 0.06 0.11 8 2.700.09 15 0.05 0.11 9 2.300.09 16 0.05 0.11 10 2.000.09 17 0.05 0.11 11 0.200.09 18 0.00 0.11 12 0.100.09 19 0.00 0.11 13 0.080.09 20 0.00 0.11 14 0.080.09 21 0.00 0.11 15 0.070.09 22 0.00 0.11 16 0.060.09 23 0.00 0.11 17 0.060.09 24 0.00 0.11 18 0.06
Table 5 Continued
75
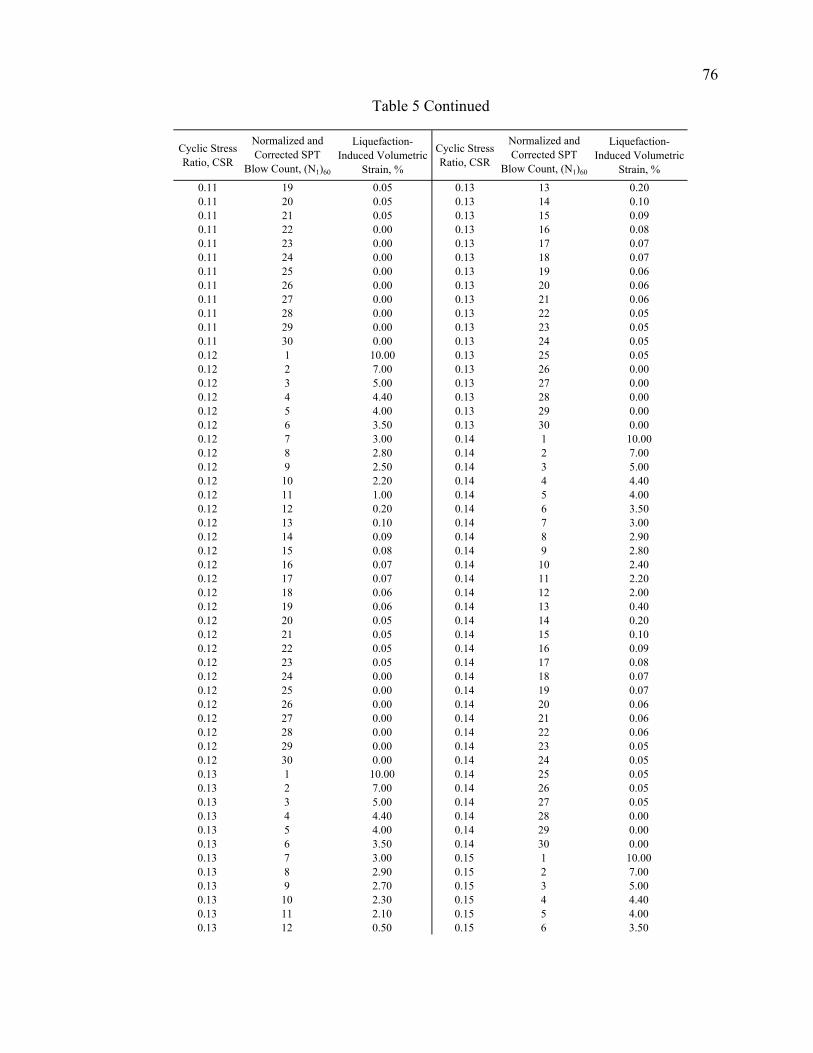
Cyclic Stress Ratio, CSR
Normalized and Corrected SPT
Blow Count, (N1)60
Liquefaction-Induced Volumetric
Strain, %
Cyclic Stress Ratio, CSR
Normalized and Corrected SPT
Blow Count, (N1)60
Liquefaction-Induced Volumetric
Strain, %0.11 19 0.05 0.13 13 0.200.11 20 0.05 0.13 14 0.100.11 21 0.05 0.13 15 0.090.11 22 0.00 0.13 16 0.080.11 23 0.00 0.13 17 0.070.11 24 0.00 0.13 18 0.070.11 25 0.00 0.13 19 0.060.11 26 0.00 0.13 20 0.060.11 27 0.00 0.13 21 0.060.11 28 0.00 0.13 22 0.050.11 29 0.00 0.13 23 0.050.11 30 0.00 0.13 24 0.050.12 1 10.00 0.13 25 0.050.12 2 7.00 0.13 26 0.000.12 3 5.00 0.13 27 0.000.12 4 4.40 0.13 28 0.000.12 5 4.00 0.13 29 0.000.12 6 3.50 0.13 30 0.000.12 7 3.00 0.14 1 10.000.12 8 2.80 0.14 2 7.000.12 9 2.50 0.14 3 5.000.12 10 2.20 0.14 4 4.400.12 11 1.00 0.14 5 4.000.12 12 0.20 0.14 6 3.500.12 13 0.10 0.14 7 3.000.12 14 0.09 0.14 8 2.900.12 15 0.08 0.14 9 2.800.12 16 0.07 0.14 10 2.400.12 17 0.07 0.14 11 2.200.12 18 0.06 0.14 12 2.000.12 19 0.06 0.14 13 0.400.12 20 0.05 0.14 14 0.200.12 21 0.05 0.14 15 0.100.12 22 0.05 0.14 16 0.090.12 23 0.05 0.14 17 0.080.12 24 0.00 0.14 18 0.070.12 25 0.00 0.14 19 0.070.12 26 0.00 0.14 20 0.060.12 27 0.00 0.14 21 0.060.12 28 0.00 0.14 22 0.060.12 29 0.00 0.14 23 0.050.12 30 0.00 0.14 24 0.050.13 1 10.00 0.14 25 0.050.13 2 7.00 0.14 26 0.050.13 3 5.00 0.14 27 0.050.13 4 4.40 0.14 28 0.000.13 5 4.00 0.14 29 0.000.13 6 3.50 0.14 30 0.000.13 7 3.00 0.15 1 10.000.13 8 2.90 0.15 2 7.000.13 9 2.70 0.15 3 5.000.13 10 2.30 0.15 4 4.400.13 11 2.10 0.15 5 4.000.13 12 0.50 0.15 6 3.50
Table 5 Continued
76

Cyclic Stress Ratio, CSR
Normalized and Corrected SPT
Blow Count, (N1)60
Liquefaction-Induced Volumetric
Strain, %
Cyclic Stress Ratio, CSR
Normalized and Corrected SPT
Blow Count, (N1)60
Liquefaction-Induced Volumetric
Strain, %0.15 7 3.00 0.17 1 10.000.15 8 2.90 0.17 2 7.000.15 9 2.80 0.17 3 5.000.15 10 2.50 0.17 4 4.400.15 11 2.30 0.17 5 4.000.15 12 2.10 0.17 6 3.500.15 13 1.50 0.17 7 3.000.15 14 0.50 0.17 8 2.900.15 15 0.20 0.17 9 2.800.15 16 0.10 0.17 10 2.700.15 17 0.09 0.17 11 2.400.15 18 0.08 0.17 12 2.200.15 19 0.07 0.17 13 2.100.15 20 0.07 0.17 14 1.800.15 21 0.07 0.17 15 1.100.15 22 0.06 0.17 16 0.500.15 23 0.06 0.17 17 0.200.15 24 0.06 0.17 18 0.150.15 25 0.05 0.17 19 0.090.15 26 0.05 0.17 20 0.080.15 27 0.05 0.17 21 0.080.15 28 0.05 0.17 22 0.070.15 29 0.00 0.17 23 0.070.15 30 0.00 0.17 24 0.060.16 1 10.00 0.17 25 0.060.16 2 7.00 0.17 26 0.060.16 3 5.00 0.17 27 0.060.16 4 4.40 0.17 28 0.050.16 5 4.00 0.17 29 0.050.16 6 3.50 0.17 30 0.050.16 7 3.00 0.18 1 10.000.16 8 2.90 0.18 2 7.000.16 9 2.80 0.18 3 5.000.16 10 2.60 0.18 4 4.400.16 11 2.30 0.18 5 4.000.16 12 2.20 0.18 6 3.500.16 13 2.00 0.18 7 3.000.16 14 1.50 0.18 8 2.900.16 15 0.50 0.18 9 2.800.16 16 0.20 0.18 10 2.700.16 17 0.15 0.18 11 2.400.16 18 0.09 0.18 12 2.200.16 19 0.08 0.18 13 2.100.16 20 0.07 0.18 14 1.900.16 21 0.07 0.18 15 1.500.16 22 0.07 0.18 16 1.100.16 23 0.06 0.18 17 0.400.16 24 0.06 0.18 18 0.200.16 25 0.06 0.18 19 0.150.16 26 0.06 0.18 20 0.100.16 27 0.05 0.18 21 0.080.16 28 0.05 0.18 22 0.080.16 29 0.05 0.18 23 0.070.16 30 0.05 0.18 24 0.07
Table 5 Continued
77

Cyclic Stress Ratio, CSR
Normalized and Corrected SPT
Blow Count, (N1)60
Liquefaction-Induced Volumetric
Strain, %
Cyclic Stress Ratio, CSR
Normalized and Corrected SPT
Blow Count, (N1)60
Liquefaction-Induced Volumetric
Strain, %0.18 25 0.07 0.20 19 0.400.18 26 0.06 0.20 20 0.200.18 27 0.06 0.20 21 0.150.18 28 0.06 0.20 22 0.100.18 29 0.06 0.20 23 0.090.18 30 0.05 0.20 24 0.080.19 1 10.00 0.20 25 0.070.19 2 7.00 0.20 26 0.070.19 3 5.00 0.20 27 0.070.19 4 4.40 0.20 28 0.070.19 5 4.00 0.20 29 0.060.19 6 3.50 0.20 30 0.060.19 7 3.00 0.21 1 10.000.19 8 2.90 0.21 2 7.000.19 9 2.80 0.21 3 5.000.19 10 2.70 0.21 4 4.400.19 11 2.40 0.21 5 4.000.19 12 2.30 0.21 6 3.500.19 13 2.10 0.21 7 3.000.19 14 1.90 0.21 8 2.900.19 15 1.70 0.21 9 2.800.19 16 1.50 0.21 10 2.700.19 17 1.10 0.21 11 2.400.19 18 0.40 0.21 12 2.300.19 19 0.20 0.21 13 2.100.19 20 0.15 0.21 14 2.000.19 21 0.10 0.21 15 1.800.19 22 0.09 0.21 16 1.600.19 23 0.08 0.21 17 1.500.19 24 0.07 0.21 18 1.200.19 25 0.07 0.21 19 1.000.19 26 0.07 0.21 20 0.300.19 27 0.06 0.21 21 0.200.19 28 0.06 0.21 22 0.150.19 29 0.06 0.21 23 0.100.19 30 0.06 0.21 24 0.090.20 1 10.00 0.21 25 0.080.20 2 7.00 0.21 26 0.070.20 3 5.00 0.21 27 0.070.20 4 4.40 0.21 28 0.070.20 5 4.00 0.21 29 0.070.20 6 3.50 0.21 30 0.060.20 7 3.00 0.22 1 10.000.20 8 2.90 0.22 2 7.000.20 9 2.80 0.22 3 5.000.20 10 2.70 0.22 4 4.400.20 11 2.40 0.22 5 4.000.20 12 2.30 0.22 6 3.500.20 13 2.10 0.22 7 3.000.20 14 2.00 0.22 8 2.900.20 15 1.80 0.22 9 2.800.20 16 1.60 0.22 10 2.700.20 17 1.30 0.22 11 2.400.20 18 1.10 0.22 12 2.30
Table 5 Continued
78
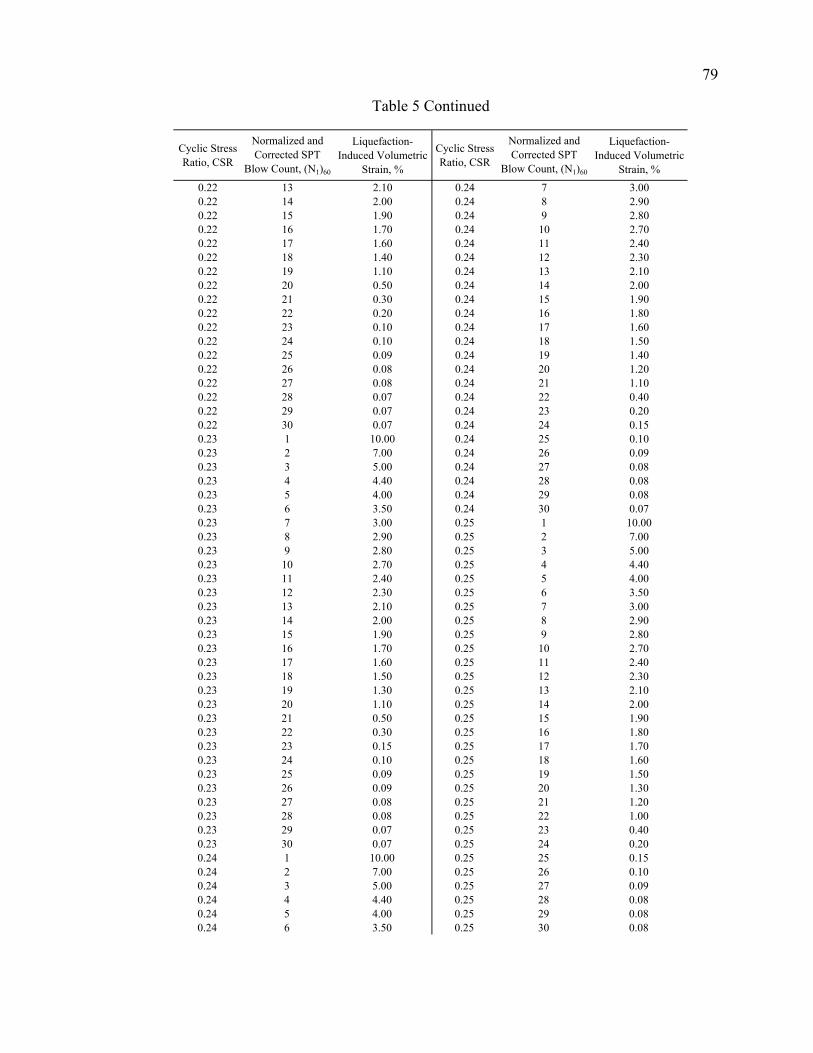
Cyclic Stress Ratio, CSR
Normalized and Corrected SPT
Blow Count, (N1)60
Liquefaction-Induced Volumetric
Strain, %
Cyclic Stress Ratio, CSR
Normalized and Corrected SPT
Blow Count, (N1)60
Liquefaction-Induced Volumetric
Strain, %0.22 13 2.10 0.24 7 3.000.22 14 2.00 0.24 8 2.900.22 15 1.90 0.24 9 2.800.22 16 1.70 0.24 10 2.700.22 17 1.60 0.24 11 2.400.22 18 1.40 0.24 12 2.300.22 19 1.10 0.24 13 2.100.22 20 0.50 0.24 14 2.000.22 21 0.30 0.24 15 1.900.22 22 0.20 0.24 16 1.800.22 23 0.10 0.24 17 1.600.22 24 0.10 0.24 18 1.500.22 25 0.09 0.24 19 1.400.22 26 0.08 0.24 20 1.200.22 27 0.08 0.24 21 1.100.22 28 0.07 0.24 22 0.400.22 29 0.07 0.24 23 0.200.22 30 0.07 0.24 24 0.150.23 1 10.00 0.24 25 0.100.23 2 7.00 0.24 26 0.090.23 3 5.00 0.24 27 0.080.23 4 4.40 0.24 28 0.080.23 5 4.00 0.24 29 0.080.23 6 3.50 0.24 30 0.070.23 7 3.00 0.25 1 10.000.23 8 2.90 0.25 2 7.000.23 9 2.80 0.25 3 5.000.23 10 2.70 0.25 4 4.400.23 11 2.40 0.25 5 4.000.23 12 2.30 0.25 6 3.500.23 13 2.10 0.25 7 3.000.23 14 2.00 0.25 8 2.900.23 15 1.90 0.25 9 2.800.23 16 1.70 0.25 10 2.700.23 17 1.60 0.25 11 2.400.23 18 1.50 0.25 12 2.300.23 19 1.30 0.25 13 2.100.23 20 1.10 0.25 14 2.000.23 21 0.50 0.25 15 1.900.23 22 0.30 0.25 16 1.800.23 23 0.15 0.25 17 1.700.23 24 0.10 0.25 18 1.600.23 25 0.09 0.25 19 1.500.23 26 0.09 0.25 20 1.300.23 27 0.08 0.25 21 1.200.23 28 0.08 0.25 22 1.000.23 29 0.07 0.25 23 0.400.23 30 0.07 0.25 24 0.200.24 1 10.00 0.25 25 0.150.24 2 7.00 0.25 26 0.100.24 3 5.00 0.25 27 0.090.24 4 4.40 0.25 28 0.080.24 5 4.00 0.25 29 0.080.24 6 3.50 0.25 30 0.08
Table 5 Continued
79

Cyclic Stress Ratio, CSR
Normalized and Corrected SPT
Blow Count, (N1)60
Liquefaction-Induced Volumetric
Strain, %
Cyclic Stress Ratio, CSR
Normalized and Corrected SPT
Blow Count, (N1)60
Liquefaction-Induced Volumetric
Strain, %
0.26 1 10.00 0.27 25 0.300.26 2 7.00 0.27 26 0.200.26 3 5.00 0.27 27 0.100.26 4 4.40 0.27 28 0.090.26 5 4.00 0.27 29 0.090.26 6 3.50 0.27 30 0.080.26 7 3.00 0.28 1 10.000.26 8 2.90 0.28 2 7.000.26 9 2.80 0.28 3 5.000.26 10 2.70 0.28 4 4.400.26 11 2.40 0.28 5 4.000.26 12 2.30 0.28 6 3.500.26 13 2.10 0.28 7 3.000.26 14 2.00 0.28 8 2.900.26 15 1.90 0.28 9 2.800.26 16 1.80 0.28 10 2.700.26 17 1.70 0.28 11 2.400.26 18 1.60 0.28 12 2.300.26 19 1.50 0.28 13 2.100.26 20 1.40 0.28 14 2.000.26 21 1.20 0.28 15 1.900.26 22 1.10 0.28 16 1.800.26 23 0.60 0.28 17 1.700.26 24 0.30 0.28 18 1.650.26 25 0.20 0.28 19 1.600.26 26 0.15 0.28 20 1.400.26 27 0.10 0.28 21 1.300.26 28 0.09 0.28 22 1.200.26 29 0.08 0.28 23 1.100.26 30 0.08 0.28 24 0.900.27 1 10.00 0.28 25 0.400.27 2 7.00 0.28 26 0.200.27 3 5.00 0.28 27 0.150.27 4 4.40 0.28 28 0.100.27 5 4.00 0.28 29 0.090.27 6 3.50 0.28 30 0.090.27 7 3.00 0.29 1 10.000.27 8 2.90 0.29 2 7.000.27 9 2.80 0.29 3 5.000.27 10 2.70 0.29 4 4.400.27 11 2.40 0.29 5 4.000.27 12 2.30 0.29 6 3.500.27 13 2.10 0.29 7 3.000.27 14 2.00 0.29 8 2.900.27 15 1.90 0.29 9 2.800.27 16 1.80 0.29 10 2.700.27 17 1.70 0.29 11 2.400.27 18 1.65 0.29 12 2.300.27 19 1.50 0.29 13 2.100.27 20 1.40 0.29 14 2.000.27 21 1.30 0.29 15 1.900.27 22 1.20 0.29 16 1.800.27 23 1.00 0.29 17 1.700.27 24 0.50 0.29 18 1.65
Table 5 Continued
80
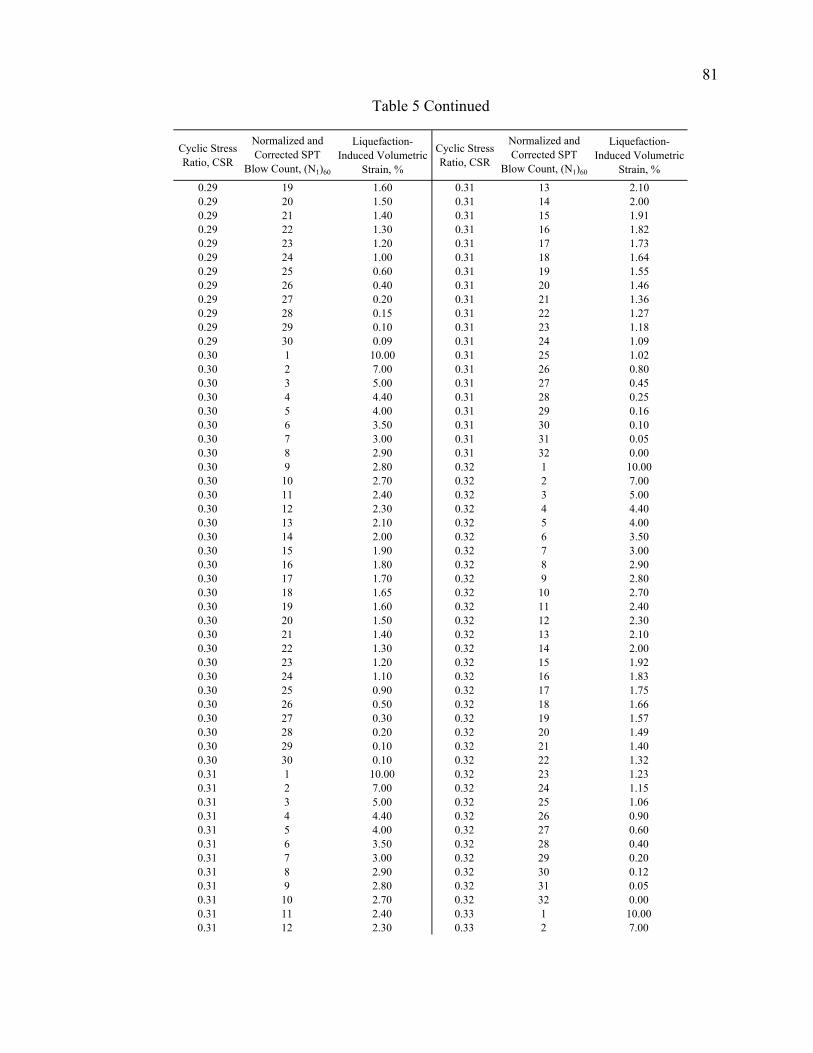
Cyclic Stress Ratio, CSR
Normalized and Corrected SPT
Blow Count, (N1)60
Liquefaction-Induced Volumetric
Strain, %
Cyclic Stress Ratio, CSR
Normalized and Corrected SPT
Blow Count, (N1)60
Liquefaction-Induced Volumetric
Strain, %0.29 19 1.60 0.31 13 2.100.29 20 1.50 0.31 14 2.000.29 21 1.40 0.31 15 1.910.29 22 1.30 0.31 16 1.820.29 23 1.20 0.31 17 1.730.29 24 1.00 0.31 18 1.640.29 25 0.60 0.31 19 1.550.29 26 0.40 0.31 20 1.460.29 27 0.20 0.31 21 1.360.29 28 0.15 0.31 22 1.270.29 29 0.10 0.31 23 1.180.29 30 0.09 0.31 24 1.090.30 1 10.00 0.31 25 1.020.30 2 7.00 0.31 26 0.800.30 3 5.00 0.31 27 0.450.30 4 4.40 0.31 28 0.250.30 5 4.00 0.31 29 0.160.30 6 3.50 0.31 30 0.100.30 7 3.00 0.31 31 0.050.30 8 2.90 0.31 32 0.000.30 9 2.80 0.32 1 10.000.30 10 2.70 0.32 2 7.000.30 11 2.40 0.32 3 5.000.30 12 2.30 0.32 4 4.400.30 13 2.10 0.32 5 4.000.30 14 2.00 0.32 6 3.500.30 15 1.90 0.32 7 3.000.30 16 1.80 0.32 8 2.900.30 17 1.70 0.32 9 2.800.30 18 1.65 0.32 10 2.700.30 19 1.60 0.32 11 2.400.30 20 1.50 0.32 12 2.300.30 21 1.40 0.32 13 2.100.30 22 1.30 0.32 14 2.000.30 23 1.20 0.32 15 1.920.30 24 1.10 0.32 16 1.830.30 25 0.90 0.32 17 1.750.30 26 0.50 0.32 18 1.660.30 27 0.30 0.32 19 1.570.30 28 0.20 0.32 20 1.490.30 29 0.10 0.32 21 1.400.30 30 0.10 0.32 22 1.320.31 1 10.00 0.32 23 1.230.31 2 7.00 0.32 24 1.150.31 3 5.00 0.32 25 1.060.31 4 4.40 0.32 26 0.900.31 5 4.00 0.32 27 0.600.31 6 3.50 0.32 28 0.400.31 7 3.00 0.32 29 0.200.31 8 2.90 0.32 30 0.120.31 9 2.80 0.32 31 0.050.31 10 2.70 0.32 32 0.000.31 11 2.40 0.33 1 10.000.31 12 2.30 0.33 2 7.00
Table 5 Continued
81

Cyclic Stress Ratio, CSR
Normalized and Corrected SPT
Blow Count, (N1)60
Liquefaction-Induced Volumetric
Strain, %
Cyclic Stress Ratio, CSR
Normalized and Corrected SPT
Blow Count, (N1)60
Liquefaction-Induced Volumetric
Strain, %
0.33 3 5.00 0.34 25 1.120.33 4 4.40 0.34 26 1.040.33 5 4.00 0.34 27 0.800.33 6 3.50 0.34 28 0.600.33 7 3.00 0.34 29 0.350.33 8 2.90 0.34 30 0.200.33 9 2.80 0.34 31 0.100.33 10 2.70 0.34 32 0.000.33 11 2.40 0.35 1 10.000.33 12 2.30 0.35 2 7.000.33 13 2.10 0.35 3 5.000.33 14 2.00 0.35 4 4.400.33 15 1.92 0.35 5 4.000.33 16 1.83 0.35 6 3.500.33 17 1.75 0.35 7 3.000.33 18 1.67 0.35 8 2.900.33 19 1.58 0.35 9 2.800.33 20 1.50 0.35 10 2.700.33 21 1.42 0.35 11 2.400.33 22 1.33 0.35 12 2.300.33 23 1.25 0.35 13 2.100.33 24 1.17 0.35 14 2.000.33 25 1.08 0.35 15 1.920.33 26 1.00 0.35 16 1.840.33 27 0.75 0.35 17 1.770.33 28 0.50 0.35 18 1.690.33 29 0.25 0.35 19 1.610.33 30 0.17 0.35 20 1.530.33 31 0.75 0.35 21 1.450.33 32 0.00 0.35 22 1.370.34 1 10.00 0.35 23 1.290.34 2 7.00 0.35 24 1.220.34 3 5.00 0.35 25 1.140.34 4 4.40 0.35 26 1.060.34 5 4.00 0.35 27 0.900.34 6 3.50 0.35 28 0.600.34 7 3.00 0.35 29 0.400.34 8 2.90 0.35 30 0.200.34 9 2.80 0.35 31 0.100.34 10 2.70 0.35 32 0.000.34 11 2.40 0.36 1 10.000.34 12 2.30 0.36 2 7.000.34 13 2.10 0.36 3 5.000.34 14 2.00 0.36 4 4.400.34 15 1.92 0.36 5 4.000.34 16 1.84 0.36 6 3.500.34 17 1.76 0.36 7 3.000.34 18 1.68 0.36 8 2.900.34 19 1.60 0.36 9 2.800.34 20 1.52 0.36 10 2.700.34 21 1.44 0.36 11 2.400.34 22 1.36 0.36 12 2.300.34 23 1.28 0.36 13 2.100.34 24 1.20 0.36 14 2.00
Table 5 Continued
82
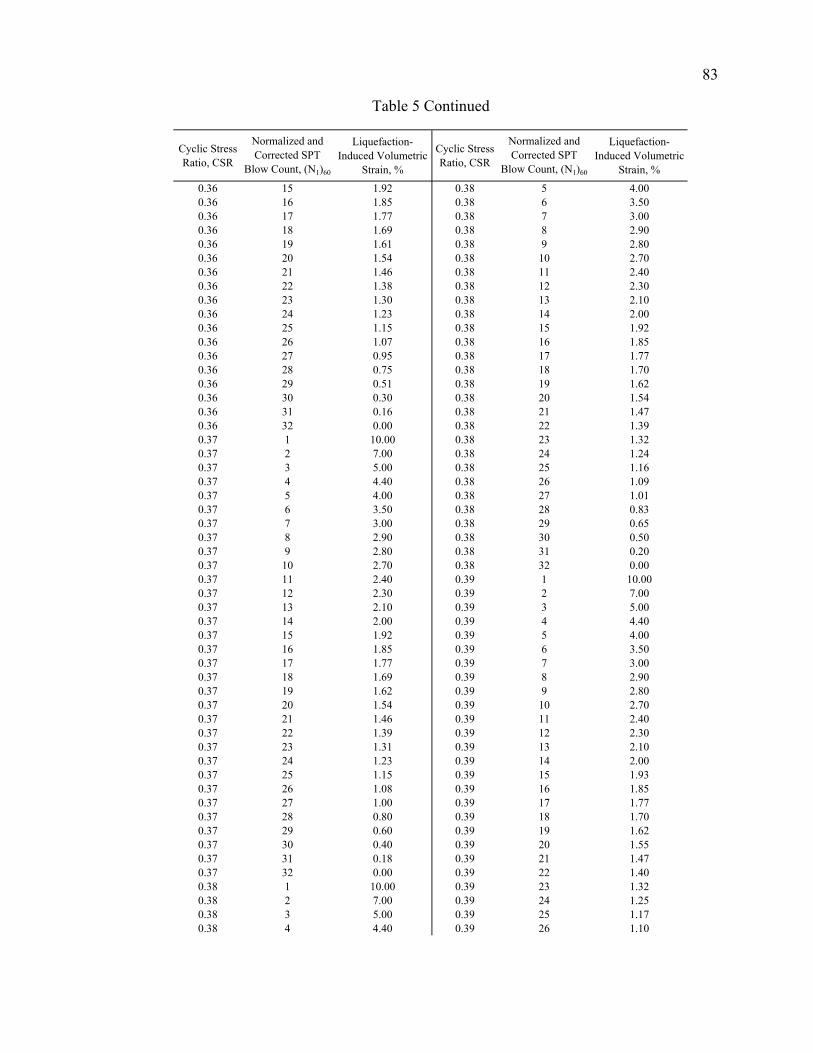
Cyclic Stress Ratio, CSR
Normalized and Corrected SPT
Blow Count, (N1)60
Liquefaction-Induced Volumetric
Strain, %
Cyclic Stress Ratio, CSR
Normalized and Corrected SPT
Blow Count, (N1)60
Liquefaction-Induced Volumetric
Strain, %
0.36 15 1.92 0.38 5 4.000.36 16 1.85 0.38 6 3.500.36 17 1.77 0.38 7 3.000.36 18 1.69 0.38 8 2.900.36 19 1.61 0.38 9 2.800.36 20 1.54 0.38 10 2.700.36 21 1.46 0.38 11 2.400.36 22 1.38 0.38 12 2.300.36 23 1.30 0.38 13 2.100.36 24 1.23 0.38 14 2.000.36 25 1.15 0.38 15 1.920.36 26 1.07 0.38 16 1.850.36 27 0.95 0.38 17 1.770.36 28 0.75 0.38 18 1.700.36 29 0.51 0.38 19 1.620.36 30 0.30 0.38 20 1.540.36 31 0.16 0.38 21 1.470.36 32 0.00 0.38 22 1.390.37 1 10.00 0.38 23 1.320.37 2 7.00 0.38 24 1.240.37 3 5.00 0.38 25 1.160.37 4 4.40 0.38 26 1.090.37 5 4.00 0.38 27 1.010.37 6 3.50 0.38 28 0.830.37 7 3.00 0.38 29 0.650.37 8 2.90 0.38 30 0.500.37 9 2.80 0.38 31 0.200.37 10 2.70 0.38 32 0.000.37 11 2.40 0.39 1 10.000.37 12 2.30 0.39 2 7.000.37 13 2.10 0.39 3 5.000.37 14 2.00 0.39 4 4.400.37 15 1.92 0.39 5 4.000.37 16 1.85 0.39 6 3.500.37 17 1.77 0.39 7 3.000.37 18 1.69 0.39 8 2.900.37 19 1.62 0.39 9 2.800.37 20 1.54 0.39 10 2.700.37 21 1.46 0.39 11 2.400.37 22 1.39 0.39 12 2.300.37 23 1.31 0.39 13 2.100.37 24 1.23 0.39 14 2.000.37 25 1.15 0.39 15 1.930.37 26 1.08 0.39 16 1.850.37 27 1.00 0.39 17 1.770.37 28 0.80 0.39 18 1.700.37 29 0.60 0.39 19 1.620.37 30 0.40 0.39 20 1.550.37 31 0.18 0.39 21 1.470.37 32 0.00 0.39 22 1.400.38 1 10.00 0.39 23 1.320.38 2 7.00 0.39 24 1.250.38 3 5.00 0.39 25 1.170.38 4 4.40 0.39 26 1.10
Table 5 Continued
83

Cyclic Stress Ratio, CSR
Normalized and Corrected SPT
Blow Count, (N1)60
Liquefaction-Induced Volumetric
Strain, %
Cyclic Stress Ratio, CSR
Normalized and Corrected SPT
Blow Count, (N1)60
Liquefaction-Induced Volumetric
Strain, %0.39 27 1.02 0.41 17 1.780.39 28 0.85 0.41 18 1.710.39 29 0.70 0.41 19 1.630.39 30 0.54 0.41 20 1.560.39 31 0.23 0.41 21 1.480.39 32 0.00 0.41 22 1.410.40 1 10.00 0.41 23 1.340.40 2 7.00 0.41 24 1.260.40 3 5.00 0.41 25 1.190.40 4 4.40 0.41 26 1.120.40 5 4.00 0.41 27 1.040.40 6 3.50 0.41 28 0.900.40 7 3.00 0.41 29 0.780.40 8 2.90 0.41 30 0.630.40 9 2.80 0.41 31 0.450.40 10 2.70 0.41 32 0.000.40 11 2.40 0.42 1 10.000.40 12 2.30 0.42 2 7.000.40 13 2.10 0.42 3 5.000.40 14 2.00 0.42 4 4.400.40 15 1.93 0.42 5 4.000.40 16 1.85 0.42 6 3.500.40 17 1.78 0.42 7 3.000.40 18 1.70 0.42 8 2.900.40 19 1.63 0.42 9 2.800.40 20 1.55 0.42 10 2.700.40 21 1.48 0.42 11 2.400.40 22 1.40 0.42 12 2.300.40 23 1.33 0.42 13 2.100.40 24 1.26 0.42 14 2.000.40 25 1.18 0.42 15 1.930.40 26 1.11 0.42 16 1.850.40 27 1.03 0.42 17 1.780.40 28 0.90 0.42 18 1.710.40 29 0.72 0.42 19 1.640.40 30 0.60 0.42 20 1.560.40 31 0.40 0.42 21 1.490.40 32 0.00 0.42 22 1.420.41 1 10.00 0.42 23 1.340.41 2 7.00 0.42 24 1.270.41 3 5.00 0.42 25 1.980.41 4 4.40 0.42 26 1.130.41 5 4.00 0.42 27 1.050.41 6 3.50 0.42 28 0.950.41 7 3.00 0.42 29 0.750.41 8 2.90 0.42 30 0.650.41 9 2.80 0.42 31 0.510.41 10 2.70 0.42 32 0.000.41 11 2.40 0.43 1 10.000.41 12 2.30 0.43 2 7.000.41 13 2.10 0.43 3 5.000.41 14 2.00 0.43 4 4.400.41 15 1.93 0.43 5 4.000.41 16 1.85 0.43 6 3.50
Table 5 Continued
84

Cyclic Stress Ratio, CSR
Normalized and Corrected SPT
Blow Count, (N1)60
Liquefaction-Induced Volumetric
Strain, %
Cyclic Stress Ratio, CSR
Normalized and Corrected SPT
Blow Count, (N1)60
Liquefaction-Induced Volumetric
Strain, %0.43 7 3.00 0.44 29 0.880.43 8 2.90 0.44 30 0.750.43 9 2.80 0.44 31 0.630.43 10 2.70 0.44 32 0.000.43 11 2.40 0.45 1 10.000.43 12 2.30 0.45 2 7.000.43 13 2.10 0.45 3 5.000.43 14 2.00 0.45 4 4.400.43 15 1.93 0.45 5 4.000.43 16 1.86 0.45 6 3.500.43 17 1.78 0.45 7 3.000.43 18 1.71 0.45 8 2.900.43 19 1.64 0.45 9 2.800.43 20 1.57 0.45 10 2.700.43 21 1.50 0.45 11 2.400.43 22 1.42 0.45 12 2.300.43 23 1.35 0.45 13 2.100.43 24 1.28 0.45 14 2.000.43 25 1.21 0.45 15 1.920.43 26 1.13 0.45 16 1.860.43 27 1.06 0.45 17 1.790.43 28 0.97 0.45 18 1.710.43 29 0.80 0.45 19 1.640.43 30 0.65 0.45 20 1.570.43 31 0.54 0.45 21 1.500.43 32 0.00 0.45 22 1.430.44 1 10.00 0.45 23 1.360.44 2 7.00 0.45 24 1.290.44 3 5.00 0.45 25 1.210.44 4 4.40 0.45 26 1.140.44 5 4.00 0.45 27 1.070.44 6 3.50 0.45 28 1.000.44 7 3.00 0.45 29 0.880.44 8 2.90 0.45 30 0.750.44 9 2.80 0.45 31 0.630.44 10 2.70 0.45 32 0.000.44 11 2.40 0.46 1 10.000.44 12 2.30 0.46 2 7.000.44 13 2.10 0.46 3 5.000.44 14 2.00 0.46 4 4.400.44 15 1.92 0.46 5 4.000.44 16 1.86 0.46 6 3.500.44 17 1.79 0.46 7 3.000.44 18 1.71 0.46 8 2.900.44 19 1.64 0.46 9 2.800.44 20 1.57 0.46 10 2.700.44 21 1.50 0.46 11 2.400.44 22 1.43 0.46 12 2.300.44 23 1.36 0.46 13 2.100.44 24 1.29 0.46 14 2.000.44 25 1.21 0.46 15 1.920.44 26 1.14 0.46 16 1.860.44 27 1.07 0.46 17 1.790.44 28 1.00 0.46 18 1.71
Table 5 Continued
85

Cyclic Stress Ratio, CSR
Normalized and Corrected SPT
Blow Count, (N1)60
Liquefaction-Induced Volumetric
Strain, %
Cyclic Stress Ratio, CSR
Normalized and Corrected SPT
Blow Count, (N1)60
Liquefaction-Induced Volumetric
Strain, %0.46 19 1.64 0.46 26 1.140.46 20 1.57 0.46 27 1.070.46 21 1.50 0.46 28 1.000.46 22 1.43 0.46 29 0.900.46 23 1.36 0.46 30 0.780.46 24 1.29 0.46 31 0.650.46 25 1.21 0.46 32 0.00
Table 5 Continued
86
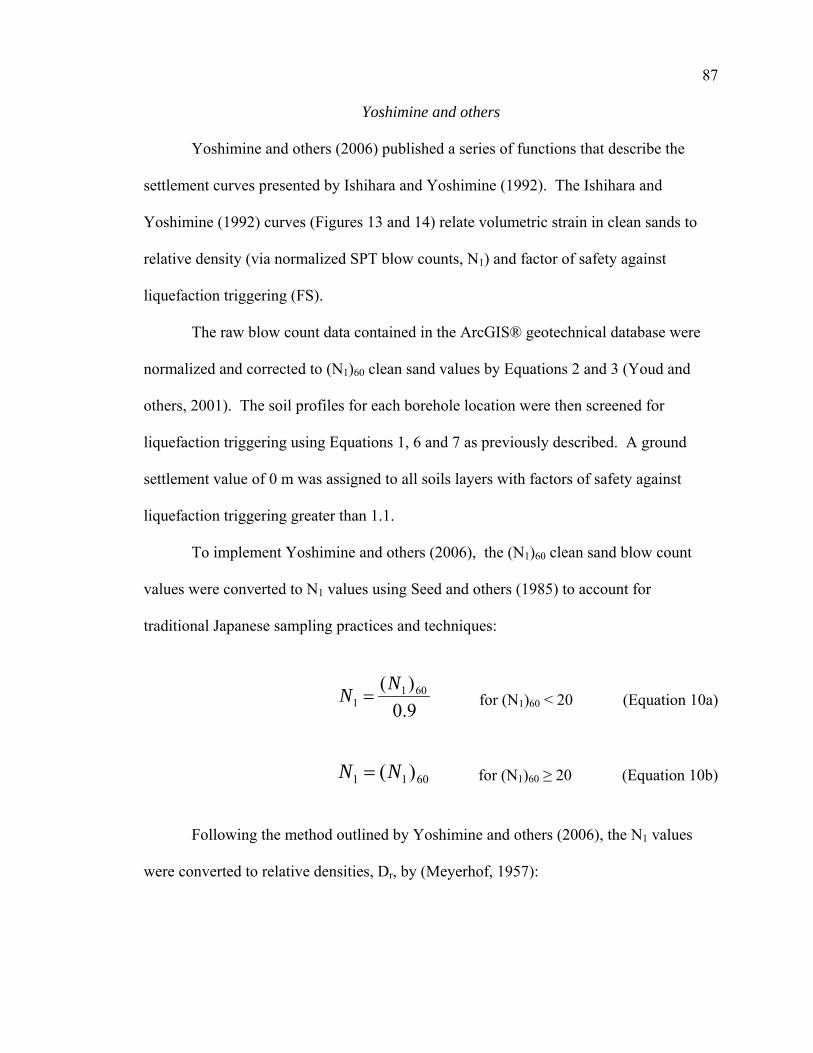
87
Yoshimine and others
Yoshimine and others (2006) published a series of functions that describe the
settlement curves presented by Ishihara and Yoshimine (1992). The Ishihara and
Yoshimine (1992) curves (Figures 13 and 14) relate volumetric strain in clean sands to
relative density (via normalized SPT blow counts, N1) and factor of safety against
liquefaction triggering (FS).
The raw blow count data contained in the ArcGIS® geotechnical database were
normalized and corrected to (N1)60 clean sand values by Equations 2 and 3 (Youd and
others, 2001). The soil profiles for each borehole location were then screened for
liquefaction triggering using Equations 1, 6 and 7 as previously described. A ground
settlement value of 0 m was assigned to all soils layers with factors of safety against
liquefaction triggering greater than 1.1.
To implement Yoshimine and others (2006), the (N1)60 clean sand blow count
values were converted to N1 values using Seed and others (1985) to account for
traditional Japanese sampling practices and techniques:
9.0
)( 6011
NN for (N1)60 < 20 (Equation 10a)
6011 )(NN for (N1)60 ≥ 20 (Equation 10b)
Following the method outlined by Yoshimine and others (2006), the N1 values
were converted to relative densities, Dr, by (Meyerhof, 1957):

88
7.1
21 1NDr (Equation 11)
and the likelihood of liquefaction triggering, FS, was calculated according to the Japanese
Design Code for Highway Bridges (2000):
L
RFS (Equation 12)
7.1
0882.0 1NR for N1 < 14 (Equation 13a)
5.4
161
7.16.1
7.10882.0
N
EN
R for N1 ≥ 14 (Equation 13b)
grL
v
vd
' (Equation 14)
Drd 015.00.1 (Equation 15)
where N1 is the normalized and corrected Japanese-modified SPT blow count, v and ’v
are the total and effective overburden pressures, respectively, is the PGA for the
analysis, D is the depth from ground surface and rd is a stress reduction factor.

89
0.4
0.6
0.8
1.0
1.2
1.4
1.6
1.8
2.0
0 2 4 6 8 10 12 14 16
Max. Single Amplitude Shear Strain, max
FS
Figure 13. Curves used to correlate single amplitude shear strain (max) to factor of safety
against liquefaction (relative density, Dr, calculated from N1).
0.0
0.5
1.0
1.5
2.0
2.5
3.0
3.5
4.0
4.5
5.0
0 2 4 6 8 10 12 14 16
Max. Single Amplitude Shear Strain, max
Per
cen
t R
econ
solid
atio
n V
ol. S
trai
n,
v
Figure 14. Curves used to correlate single amplitude of shear strain (max) to post-
liquefaction settlement.

90
The maximum single amplitude of shear strain, max, for all sites with a factor of
safety against liquefaction triggering, FS, less than or equal to 1.1 was calculated by
Yoshimine and others (2006). In the following equations Fult is a nameless intermediate
variable and the relative density prior to liquefaction, Dr,ini, is expressed as an integer
(i.e., 65 percent is expressed as 65):
ult
ult
FFS
FFS
1
25.3max if Fult ≤ FS ≤ 2.0 (Equation 16a)
0max if FS ≥ 2.0 (Equation 16b)
max if Fult ≤ FS (Equation 16c)
where
032.0047.00006.0 ,2, inirinirult DDF if Dr,ini ≥ 39.2% (Equation 17a)
9524.0ultF if Dr,ini < 39.2% (Equation 17b)
Finally, using the initial relative densities, Dr,ini, and the maximum single
amplitude of shear strains, max, percent liquefaction-induced volumetric strains, v, were
estimated by (Yoshimine and others, 2006):
v = 1.5[exp(-0.025Dr,ini)]max if max ≤ 8% (Equation 18a)
v = 12exp(-0.025Dr,ini) if max > 8% (Equation 18b)

91
The estimated settlement, Y, at each borehole was the summation of the
thickness of each liquefiable soil layer, t, times the respective estimated volumetric strain,
v:
n
iiviY t
1, (Equation 19)
As previously mentioned, ground settlement value of 0 m was assigned to all
locations with factors of safety for liquefaction triggering greater than 1.1. Since
earthquake magnitude was not a required input variable, no magnitude scaling factors
were used in this method.
Comparison of Methods
The calculated settlements (TS and Y) were compared at each borehole to assess
the resultant similarities and differences between the two methodologies. The results for
the three analysis events are shown in Table 6. For example, the scenario M7.0
earthquake settlement data set showed an average difference between the two methods of
0.004 m, with a maximum difference of 0.083 m. Of the 963 boreholes, Tokimatsu and
Seed (1987) predicted higher settlements than Yoshimine and others (2006) in 232
boreholes and the opposite was true for 444 boreholes. Both methods predicted no
settlement in 287 boreholes. A method-to-method comparison of the differences showed
that 74 percent of the boreholes were within 0.01 m, 92 percent were within 0.025 m and
99 percent were within 0.05 m.
92 It was concluded that the two methods produced relatively similar results when
considering the quality of the input data and the ultimate use of the mapping.
Subsequently, the average of the two methods was considered appropriate to estimate the
ground settlement, liq, at each liquefiable borehole location:
2
YTSliq
(Equation 20)

93
Table 6
Comparison of TS and Y at each Borehole for the Three Analysis Events
Wasatch Fault
M7.0 Event 2 percent Prob. of
Exceedance in 50 yrs 10 percent Prob. of
Exceedance in 50 yrs
Average Difference, m 0.004 0.006 0.002
Maximum Difference, m 0.083 0.083 0.076
Number of Boreholes where TS > Y
232 189 313
Number of Boreholes where Y > TS
444 487 352
Number of Boreholes where TS = Y = 0
287 287 298
Percent of Boreholes where TS and Y are
within 0.010 m 73.9 73.7 78.4
Percent of Boreholes where TS and Y are
within 0.025 m 92.3 91.4 94.3
Percent of Boreholes where TS and Y are
within 0.050 m 99.0 98.8 99.3
APPENDIX C
HAZARD CLASS DEVELOPMENT
95
This report presents the first liquefaction-induced ground displacement maps
developed for Utah using both geotechnical and geological data in conjunction with
deterministic and probabilistic estimates of strong motion.
Methods and Classifications
The lateral spread maps are a continuation of work completed for the northern
part of the Salt Lake Valley by Bartlett and others (2005) and Olsen and others (2007).
The methods used for this paper are consistent with the methods developed in those
reports; the reader is referred to those reports for a detailed explanation of the analysis
methodology. In short, lateral spread displacements were estimated by the Youd and
others (2002) regression model for all borehole locations having a factor of safety against
liquefaction triggering less than or equal to 1.1. The estimated horizontal displacements
(DH) were further categorized as “minimal” (0 m); “low” (0 to 0.1 m); “moderate” (0.1 to
0.3 m); “high” (0.3 to 1.0 m); and “very high” (greater than 1.0 m). All boreholes with
factors of safety against liquefaction triggering greater than 1.1 were assigned a lateral
spread displacement of 0 m.
The methods used to estimate liquefaction-induced settlement are exhaustively
explained in Appendix B. Briefly, settlement estimates were averaged from settlements
estimated by Tokimatsu and Seed (1987) and Yoshimine and others (2006). The ground
settlement estimates were categorized as “low” (0 to 0.05 m); “moderate” (0.05 to 0.1 m);
”high” (0.1 to 0.3 m); and “very high” (greater than 0.3 m). All soil layers with factors of
safety against liquefaction triggering greater than 1.1 were assigned a settlement of 0 m.
In the six ground displacement maps (see Figures 3 through 5 and 9 through 11), a
hazard category was assigned to each geologic unit shown in Figure 1 by statistical

96 analysis of the estimated displacements from all boreholes located within the respective
geologic unit or group of units with similar subsurface characteristics (e.g., near-surface
soil type, origin, deposition and age). A total of 24 geologic groups were assessed and
assigned a hazard classification for each map. All 963 boreholes from the ArcGIS®
database are contained within the 24 geologic groups.
To assess the localized hazard, the estimated displacement at each borehole
location was shown as a dot that was colored according to the hazard categories
previously mentioned. The dot coloring was consistent with the classification shading
shown in Figures 3 through 5 and 9 through 11. In some areas, several clearly defined
homogenous or nearly homogenous dot clusters representing varying hazard categories
existed in the same geologic unit. In these cases, the geologic units were subdivided
prior to conducting statistical analysis.
An example of a “dot map” is included as Figure 15. The geologic unit shown
highlighted in the middle of the figure is the Qlaly unit (lacustrine, marsh and alluvium
deposits) located in the northeast quadrant of the valley. Due to the concentration of
increased hazards in the northern (upper) part and inferior hazards in the southern (lower)
part, this geologic unit was subdivided along the roadway that extends across the lower-
third of the unit (Interstate 80).

97
Figure 15. “Dot map” showing boreholes in Qlaly unit in northeast valley quadrant.
Deterministic Maps
Using the method discussed by Bartlett and others (2005) and Olsen and others
(2007), cumulative histograms of increasing hazard severity were developed to determine
an 85 percent nonexceedance ground displacement threshold for the M7.0 Wasatch fault
scenario event maps. The 85 percent nonexceedance criterion means that no more than
15 percent of the estimated displacements exceed the hazard category assigned to the
respective geologic unit or group of units and thus approximates a mean plus one
standard deviation criterion. A sample histogram is shown in Figure 16. This histogram
corresponds to the lateral spread hazard estimated for the northern part of the Qlaly
geologic unit shown in Figure 15. Based on the 85 percent criterion, the lateral spread
hazard associated with this geologic unit was classified as “very high.” As shown by the
solid horizontal line at 85 percent, no more than 15 percent of the displacement results

98
Qlaly unit located between I-15 and 1300 East from 600 North to 4500 South, data north of I-80 only, 87 boreholes
Minimal, 41.4% Low, 10.3% Moderate, 4.6% High, 11.5% Very High, 32.2%0
10
20
30
40
50
60
70
80
90
100
Cum
ulat
ive
Perc
ent b
y C
lass
Figure 16. Histogram showing “very high” hazard classification for lateral spread caused
by a M7.0 event on the Wasatch fault for the northern part of Qlaly unit located in northeast valley quadrant.
exceed the assigned hazard category. Several additional histograms included as Figures
17 through 21 further illustrate the 85 percent criterion and subsequent hazard
classification. The analysis type and assigned hazard category are listed in each figure
description.
Probabilistic Maps
When the natural log of the probabilistic-based data was taken, it was observed
that the datasets from well-sampled units generally demonstrated a log-normal
distribution. Figure 22 shows the log-normal distribution of the natural log of the ground
settlement estimates based on a 2 percent probability of exceedance in 50 years (2PE50)
for the boreholes located in the northern part of the Qlaly unit shown in Figure 15. To
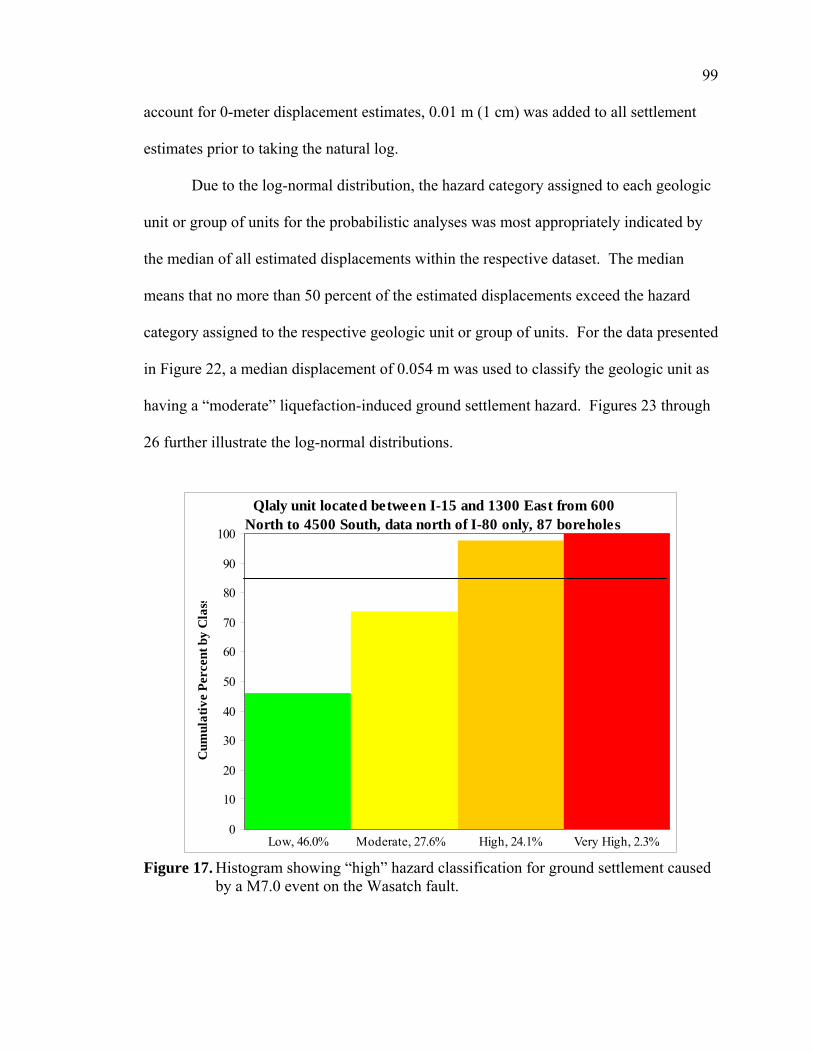
99 account for 0-meter displacement estimates, 0.01 m (1 cm) was added to all settlement
estimates prior to taking the natural log.
Due to the log-normal distribution, the hazard category assigned to each geologic
unit or group of units for the probabilistic analyses was most appropriately indicated by
the median of all estimated displacements within the respective dataset. The median
means that no more than 50 percent of the estimated displacements exceed the hazard
category assigned to the respective geologic unit or group of units. For the data presented
in Figure 22, a median displacement of 0.054 m was used to classify the geologic unit as
having a “moderate” liquefaction-induced ground settlement hazard. Figures 23 through
26 further illustrate the log-normal distributions.
Qlaly unit located between I-15 and 1300 East from 600 North to 4500 South, data north of I-80 only, 87 boreholes
Very High, 2.3%High, 24.1%Moderate, 27.6%Low, 46.0%0
10
20
30
40
50
60
70
80
90
100
Cum
ulat
ive
Per
cent
by
Cla
ss
Figure 17. Histogram showing “high” hazard classification for ground settlement caused
by a M7.0 event on the Wasatch fault.

100
Qal2 deposit located alongside Qal1 unit in center of valley, branches to Little and Big Cottonwood Canyons, 111 boreholes
Minimal, 45.0% Low, 22.5% Moderate, 9.0% High, 13.5% Very High, 9.9%0
10
20
30
40
50
60
70
80
90
100
Cum
ulat
ive
Perc
ent b
y C
lass
Figure 18. Histogram showing “high” hazard classification for lateral spread caused by a
M7.0 event on the Wasatch fault.
Qal2 deposit located alongside Qal1 unit in center of valley, branches to Little and Big Cottonwood Canyons, 111 boreholes
Very High, 0.9%High, 11.7%Moderate, 20.7%Low, 66.7%0
10
20
30
40
50
60
70
80
90
100
Cum
ulat
ive
Perc
ent b
y C
lass
Figure 19. Histogram showing “moderate” hazard classification for ground settlement
corresponding to a M7.0 event on the Wasatch fault.

101
Qlbpm units along I-15 corridor located between 3900 South and 9000 South, 123 boreholes
Minimal, 82.9% Low, 5.7% Moderate, 1.6% High, 5.7% Very High, 4.1%0
10
20
30
40
50
60
70
80
90
100
Cum
ulat
ive
Perc
ent b
y C
lass
Figure 20. Histogram showing “low” hazard classification for lateral spread caused by a
M7.0 event on the Wasatch fault.
Qlbpm units along I-15 corridor located between 3900 South and 9000 South, 123 boreholes
Low, 87.8% Moderate, 6.5% High, 5.7% Very High, 0.0%0
10
20
30
40
50
60
70
80
90
100
Cum
ulat
ive
Perc
ent b
y C
lass
Figure 21. Histogram showing “low” hazard classification for ground settlement
corresponding to a M7.0 event on the Wasatch fault.

102
Qlaly unit located between I-15 and 1300 East from 600 North to 4500 South, data north of I-80 only, 87 boreholes
0
5
10
15
20
25
0.0-0.5-1.0-1.5-2.0-2.5-3.0-3.5-4.0-4.5-5.0-5.5-6.0
ln(2PE50 settlement)
Fre
quen
cy
Figure 22. Histogram showing ground settlement displacement distribution for 2PE50. A
“moderate” ground settlement hazard was assigned to this unit.
Qlaly unit located between I-15 and 1300 East from 600 North to 4500 South, data north of I-80 only, 87 boreholes
0
2
4
6
8
10
12
14
16
18
20
0.0-0.5-1.0-1.5-2.0-2.5-3.0-3.5-4.0-4.5-5.0-5.5-6.0
ln(10PE50 settlement)
Fre
quen
cy
Figure 23. Histogram showing ground settlement displacement distribution for 10PE50.
A “low” ground settlement hazard was assigned to this unit.

103
Qlaly unit located between I-15 and 1300 East from 600 North to 4500 South, data north of I-80 only, 87 boreholes
0
5
10
15
20
25
30
35
40
3.002.251.500.750.00-0.75-1.50-2.25-3.00-3.75-4.50-5.25-6.00
ln(2PE50 lateral spread)
Fre
quen
cy
Figure 24. Histogram showing lateral spread displacement distribution for 2PE50. A
“low” lateral spread hazard was assigned to this unit.
Qlaly unit located between I-15 and 1300 East from 600 North to 4500 South, data north of I-80 only, 87 boreholes
0
5
10
15
20
25
30
35
40
3.002.251.500.750.00-0.75-1.50-2.25-3.00-3.75-4.50-5.25-6.00
ln(10PE50 lateral spread)
Fre
quen
cy
Figure 25. Histogram showing lateral spread displacement distribution for 10PE50. A
“low” lateral spread hazard was assigned to this unit.

104
Qal2 deposit located alongside Qal1 unit in center of valley, branches to Little and Big Cottonwood Canyons, 111 boreholes
0
5
10
15
20
25
30
0.0-0.5-1.0-1.5-2.0-2.5-3.0-3.5-4.0-4.5-5.0-5.5-6.0
ln(settlement)
Freq
uenc
y
Figure 26. Histogram showing ground settlement displacement distribution for 10PE50.
A “moderate” ground settlement hazard was assigned to this unit.
Summary Tables
A hazard classification summary table for the three lateral spread maps for the 24
geologic groups is shown in Table 7. Table 8 summarizes the hazard classifications for
the three ground settlement maps for the 24 geologic groups. To complement Tables 7
and 8, Appendix D contains tables of the estimated displacements in each of the 24
geologic groups. As previously mentioned, all 963 boreholes within the ArcGIS®
database are contained within the 24 geologic groups. The tables in Appendix D may be
cross-referenced with Table 3 in Appendix A for a description of approximate borehole
location and date drilled.
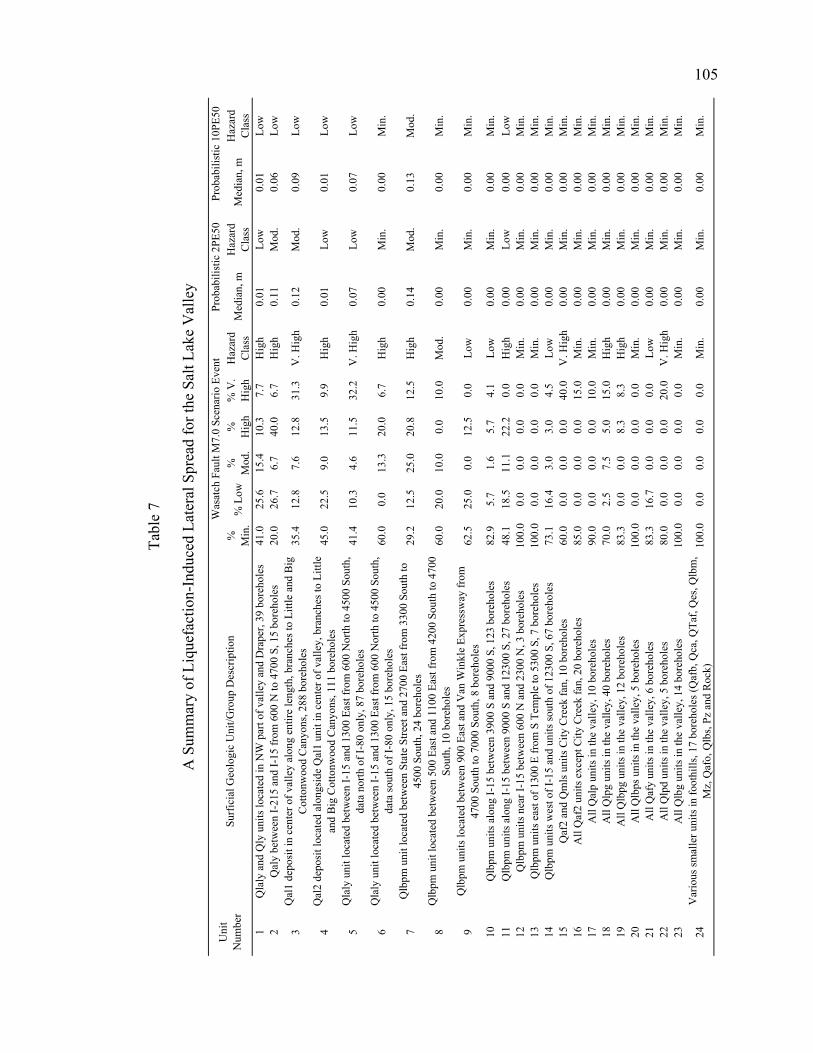
%
Min
.%
Low
%
Mod
.%
H
igh
% V
. H
igh
Haz
ard
Cla
ssM
edia
n, m
Haz
ard
Cla
ssM
edia
n, m
Haz
ard
Cla
ss1
Qla
ly a
nd Q
ly u
nits
loca
ted
in N
W p
art o
f val
ley
and
Dra
per,
39 b
oreh
oles
41.0
25.6
15.4
10.3
7.7
Hig
h0.
01Lo
w0.
01Lo
w2
Qal
y be
twee
n I-
215
and
I-15
from
600
N to
470
0 S,
15
bore
hole
s20
.026
.76.
740
.06.
7H
igh
0.11
Mod
.0.
06Lo
w
3Q
al1
depo
sit i
n ce
nter
of v
alle
y al
ong
entir
e le
ngth
, bra
nche
s to
Littl
e an
d B
ig
Cot
tonw
ood
Can
yons
, 288
bor
ehol
es35
.412
.87.
612
.831
.3V
. Hig
h0.
12M
od.
0.09
Low
4Q
al2
depo
sit l
ocat
ed a
long
side
Qal
1 un
it in
cen
ter o
f val
ley,
bra
nche
s to
Littl
e an
d B
ig C
otto
nwoo
d C
anyo
ns, 1
11 b
oreh
oles
45.0
22.5
9.0
13.5
9.9
Hig
h0.
01Lo
w0.
01Lo
w
5Q
laly
uni
t loc
ated
bet
wee
n I-
15 a
nd 1
300
East
from
600
Nor
th to
450
0 So
uth,
da
ta n
orth
of I
-80
only
, 87
bore
hole
s41
.410
.34.
611
.532
.2V
. Hig
h0.
07Lo
w0.
07Lo
w
6Q
laly
uni
t loc
ated
bet
wee
n I-
15 a
nd 1
300
East
from
600
Nor
th to
450
0 So
uth,
da
ta so
uth
of I-
80 o
nly,
15
bore
hole
s60
.00.
013
.320
.06.
7H
igh
0.00
Min
.0.
00M
in.
7Q
lbpm
uni
t loc
ated
bet
wee
n St
ate
Stre
et a
nd 2
700
East
from
330
0 So
uth
to
4500
Sou
th, 2
4 bo
reho
les
29.2
12.5
25.0
20.8
12.5
Hig
h0.
14M
od.
0.13
Mod
.
8Q
lbpm
uni
t loc
ated
bet
wee
n 50
0 Ea
st a
nd 1
100
East
from
420
0 So
uth
to 4
700
Sout
h, 1
0 bo
reho
les
60.0
20.0
10.0
0.0
10.0
Mod
.0.
00M
in.
0.00
Min
.
9Q
lbpm
uni
ts lo
cate
d be
twee
n 90
0 Ea
st a
nd V
an W
inkl
e Ex
pres
sway
from
47
00 S
outh
to 7
000
Sout
h, 8
bor
ehol
es62
.525
.00.
012
.50.
0Lo
w0.
00M
in.
0.00
Min
.
10Q
lbpm
uni
ts a
long
I-15
bet
wee
n 39
00 S
and
900
0 S,
123
bor
ehol
es82
.95.
71.
65.
74.
1Lo
w0.
00M
in.
0.00
Min
.11
Qlb
pm u
nits
alo
ng I-
15 b
etw
een
9000
S a
nd 1
2300
S, 2
7 bo
reho
les
48.1
18.5
11.1
22.2
0.0
Hig
h0.
00Lo
w0.
00Lo
w12
Qlb
pm u
nits
nea
r I-1
5 be
twee
n 60
0 N
and
230
0 N
, 3 b
oreh
oles
100.
00.
00.
00.
00.
0M
in.
0.00
Min
.0.
00M
in.
13Q
lbpm
uni
ts e
ast o
f 130
0 E
from
S T
empl
e to
530
0 S,
7 b
oreh
oles
100.
00.
00.
00.
00.
0M
in.
0.00
Min
.0.
00M
in.
14Q
lbpm
uni
ts w
est o
f I-1
5 an
d un
its so
uth
of 1
2300
S, 6
7 bo
reho
les
73.1
16.4
3.0
3.0
4.5
Low
0.00
Min
.0.
00M
in.
15Q
af2
and
Qm
ls u
nits
City
Cre
ek fa
n, 1
0 bo
reho
les
60.0
0.0
0.0
0.0
40.0
V. H
igh
0.00
Min
.0.
00M
in.
16A
ll Q
af2
units
exc
ept C
ity C
reek
fan,
20
bore
hole
s85
.00.
00.
00.
015
.0M
in.
0.00
Min
.0.
00M
in.
17A
ll Q
alp
units
in th
e va
lley,
10
bore
hole
s90
.00.
00.
00.
010
.0M
in.
0.00
Min
.0.
00M
in.
18A
ll Q
lpg
units
in th
e va
lley,
40
bore
hole
s70
.02.
57.
55.
015
.0H
igh
0.00
Min
.0.
00M
in.
19A
ll Q
lbpg
uni
ts in
the
valle
y, 1
2 bo
reho
les
83.3
0.0
0.0
8.3
8.3
Hig
h0.
00M
in.
0.00
Min
.20
All
Qlb
ps u
nits
in th
e va
lley,
5 b
oreh
oles
100.
00.
00.
00.
00.
0M
in.
0.00
Min
.0.
00M
in.
21A
ll Q
afy
units
in th
e va
lley,
6 b
oreh
oles
83.3
16.7
0.0
0.0
0.0
Low
0.00
Min
.0.
00M
in.
22A
ll Q
lpd
units
in th
e va
lley,
5 b
oreh
oles
80.0
0.0
0.0
0.0
20.0
V. H
igh
0.00
Min
.0.
00M
in.
23A
ll Q
lbg
units
in th
e va
lley,
14
bore
hole
s10
0.0
0.0
0.0
0.0
0.0
Min
.0.
00M
in.
0.00
Min
.
24V
ario
us sm
alle
r uni
ts in
foot
hills
, 17
bore
hole
s (Q
afb,
Qca
, QTa
f, Q
es, Q
lbm
, M
z, Q
afo,
Qlb
s, Pz
and
Roc
k)10
0.0
0.0
0.0
0.0
0.0
Min
.0.
00M
in.
0.00
Min
.
Prob
abili
stic
10P
E50
Uni
t N
umbe
r
Prob
abili
stic
2PE
50W
asat
ch F
ault
M7.
0 Sc
enar
io E
vent
Surf
icia
l Geo
logi
c U
nit/G
roup
Des
crip
tion
Tabl
e 7
A S
umm
ary
of L
ique
fact
ion-
Indu
ced
Late
ral S
prea
d fo
r the
Sal
t Lak
e V
alle
y
105

% L
ow%
Mod
.%
Hig
h%
V.
Hig
hH
azar
d C
lass
Med
ian,
mH
azar
d C
lass
Med
ian,
mH
azar
d C
lass
1Q
laly
and
Qly
uni
ts lo
cate
d in
NW
par
t of v
alle
y an
d D
rape
r, 39
bor
ehol
es48
.725
.625
.60.
0H
igh
0.05
Mod
.0.
04Lo
w2
Qal
y be
twee
n I-
215
and
I-15
from
600
N to
470
0 S,
15
bore
hole
s53
.320
.026
.70.
0H
igh
0.05
Low
0.04
Low
3Q
al1
depo
sit i
n ce
nter
of v
alle
y al
ong
entir
e le
ngth
, bra
nche
s to
Littl
e an
d B
ig C
otto
nwoo
d C
anyo
ns, 2
88 b
oreh
oles
49.7
26.4
22.6
1.4
Hig
h0.
05M
od.
0.03
Low
4Q
al2
depo
sit l
ocat
ed a
long
side
Qal
1 un
it in
cen
ter o
f val
ley,
bra
nche
s to
Littl
e an
d B
ig C
otto
nwoo
d C
anyo
ns, 1
11 b
oreh
oles
66.7
20.7
11.7
0.9
Mod
.0.
03Lo
w0.
01Lo
w
5Q
laly
uni
t loc
ated
bet
wee
n I-
15 a
nd 1
300
East
from
600
Nor
th to
450
0 So
uth,
dat
a no
rth o
f I-8
0 on
ly, 8
7 bo
reho
les
46.0
27.6
24.1
2.3
Hig
h0.
05M
od.
0.04
Low
6Q
laly
uni
t loc
ated
bet
wee
n I-
15 a
nd 1
300
East
from
600
Nor
th to
450
0 So
uth,
dat
a so
uth
of I-
80 o
nly,
15
bore
hole
s80
.013
.36.
70.
0M
od.
0.01
Low
0.01
Low
7Q
lbpm
uni
t loc
ated
bet
wee
n St
ate
Stre
et a
nd 2
700
East
from
330
0 So
uth
to
4500
Sou
th, 2
4 bo
reho
les
58.3
16.7
25.0
0.0
Hig
h0.
04Lo
w0.
03Lo
w
8Q
lbpm
uni
t loc
ated
bet
wee
n 50
0 Ea
st a
nd 1
100
East
from
420
0 So
uth
to
4700
Sou
th, 1
0 bo
reho
les
90.0
10.0
0.0
0.0
Low
0.02
Low
0.01
Low
9Q
lbpm
uni
ts lo
cate
d be
twee
n 90
0 Ea
st a
nd V
an W
inkl
e Ex
pres
sway
from
47
00 S
outh
to 7
000
Sout
h, 8
bor
ehol
es75
.012
.512
.50.
0M
od.
0.01
Low
0.01
Low
10Q
lbpm
uni
ts a
long
I-15
bet
wee
n 39
00 S
and
900
0 S,
123
bor
ehol
es87
.86.
55.
70.
0Lo
w0.
00Lo
w0.
00Lo
w11
Qlb
pm u
nits
alo
ng I-
15 b
etw
een
9000
S a
nd 1
2300
S, 2
7 bo
reho
les
51.9
14.8
33.3
0.0
Hig
h0.
05Lo
w0.
02Lo
w12
Qlb
pm u
nits
nea
r I-1
5 be
twee
n 60
0 N
and
230
0 N
, 3 b
oreh
oles
66.7
0.0
33.3
0.0
Hig
h0.
02Lo
w0.
00Lo
w13
Qlb
pm u
nits
eas
t of 1
300
E fr
om S
Tem
ple
to 5
300
S, 7
bor
ehol
es10
0.0
0.0
0.0
0.0
Low
0.00
Low
0.00
Low
14Q
lbpm
uni
ts w
est o
f I-1
5 an
d un
its so
uth
of 1
2300
S, 6
7 bo
reho
les
86.6
11.9
0.0
1.5
Low
0.00
Low
0.00
Low
15Q
af2
and
Qm
ls u
nits
City
Cre
ek fa
n, 1
0 bo
reho
les
60.0
0.0
40.0
0.0
Hig
h0.
04Lo
w0.
00Lo
w16
All
Qaf
2 un
its e
xcep
t City
Cre
ek fa
n, 2
0 bo
reho
les
95.0
5.0
0.0
0.0
Low
0.00
Low
0.00
Low
17A
ll Q
alp
units
in th
e va
lley,
10
bore
hole
s90
.00.
010
.00.
0Lo
w0.
00Lo
w0.
00Lo
w18
All
Qlp
g un
its in
the
valle
y, 4
0 bo
reho
les
80.0
15.0
5.0
0.0
Mod
.0.
01Lo
w0.
00Lo
w19
All
Qlb
pg u
nits
in th
e va
lley,
12
bore
hole
s91
.70.
08.
30.
0Lo
w0.
00Lo
w0.
00Lo
w20
All
Qlb
ps u
nits
in th
e va
lley,
5 b
oreh
oles
100.
00.
00.
00.
0Lo
w0.
00Lo
w0.
00Lo
w21
All
Qaf
y un
its in
the
valle
y, 6
bor
ehol
es10
0.0
0.0
0.0
0.0
Low
0.01
Low
0.00
Low
22A
ll Q
lpd
units
in th
e va
lley,
5 b
oreh
oles
80.0
20.0
0.0
0.0
Mod
.0.
02Lo
w0.
00Lo
w23
All
Qlb
g un
its in
the
valle
y, 1
4 bo
reho
les
92.9
7.1
0.0
0.0
Low
0.00
Low
0.00
Low
24V
ario
us sm
alle
r uni
ts in
foot
hills
, 17
bore
hole
s (Q
afb,
Qca
, QTa
f, Q
es,
Qlb
m, M
z, Q
afo,
Qlb
s, Pz
and
Roc
k)10
0.0
0.0
0.0
0.0
Low
0.00
Low
0.00
Low
Was
atch
Fau
lt M
7.0
Scen
ario
Eve
ntPr
obab
ilist
ic 2
PE50
Tabl
e 8
A S
umm
ary
of L
ique
fact
ion-
Indu
ced
Gro
und
Settl
emen
t for
the
Salt
Lake
Val
ley
Uni
t N
umbe
r
Prob
abili
stic
10P
E50
Surf
icia
l Geo
logi
c U
nit/G
roup
Des
crip
tion
106

APPENDIX D
TABLULATED GROUND DISPLACEMENTS

108
This appendix contains tables of the ground displacement values used in assigning
the hazard categories shown in the lateral spread and ground settlement maps. The tables
are organized according to the 24 geologic groups that are briefly described in Appendix
C. The tables indicate the borehole ID number of each borehole so that the displacement
estimates may be cross-referenced with Table 3 in Appendix A for a description of
approximate borehole location and date drilled.
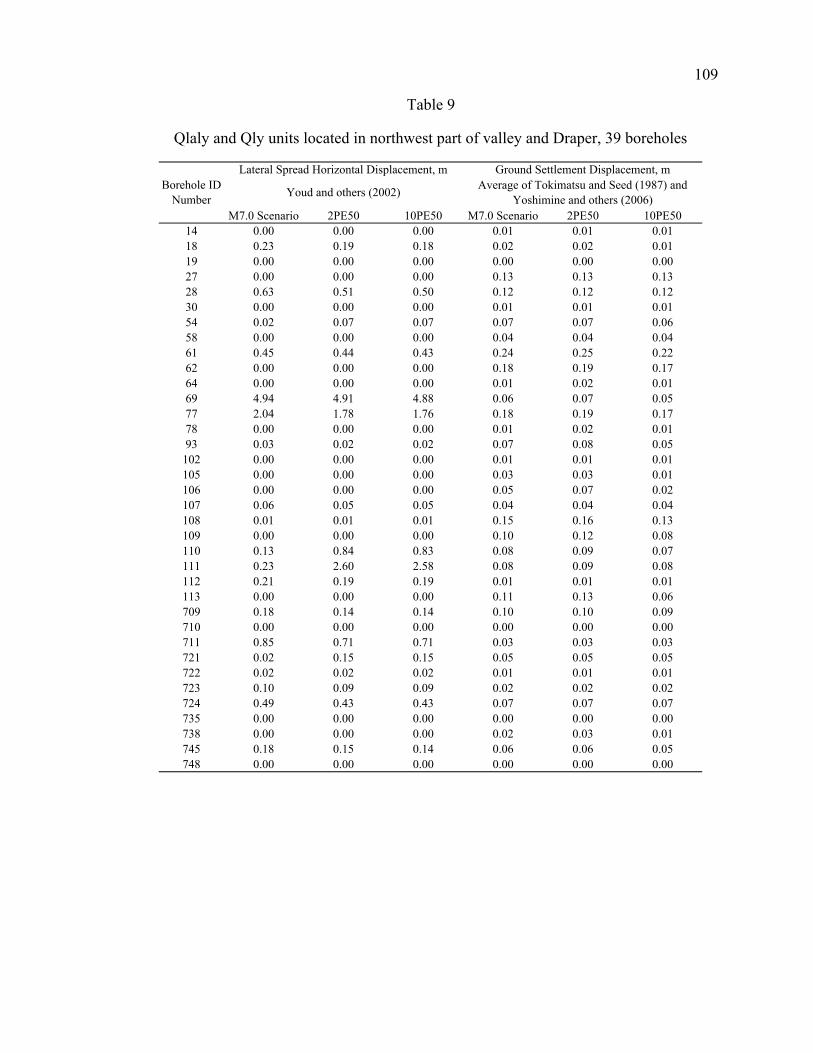
M7.0 Scenario 2PE50 10PE50 M7.0 Scenario 2PE50 10PE5014 0.00 0.00 0.00 0.01 0.01 0.0118 0.23 0.19 0.18 0.02 0.02 0.0119 0.00 0.00 0.00 0.00 0.00 0.0027 0.00 0.00 0.00 0.13 0.13 0.1328 0.63 0.51 0.50 0.12 0.12 0.1230 0.00 0.00 0.00 0.01 0.01 0.0154 0.02 0.07 0.07 0.07 0.07 0.0658 0.00 0.00 0.00 0.04 0.04 0.0461 0.45 0.44 0.43 0.24 0.25 0.2262 0.00 0.00 0.00 0.18 0.19 0.1764 0.00 0.00 0.00 0.01 0.02 0.0169 4.94 4.91 4.88 0.06 0.07 0.0577 2.04 1.78 1.76 0.18 0.19 0.1778 0.00 0.00 0.00 0.01 0.02 0.0193 0.03 0.02 0.02 0.07 0.08 0.05
102 0.00 0.00 0.00 0.01 0.01 0.01105 0.00 0.00 0.00 0.03 0.03 0.01106 0.00 0.00 0.00 0.05 0.07 0.02107 0.06 0.05 0.05 0.04 0.04 0.04108 0.01 0.01 0.01 0.15 0.16 0.13109 0.00 0.00 0.00 0.10 0.12 0.08110 0.13 0.84 0.83 0.08 0.09 0.07111 0.23 2.60 2.58 0.08 0.09 0.08112 0.21 0.19 0.19 0.01 0.01 0.01113 0.00 0.00 0.00 0.11 0.13 0.06709 0.18 0.14 0.14 0.10 0.10 0.09710 0.00 0.00 0.00 0.00 0.00 0.00711 0.85 0.71 0.71 0.03 0.03 0.03721 0.02 0.15 0.15 0.05 0.05 0.05722 0.02 0.02 0.02 0.01 0.01 0.01723 0.10 0.09 0.09 0.02 0.02 0.02724 0.49 0.43 0.43 0.07 0.07 0.07735 0.00 0.00 0.00 0.00 0.00 0.00738 0.00 0.00 0.00 0.02 0.03 0.01745 0.18 0.15 0.14 0.06 0.06 0.05748 0.00 0.00 0.00 0.00 0.00 0.00
Table 9
Qlaly and Qly units located in northwest part of valley and Draper, 39 boreholes
Lateral Spread Horizontal Displacement, m Ground Settlement Displacement, mBorehole ID
Number Youd and others (2002) Average of Tokimatsu and Seed (1987) and Yoshimine and others (2006)
109

M7.0 Scenario 2PE50 10PE50 M7.0 Scenario 2PE50 10PE5013 1.01 0.77 0.76 0.08 0.08 0.0717 0.00 0.00 0.00 0.00 0.00 0.0021 0.04 0.04 0.00 0.02 0.02 0.0125 0.00 0.00 0.00 0.01 0.01 0.0026 0.00 0.00 0.00 0.00 0.00 0.0065 0.28 0.17 0.17 0.20 0.21 0.1967 0.35 0.31 0.31 0.20 0.22 0.1482 0.38 0.30 0.30 0.03 0.03 0.0391 0.34 0.27 0.26 0.16 0.17 0.15
104 0.08 0.06 0.06 0.05 0.06 0.04681 0.61 0.51 0.00 0.04 0.04 0.02682 0.03 0.03 0.03 0.08 0.08 0.05726 0.05 0.06 0.05 0.03 0.03 0.02740 0.79 0.56 0.56 0.05 0.05 0.04746 0.37 0.11 0.11 0.14 0.14 0.13
Table 10
Qaly units between I-215 and I-15 from 600 North to 4700 South, 15 boreholes
Lateral Spread Horizontal Displacement, m Ground Settlement Displacement, mBorehole ID
Number Youd and others (2002) Average of Tokimatsu and Seed (1987) and Yoshimine and others (2006)
110

M7.0 Scenario 2PE50 10PE50 M7.0 Scenario 2PE50 10PE5012 3.06 2.54 2.53 0.16 0.16 0.1666 0.00 0.00 0.00 0.03 0.04 0.0268 0.78 0.71 0.71 0.15 0.17 0.1375 0.00 0.00 0.00 0.03 0.04 0.0279 0.00 0.00 0.00 0.03 0.04 0.0192 0.00 0.00 0.00 0.02 0.02 0.0294 1.71 1.39 1.38 0.15 0.16 0.1199 0.24 0.21 0.21 0.08 0.10 0.05
134 0.00 0.00 0.00 0.08 0.10 0.02135 0.01 0.00 0.00 0.11 0.12 0.09136 0.02 0.02 0.02 0.05 0.06 0.04137 0.96 0.75 0.74 0.06 0.06 0.04138 0.00 0.00 0.00 0.03 0.03 0.02139 0.00 0.00 0.00 0.05 0.07 0.01140 0.01 0.01 0.01 0.16 0.17 0.11141 0.00 0.00 0.00 0.03 0.03 0.00142 0.00 0.00 0.00 0.01 0.01 0.00143 0.01 0.00 0.00 0.03 0.03 0.02144 4.33 3.75 3.73 0.03 0.03 0.03145 0.01 0.00 0.00 0.03 0.03 0.03146 0.00 0.00 0.00 0.00 0.00 0.00147 0.00 0.00 0.00 0.00 0.00 0.00148 0.00 0.00 0.00 0.06 0.06 0.05149 0.00 0.00 0.00 0.06 0.06 0.05150 0.00 0.00 0.00 0.00 0.00 0.00151 0.03 0.02 0.02 0.05 0.05 0.04152 0.20 0.15 0.15 0.11 0.11 0.09153 0.20 0.14 0.14 0.16 0.16 0.13154 0.00 0.00 0.00 0.04 0.04 0.01172 0.13 0.11 0.11 0.13 0.13 0.12173 0.00 0.00 0.00 0.03 0.03 0.00174 0.00 0.00 0.00 0.05 0.05 0.03178 0.00 0.00 0.00 0.11 0.11 0.11179 0.00 0.00 0.00 0.02 0.02 0.02180 0.00 0.00 0.00 0.02 0.02 0.01181 0.27 0.24 0.24 0.10 0.10 0.06182 0.05 0.04 0.04 0.11 0.12 0.08183 0.00 0.00 0.00 0.10 0.12 0.03184 0.11 0.10 0.10 0.06 0.06 0.04185 0.00 0.00 0.00 0.00 0.00 0.00186 0.00 0.00 0.00 0.06 0.07 0.04187 0.41 0.38 0.38 0.06 0.07 0.03188 0.00 0.00 0.00 0.01 0.01 0.00189 0.00 0.00 0.00 0.04 0.04 0.02190 0.00 0.00 0.00 0.00 0.00 0.00191 0.29 0.22 0.22 0.06 0.06 0.03
Table 11
Qal1 deposit in center of valley along entire length, branches to Little and Big Cottonwood Canyons, 288 boreholes
Lateral Spread Horizontal Displacement, m Ground Settlement Displacement, mBorehole ID
Number Youd and others (2002) Average of Tokimatsu and Seed (1987) and Yoshimine and others (2006)
111

M7.0 Scenario 2PE50 10PE50 M7.0 Scenario 2PE50 10PE50192 0.00 0.00 0.00 0.10 0.11 0.03193 0.00 0.00 0.00 0.01 0.02 0.00194 0.00 0.00 0.00 0.06 0.07 0.01195 5.24 4.44 4.40 0.17 0.17 0.14196 0.14 0.13 0.13 0.14 0.14 0.11197 0.27 0.25 0.24 0.18 0.19 0.16198 1.42 1.33 1.32 0.19 0.19 0.17199 0.14 0.13 0.13 0.09 0.09 0.07200 0.00 0.00 0.00 0.01 0.01 0.00201 0.00 0.00 0.00 0.00 0.00 0.00202 0.00 0.00 0.00 0.01 0.02 0.00203 2.14 1.91 1.89 0.06 0.06 0.05204 0.06 0.05 0.05 0.07 0.08 0.06205 0.14 0.13 0.13 0.04 0.04 0.04206 0.00 0.00 0.00 0.02 0.03 0.00207 0.01 0.01 0.01 0.07 0.08 0.03208 0.00 0.00 0.00 0.02 0.02 0.00209 0.00 0.00 0.00 0.08 0.09 0.07210 0.26 0.25 0.24 0.05 0.06 0.03211 0.09 0.08 0.08 0.13 0.14 0.07212 1.13 1.02 1.01 0.07 0.08 0.03213 0.64 0.59 0.59 0.08 0.08 0.07214 0.00 0.00 0.00 0.00 0.00 0.00215 0.00 0.00 0.00 0.00 0.00 0.00216 0.00 0.00 0.00 0.00 0.00 0.00217 0.00 0.00 0.00 0.03 0.03 0.02218 0.97 0.92 0.91 0.05 0.05 0.05219 0.00 0.00 0.00 0.00 0.00 0.00220 0.00 0.00 0.00 0.03 0.03 0.01222 0.07 0.06 0.06 0.10 0.10 0.07223 0.00 0.00 0.00 0.00 0.00 0.00224 0.00 0.00 0.00 0.01 0.02 0.01225 0.43 0.39 0.38 0.16 0.16 0.12226 0.02 0.02 0.02 0.17 0.17 0.15227 1.07 1.00 0.99 0.13 0.15 0.07228 0.00 0.00 0.00 0.00 0.00 0.00229 0.13 0.12 0.12 0.08 0.09 0.06230 1.78 1.69 1.68 0.17 0.17 0.13231 0.91 0.86 0.85 0.10 0.11 0.07232 1.03 1.01 1.00 0.11 0.12 0.10233 1.33 1.25 1.24 0.04 0.04 0.04234 0.03 0.03 0.03 0.10 0.10 0.08235 0.24 0.21 0.21 0.08 0.10 0.04236 1.51 1.39 1.38 0.08 0.08 0.07237 0.00 0.00 0.00 0.00 0.00 0.00239 0.00 0.00 0.00 0.01 0.02 0.00240 1.37 1.17 1.16 0.11 0.11 0.10277 0.08 0.07 0.07 0.04 0.05 0.04279 1.11 0.90 0.89 0.02 0.02 0.01280 0.28 0.23 0.22 0.03 0.03 0.01
Borehole ID Number
Lateral Spread Horizontal Displacement, m Ground Settlement Displacement, m
Youd and others (2002) Average of Tokimatsu and Seed (1987) and Ishihara and Yoshimine (1992)
Table 11 Continued
112

M7.0 Scenario 2PE50 10PE50 M7.0 Scenario 2PE50 10PE50281 2.48 2.13 2.11 0.09 0.10 0.05282 1.89 1.59 1.57 0.12 0.12 0.11283 1.37 1.14 1.12 0.07 0.07 0.06284 0.29 0.24 0.24 0.31 0.32 0.25285 0.03 0.03 0.03 0.03 0.03 0.02286 0.04 0.04 0.04 0.03 0.04 0.01287 0.00 0.00 0.00 0.00 0.00 0.00289 3.32 2.90 2.86 0.20 0.20 0.19290 0.91 0.77 0.76 0.18 0.20 0.13291 1.30 1.07 1.06 0.19 0.21 0.13293 1.08 0.87 0.86 0.04 0.04 0.04295 2.46 2.14 2.12 0.06 0.07 0.05296 0.33 0.28 0.28 0.06 0.06 0.02297 1.34 1.16 1.15 0.03 0.03 0.03298 0.00 0.00 0.00 0.02 0.03 0.00299 0.69 0.58 0.57 0.05 0.05 0.04300 1.12 0.94 0.93 0.04 0.04 0.04301 1.28 1.05 1.04 0.04 0.04 0.04303 2.90 2.35 2.33 0.07 0.07 0.07306 1.07 0.84 0.83 0.03 0.03 0.01307 0.06 0.06 0.06 0.02 0.02 0.01330 0.00 0.00 0.00 0.00 0.00 0.00367 0.00 0.00 0.00 0.05 0.05 0.00368 2.23 1.87 1.84 0.03 0.03 0.02369 0.00 0.00 0.00 0.00 0.00 0.00372 0.00 0.00 0.00 0.03 0.03 0.01373 0.00 0.00 0.00 0.04 0.03 0.00374 0.52 0.43 0.00 0.09 0.09 0.01375 0.00 0.00 0.00 0.02 0.02 0.00376 0.00 0.00 0.00 0.00 0.00 0.00384 0.00 0.00 0.00 0.00 0.00 0.00385 0.00 0.00 0.00 0.02 0.02 0.00386 0.00 0.00 0.00 0.00 0.00 0.00387 0.00 0.00 0.00 0.00 0.00 0.00388 0.61 0.52 0.51 0.10 0.10 0.01429 1.13 0.97 0.00 0.09 0.09 0.07430 0.00 0.00 0.00 0.02 0.01 0.00431 0.00 0.00 0.00 0.07 0.07 0.02432 0.92 0.78 0.77 0.06 0.06 0.03433 0.00 0.00 0.00 0.02 0.01 0.00434 0.00 0.00 0.00 0.01 0.01 0.00435 0.00 0.00 0.00 0.06 0.06 0.03436 0.00 0.00 0.00 0.00 0.00 0.00439 0.00 0.00 0.00 0.02 0.02 0.00448 0.00 0.00 0.00 0.02 0.02 0.00459 3.55 2.37 2.36 0.08 0.08 0.05460 1.13 0.76 0.76 0.03 0.04 0.01465 0.00 0.00 0.00 0.00 0.00 0.00466 1.71 1.39 1.38 0.17 0.19 0.16467 0.50 0.39 0.39 0.04 0.04 0.03
Table 11 Continued
Borehole ID Number
Lateral Spread Horizontal Displacement, m Ground Settlement Displacement, m
Youd and others (2002) Average of Tokimatsu and Seed (1987) and Ishihara and Yoshimine (1992)
113

M7.0 Scenario 2PE50 10PE50 M7.0 Scenario 2PE50 10PE50474 2.69 2.04 2.03 0.15 0.15 0.13478 2.12 1.79 1.78 0.14 0.15 0.13479 2.96 1.80 1.79 0.28 0.28 0.26480 3.23 2.19 2.18 0.11 0.11 0.08481 0.00 0.00 0.00 0.10 0.10 0.05482 1.19 0.75 0.75 0.04 0.04 0.02485 3.50 2.49 2.48 0.11 0.11 0.09486 1.70 1.18 1.17 0.23 0.24 0.19487 2.30 1.88 1.87 0.04 0.04 0.04488 0.09 0.07 0.07 0.13 0.13 0.08489 0.73 0.57 0.57 0.06 0.06 0.06490 2.46 1.89 1.89 0.18 0.18 0.09494 3.35 2.27 2.26 0.19 0.20 0.17495 7.29 4.77 4.74 0.08 0.08 0.08496 1.49 1.20 1.19 0.04 0.04 0.04497 0.00 0.00 0.00 0.03 0.03 0.02498 3.11 2.09 0.09 0.21 0.23 0.13499 2.99 1.90 1.89 0.17 0.18 0.13500 0.00 0.00 0.00 0.14 0.14 0.08501 1.18 0.96 0.96 0.13 0.14 0.11502 4.05 3.10 3.08 0.13 0.13 0.12503 3.24 2.47 2.45 0.24 0.24 0.23504 0.64 0.49 0.49 0.08 0.09 0.05505 2.91 2.26 2.25 0.05 0.06 0.03514 0.56 0.42 0.42 0.06 0.08 0.02515 0.00 0.00 0.00 0.00 0.00 0.00516 1.58 1.14 1.14 0.05 0.06 0.04517 2.48 1.82 1.81 0.07 0.07 0.07518 0.00 0.00 0.00 0.13 0.14 0.08519 0.00 0.00 0.00 0.00 0.01 0.00520 0.00 0.00 0.00 0.10 0.11 0.08521 1.03 0.79 0.79 0.03 0.04 0.01522 0.00 0.00 0.00 0.02 0.03 0.00523 1.73 1.18 1.17 0.12 0.15 0.04524 1.55 1.22 0.00 0.02 0.03 0.00525 1.92 1.49 1.48 0.07 0.08 0.06526 2.14 1.70 1.69 0.26 0.26 0.25527 1.52 1.21 1.20 0.03 0.04 0.01528 1.07 0.83 0.83 0.06 0.07 0.04529 0.00 0.00 0.00 0.03 0.04 0.01530 1.44 1.18 1.18 0.04 0.04 0.03534 0.00 0.00 0.00 0.00 0.00 0.00535 0.00 0.00 0.00 0.01 0.01 0.00536 0.00 0.00 0.00 0.00 0.00 0.00537 0.00 0.00 0.00 0.03 0.03 0.02540 0.00 0.00 0.00 0.00 0.00 0.00541 1.24 0.91 0.91 0.04 0.04 0.02542 0.06 0.04 0.04 0.03 0.04 0.02543 0.00 0.00 0.00 0.00 0.00 0.00544 0.00 0.00 0.00 0.00 0.00 0.00
Table 11 Continued
Borehole ID Number
Lateral Spread Horizontal Displacement, m Ground Settlement Displacement, m
Youd and others (2002) Average of Tokimatsu and Seed (1987) and Ishihara and Yoshimine (1992)
114

M7.0 Scenario 2PE50 10PE50 M7.0 Scenario 2PE50 10PE50545 0.00 0.00 0.00 0.00 0.00 0.00546 0.03 0.03 0.03 0.01 0.01 0.01547 0.00 0.00 0.00 0.00 0.00 0.00548 0.09 0.07 0.07 0.01 0.01 0.01549 0.00 0.00 0.00 0.00 0.00 0.00550 0.00 0.00 0.00 0.00 0.00 0.00551 4.35 2.88 2.86 0.12 0.12 0.11552 0.85 0.67 0.67 0.01 0.01 0.00555 2.93 2.40 2.39 0.02 0.02 0.01556 1.97 1.58 1.57 0.03 0.03 0.02557 1.48 1.16 1.15 0.04 0.04 0.04558 0.00 0.00 0.00 0.00 0.00 0.00559 1.54 1.30 1.29 0.05 0.05 0.04560 0.43 0.32 0.32 0.01 0.01 0.00561 0.00 0.00 0.00 0.02 0.02 0.00562 0.10 0.09 0.00 0.03 0.04 0.01563 5.15 4.34 4.29 0.13 0.13 0.12564 1.35 1.13 1.11 0.04 0.04 0.04565 0.52 0.49 0.49 0.18 0.18 0.16566 0.46 0.43 0.42 0.19 0.20 0.16567 0.41 0.38 0.37 0.11 0.12 0.09568 0.00 0.00 0.00 0.07 0.07 0.07570 0.00 0.00 0.00 0.04 0.04 0.03571 0.01 0.01 0.01 0.03 0.03 0.03572 0.47 0.41 0.40 0.05 0.08 0.02573 2.74 2.33 2.31 0.31 0.31 0.25574 0.00 0.00 0.00 0.18 0.19 0.15575 0.61 0.53 0.53 0.06 0.06 0.04576 0.00 0.00 0.00 0.18 0.19 0.12577 0.07 0.07 0.07 0.09 0.11 0.05578 0.70 0.63 0.62 0.11 0.12 0.07579 1.22 1.04 1.03 0.32 0.34 0.27580 0.00 0.00 0.00 0.00 0.01 0.00581 0.16 0.13 0.13 0.05 0.05 0.04582 2.05 1.72 1.70 0.05 0.05 0.05630 0.03 0.03 0.03 0.50 0.52 0.48631 1.60 1.33 1.32 0.07 0.07 0.02632 1.51 1.28 1.27 0.17 0.17 0.16633 0.55 0.46 0.46 0.13 0.13 0.09634 1.10 0.91 0.91 0.11 0.12 0.10635 1.08 0.91 0.90 0.11 0.11 0.07636 2.24 1.88 1.86 0.13 0.13 0.11665 0.66 0.55 0.54 0.04 0.04 0.03666 0.38 0.31 0.30 0.05 0.06 0.02667 0.67 0.55 0.55 0.07 0.07 0.03679 1.17 0.98 0.97 0.06 0.07 0.03730 0.06 0.05 0.05 0.02 0.03 0.01731 0.44 0.37 0.37 0.02 0.02 0.02737 0.05 0.03 0.03 0.02 0.02 0.02744 0.74 0.70 0.69 0.09 0.09 0.08
Table 11 Continued
Borehole ID Number
Lateral Spread Horizontal Displacement, m Ground Settlement Displacement, m
Youd and others (2002) Average of Tokimatsu and Seed (1987) and Ishihara and Yoshimine (1992)
115

M7.0 Scenario 2PE50 10PE50 M7.0 Scenario 2PE50 10PE50747 0.59 0.44 0.44 0.08 0.08 0.04749 0.00 0.00 0.00 0.00 0.00 0.00
1008 0.00 0.00 0.00 0.02 0.01 0.001021 0.98 0.82 0.81 0.06 0.06 0.041025 0.00 0.00 0.00 0.05 0.05 0.021027 1.94 1.76 1.75 0.02 0.02 0.021029 0.37 0.35 0.34 0.09 0.09 0.081034 2.59 1.78 1.78 0.02 0.02 0.021039 2.99 2.66 2.64 0.06 0.06 0.051042 0.24 0.13 0.13 0.07 0.07 0.051043 4.93 4.40 4.38 0.20 0.21 0.171047 0.50 0.44 0.43 0.05 0.05 0.041054 0.10 0.08 0.08 0.10 0.11 0.061055 1.12 1.00 0.99 0.06 0.07 0.051057 0.00 0.00 0.00 0.00 0.01 0.001058 7.60 4.58 4.57 0.15 0.16 0.111068 1.55 1.23 1.22 0.13 0.14 0.101079 0.00 0.00 0.00 0.00 0.00 0.001080 2.33 1.90 1.89 0.06 0.06 0.061083 0.00 0.00 0.00 0.00 0.00 0.001106 0.17 0.12 0.12 0.09 0.09 0.061107 0.00 0.00 0.00 0.01 0.02 0.011117 0.00 0.00 0.00 0.00 0.00 0.001123 2.00 1.41 1.40 0.07 0.07 0.051130 2.04 1.46 1.45 0.02 0.02 0.021134 0.00 0.00 0.00 0.00 0.00 0.001136 1.01 0.81 0.80 0.06 0.06 0.041139 0.00 0.00 0.00 0.02 0.02 0.001140 0.00 0.00 0.00 0.00 0.00 0.001143 1.00 0.85 0.85 0.07 0.07 0.031144 0.00 0.00 0.00 0.01 0.02 0.001146 0.00 0.00 0.00 0.01 0.01 0.001148 0.16 0.11 0.11 0.02 0.02 0.011159 0.00 0.00 0.00 0.00 0.00 0.001160 0.03 0.03 0.03 0.07 0.07 0.031166 0.00 0.00 0.00 0.04 0.04 0.001236 0.87 0.76 0.75 0.01 0.02 0.00
1245 1.12 1.17 1.16 0.09 0.09 0.081274 0.00 0.00 0.00 0.07 0.06 0.011276 7.94 7.44 7.42 0.21 0.21 0.121298 0.00 0.00 0.00 0.00 0.00 0.001299 1.29 1.19 1.18 0.07 0.07 0.07
Table 11 Continued
Borehole ID Number
Lateral Spread Horizontal Displacement, m Ground Settlement Displacement, m
Youd and others (2002) Average of Tokimatsu and Seed (1987) and Ishihara and Yoshimine (1992)
116
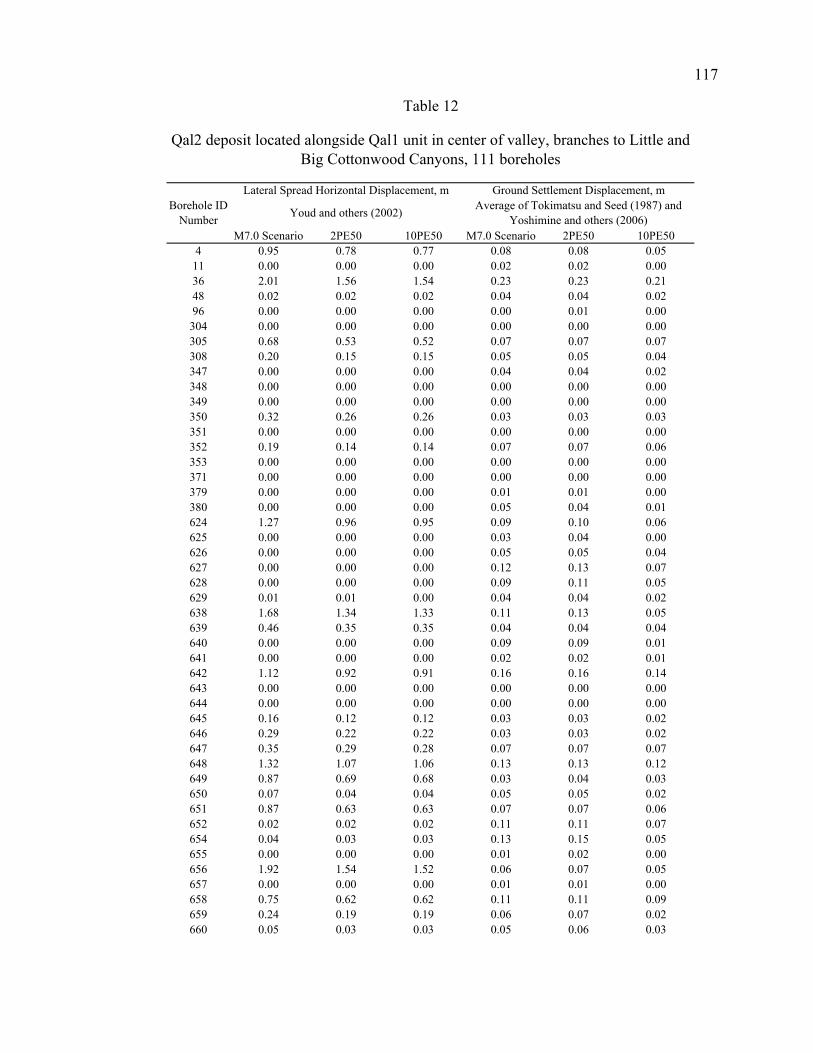
M7.0 Scenario 2PE50 10PE50 M7.0 Scenario 2PE50 10PE504 0.95 0.78 0.77 0.08 0.08 0.05
11 0.00 0.00 0.00 0.02 0.02 0.0036 2.01 1.56 1.54 0.23 0.23 0.2148 0.02 0.02 0.02 0.04 0.04 0.0296 0.00 0.00 0.00 0.00 0.01 0.00
304 0.00 0.00 0.00 0.00 0.00 0.00305 0.68 0.53 0.52 0.07 0.07 0.07308 0.20 0.15 0.15 0.05 0.05 0.04347 0.00 0.00 0.00 0.04 0.04 0.02348 0.00 0.00 0.00 0.00 0.00 0.00349 0.00 0.00 0.00 0.00 0.00 0.00350 0.32 0.26 0.26 0.03 0.03 0.03351 0.00 0.00 0.00 0.00 0.00 0.00352 0.19 0.14 0.14 0.07 0.07 0.06353 0.00 0.00 0.00 0.00 0.00 0.00371 0.00 0.00 0.00 0.00 0.00 0.00379 0.00 0.00 0.00 0.01 0.01 0.00380 0.00 0.00 0.00 0.05 0.04 0.01624 1.27 0.96 0.95 0.09 0.10 0.06625 0.00 0.00 0.00 0.03 0.04 0.00626 0.00 0.00 0.00 0.05 0.05 0.04627 0.00 0.00 0.00 0.12 0.13 0.07628 0.00 0.00 0.00 0.09 0.11 0.05629 0.01 0.01 0.00 0.04 0.04 0.02638 1.68 1.34 1.33 0.11 0.13 0.05639 0.46 0.35 0.35 0.04 0.04 0.04640 0.00 0.00 0.00 0.09 0.09 0.01641 0.00 0.00 0.00 0.02 0.02 0.01642 1.12 0.92 0.91 0.16 0.16 0.14643 0.00 0.00 0.00 0.00 0.00 0.00644 0.00 0.00 0.00 0.00 0.00 0.00645 0.16 0.12 0.12 0.03 0.03 0.02646 0.29 0.22 0.22 0.03 0.03 0.02647 0.35 0.29 0.28 0.07 0.07 0.07648 1.32 1.07 1.06 0.13 0.13 0.12649 0.87 0.69 0.68 0.03 0.04 0.03650 0.07 0.04 0.04 0.05 0.05 0.02651 0.87 0.63 0.63 0.07 0.07 0.06652 0.02 0.02 0.02 0.11 0.11 0.07654 0.04 0.03 0.03 0.13 0.15 0.05655 0.00 0.00 0.00 0.01 0.02 0.00656 1.92 1.54 1.52 0.06 0.07 0.05657 0.00 0.00 0.00 0.01 0.01 0.00658 0.75 0.62 0.62 0.11 0.11 0.09659 0.24 0.19 0.19 0.06 0.07 0.02660 0.05 0.03 0.03 0.05 0.06 0.03
Table 12
Qal2 deposit located alongside Qal1 unit in center of valley, branches to Little and Big Cottonwood Canyons, 111 boreholes
Lateral Spread Horizontal Displacement, m Ground Settlement Displacement, mBorehole ID
Number Youd and others (2002) Average of Tokimatsu and Seed (1987) and Yoshimine and others (2006)
117

M7.0 Scenario 2PE50 10PE50 M7.0 Scenario 2PE50 10PE50661 0.05 0.04 0.04 0.16 0.17 0.14662 0.00 0.00 0.00 0.00 0.00 0.00663 0.21 0.17 0.17 0.11 0.12 0.08668 0.00 0.00 0.00 0.03 0.03 0.03669 0.00 0.00 0.00 0.02 0.02 0.00670 0.00 0.00 0.00 0.00 0.00 0.00671 0.87 0.72 0.71 0.27 0.28 0.15672 1.86 1.51 1.49 0.05 0.05 0.05673 0.03 0.02 0.02 0.04 0.04 0.03674 0.03 0.02 0.02 0.06 0.09 0.01675 0.00 0.00 0.00 0.01 0.01 0.00676 0.00 0.00 0.00 0.00 0.00 0.00677 0.50 0.39 0.38 0.03 0.03 0.03678 0.00 0.00 0.00 0.02 0.03 0.01680 0.00 0.00 0.00 0.00 0.00 0.00685 0.01 0.01 0.01 0.37 0.37 0.35
1001 0.05 0.04 0.04 0.01 0.01 0.011011 0.01 0.00 0.00 0.07 0.08 0.041013 1.80 1.54 1.53 0.02 0.02 0.021016 0.16 0.10 0.10 0.07 0.08 0.021020 0.02 0.02 0.02 0.08 0.09 0.061026 0.00 0.00 0.00 0.00 0.00 0.001030 0.01 0.01 0.01 0.03 0.03 0.011031 0.00 0.00 0.00 0.03 0.03 0.011035 0.00 0.00 0.00 0.00 0.00 0.001045 0.29 0.13 0.12 0.05 0.05 0.051050 0.00 0.00 0.00 0.01 0.01 0.001060 2.00 1.49 1.48 0.05 0.05 0.041066 1.60 1.19 1.18 0.02 0.02 0.021070 0.00 0.00 0.00 0.00 0.00 0.001071 0.19 0.11 0.11 0.06 0.06 0.051075 0.00 0.00 0.00 0.00 0.00 0.001077 0.00 0.00 0.00 0.01 0.01 0.001084 0.09 0.06 0.06 0.09 0.09 0.091088 0.00 0.00 0.00 0.02 0.02 0.001091 0.24 0.13 0.13 0.06 0.06 0.061093 0.04 0.03 0.03 0.05 0.06 0.021094 0.01 0.01 0.01 0.04 0.04 0.031095 0.00 0.00 0.00 0.02 0.02 0.001102 0.00 0.00 0.00 0.02 0.03 0.001110 0.05 0.04 0.04 0.03 0.03 0.011111 1.02 0.87 0.87 0.03 0.03 0.011112 0.00 0.00 0.00 0.00 0.00 0.001115 0.04 0.03 0.00 0.02 0.02 0.001118 0.03 0.02 0.02 0.15 0.15 0.141121 0.02 0.02 0.02 0.05 0.06 0.021122 0.00 0.00 0.00 0.00 0.01 0.001124 0.57 0.51 0.50 0.01 0.01 0.011125 0.39 0.34 0.33 0.01 0.01 0.001128 0.03 0.03 0.03 0.09 0.09 0.02
Borehole ID Number
Lateral Spread Horizontal Displacement, m Ground Settlement Displacement, m
Youd and others (2002) Average of Tokimatsu and Seed (1987) and Yoshimine and others (2006)
Table 12 Continued
118

M7.0 Scenario 2PE50 10PE50 M7.0 Scenario 2PE50 10PE501138 0.00 0.00 0.00 0.00 0.00 0.001141 0.06 0.04 0.04 0.06 0.06 0.061147 0.02 0.01 0.01 0.04 0.04 0.031149 0.00 0.00 0.00 0.00 0.00 0.001152 0.00 0.00 0.00 0.00 0.00 0.001153 0.53 0.44 0.00 0.01 0.02 0.001155 0.00 0.00 0.00 0.03 0.04 0.011158 0.53 0.48 0.48 0.17 0.17 0.141169 0.00 0.00 0.00 0.01 0.01 0.001189 0.00 0.00 0.00 0.00 0.00 0.001190 0.00 0.00 0.00 0.00 0.00 0.001191 0.00 0.00 0.00 0.00 0.00 0.001192 0.00 0.00 0.00 0.00 0.00 0.001238 0.63 0.50 0.50 0.03 0.03 0.011239 0.00 0.00 0.00 0.00 0.00 0.00
Table 12 Continued
Borehole ID Number
Lateral Spread Horizontal Displacement, m Ground Settlement Displacement, m
Youd and others (2002) Average of Tokimatsu and Seed (1987) and Yoshimine and others (2006)
119
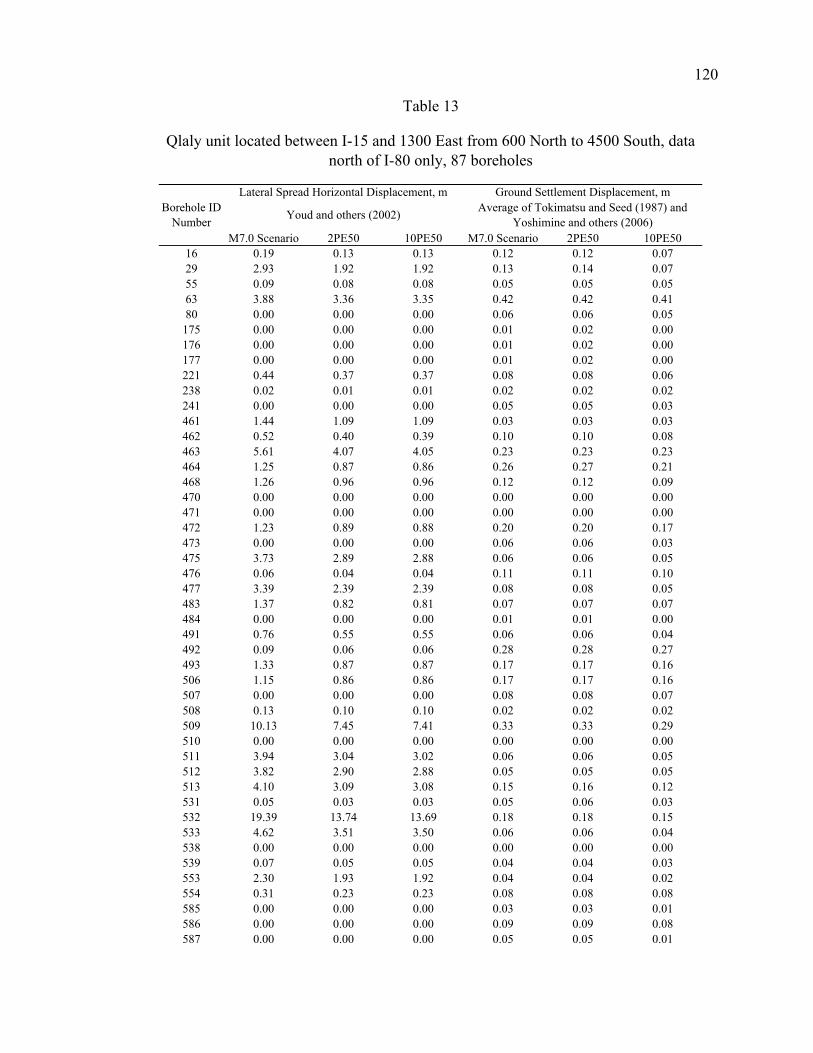
M7.0 Scenario 2PE50 10PE50 M7.0 Scenario 2PE50 10PE5016 0.19 0.13 0.13 0.12 0.12 0.0729 2.93 1.92 1.92 0.13 0.14 0.0755 0.09 0.08 0.08 0.05 0.05 0.0563 3.88 3.36 3.35 0.42 0.42 0.4180 0.00 0.00 0.00 0.06 0.06 0.05
175 0.00 0.00 0.00 0.01 0.02 0.00176 0.00 0.00 0.00 0.01 0.02 0.00177 0.00 0.00 0.00 0.01 0.02 0.00221 0.44 0.37 0.37 0.08 0.08 0.06238 0.02 0.01 0.01 0.02 0.02 0.02241 0.00 0.00 0.00 0.05 0.05 0.03461 1.44 1.09 1.09 0.03 0.03 0.03462 0.52 0.40 0.39 0.10 0.10 0.08463 5.61 4.07 4.05 0.23 0.23 0.23464 1.25 0.87 0.86 0.26 0.27 0.21468 1.26 0.96 0.96 0.12 0.12 0.09470 0.00 0.00 0.00 0.00 0.00 0.00471 0.00 0.00 0.00 0.00 0.00 0.00472 1.23 0.89 0.88 0.20 0.20 0.17473 0.00 0.00 0.00 0.06 0.06 0.03475 3.73 2.89 2.88 0.06 0.06 0.05476 0.06 0.04 0.04 0.11 0.11 0.10477 3.39 2.39 2.39 0.08 0.08 0.05483 1.37 0.82 0.81 0.07 0.07 0.07484 0.00 0.00 0.00 0.01 0.01 0.00491 0.76 0.55 0.55 0.06 0.06 0.04492 0.09 0.06 0.06 0.28 0.28 0.27493 1.33 0.87 0.87 0.17 0.17 0.16506 1.15 0.86 0.86 0.17 0.17 0.16507 0.00 0.00 0.00 0.08 0.08 0.07508 0.13 0.10 0.10 0.02 0.02 0.02509 10.13 7.45 7.41 0.33 0.33 0.29510 0.00 0.00 0.00 0.00 0.00 0.00511 3.94 3.04 3.02 0.06 0.06 0.05512 3.82 2.90 2.88 0.05 0.05 0.05513 4.10 3.09 3.08 0.15 0.16 0.12531 0.05 0.03 0.03 0.05 0.06 0.03532 19.39 13.74 13.69 0.18 0.18 0.15533 4.62 3.51 3.50 0.06 0.06 0.04538 0.00 0.00 0.00 0.00 0.00 0.00539 0.07 0.05 0.05 0.04 0.04 0.03553 2.30 1.93 1.92 0.04 0.04 0.02554 0.31 0.23 0.23 0.08 0.08 0.08585 0.00 0.00 0.00 0.03 0.03 0.01586 0.00 0.00 0.00 0.09 0.09 0.08587 0.00 0.00 0.00 0.05 0.05 0.01
Table 13
Qlaly unit located between I-15 and 1300 East from 600 North to 4500 South, data north of I-80 only, 87 boreholes
Lateral Spread Horizontal Displacement, m Ground Settlement Displacement, mBorehole ID
Number Youd and others (2002) Average of Tokimatsu and Seed (1987) and Yoshimine and others (2006)
120

M7.0 Scenario 2PE50 10PE50 M7.0 Scenario 2PE50 10PE50588 4.21 3.63 3.61 0.15 0.15 0.14589 0.00 0.00 0.00 0.00 0.00 0.00590 1.44 1.28 1.28 0.06 0.06 0.05591 0.00 0.00 0.00 0.00 0.00 0.00592 0.92 0.85 0.85 0.06 0.06 0.06593 0.00 0.00 0.00 0.00 0.00 0.00594 0.00 0.00 0.00 0.00 0.00 0.00595 0.11 0.10 0.10 0.13 0.13 0.13596 0.49 0.46 0.45 0.15 0.16 0.07597 0.00 0.00 0.00 0.15 0.16 0.09598 0.08 0.07 0.07 0.08 0.09 0.07599 0.00 0.00 0.00 0.21 0.21 0.17600 0.34 0.30 0.30 0.07 0.07 0.06601 1.43 1.28 1.27 0.02 0.02 0.02602 0.00 0.00 0.00 0.16 0.17 0.13603 0.00 0.00 0.00 0.05 0.05 0.05604 0.00 0.00 0.00 0.03 0.04 0.01605 0.02 0.01 0.01 0.10 0.12 0.08606 1.34 1.11 1.10 0.14 0.15 0.12607 0.00 0.00 0.00 0.05 0.06 0.03608 0.00 0.00 0.00 0.04 0.06 0.01609 0.00 0.00 0.00 0.05 0.05 0.04610 0.00 0.00 0.00 0.05 0.05 0.04611 0.00 0.00 0.00 0.00 0.00 0.00612 0.00 0.00 0.00 0.01 0.01 0.00613 0.80 0.70 0.70 0.02 0.02 0.01614 0.21 0.19 0.19 0.01 0.01 0.01615 0.00 0.00 0.00 0.00 0.00 0.00616 0.00 0.00 0.00 0.00 0.00 0.00617 0.00 0.00 0.00 0.00 0.00 0.00618 1.21 1.03 1.03 0.03 0.03 0.03619 0.00 0.00 0.00 0.01 0.01 0.00620 1.01 0.96 0.96 0.04 0.04 0.02621 1.95 1.67 1.66 0.03 0.03 0.03622 0.00 0.00 0.00 0.01 0.01 0.00623 1.42 1.17 1.17 0.02 0.02 0.02689 1.10 1.00 1.00 0.14 0.15 0.11691 0.44 0.42 0.42 0.03 0.04 0.02692 0.00 0.00 0.00 0.00 0.00 0.00707 0.00 0.00 0.00 0.00 0.00 0.00739 0.77 0.63 0.63 0.05 0.05 0.05
Borehole ID Number
Lateral Spread Horizontal Displacement, m Ground Settlement Displacement, m
Youd and others (2002) Average of Tokimatsu and Seed (1987) and Yoshimine and others (2006)
Table 13 Continued
121

M7.0 Scenario 2PE50 10PE50 M7.0 Scenario 2PE50 10PE508 0.00 0.00 0.00 0.00 0.00 0.0033 0.00 0.00 0.00 0.00 0.00 0.0087 0.00 0.00 0.00 0.00 0.00 0.0095 0.35 0.25 0.24 0.06 0.06 0.06
702 1.16 0.96 0.96 0.07 0.07 0.05734 0.37 0.33 0.33 0.03 0.03 0.031014 0.00 0.00 0.00 0.00 0.00 0.001017 0.00 0.00 0.00 0.00 0.00 0.001022 0.28 0.25 0.25 0.03 0.03 0.021032 0.00 0.00 0.00 0.00 0.00 0.001038 0.00 0.00 0.00 0.02 0.02 0.001069 0.00 0.00 0.00 0.01 0.01 0.001089 0.00 0.00 0.00 0.00 0.00 0.001109 0.33 0.31 0.00 0.01 0.02 0.001154 0.11 0.09 0.09 0.16 0.16 0.16
Table 14
Qlaly unit located between I-15 and 1300 East from 600 North to 4500 South, data south of I-80 only, 15 boreholes
Lateral Spread Horizontal Displacement, m Ground Settlement Displacement, mBorehole ID
Number Youd and others (2002) Average of Tokimatsu and Seed (1987) and Yoshimine and others (2006)
122
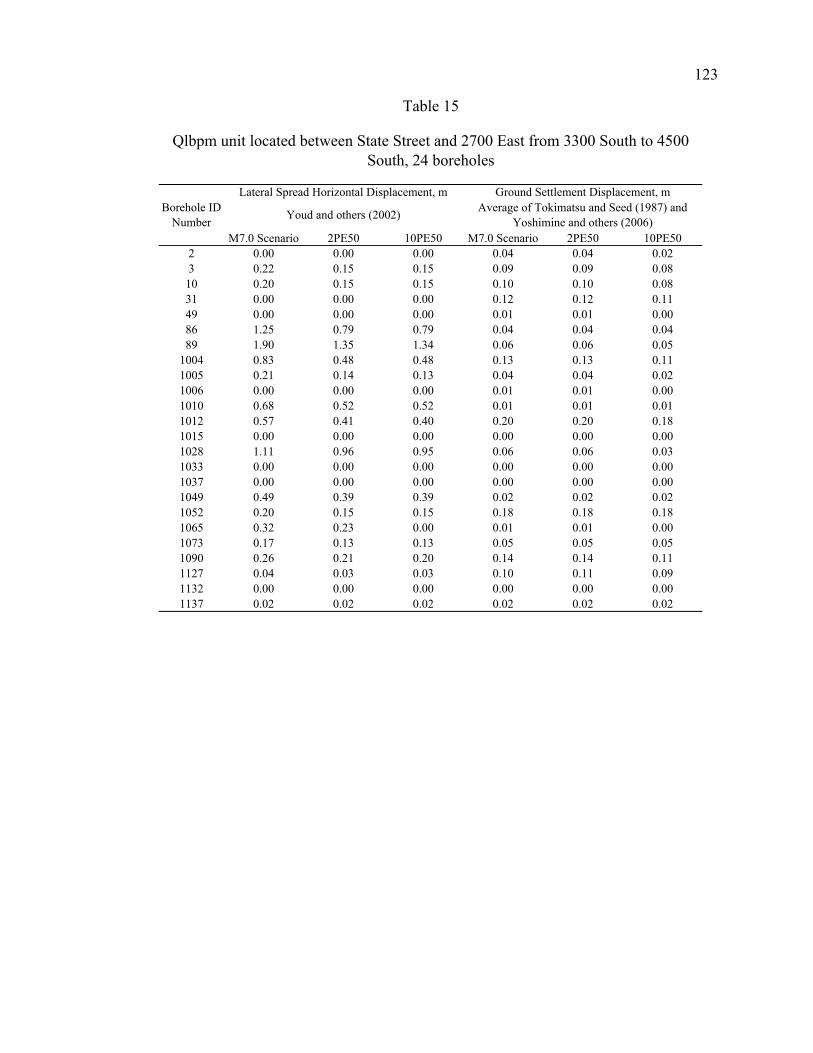
M7.0 Scenario 2PE50 10PE50 M7.0 Scenario 2PE50 10PE502 0.00 0.00 0.00 0.04 0.04 0.023 0.22 0.15 0.15 0.09 0.09 0.0810 0.20 0.15 0.15 0.10 0.10 0.0831 0.00 0.00 0.00 0.12 0.12 0.1149 0.00 0.00 0.00 0.01 0.01 0.0086 1.25 0.79 0.79 0.04 0.04 0.0489 1.90 1.35 1.34 0.06 0.06 0.05
1004 0.83 0.48 0.48 0.13 0.13 0.111005 0.21 0.14 0.13 0.04 0.04 0.021006 0.00 0.00 0.00 0.01 0.01 0.001010 0.68 0.52 0.52 0.01 0.01 0.011012 0.57 0.41 0.40 0.20 0.20 0.181015 0.00 0.00 0.00 0.00 0.00 0.001028 1.11 0.96 0.95 0.06 0.06 0.031033 0.00 0.00 0.00 0.00 0.00 0.001037 0.00 0.00 0.00 0.00 0.00 0.001049 0.49 0.39 0.39 0.02 0.02 0.021052 0.20 0.15 0.15 0.18 0.18 0.181065 0.32 0.23 0.00 0.01 0.01 0.001073 0.17 0.13 0.13 0.05 0.05 0.051090 0.26 0.21 0.20 0.14 0.14 0.111127 0.04 0.03 0.03 0.10 0.11 0.091132 0.00 0.00 0.00 0.00 0.00 0.001137 0.02 0.02 0.02 0.02 0.02 0.02
Table 15
Qlbpm unit located between State Street and 2700 East from 3300 South to 4500 South, 24 boreholes
Lateral Spread Horizontal Displacement, m Ground Settlement Displacement, mBorehole ID
Number Youd and others (2002) Average of Tokimatsu and Seed (1987) and Yoshimine and others (2006)
123

M7.0 Scenario 2PE50 10PE50 M7.0 Scenario 2PE50 10PE501002 0.00 0.00 0.00 0.01 0.01 0.001019 0.02 0.01 0.01 0.05 0.05 0.031056 0.00 0.00 0.00 0.00 0.00 0.001063 0.00 0.00 0.00 0.00 0.00 0.001064 0.00 0.00 0.00 0.00 0.00 0.001072 0.00 0.00 0.00 0.00 0.00 0.001074 0.11 0.07 0.07 0.04 0.05 0.031100 1.49 1.38 1.38 0.02 0.03 0.011129 0.08 0.06 0.06 0.09 0.09 0.061150 0.00 0.00 0.00 0.02 0.02 0.01
Table 16
Qlbpm unit located between 500 East and 1100 East from 4200 South to 4700 South, 10 boreholes
Lateral Spread Horizontal Displacement, m Ground Settlement Displacement, mBorehole ID
Number Youd and others (2002) Average of Tokimatsu and Seed (1987) and Yoshimine and others (2006)
124

M7.0 Scenario 2PE50 10PE50 M7.0 Scenario 2PE50 10PE501007 0.00 0.00 0.00 0.00 0.00 0.001009 0.34 0.26 0.26 0.07 0.08 0.031018 0.02 0.01 0.01 0.12 0.11 0.091023 0.00 0.00 0.00 0.00 0.00 0.001024 0.04 0.03 0.03 0.03 0.04 0.021036 0.00 0.00 0.00 0.00 0.00 0.001041 0.00 0.00 0.00 0.00 0.00 0.001086 0.00 0.00 0.00 0.03 0.04 0.02
Table 17
Qlbpm units located between 900 East and Van Winkle Expressway from 4700 South to 7000 South, 8 boreholes
Lateral Spread Horizontal Displacement, m Ground Settlement Displacement, mBorehole ID
Number Youd and others (2002) Average of Tokimatsu and Seed (1987) and Yoshimine and others (2006)
125
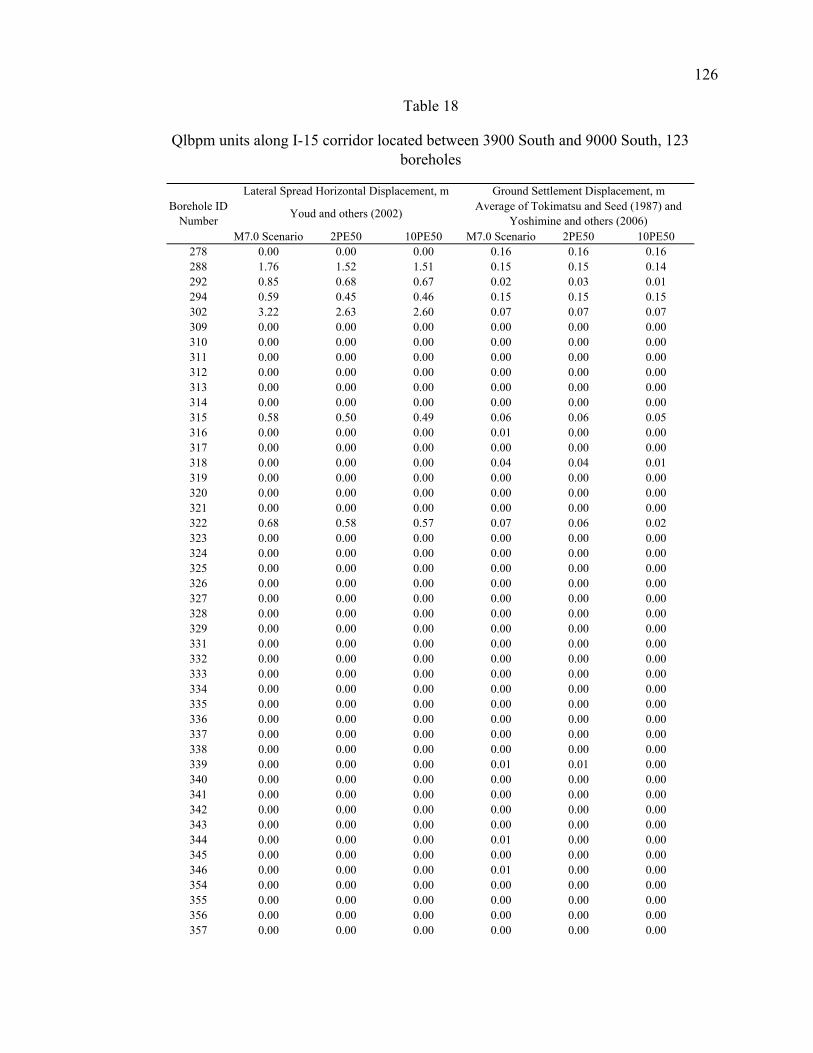
M7.0 Scenario 2PE50 10PE50 M7.0 Scenario 2PE50 10PE50278 0.00 0.00 0.00 0.16 0.16 0.16288 1.76 1.52 1.51 0.15 0.15 0.14292 0.85 0.68 0.67 0.02 0.03 0.01294 0.59 0.45 0.46 0.15 0.15 0.15302 3.22 2.63 2.60 0.07 0.07 0.07309 0.00 0.00 0.00 0.00 0.00 0.00310 0.00 0.00 0.00 0.00 0.00 0.00311 0.00 0.00 0.00 0.00 0.00 0.00312 0.00 0.00 0.00 0.00 0.00 0.00313 0.00 0.00 0.00 0.00 0.00 0.00314 0.00 0.00 0.00 0.00 0.00 0.00315 0.58 0.50 0.49 0.06 0.06 0.05316 0.00 0.00 0.00 0.01 0.00 0.00317 0.00 0.00 0.00 0.00 0.00 0.00318 0.00 0.00 0.00 0.04 0.04 0.01319 0.00 0.00 0.00 0.00 0.00 0.00320 0.00 0.00 0.00 0.00 0.00 0.00321 0.00 0.00 0.00 0.00 0.00 0.00322 0.68 0.58 0.57 0.07 0.06 0.02323 0.00 0.00 0.00 0.00 0.00 0.00324 0.00 0.00 0.00 0.00 0.00 0.00325 0.00 0.00 0.00 0.00 0.00 0.00326 0.00 0.00 0.00 0.00 0.00 0.00327 0.00 0.00 0.00 0.00 0.00 0.00328 0.00 0.00 0.00 0.00 0.00 0.00329 0.00 0.00 0.00 0.00 0.00 0.00331 0.00 0.00 0.00 0.00 0.00 0.00332 0.00 0.00 0.00 0.00 0.00 0.00333 0.00 0.00 0.00 0.00 0.00 0.00334 0.00 0.00 0.00 0.00 0.00 0.00335 0.00 0.00 0.00 0.00 0.00 0.00336 0.00 0.00 0.00 0.00 0.00 0.00337 0.00 0.00 0.00 0.00 0.00 0.00338 0.00 0.00 0.00 0.00 0.00 0.00339 0.00 0.00 0.00 0.01 0.01 0.00340 0.00 0.00 0.00 0.00 0.00 0.00341 0.00 0.00 0.00 0.00 0.00 0.00342 0.00 0.00 0.00 0.00 0.00 0.00343 0.00 0.00 0.00 0.00 0.00 0.00344 0.00 0.00 0.00 0.01 0.00 0.00345 0.00 0.00 0.00 0.00 0.00 0.00346 0.00 0.00 0.00 0.01 0.00 0.00354 0.00 0.00 0.00 0.00 0.00 0.00355 0.00 0.00 0.00 0.00 0.00 0.00356 0.00 0.00 0.00 0.00 0.00 0.00357 0.00 0.00 0.00 0.00 0.00 0.00
Table 18
Qlbpm units along I-15 corridor located between 3900 South and 9000 South, 123 boreholes
Lateral Spread Horizontal Displacement, m Ground Settlement Displacement, mBorehole ID
Number Youd and others (2002) Average of Tokimatsu and Seed (1987) and Yoshimine and others (2006)
126

M7.0 Scenario 2PE50 10PE50 M7.0 Scenario 2PE50 10PE50358 0.00 0.00 0.00 0.00 0.00 0.00359 0.00 0.00 0.00 0.00 0.00 0.00360 0.00 0.00 0.00 0.00 0.00 0.00361 0.00 0.00 0.00 0.00 0.00 0.00362 0.00 0.00 0.00 0.08 0.07 0.01363 0.00 0.00 0.00 0.00 0.00 0.00364 0.00 0.00 0.00 0.03 0.03 0.00365 1.36 1.15 1.14 0.10 0.10 0.03366 0.00 0.00 0.00 0.00 0.00 0.00370 0.00 0.00 0.00 0.02 0.02 0.00377 0.00 0.00 0.00 0.00 0.00 0.00378 0.00 0.00 0.00 0.01 0.00 0.00381 0.00 0.00 0.00 0.00 0.00 0.00382 0.00 0.00 0.00 0.00 0.00 0.00383 0.00 0.00 0.00 0.01 0.01 0.00389 0.00 0.00 0.00 0.01 0.01 0.00390 0.00 0.00 0.00 0.00 0.00 0.00391 0.00 0.00 0.00 0.00 0.00 0.00392 0.00 0.00 0.00 0.00 0.00 0.00393 0.00 0.00 0.00 0.00 0.00 0.00394 0.00 0.00 0.00 0.00 0.00 0.00395 0.00 0.00 0.00 0.00 0.00 0.00396 0.00 0.00 0.00 0.01 0.00 0.00397 0.00 0.00 0.00 0.02 0.01 0.00398 0.00 0.00 0.00 0.00 0.00 0.00399 0.00 0.00 0.00 0.00 0.00 0.00400 0.00 0.00 0.00 0.00 0.00 0.00401 0.00 0.00 0.00 0.00 0.00 0.00402 0.00 0.00 0.00 0.00 0.00 0.00403 0.00 0.00 0.00 0.01 0.01 0.00404 0.00 0.00 0.00 0.00 0.00 0.00405 0.00 0.00 0.00 0.04 0.04 0.00406 0.00 0.00 0.00 0.11 0.11 0.09407 0.59 0.53 0.52 0.06 0.06 0.04408 0.00 0.00 0.00 0.00 0.00 0.00409 0.00 0.00 0.00 0.03 0.02 0.00410 0.00 0.00 0.00 0.00 0.00 0.00411 0.00 0.00 0.00 0.00 0.00 0.00412 0.00 0.00 0.00 0.00 0.00 0.00413 0.00 0.00 0.00 0.00 0.00 0.00414 0.00 0.00 0.00 0.00 0.00 0.00415 0.00 0.00 0.00 0.00 0.00 0.00416 0.00 0.00 0.00 0.00 0.00 0.00417 0.00 0.00 0.00 0.00 0.00 0.00418 0.00 0.00 0.00 0.00 0.00 0.00419 0.00 0.00 0.00 0.07 0.07 0.04420 0.55 0.43 0.43 0.02 0.02 0.00421 0.00 0.00 0.00 0.05 0.04 0.00422 0.00 0.00 0.00 0.00 0.00 0.00423 0.01 0.00 0.00 0.04 0.04 0.00
Borehole ID Number
Lateral Spread Horizontal Displacement, m Ground Settlement Displacement, m
Youd and others (2002) Average of Tokimatsu and Seed (1987) and Yoshimine and others (2006)
Table 18 Continued
127

M7.0 Scenario 2PE50 10PE50 M7.0 Scenario 2PE50 10PE50424 1.03 0.80 0.00 0.03 0.02 0.00425 0.29 0.22 0.00 0.04 0.03 0.00426 0.70 0.54 0.00 0.02 0.02 0.00427 0.00 0.00 0.00 0.00 0.00 0.00428 0.27 0.20 0.20 0.18 0.17 0.14437 0.00 0.00 0.00 0.00 0.00 0.00438 1.54 1.30 1.28 0.08 0.07 0.05440 0.00 0.00 0.00 0.03 0.03 0.03441 0.00 0.00 0.00 0.00 0.00 0.00442 0.05 0.04 0.04 0.02 0.03 0.01443 0.00 0.00 0.00 0.00 0.00 0.00444 0.00 0.00 0.00 0.01 0.02 0.00445 0.00 0.00 0.00 0.03 0.06 0.01446 0.00 0.00 0.00 0.00 0.00 0.00447 0.00 0.00 0.00 0.01 0.01 0.00664 0.00 0.00 0.00 0.03 0.03 0.03
1078 0.00 0.00 0.00 0.04 0.04 0.031082 0.01 0.01 0.01 0.04 0.04 0.031228 0.00 0.00 0.00 0.00 0.00 0.001237 0.06 0.05 0.05 0.03 0.03 0.021254 0.00 0.00 0.00 0.00 0.00 0.001255 0.00 0.00 0.00 0.00 0.00 0.001256 0.00 0.00 0.00 0.00 0.00 0.001257 0.00 0.00 0.00 0.18 0.18 0.181258 0.00 0.00 0.00 0.00 0.00 0.001259 0.00 0.00 0.00 0.00 0.00 0.001260 0.00 0.00 0.00 0.00 0.00 0.00
Table 18 Continued
Borehole ID Number
Lateral Spread Horizontal Displacement, m Ground Settlement Displacement, m
Youd and others (2002) Average of Tokimatsu and Seed (1987) and Yoshimine and others (2006)
128

M7.0 Scenario 2PE50 10PE50 M7.0 Scenario 2PE50 10PE501156 0.03 0.03 0.03 0.04 0.03 0.021163 0.65 0.60 0.59 0.11 0.11 0.111165 0.83 0.79 0.79 0.11 0.11 0.101197 0.00 0.00 0.00 0.01 0.01 0.001198 0.00 0.00 0.00 0.05 0.05 0.011212 0.00 0.00 0.00 0.00 0.00 0.001213 0.27 0.27 0.27 0.05 0.05 0.051214 0.26 0.25 0.25 0.24 0.24 0.231215 0.00 0.00 0.00 0.00 0.00 0.001216 0.00 0.00 0.00 0.01 0.01 0.001220 0.00 0.00 0.00 0.00 0.00 0.001244 0.00 0.00 0.00 0.00 0.00 0.001246 0.32 0.32 0.32 0.15 0.15 0.151249 0.08 0.07 0.07 0.14 0.14 0.141250 0.37 0.37 0.37 0.12 0.12 0.091251 0.69 0.65 0.64 0.18 0.18 0.141252 0.00 0.00 0.00 0.08 0.08 0.081253 0.00 0.00 0.00 0.13 0.13 0.131264 0.00 0.00 0.00 0.00 0.00 0.001270 0.44 0.45 0.44 0.05 0.05 0.031273 0.00 0.00 0.00 0.00 0.00 0.001278 0.00 0.00 0.00 0.04 0.04 0.021279 0.02 0.02 0.02 0.12 0.12 0.111280 0.15 0.13 0.13 0.08 0.08 0.061284 0.00 0.00 0.00 0.00 0.00 0.001297 0.00 0.00 0.00 0.00 0.00 0.001302 0.00 0.00 0.00 0.00 0.00 0.00
Table 19
Qlbpm units along I-15 corridor located between 9000 South and 12300 South, 27 boreholes
Lateral Spread Horizontal Displacement, m Ground Settlement Displacement, mBorehole ID
Number Youd and others (2002) Average of Tokimatsu and Seed (1987) and Yoshimine and others (2006)
129

M7.0 Scenario 2PE50 10PE50 M7.0 Scenario 2PE50 10PE5076 0.00 0.00 0.00 0.16 0.16 0.16
684 0.00 0.00 0.00 0.00 0.00 0.00714 0.00 0.00 0.00 0.02 0.02 0.00
Table 20
Qlbpm units near I-15 corridor located between 600 North and 2300 North, 3 boreholes
Lateral Spread Horizontal Displacement, m Ground Settlement Displacement, mBorehole ID
Number Youd and others (2002) Average of Tokimatsu and Seed (1987) and Yoshimine and others (2006)
130

M7.0 Scenario 2PE50 10PE50 M7.0 Scenario 2PE50 10PE5050 0.00 0.00 0.00 0.00 0.00 0.00
686 0.00 0.00 0.00 0.00 0.00 0.00687 0.00 0.00 0.00 0.00 0.00 0.00688 0.00 0.00 0.00 0.00 0.00 0.00696 0.00 0.00 0.00 0.00 0.00 0.00701 0.00 0.00 0.00 0.00 0.00 0.00725 0.00 0.00 0.00 0.00 0.00 0.00
Table 21
Qlbpm units located along east bench (east of 1300 East) from South Temple to 5300 South, 7 boreholes
Lateral Spread Horizontal Displacement, m Ground Settlement Displacement, mBorehole ID
Number Youd and others (2002) Average of Tokimatsu and Seed (1987) and Yoshimine and others (2006)
131
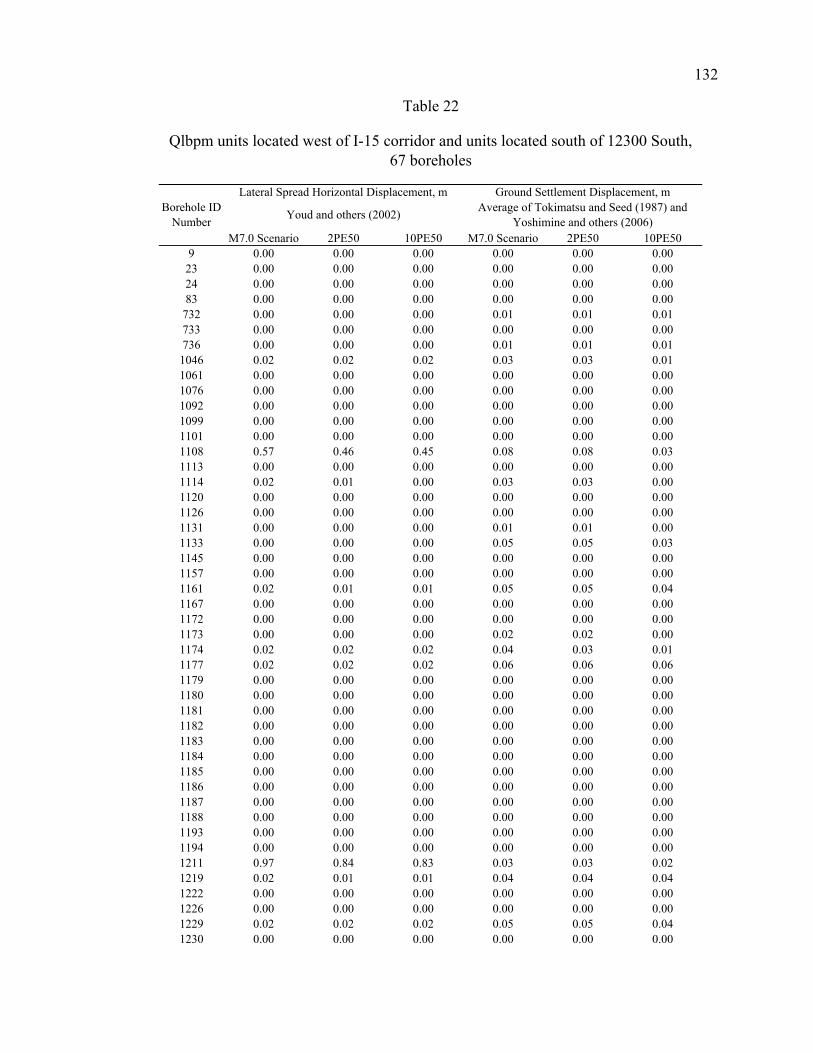
M7.0 Scenario 2PE50 10PE50 M7.0 Scenario 2PE50 10PE509 0.00 0.00 0.00 0.00 0.00 0.0023 0.00 0.00 0.00 0.00 0.00 0.0024 0.00 0.00 0.00 0.00 0.00 0.0083 0.00 0.00 0.00 0.00 0.00 0.00
732 0.00 0.00 0.00 0.01 0.01 0.01733 0.00 0.00 0.00 0.00 0.00 0.00736 0.00 0.00 0.00 0.01 0.01 0.011046 0.02 0.02 0.02 0.03 0.03 0.011061 0.00 0.00 0.00 0.00 0.00 0.001076 0.00 0.00 0.00 0.00 0.00 0.001092 0.00 0.00 0.00 0.00 0.00 0.001099 0.00 0.00 0.00 0.00 0.00 0.001101 0.00 0.00 0.00 0.00 0.00 0.001108 0.57 0.46 0.45 0.08 0.08 0.031113 0.00 0.00 0.00 0.00 0.00 0.001114 0.02 0.01 0.00 0.03 0.03 0.001120 0.00 0.00 0.00 0.00 0.00 0.001126 0.00 0.00 0.00 0.00 0.00 0.001131 0.00 0.00 0.00 0.01 0.01 0.001133 0.00 0.00 0.00 0.05 0.05 0.031145 0.00 0.00 0.00 0.00 0.00 0.001157 0.00 0.00 0.00 0.00 0.00 0.001161 0.02 0.01 0.01 0.05 0.05 0.041167 0.00 0.00 0.00 0.00 0.00 0.001172 0.00 0.00 0.00 0.00 0.00 0.001173 0.00 0.00 0.00 0.02 0.02 0.001174 0.02 0.02 0.02 0.04 0.03 0.011177 0.02 0.02 0.02 0.06 0.06 0.061179 0.00 0.00 0.00 0.00 0.00 0.001180 0.00 0.00 0.00 0.00 0.00 0.001181 0.00 0.00 0.00 0.00 0.00 0.001182 0.00 0.00 0.00 0.00 0.00 0.001183 0.00 0.00 0.00 0.00 0.00 0.001184 0.00 0.00 0.00 0.00 0.00 0.001185 0.00 0.00 0.00 0.00 0.00 0.001186 0.00 0.00 0.00 0.00 0.00 0.001187 0.00 0.00 0.00 0.00 0.00 0.001188 0.00 0.00 0.00 0.00 0.00 0.001193 0.00 0.00 0.00 0.00 0.00 0.001194 0.00 0.00 0.00 0.00 0.00 0.001211 0.97 0.84 0.83 0.03 0.03 0.021219 0.02 0.01 0.01 0.04 0.04 0.041222 0.00 0.00 0.00 0.00 0.00 0.001226 0.00 0.00 0.00 0.00 0.00 0.001229 0.02 0.02 0.02 0.05 0.05 0.041230 0.00 0.00 0.00 0.00 0.00 0.00
Borehole ID Number Youd and others (2002) Average of Tokimatsu and Seed (1987) and
Yoshimine and others (2006)
Table 22
Qlbpm units located west of I-15 corridor and units located south of 12300 South, 67 boreholes
Lateral Spread Horizontal Displacement, m Ground Settlement Displacement, m
132

M7.0 Scenario 2PE50 10PE50 M7.0 Scenario 2PE50 10PE501231 0.00 0.00 0.00 0.00 0.00 0.001232 0.00 0.00 0.00 0.00 0.00 0.001233 0.00 0.00 0.00 0.00 0.00 0.001234 0.00 0.00 0.00 0.00 0.00 0.001241 0.03 0.03 0.03 0.02 0.02 0.011263 0.00 0.00 0.00 0.03 0.03 0.001268 0.00 0.00 0.00 0.00 0.00 0.001272 0.02 0.02 0.02 0.34 0.34 0.321275 0.00 0.00 0.00 0.03 0.03 0.011281 0.00 0.00 0.00 0.04 0.04 0.021282 0.00 0.00 0.00 0.00 0.00 0.001283 0.00 0.00 0.00 0.02 0.02 0.001285 0.00 0.00 0.00 0.01 0.01 0.001286 2.70 2.44 0.00 0.01 0.01 0.001291 0.00 0.00 0.00 0.00 0.00 0.001292 0.00 0.00 0.00 0.00 0.00 0.001294 0.28 0.25 0.25 0.09 0.09 0.051295 0.02 0.02 0.02 0.06 0.06 0.021296 1.73 1.70 1.68 0.08 0.08 0.041300 0.10 0.10 0.10 0.04 0.04 0.021301 1.42 1.34 1.33 0.07 0.07 0.06
Table 22 Continued
Borehole ID Number
Lateral Spread Horizontal Displacement, m Ground Settlement Displacement, m
Youd and others (2002) Average of Tokimatsu and Seed (1987) and Yoshimine and others (2006)
133

M7.0 Scenario 2PE50 10PE50 M7.0 Scenario 2PE50 10PE5015 0.00 0.00 0.00 0.00 0.00 0.0020 0.00 0.00 0.00 0.00 0.00 0.0034 0.00 0.00 0.00 0.17 0.17 0.0652 1.96 1.66 1.65 0.14 0.13 0.0657 0.00 0.00 0.00 0.00 0.00 0.0081 0.00 0.00 0.00 0.00 0.00 0.0090 0.00 0.00 0.00 0.04 0.04 0.00
706 2.33 2.21 2.21 0.04 0.04 0.00729 1.14 0.82 0.82 0.15 0.15 0.13750 2.01 1.69 1.68 0.13 0.12 0.05
Table 23
Qaf2 and Qmls units located between North Temple and 400 South from 400 West to 300 East (City Creek fan), 10 boreholes
Lateral Spread Horizontal Displacement, m Ground Settlement Displacement, mBorehole ID
Number Youd and others (2002) Average of Tokimatsu and Seed (1987) and Yoshimine and others (2006)
134
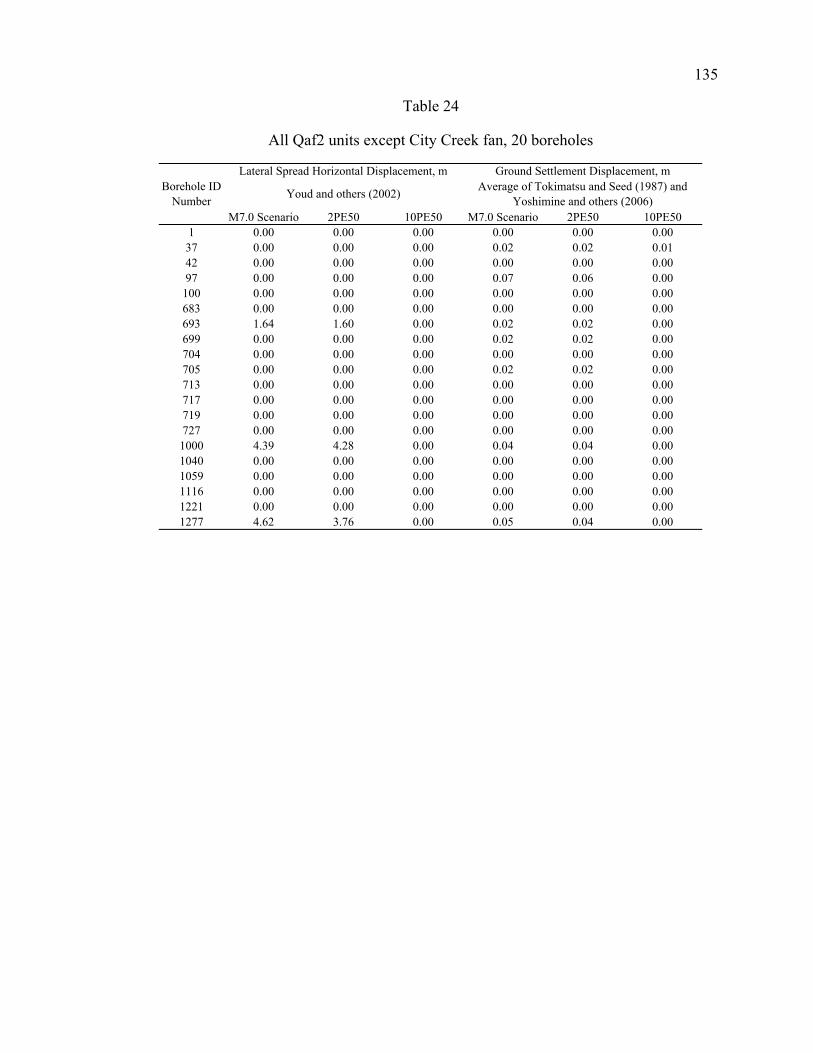
M7.0 Scenario 2PE50 10PE50 M7.0 Scenario 2PE50 10PE501 0.00 0.00 0.00 0.00 0.00 0.0037 0.00 0.00 0.00 0.02 0.02 0.0142 0.00 0.00 0.00 0.00 0.00 0.0097 0.00 0.00 0.00 0.07 0.06 0.00
100 0.00 0.00 0.00 0.00 0.00 0.00683 0.00 0.00 0.00 0.00 0.00 0.00693 1.64 1.60 0.00 0.02 0.02 0.00699 0.00 0.00 0.00 0.02 0.02 0.00704 0.00 0.00 0.00 0.00 0.00 0.00705 0.00 0.00 0.00 0.02 0.02 0.00713 0.00 0.00 0.00 0.00 0.00 0.00717 0.00 0.00 0.00 0.00 0.00 0.00719 0.00 0.00 0.00 0.00 0.00 0.00727 0.00 0.00 0.00 0.00 0.00 0.001000 4.39 4.28 0.00 0.04 0.04 0.001040 0.00 0.00 0.00 0.00 0.00 0.001059 0.00 0.00 0.00 0.00 0.00 0.001116 0.00 0.00 0.00 0.00 0.00 0.001221 0.00 0.00 0.00 0.00 0.00 0.001277 4.62 3.76 0.00 0.05 0.04 0.00
Table 24
All Qaf2 units except City Creek fan, 20 boreholes
Lateral Spread Horizontal Displacement, m Ground Settlement Displacement, mBorehole ID
Number Youd and others (2002) Average of Tokimatsu and Seed (1987) and Yoshimine and others (2006)
135
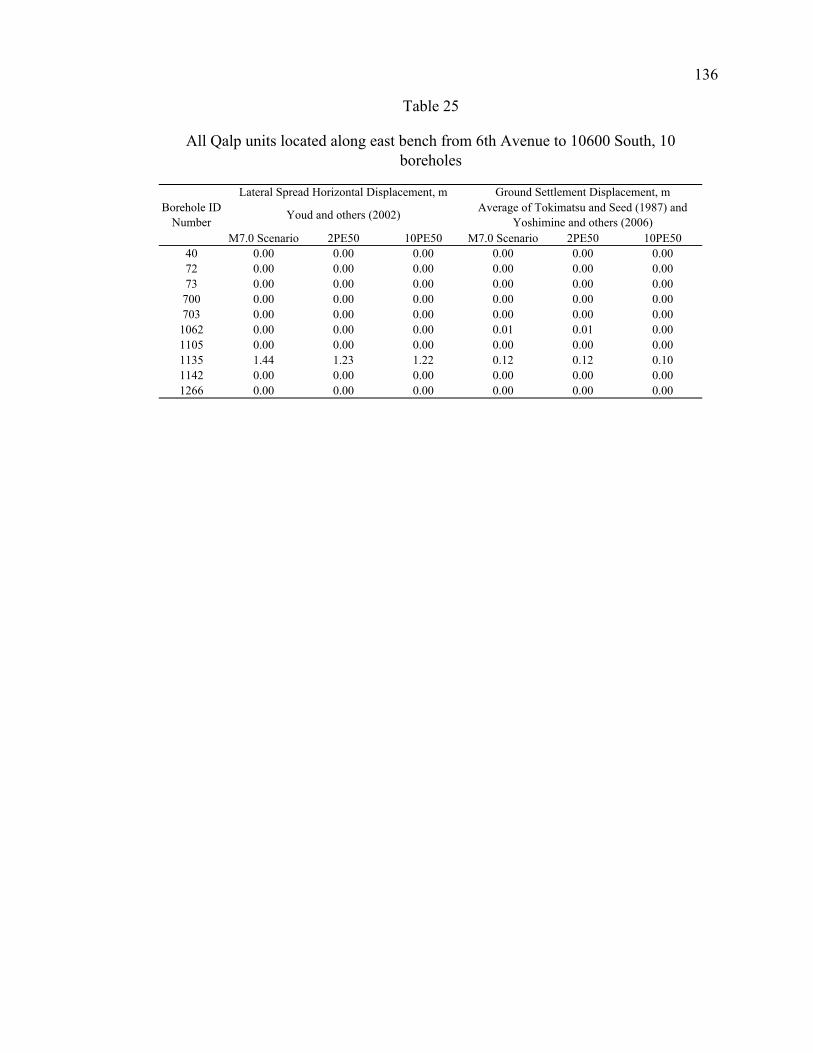
M7.0 Scenario 2PE50 10PE50 M7.0 Scenario 2PE50 10PE5040 0.00 0.00 0.00 0.00 0.00 0.0072 0.00 0.00 0.00 0.00 0.00 0.0073 0.00 0.00 0.00 0.00 0.00 0.00
700 0.00 0.00 0.00 0.00 0.00 0.00703 0.00 0.00 0.00 0.00 0.00 0.001062 0.00 0.00 0.00 0.01 0.01 0.001105 0.00 0.00 0.00 0.00 0.00 0.001135 1.44 1.23 1.22 0.12 0.12 0.101142 0.00 0.00 0.00 0.00 0.00 0.001266 0.00 0.00 0.00 0.00 0.00 0.00
Table 25
All Qalp units located along east bench from 6th Avenue to 10600 South, 10 boreholes
Lateral Spread Horizontal Displacement, m Ground Settlement Displacement, mBorehole ID
Number Youd and others (2002) Average of Tokimatsu and Seed (1987) and Yoshimine and others (2006)
136

M7.0 Scenario 2PE50 10PE50 M7.0 Scenario 2PE50 10PE5044 0.00 0.00 0.00 0.00 0.00 0.0051 0.00 0.00 0.00 0.06 0.03 0.0059 3.37 4.46 4.46 0.05 0.04 0.0088 0.14 0.12 0.12 0.03 0.03 0.02
690 0.00 0.00 0.00 0.02 0.01 0.00697 0.00 0.00 0.00 0.00 0.00 0.00698 0.00 0.00 0.00 0.00 0.00 0.00716 0.16 0.18 0.18 0.04 0.04 0.02728 0.66 0.75 0.75 0.05 0.05 0.011003 0.04 0.03 0.03 0.16 0.16 0.131048 0.00 0.00 0.00 0.00 0.00 0.001067 0.00 0.00 0.00 0.01 0.01 0.001081 0.00 0.00 0.00 0.08 0.07 0.031097 2.53 2.13 2.11 0.03 0.03 0.011098 0.00 0.00 0.00 0.01 0.01 0.001119 0.00 0.00 0.00 0.00 0.00 0.001151 0.00 0.00 0.00 0.03 0.03 0.011168 0.00 0.00 0.00 0.00 0.00 0.001170 0.00 0.00 0.00 0.00 0.00 0.001171 0.00 0.00 0.00 0.00 0.00 0.001195 0.00 0.00 0.00 0.00 0.00 0.001196 0.00 0.00 0.00 0.00 0.00 0.001200 0.00 0.00 0.00 0.00 0.00 0.001201 0.00 0.00 0.00 0.00 0.00 0.001202 0.00 0.00 0.00 0.00 0.00 0.001203 0.00 0.00 0.00 0.00 0.00 0.001204 0.17 0.09 0.09 0.01 0.01 0.001205 1.81 1.14 1.12 0.04 0.04 0.031206 0.00 0.00 0.00 0.01 0.01 0.001207 0.00 0.00 0.00 0.02 0.02 0.011208 0.00 0.00 0.00 0.01 0.01 0.011209 0.99 0.92 0.91 0.02 0.02 0.011210 0.00 0.00 0.00 0.00 0.00 0.001217 3.16 2.71 2.70 0.14 0.14 0.121218 0.00 0.00 0.00 0.06 0.06 0.021223 0.00 0.00 0.00 0.00 0.00 0.001247 2.63 2.69 2.65 0.08 0.07 0.031248 1.49 1.44 1.42 0.06 0.06 0.041265 0.00 0.00 0.00 0.02 0.02 0.001267 0.00 0.00 0.00 0.01 0.01 0.00
Table 26
All Qlpg units in the valley, 40 boreholes
Lateral Spread Horizontal Displacement, m Ground Settlement Displacement, mBorehole ID
Number Youd and others (2002) Average of Tokimatsu and Seed (1987) and Yoshimine and others (2006)
137
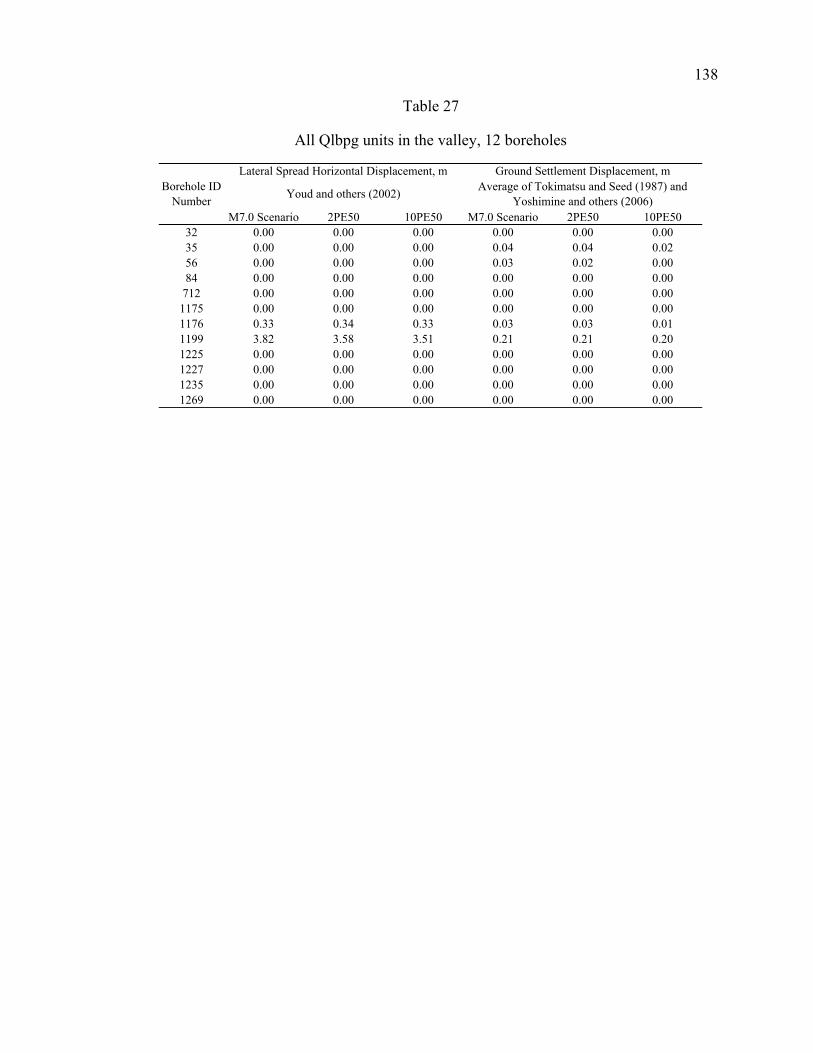
M7.0 Scenario 2PE50 10PE50 M7.0 Scenario 2PE50 10PE5032 0.00 0.00 0.00 0.00 0.00 0.0035 0.00 0.00 0.00 0.04 0.04 0.0256 0.00 0.00 0.00 0.03 0.02 0.0084 0.00 0.00 0.00 0.00 0.00 0.00
712 0.00 0.00 0.00 0.00 0.00 0.001175 0.00 0.00 0.00 0.00 0.00 0.001176 0.33 0.34 0.33 0.03 0.03 0.011199 3.82 3.58 3.51 0.21 0.21 0.201225 0.00 0.00 0.00 0.00 0.00 0.001227 0.00 0.00 0.00 0.00 0.00 0.001235 0.00 0.00 0.00 0.00 0.00 0.001269 0.00 0.00 0.00 0.00 0.00 0.00
Table 27
All Qlbpg units in the valley, 12 boreholes
Lateral Spread Horizontal Displacement, m Ground Settlement Displacement, mBorehole ID
Number Youd and others (2002) Average of Tokimatsu and Seed (1987) and Yoshimine and others (2006)
138

M7.0 Scenario 2PE50 10PE50 M7.0 Scenario 2PE50 10PE5047 0.00 0.00 0.00 0.00 0.00 0.0085 0.00 0.00 0.00 0.00 0.00 0.00
1162 0.00 0.00 0.00 0.00 0.00 0.001178 0.00 0.00 0.00 0.00 0.00 0.001224 0.00 0.00 0.00 0.02 0.02 0.00
Table 28
All Qlbps units in the valley, 5 boreholes
Lateral Spread Horizontal Displacement, m Ground Settlement Displacement, mBorehole ID
Number Youd and others (2002) Average of Tokimatsu and Seed (1987) and Yoshimine and others (2006)
139

M7.0 Scenario 2PE50 10PE50 M7.0 Scenario 2PE50 10PE505 0.00 0.00 0.00 0.00 0.00 0.006 0.00 0.00 0.00 0.02 0.02 0.007 0.00 0.00 0.00 0.00 0.00 0.00
1044 0.00 0.00 0.00 0.00 0.00 0.001051 0.01 0.01 0.00 0.01 0.01 0.001242 0.00 0.00 0.00 0.02 0.01 0.00
Table 29
All Qafy units in the valley, 6 boreholes
Lateral Spread Horizontal Displacement, m Ground Settlement Displacement, mBorehole ID
Number Youd and others (2002) Average of Tokimatsu and Seed (1987) and Yoshimine and others (2006)
140

M7.0 Scenario 2PE50 10PE50 M7.0 Scenario 2PE50 10PE501053 2.03 1.78 0.06 0.07 0.07 0.031085 0.00 0.00 0.00 0.04 0.04 0.011087 0.00 0.00 0.00 0.02 0.02 0.001103 0.00 0.00 0.00 0.00 0.00 0.001104 0.00 0.00 0.00 0.00 0.00 0.00
Table 30
All Qlpd units in the valley, 5 boreholes
Lateral Spread Horizontal Displacement, m Ground Settlement Displacement, mBorehole ID
Number Youd and others (2002) Average of Tokimatsu and Seed (1987) and Yoshimine and others (2006)
141
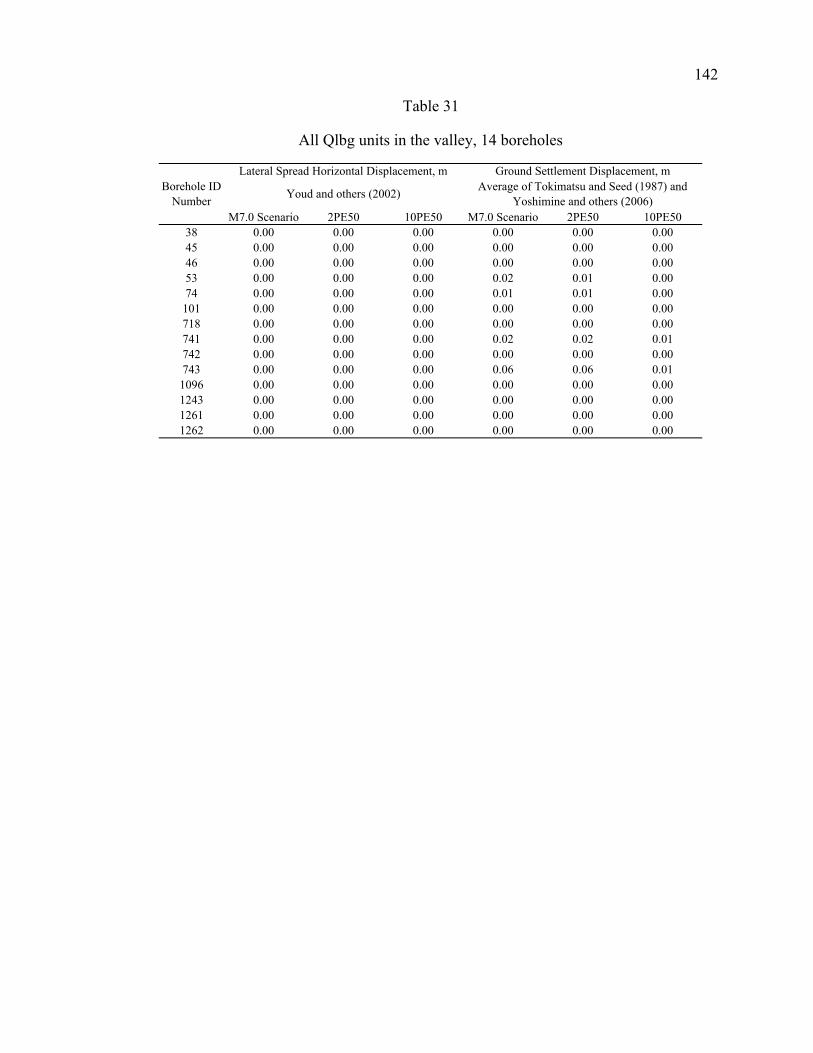
M7.0 Scenario 2PE50 10PE50 M7.0 Scenario 2PE50 10PE5038 0.00 0.00 0.00 0.00 0.00 0.0045 0.00 0.00 0.00 0.00 0.00 0.0046 0.00 0.00 0.00 0.00 0.00 0.0053 0.00 0.00 0.00 0.02 0.01 0.0074 0.00 0.00 0.00 0.01 0.01 0.00
101 0.00 0.00 0.00 0.00 0.00 0.00718 0.00 0.00 0.00 0.00 0.00 0.00741 0.00 0.00 0.00 0.02 0.02 0.01742 0.00 0.00 0.00 0.00 0.00 0.00743 0.00 0.00 0.00 0.06 0.06 0.011096 0.00 0.00 0.00 0.00 0.00 0.001243 0.00 0.00 0.00 0.00 0.00 0.001261 0.00 0.00 0.00 0.00 0.00 0.001262 0.00 0.00 0.00 0.00 0.00 0.00
Table 31
All Qlbg units in the valley, 14 boreholes
Lateral Spread Horizontal Displacement, m Ground Settlement Displacement, mBorehole ID
Number Youd and others (2002) Average of Tokimatsu and Seed (1987) and Yoshimine and others (2006)
142

M7.0 Scenario 2PE50 10PE50 M7.0 Scenario 2PE50 10PE5022 0.00 0.00 0.00 0.00 0.00 0.0039 0.00 0.00 0.00 0.00 0.00 0.0041 0.00 0.00 0.00 0.00 0.00 0.0043 0.00 0.00 0.00 0.00 0.00 0.0060 0.00 0.00 0.00 0.00 0.00 0.0098 0.00 0.00 0.00 0.00 0.00 0.00
103 0.00 0.00 0.00 0.01 0.00 0.00694 0.00 0.00 0.00 0.04 0.03 0.00695 0.00 0.00 0.00 0.04 0.03 0.02708 0.00 0.00 0.00 0.00 0.00 0.00715 0.00 0.00 0.00 0.00 0.00 0.00720 0.00 0.00 0.00 0.00 0.00 0.001164 0.00 0.00 0.00 0.03 0.03 0.001240 0.00 0.00 0.00 0.01 0.00 0.001287 0.00 0.00 0.00 0.00 0.00 0.001290 0.00 0.00 0.00 0.00 0.00 0.001293 0.00 0.00 0.00 0.00 0.00 0.00
*Geologic units include: Qafb, Qca, QTaf, Qes, Qlbm, Mz, Qafo, Qlbs, Pz and Rock
Table 32
Various smaller units* in foothills, 17 boreholes
Lateral Spread Horizontal Displacement, m Ground Settlement Displacement, mBorehole ID
Number Youd and others (2002) Average of Tokimatsu and Seed (1987) and Yoshimine and others (2006)
143

REFERENCES American Association of State Highway and Transportation Officials (AASHTO), 2009,
AASHTO guide specifications for LRFD seismic bridge design (1st edition): LRFDSEIS-1.
Anderson, L.R., Keaton, J.R., Bay, J.A., 1987, Liquefaction potential map for the
Northern Wasatch Front, Utah: Final Report to the U.S. Geological Survey. Anderson, L.R., Keaton, J.R., Spitzley, J.E., and Allen A.C., 1994, Liquefaction potential
map for Salt Lake County, Utah: Utah State University Department of Civil and Environmental Engineering and Dames and Moore, unpublished final technical report prepared for the U.S. Geological Survey: National Earthquake Hazards Reduction Program Award No. 14-08-0001-19910, 48 p. (published as Utah Geological Survey Contract Report 94-9, 1994)
Arnow, T., van Horn, R., and LaPray, R., 1970, The pre-Quaternary surface in the Jordan
Valley, Utah: U.S. Geological Survey Professional Paper 700, p. D257-D261. Ashland, F.X., and McDonald, G.N., 2003, Interim map showing shear wave velocity
characteristics of engineering geological units in the Salt Lake Valley, Utah metropolitan area: Utah Geological Survey Open File Report 424, 43 p. pamphlet, scale 1:75,000, CD-ROM.
Bartlett, S.F. and Youd, T.L., 1992, Case histories of lateral spreads caused by the 1964
Alaska earthquake: Technical Report No. NCEER-92-0021, National Center for Earthquake Engineering Research, State University of New York at Buffalo, N. Y.
Bartlett S.F., Olsen, M.J., and Solomon, B.J., 2005, Lateral spread hazard mapping of
northern Salt Lake County for a magnitude 7.0 scenario earthquake: Technical Report submitted to the United States Geological Survey, USGS Award No. 04HQGR0026, 218 p.
Bernstein, R., 2008, Utah is fastest-growing state: News Release CB08-187, U.S. Census
Bureau. Biek, R.F., Solomon, B.J., Keith, J.D., and Smith, T.W., 2004, Interim geologic maps of
the Copperton, Magna, and Tickville Spring quadrangles, Salt Lake and Utah Counties, Utah: Utah Geological Survey Open-File Report 434, scale 1:24,000.
Black, B.D., Hecker, S., Hylland, M.D., Christenson, G.E., and McDonald, G.N., 2003,
Quaternary fault and fold database and map of Utah: Utah Geological Survey, Utah Department of Natural Resources, Map 193DM.
Cotton, Shires and Associates, Inc., 1999, Final geologic peer review, Salt Place
Convention Center expansion, Salt Lake City, Utah, July 30, 1999.

145
Erickson, G., 2007, Probabilistic liquefaction potential mapping of the Salt Lake Valley,
Utah: M.S. Thesis, Department of Civil and Environmental Engineering, University of Utah.
Frankel, A., Petersen, M., Mueller, C., Haller, K., Wheeler, R., Leyendecker E.V.,
Wesson, R., Harmsen, S., Cramer, C., Perkins, D., and Rukstales, K., 2002, Documentation for the 2002 update of the National Seismic Hazard Maps: U.S. Geological Survey Open File Report 02-420.
Hamada, M., Yasuda, S., Isoyama, R. and Emoto, K, 1986, Study on liquefaction induced
permanent ground displacements: Association for the Development of Earthquake Prediction in Japan, Tokyo, Japan.
Ishihara, K. and Yoshimine, M., 1992, Evaluation of settlements in sand deposits
following liquefaction during earthquakes: Soils and Foundations, Vol. 32(1): p. 173-188.
Japan Highway Association, 2000, Seismic design code of highway bridges: v. V (in
Japanese), p. 119-126. Jarva, J.L., 1994, Liquefaction-potential map for a part of Salt Lake County, Utah: Utah
Geological Survey, Public Information Series, PI-25. Kachadoorian R., 1968, Effects of the earthquake of March 27, 1964 on the Alaska
highway system: U.S. Geological Survey Professional Paper 545-C. U.S. Geological Survey, Washington. D.C.
Kaneko, M., Sasaki, Y., Nishikawa, J., Nagase, M. and Mamiya, K., 1995, River dike
failure in Japan by earthquakes in 1993: Proceedings of the 3rd International Conference in Recent Advances in Geotechnical Earthquake Engineering and Soil Dynamics, St. Louis, Paper No. 6.13, p. 495-598.
Keaton, J.R., and Anderson, L.R., 1995, Mapping liquefaction hazards in the Wasatch
Front region: opportunities and limitations: Environmental and Engineering Geology of the Wasatch Front Region, Utah Geological Association, Publication 24.
Keaton, J.R., Currey, D.R. and Olig, S.J., 1993, Paleoseismicity and earthquake hazards
evaluation of the West Valley fault zone, Salt Lake City urban area: Utah Geological Survey Contract Report 93-8, 55 p.
Kleinfelder Inc., 1999, Geological investigation, proposed Salt Palace Expansion II, Salt
Lake City, Utah: prepared by Kleinfelder Associates, Feb. 26, 1999.

146
Korbay S.R. and McCormick W.V., 1999, Faults, lateral spreading, and liquefaction features, Salt Palace Convention Center, Salt Lake City, Utah: Association of Engineering Geologists Program with Abstracts, 42nd Annual Meeting, Little America Hotel, September 26-29, 1999.
Lund, W.R., 2005, Consensus preferred recurrence-interval and vertical slip-rate
estimates: Utah Geological Survey Bulletin 134, CD-ROM. Lund, W.R., 1990, Engineering geology of the Salt Lake City Metropolitan Area, Utah:
Association of Engineering Geologists, Bulletin 126, Salt Lake City, Utah, p. 1-66. Machette, M.N., Personius, S.F., and Nelson, A.R., 1992, Paleoseismology of the
Wasatch fault zone – A summary of recent investigations, conclusions, and interpretations, in Gori, P.L., and Hays, W.W., editors, Assessment of regional earthquake hazard and risk along the Wasatch Front, Utah: U.S. Geological Survey Professional Paper 1500, p. A1-A71.
McCulloch, D.S. and Bonilla, M.G., 1970, Effects of the earthquake of March 27, 1964,
on the Alaska railroad: U.S. Geological Survey Profession Paper 545-D, 161 p. Meyerhof, G.G., 1957, Discussion for Session I: Proceedings: Fourth International
Conference on Soil Mechanics and Foundation Engineering, v. 3, 10 p. Miller, R.D., 1980, Surficial geologic map along part of the Wasatch Front, Salt Lake
Valley, Utah: U.S. Geological Survey Miscellaneous Field Studies Map MF-1198, scale 1:100,000.
Nagase, H. and Ishihara, K., 1988, Liquefaction-induced compaction and settlement of
sand during earthquakes: Soils and Foundations, v. 28(1), p. 66–76. Olsen, K.B., Pechmann, J.C., and Schuster, G.T., 1995, Simulation of 3-D elastic wave
propagation in the Salt Lake Basin: Bulletin of the Seismological Society of America, v. 85, p. 1688-1710.
Olsen, M.J., Bartlett, S.F. and Solomon, B.J., 2007, Lateral spread hazard mapping of the
northern Salt Lake Valley, Utah, for M7.0 scenario earthquake: Earthquake Spectra, v. 23, Number 1, p. 95-113.
Osmond, J.C., Hewitt, W.P., and Van Horn, R.V., 1965, Engineering implications and
geology, Hall of Justice excavation, Salt Lake City, Utah: Utah Geological and Mineral Survey Special Studies No. 11, 35 p.
Personius, S.F., and Scott, W.E., 1992, Surficial geologic map of the Salt Lake City
segment and parts of adjacent segments of the Wasatch fault zone, Davis, Salt Lake, and Utah Counties, Utah: U.S. Geological Survey Miscellaneous Investigations Map I-2106, scale 1:50,000.

147
Petersen, M.D., Frankel, A.D., Harmsen, S.C., Mueller, C.S., Haller, K.M., Wheeler, R.L., Wesson, R.L., Zeng, Y., Boyd, O.S., Perkins, D.M., Luco, N., Field, E.H., Wills, C.J., and Rukstales, K.S., 2008, Documentation for the 2008 update of the United States National Seismic Hazard Maps: U.S. Geological Survey Open-File Report 2008–1128, 61 p.
Power, M.S. and Holzer, T.L. 1996, Liquefaction maps, ATC Technical Brief 1, ATC-35
Research Utilization Project, Applied Technology Council, 12 p. Scott, W.E., and Shroba R.R., 1985, Surficial geologic map of an area along the Wasatch
fault zone in the Salt Lake Valley, Utah: U.S. Geological Survey Open-File Report 85-448, scale 1:24,000, 18 p.
Seed, H.B., Idriss, I.M., and Arango, I., 1983, Evaluation of liquefaction potential using
field performance data: Journal of Geotechnical Engineering, ASCE, 109(3), p. 458-482.
Seed, H.B., Tokimatsu, K., Harder, L.F., and Chung, R.M., 1985, Influence of SPT
procedures in soil liquefaction resistance evaluations: Journal of Geotechnical Engineering, ASCE, 111(12), p. 1425-1445.
Seed, R.B., Cetin, K.O., Moss, R.E.S., Kammerer, A.M., Wu, J., Pestana, J. M., Riemer,
M. F., 2001, Recent advances in soil liquefaction engineering and seismic site response evaluation: Proceedings: Fourth International Conference on Recent Advances in Geotechnical Earthquake Engineering and Soil Dynamics and Symposium in Honor of Professor W.D. Liam Finn, San Diego, California, March 26-31, 2001, 45 p.
Seed, R.B., Cetin, K.O., Moss, R.E.S., Kammerer, A.M., Wu, J., Pestana, J.M., Riemer,
M.F., Sancio, R.B., Bray, J.D., Kayen, R.E., and Faris, A., 2003, Recent advances in soil liquefaction engineering, a unified and consistent framework, Keynote Address, 26th Annual Geotechnical Spring Seminar, Los Angeles Section of the GeoInstitute, American Society of Civil Engineers, H.M.S. Queen Mary, Long Beach, California, USA: University of California, Berkeley, Earthquake Engineering Research Center, Report No. EERC 2003-06, 71 p.
Simon, D. and Bymaster, W., 1999, Report of geologic investigation, Salt Palace
Convention Center Expansion Project, 100 South West Temple Street, Salt Lake City, Utah: prepared by SBI Geotechnical and Environmental Engineering, March 29, 1999.
Solomon, B.J., Storey, N., Wong, I.G., Silva, W.J., Gregor, N., Wright, D., and
McDonald, G.N., 2004, Earthquake-hazards scenario for a M7 earthquake on the Salt Lake City segment of the Wasatch fault zone: Utah Geological Survey, Special Study 111DM, 65 p.

148
Smith, R.B. and Arabasz, W.J., 1991, Seismicity of the Intermountain seismic belt, in Slemmons, D.B., Engdahl, E.R., Zoback, M.D. and Blackwell, D.D., eds., Neotectonics of North America: Boulder Colorado: Geological Society of America, Decade Map, v. 1.
Tokimatsu, K. and Seed, H.B., 1987, Evaluation of settlements in sand due to earthquake
shaking: Journal of Geotechnical Engineering, ASCE, v. 113(8), p. 861-878. Utah Department of Transportation (UDOT), 2009, Geotechnical Manual of Instruction:
September 2009, 73 p. Wong, I., Silva, W., Wright, D., Olig, S., Ashland, F., Gregor, N., Christenson, G.,
Pechmann, J., Thomas, P., Dober, M., and Gerth, R., 2002, Ground-shaking map for a magnitude 7.0 earthquake on the Wasatch fault, Salt Lake City, Utah, metropolitan area: Utah Geological Survey Miscellaneous Publication MP 02-05, 50 p., Utah Geological Survey Public Information Series 76.
Youngs, R.R., Swan, F.H., Power, M.S., Schwartz, D.P. and Green, R.K., 1987,
Probabilistic analysis of earthquake ground shaking hazard along the Wasatch Front, Utah, in Gori, P.L. and Hays, W.W., eds., Assessment of Regional Earthquake Hazards and Risk Along the Wasatch Front, Utah: U. S. Geological Survey Professional Paper 1500 K-R, p. M1-M110.
Yoshida, Y., Tokimatsu, K., Yasuda, S., Kokusho, T. and Okimura, T., 2001,
Geotechnical aspects of damage in Adapazari City during 1999 Kocaeli, Turkey earthquake: Soils and Foundations, Japanese Geotechnical Society, v. 41, no. 4, p. 25-45.
Yoshimine, M., Nishizaki, H., Amano, K., and Hosono, Y., 2006, Flow deformation of
liquefied sand under constant shear load and its application to analysis of flow slide of infinite slope: Soil Dynamics and Earthquake Engineering, 26(2-4), p. 253-264
Youd, T.L. and Hoose, S.N., 1978, Historic ground failures in Northern California
triggered by earthquakes: U.S. Geological Survey Professional Paper 993. Youd, T.L. and Perkins, D.M., 1978, Mapping liquefaction-induced ground failure
potential: Journal of the Geotechnical Engineering Division, ASCE, v. 104, p. 443-446.
Youd, T.L. and Perkins, D.M., 1987, Mapping of liquefaction severity index: Journal of
Geotechnical Engineering, ASCE, v. 113(11), p. 1374-1392.

149
Youd, T.L., Idriss, I.M., Andrus, R.D., Arango, I., Castro, G., Christian, J.T., Dobry, R., Finn, W.D.L., Harder, L.F., Jr., Hynes, M.E., Ishihara, K., Koester, J.P., Liao, S.S.C., Marcuson, W.F., III, Martin, G.R., Mitchell, J.K., Moriwaki, Y., Power, M.S., Robertson, P.K., Seed, R.B., and Stokoe, K.H., II, 2001, Liquefaction resistance of soils: summary report from the 1996 NCEER and 1998 NCEER/NSF workshops on evaluation of liquefaction resistance of soils: Journal of Geotechnical and Geoenvironmental Engineering, ASCE, v. 127, no. 10, October, 2001, p. 817-833.
Youd, T.L., Hansen, C.M., and Bartlett S.F., 2002, Revised multilinear regression
equations for prediction of lateral spread displacement: Journal of Geotechnical and Geoenvironmental Engineering, v. 128, no. 12, p. 1007-1017.