Embed Size (px)
Citation preview

School of Environmental Science & EngineeringSchool of Environmental Science & EngineeringYanchengYanchengInstitute of TechnologyInstitute of Technology
Biochar amendment reduces crops uptake Cd in a contaminated paddy soil:
a two-year field experiment
Liqiang Cui
Biochar and New Green Agriculture in China

Contents
Background1
Main research3
Approach2
Conclusions4

Yancheng Institute of Technology 3
� A large area of China’s croplands has been reported to
have Cd contamination in a recent soil pollution survey
(Zhang et al. 2000; Teng et al. 2010), which raised
particular concerns for subsistence-diet rice farmers of
South China (Zhang et al., 2009a).
� Rice paddies subject to Cd contamination appear to
have expanded for the last decade due to irrigation with
waste water , factory waste, chemical fertilization and so
on in South China (Du et al. 2009).
1.1 Soil contamination status of heavy metal
Yancheng Institute of Technology 4
� Rice and wheat have been of particular concern as a Cd
health risk through food exposure by subsistence diet
consumers (Chaney et al. 2005)
� Therefore, reducing Cd plant uptake would be an
urgent demand for safe rice production in China.
1.2 Diet exposure risk of heavy metal

Yancheng Institute of Technology 5
1.3 New technologies in controlling heavy metal contamination
� The biochar was a kind of charcoal material and produced by
pyrolysis biomass at 350 to 550°°°°C using a vertical kiln;
� If biochar was used as agriculture material, it could reduce GHGs
emission in rice agriculture, particularly in the acidic Cd-
contaminated fields (Pan et al., 2010;;;;Zhang et al., 2011,
Lehmann et al., 2009 ) .
Yancheng Institute of Technology 6
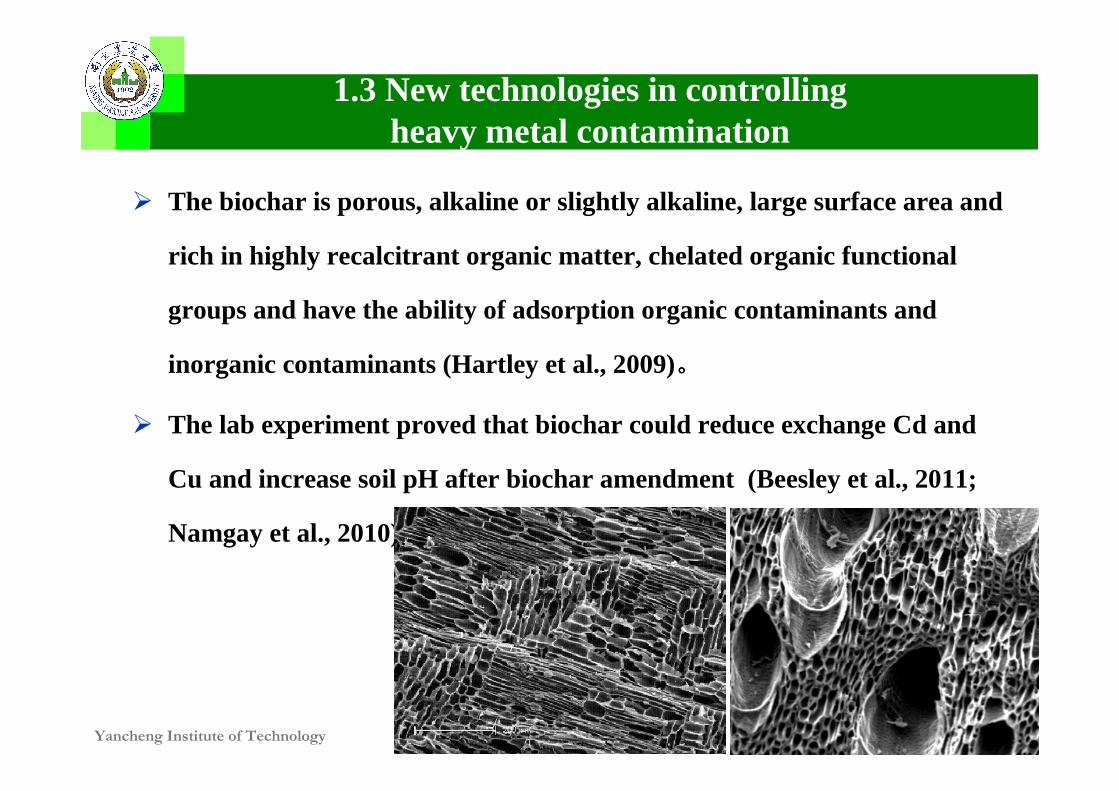
� The biochar is porous, alkaline or slightly alkaline, large surface area and
rich in highly recalcitrant organic matter, chelated organic functional
groups and have the ability of adsorption organic contaminants and
inorganic contaminants (Hartley et al., 2009)。。。。
� The lab experiment proved that biochar could reduce exchange Cd and
Cu and increase soil pH after biochar amendment (Beesley et al., 2011;
Namgay et al., 2010)。。。。
1.3 New technologies in controlling heavy metal contamination

Yancheng Institute of Technology
2 Approach
Mechanism of biochar reduce crops uptake soil Cd
Soil CdCrops uptake Cd
Crops + contaminated soil
Bichar
10
Yieldtissues Cd concentration
Relation of grain and soil exchangeable Cd
Change of soil exchangeable Cd
Affect of soil pH

Yancheng Institute of Technology 8
3 Main Research
2
1Effects of biochar on rice uptake Cd and soil physical and chemical properties
Effects of biochar on wheat Cd uptake and on soil physical and chemical properties

Yancheng Institute of Technology 9
3.1 Effects of biochar on rice Cd uptake

Yancheng Institute of Technology 10
3.1 Effects of biochar on rice Cd uptake
� A field experiment for alleviation of Cd uptake in rice grain using biochar as
soil amendment was initiated in 2009. The experimental site was located in
Yifeng village (31º24.434'N, 119º41.605'E), Yixing Municipality, Jiangsu,
China and was conducted in a rice farm that had been contaminated with
heavy metals from a metallurgy plant in that vicinity since the 1970s. The
status of multi-metal contaminated and high grain Cd level of the rice grown
in the field was already reported by Liu et al. (2006). The rice farm had been
cultivated traditionally under rotation of rice and winter wheat.
3.1.1 Materials and Methods
Yancheng Institute of Technology 11
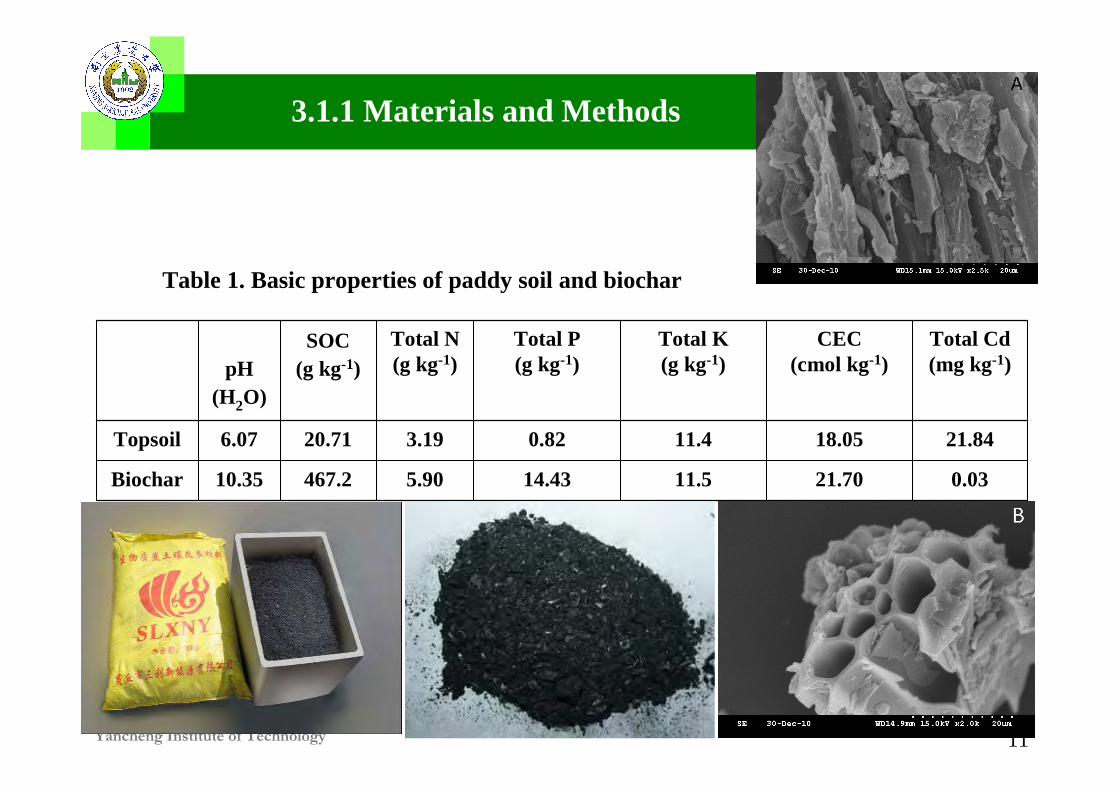
Table 1. Basic properties of paddy soil and biochar
0.0321.7011.514.435.90467.210.35Biochar
21.8418.0511.40.823.1920.716.07Topsoil
Total Cd (mg kg-1)
CEC (cmol kg-1)
Total K(g kg-1)
Total P(g kg-1)
Total N (g kg-1)
SOC (g kg-1)pH
(H2O)
3.1.1 Materials and Methods
Yancheng Institute of Technology 12
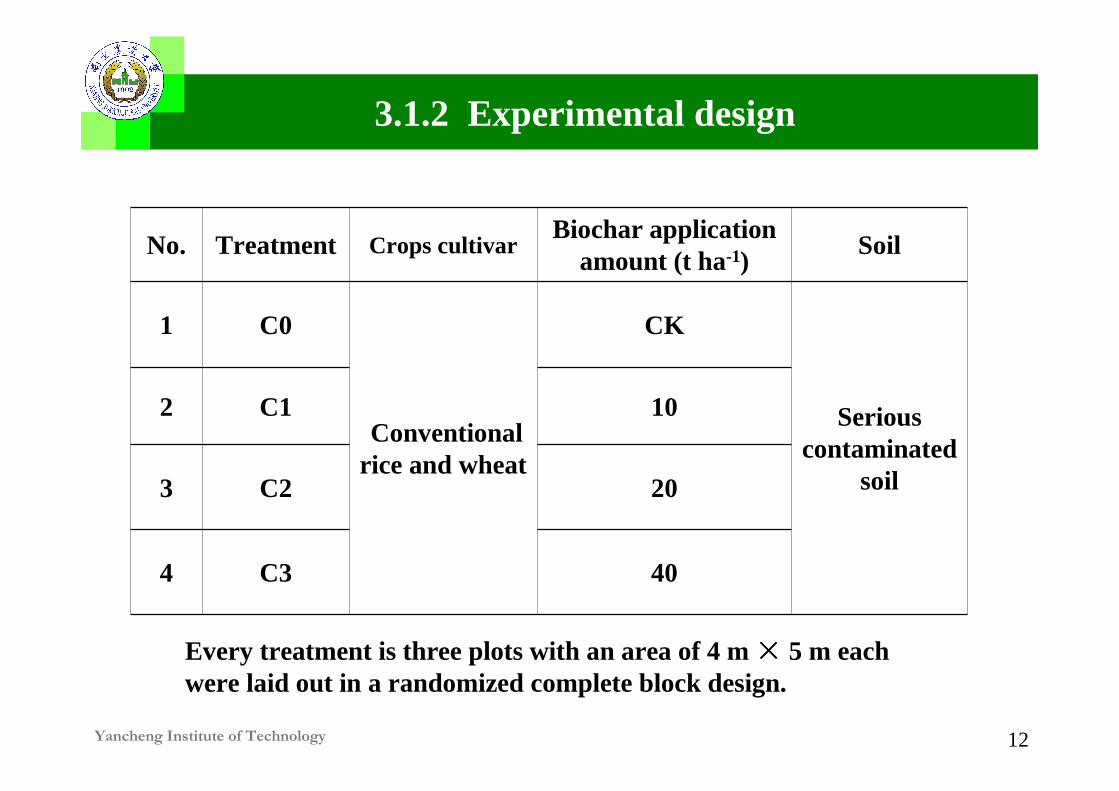
3.1.2 Experimental design
40C34
20C23
10C12 Serious contaminated
soil
CK
Conventional rice and wheat
C01
SoilBiochar application
amount (t ha-1)Crops cultivarTreatmentNo.
Every treatment is three plots with an area of 4 m ×××× 5 m each were laid out in a randomized complete block design.
Yancheng Institute of Technology 13
3.1.3 Results
3.1.3.1 Effects of biochar on the yield of rice
3.1.3.2 Effects of biochar on rice Cd uptake
3.1.3.3 Effects of biochar on soil pH and the concentration of
exchangeable Cd
Yancheng Institute of Technology 14
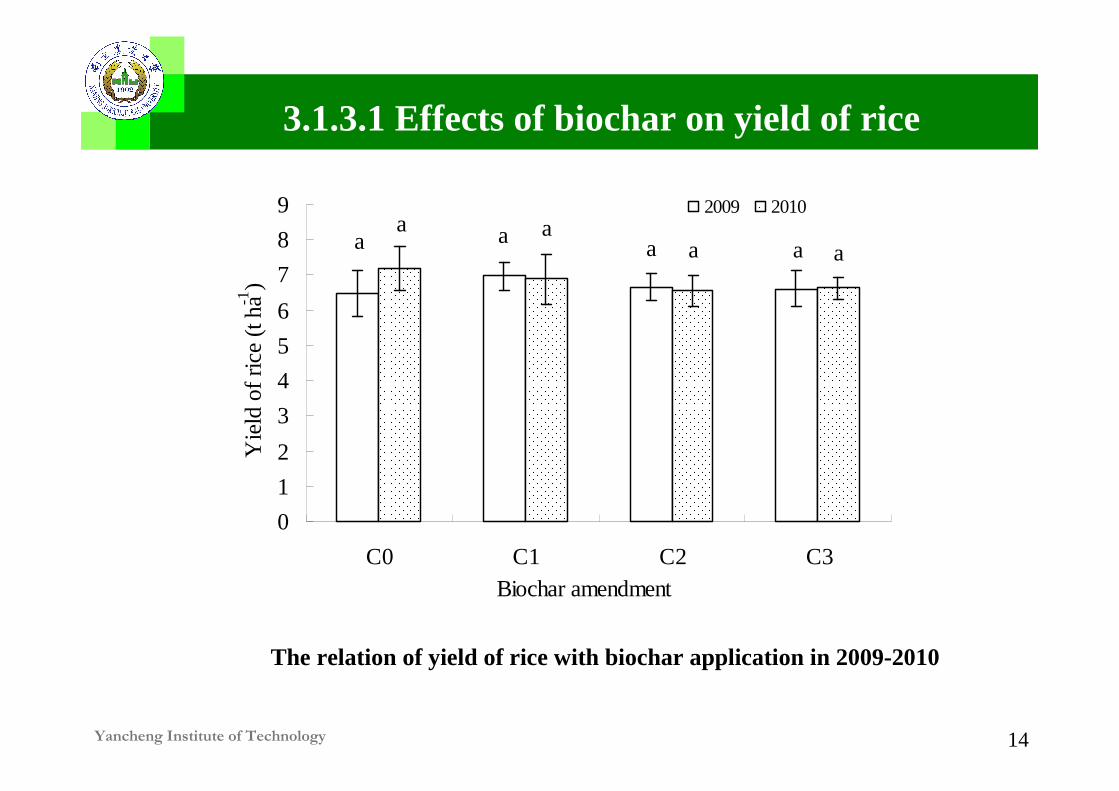
3.1.3.1 Effects of biochar on yield of rice
The relation of yield of rice with biochar application in 2009-2010
a aa a
a aa a
0
1
2
3
4
5
6
7
8
9
C0 C1 C2 C3Biochar amendment
Yie
ld o
f ri
ce (
t ha-1
)
2009 2010
Yancheng Institute of Technology 15
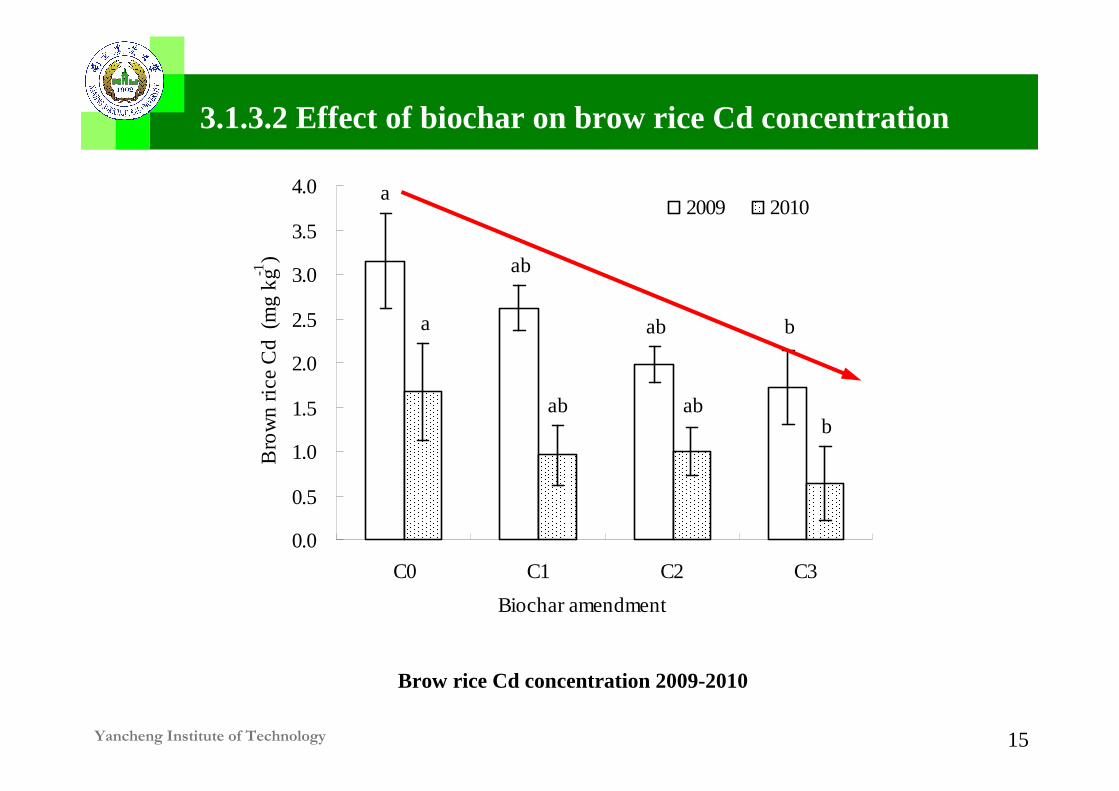
3.1.3.2 Effect of biochar on brow rice Cd concentration
Brow rice Cd concentration 2009-2010
bab
ab
a
babab
a
0.0
0.5
1.0
1.5
2.0
2.5
3.0
3.5
4.0
C0 C1 C2 C3
Biochar amendment
Bro
wn
rice
Cd
(mg
kg-1
)
2009 2010
Yancheng Institute of Technology 16
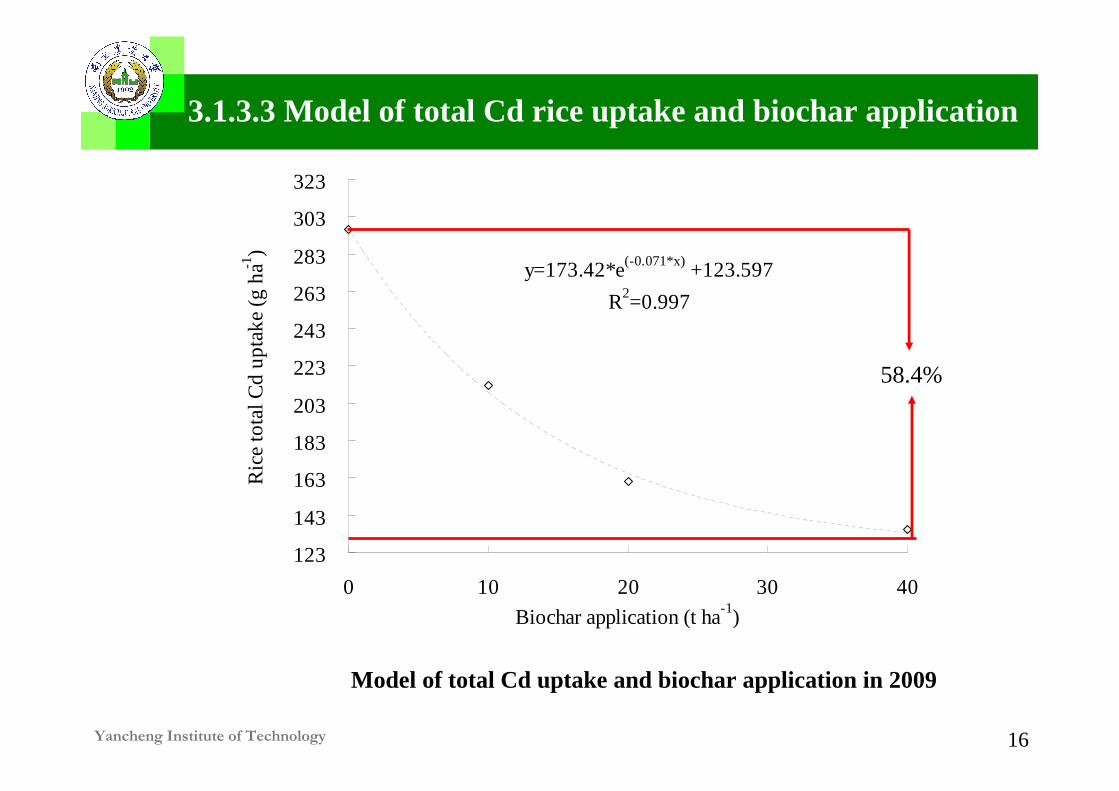
y=173.42*e(-0.071*x) +123.597
R2=0.997
123
143
163
183
203
223
243
263
283
303
323
0 10 20 30 40
Biochar application (t ha-1)
Ric
e to
tal C
d up
take
(g
ha-1
)
3.1.3.3 Model of total Cd rice uptake and biochar application
Model of total Cd uptake and biochar application in 2009
58.4%

Yancheng Institute of Technology 17
y=74.101*e(-0.059*x) +166.236
R2=0.969
160
170
180
190
200
210
220
230
240
250
0 10 20 30 40
Biochar application (t ha-1)
Ric
e to
tal C
d up
take
(g
ha-1
)
3.1.3.3 Model of total Cd rice uptake and biochar application
30.8%
Model of total Cd uptake and biochar application in 2010
Yancheng Institute of Technology 18
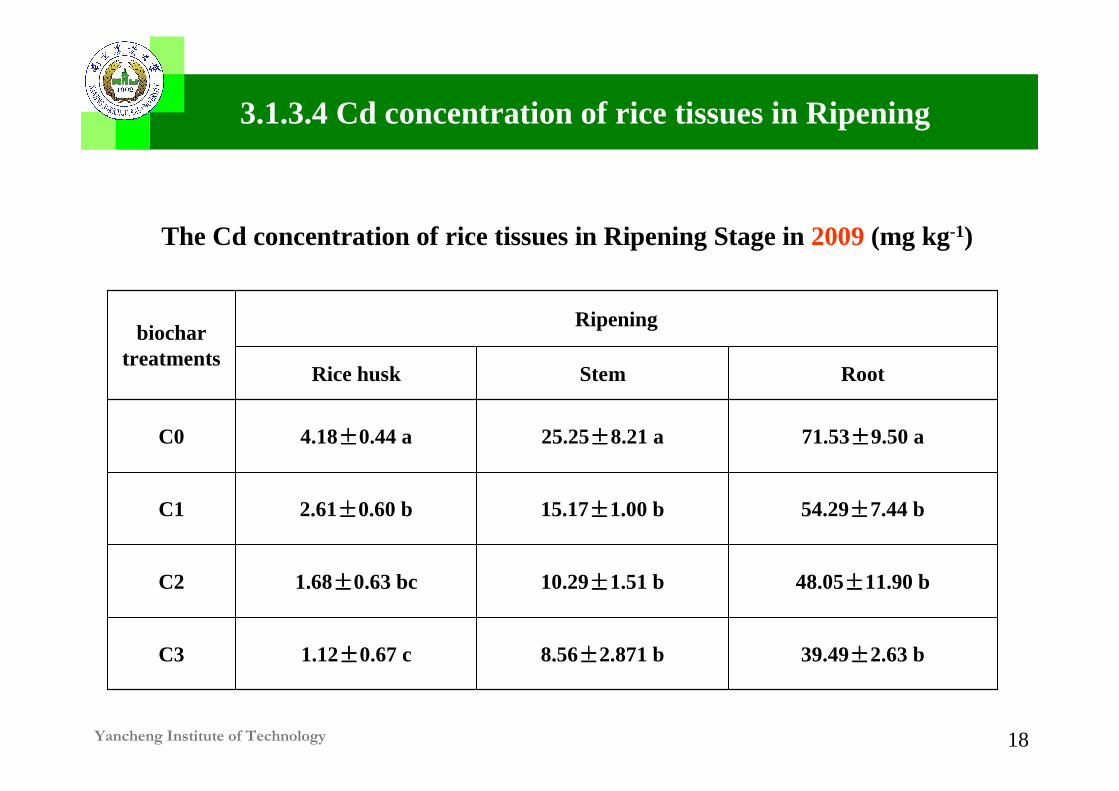
3.1.3.4 Cd concentration of rice tissues in Ripening
The Cd concentration of rice tissues in Ripening Stage in 2009(mg kg-1)
39.49±±±±2.63 b8.56±±±±2.871 b1.12±±±±0.67 cC3
48.05±±±±11.90 b10.29±±±±1.51 b1.68±±±±0.63 bcC2
54.29±±±±7.44 b15.17±±±±1.00 b2.61±±±±0.60 bC1
71.53±±±±9.50 a25.25±±±±8.21 a4.18±±±±0.44 aC0
RootStemRice husk
biochar treatments
Ripening
Yancheng Institute of Technology 19
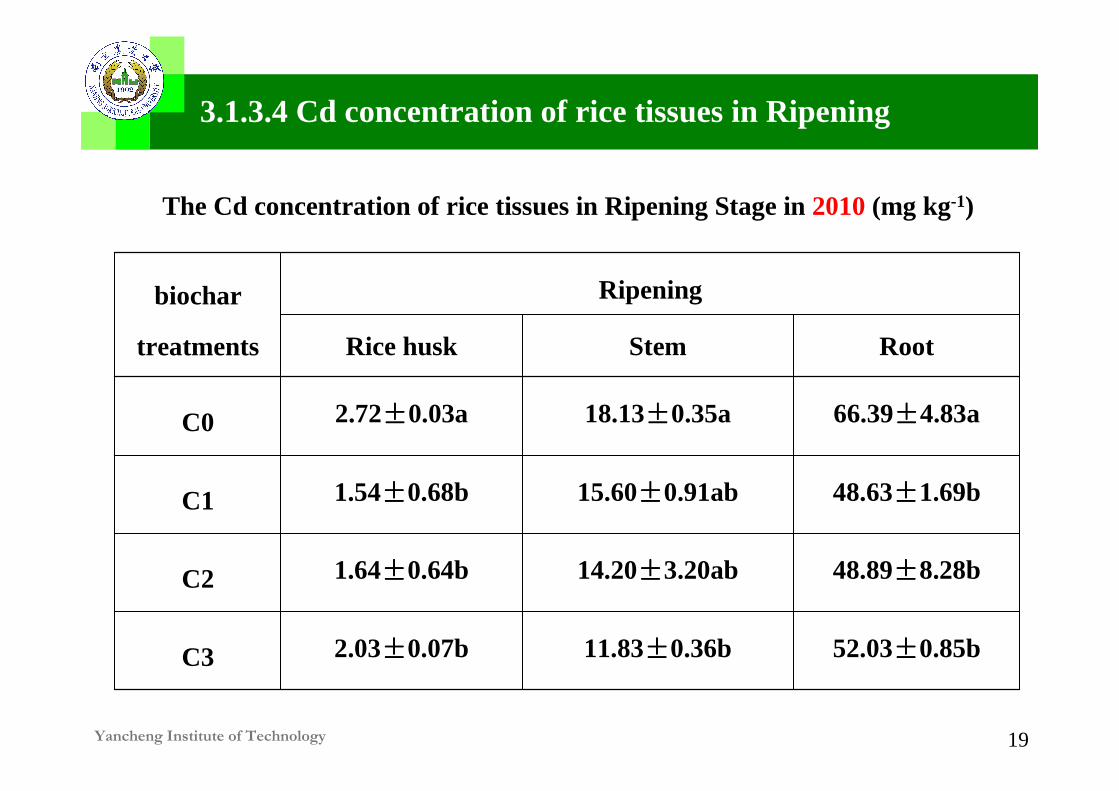
3.1.3.4 Cd concentration of rice tissues in Ripening
52.03±±±±0.85b11.83±±±±0.36b2.03±±±±0.07bC3
48.89±±±±8.28b14.20±±±±3.20ab1.64±±±±0.64bC2
48.63±±±±1.69b15.60±±±±0.91ab1.54±±±±0.68bC1
66.39±±±±4.83a18.13±±±±0.35a2.72±±±±0.03aC0
RootStemRice husk
Ripeningbiochar
treatments
The Cd concentration of rice tissues in Ripening Stage in 2010(mg kg-1)
Yancheng Institute of Technology 20
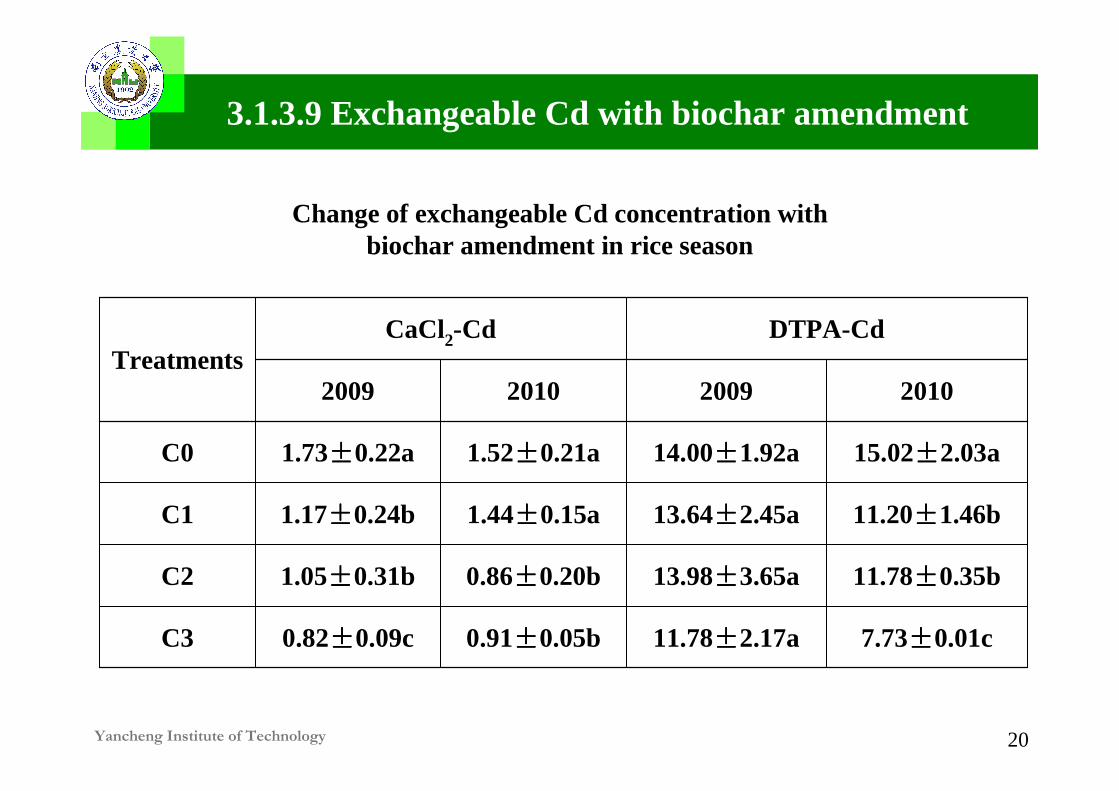
Change of exchangeable Cd concentration with biochar amendment in rice season
3.1.3.9 Exchangeable Cd with biochar amendment
7.73±±±±0.01c11.78±±±±2.17a0.91±±±±0.05b0.82±±±±0.09cC3
11.78±±±±0.35b13.98±±±±3.65a0.86±±±±0.20b1.05±±±±0.31bC2
11.20±±±±1.46b13.64±±±±2.45a1.44±±±±0.15a1.17±±±±0.24bC1
15.02±±±±2.03a14.00±±±±1.92a1.52±±±±0.21a1.73±±±±0.22aC0
2010200920102009
DTPA-CdCaCl2-CdTreatments
Yancheng Institute of Technology 21
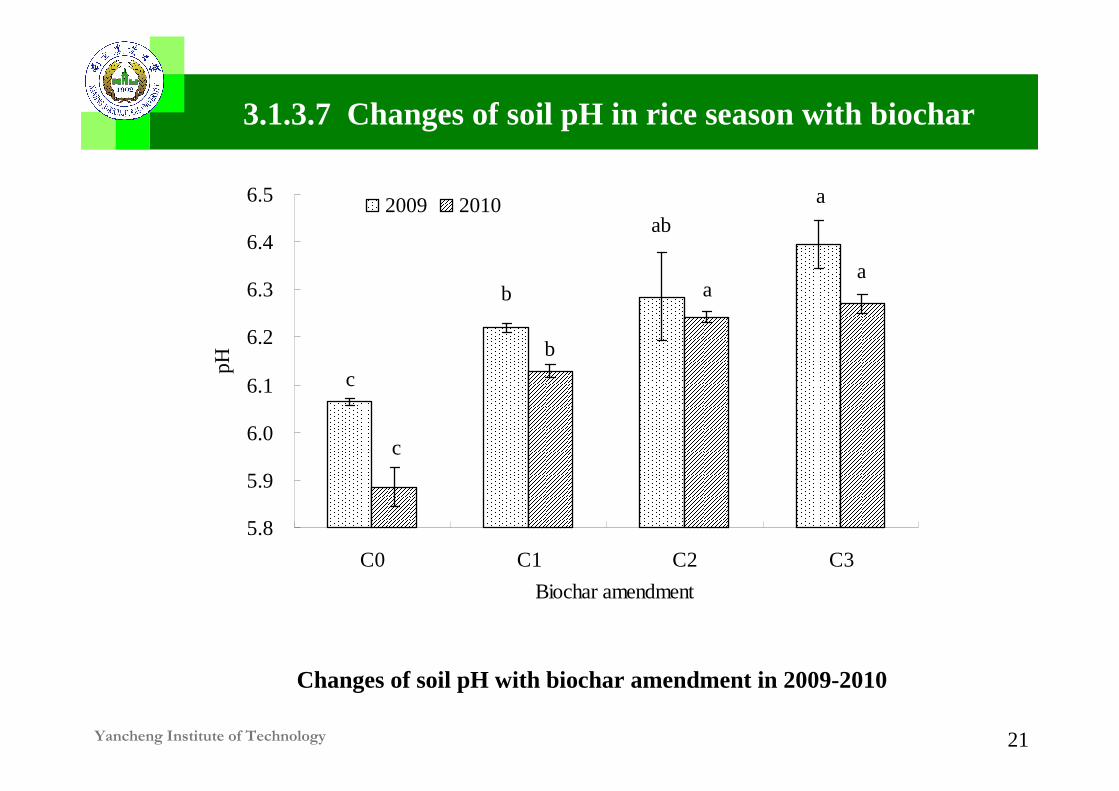
3.1.3.7 Changes of soil pH in rice season with biochar
Changes of soil pH with biochar amendment in 2009-2010
c
b
aba
c
b
aa
5.8
5.9
6.0
6.1
6.2
6.3
6.4
6.5
C0 C1 C2 C3
Biochar amendment
pH2009 2010

Yancheng Institute of Technology 22
Correlation of CaCl2-Cd with pH in 2009 Correlation of DTPA-Cd with pH in 2009
3.1.3.8 Correlation of exchangeable Cd uptake with soil pH
y = -2.7522x + 18.369
R2 = 0.974
P=0.0131
0.4
0.6
0.8
1.0
1.2
1.4
1.6
1.8
6 6.1 6.2 6.3 6.4 6.5Soil pH
CaC
l 2 C
d (m
g kg
-1)
Cd-pH
y = -5.8573x + 49.908
R2 = 0.5822P>0.05
10
11
12
13
14
15
6 6.1 6.2 6.3 6.4 6.5
Soil pH
DT
PA C
d (m
g kg
-1)
Cd-pH
Yancheng Institute of Technology 23
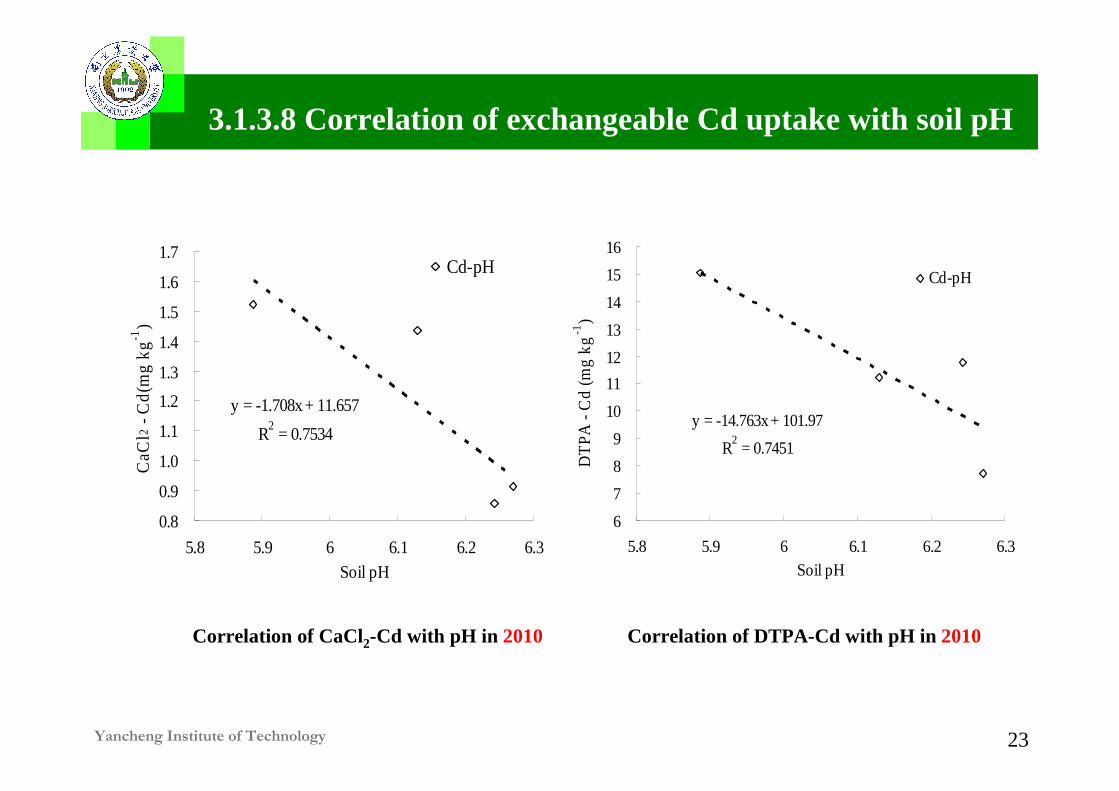
Correlation of CaCl2-Cd with pH in 2010 Correlation of DTPA-Cd with pH in 2010
3.1.3.8 Correlation of exchangeable Cd uptake with soil pH
y = -1.708x + 11.657
R2 = 0.7534
0.8
0.9
1.0
1.1
1.2
1.3
1.4
1.5
1.6
1.7
5.8 5.9 6 6.1 6.2 6.3Soil pH
CaC
l 2 -
Cd(
mg
kg -1
)
Cd-pH
y = -14.763x + 101.97
R2 = 0.7451
6
7
8
9
10
11
12
13
14
15
16
5.8 5.9 6 6.1 6.2 6.3Soil pH
DT
PA -
Cd
(mg
kg -1
)
Cd-pH

Yancheng Institute of Technology 24
� Rice grain yield was not affected by the application of
biochar in two years;
� The Cd concentration of different rice tissues were
significantly reduced with biochar application.
� Soil pH was significantly increased, and soil exchangeable
Cd was significantly decreased after biochar application at
least two years.
3.1.4 Summary

Yancheng Institute of Technology 25
3.2 Effects of biochar on wheat Cd uptake

Yancheng Institute of Technology 26
3.2.1 Effects of biochar on yield of wheat
Change of the wheat yield during with biochar amendment 2010-2011
a
a
aa
a
a a a
0
1
2
3
4
5
6
7
C0 C1 C2 C3
Biochar amendment
Whe
at y
ield
(t
ha-1
)
2010 2011

Yancheng Institute of Technology 27
3.2.2 Effects of biochar on grain Cd of wheat
Change of the grain Cd of wheat concentration with biochar amendment during 2010-2011
b
b
aba
aa a
b
0
2
4
6
8
10
12
14
C0 C1 C2 C3
Biochar amendment
Whe
at g
rain
Cd
(mg
kg-1
) 2010 2011

Yancheng Institute of Technology 28
y=68.317*e(-0.049*x) +88.841
R2=0.999
88
98
108
118
128
138
148
158
168
0 10 20 30 40
Biochar application (t ha-1)
Tot
al C
d up
take
(g
ha-1
)
3.2.3 Model of total Cd wheat uptake and biochar application
43.5%
Model of total Cd uptake and biochar application in 2010

Yancheng Institute of Technology 29
y=165.091*e(-0.02*x) +148.346
R2=0.976
148
168
188
208
228
248
268
288
308
328
0 10 20 30 40Biochar amendment (t ha-1)
Tot
al C
d up
take
(g
ha-1
)
3.2.3 Model of total Cd wheat uptake and biochar application
Model of total Cd uptake and biochar application in 2011
53%

Yancheng Institute of Technology 30
3.2.4 Cd concentration of wheat tissues in Ripening
43.62±±±±9.08 b15.03±±±±3.19 c55.94±±±±5.31 b11.45±±±±3.99 bC3
43.36±±±±4.35 b18.89±±±±1.11 b64.25±±±±8.06 ab13.89±±±±2.29 bC2
59.51±±±±4.20 a20.49±±±±1.42 b70.05±±±±1.03 a16.12±±±±1.50 abC1
56.77±±±±1.69 a25.53±±±±1.33 a73.40±±±±1.43 a22.68±±±±3.04 aC0
RootStemRootStem
20112010Biochar
treatments
The Cd concentration of wheat tissues in Ripening Stage (mg kg-1)

Yancheng Institute of Technology 31
Change in Cd mobility in soil with biochar amendment in wheat season
3.2.3 Effects of biochar on soil exchangeable Cd
12.50±±±±0.07 b 13.13±±±±0.43 b2.77±±±±0.24 a 3.60±±±±0.71 cC3
14.90±±±±1.59 ab13.00±±±±0.55 b2.74±±±±0.69 a 4.60±±±±0.30 bC2
14.32±±±±1.38 ab14.29±±±±0.42 a3.50±±±±0.53 a 5.40±±±±0.36 abC1
16.98±±±±2.07 a 14.77±±±±0.82 a3.56±±±±0.48 a 6.01±±±±0.34 aC0
2011201020112010
DTPA-CdCaCl2-CdBiochar
treatment
Yancheng Institute of Technology 32
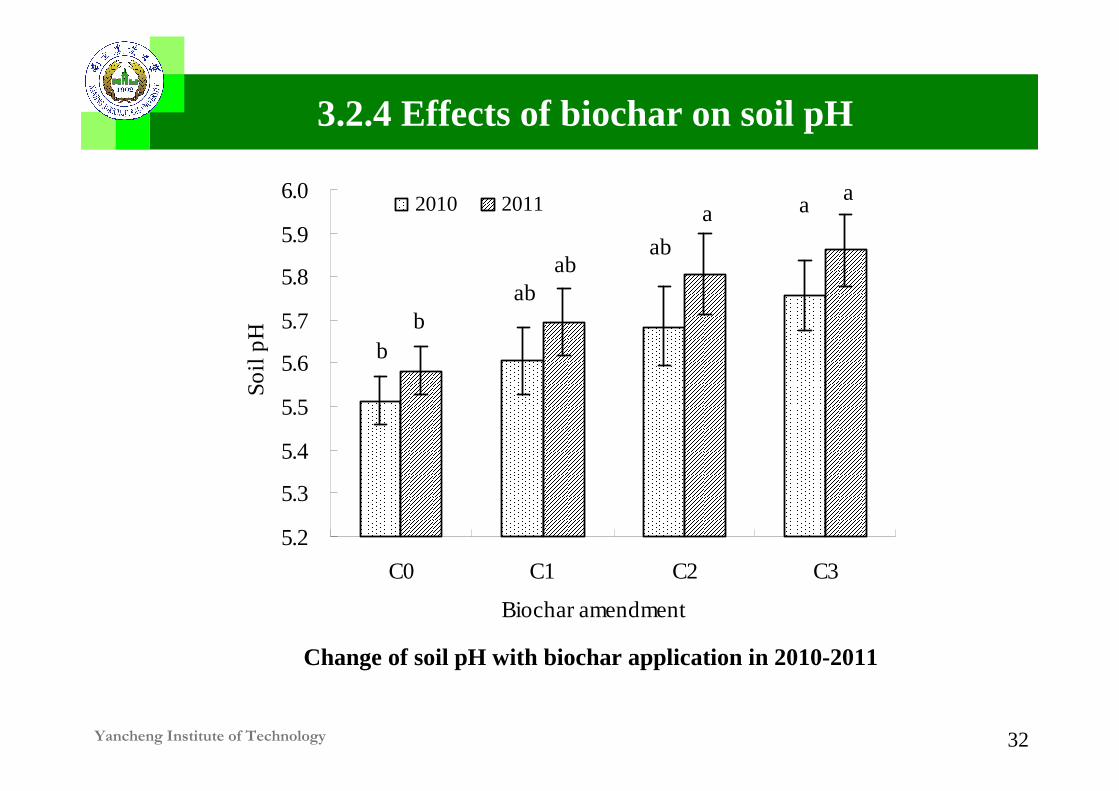
3.2.4 Effects of biochar on soil pH
Change of soil pH with biochar application in 2010-2011
a
ab
ab
bb
ab
aa
5.2
5.3
5.4
5.5
5.6
5.7
5.8
5.9
6.0
C0 C1 C2 C3
Biochar amendment
Soil
pH
2010 2011
Yancheng Institute of Technology 33
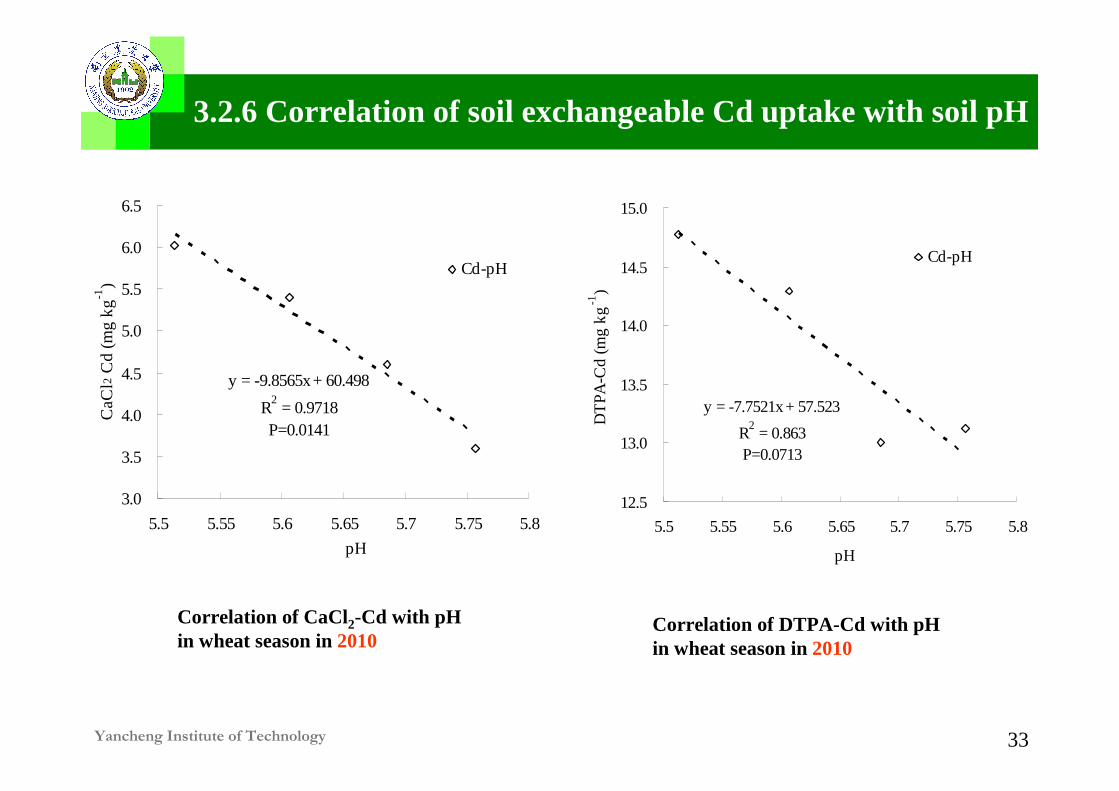
Correlation of CaCl2-Cd with pH in wheat season in2010
Correlation of DTPA-Cd with pH in wheat season in2010
3.2.6 Correlation of soil exchangeable Cd uptake with soil pH
y = -9.8565x + 60.498
R2 = 0.9718
P=0.0141
3.0
3.5
4.0
4.5
5.0
5.5
6.0
6.5
5.5 5.55 5.6 5.65 5.7 5.75 5.8
pH
CaC
l 2 C
d (m
g kg
-1)
Cd-pH
y = -7.7521x + 57.523
R2 = 0.863
P=0.0713
12.5
13.0
13.5
14.0
14.5
15.0
5.5 5.55 5.6 5.65 5.7 5.75 5.8
pH
DT
PA-C
d (m
g kg
-1)
Cd-pH
Yancheng Institute of Technology 34
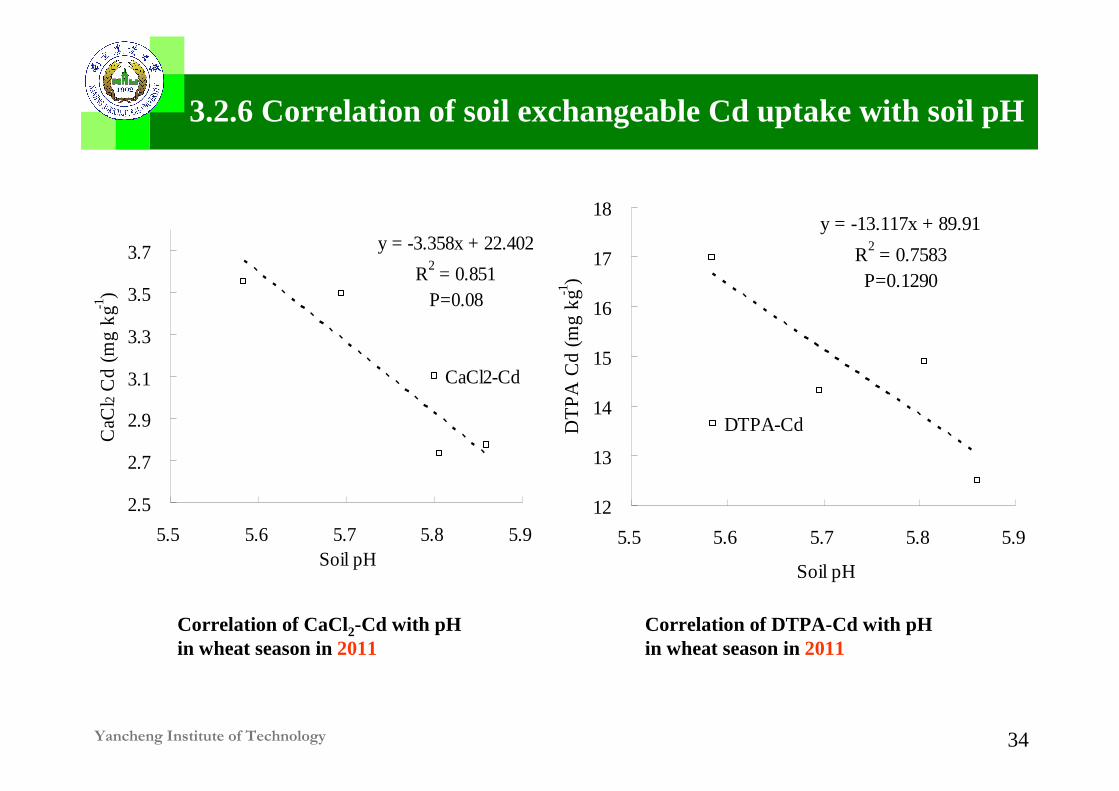
3.2.6 Correlation of soil exchangeable Cd uptake with soil pH
Correlation of CaCl2-Cd with pH in wheat season in2011
Correlation of DTPA-Cd with pH in wheat season in2011
y = -3.358x + 22.402
R2 = 0.851P=0.08
2.5
2.7
2.9
3.1
3.3
3.5
3.7
5.5 5.6 5.7 5.8 5.9Soil pH
CaC
l 2 C
d (m
g kg
-1)
CaCl2-Cd
y = -13.117x + 89.91
R2 = 0.7583P=0.1290
12
13
14
15
16
17
18
5.5 5.6 5.7 5.8 5.9
Soil pHD
TP
A C
d (m
g kg
-1)
DTPA-Cd
Yancheng Institute of Technology 35
� The yield of wheat was not affected with biochar application
in two years;
� The Cd concentration of different wheat tissues were
significantly reduced with biochar application.
� Soil pH was significantly increased, and soil exchangeable
Cd was significantly decreased after biochar application at
least two years.
3.2.7 Summary

Yancheng Institute of Technology 36
4 conclusions
� The yield of the rice and wheat is stable with biochar application
in two years.
� The rice and wheat tissues Cd concentration were significantly
decreased nearly by 50%.
� Soil pH was significantly increased amended biochar.
� Soil exchangeable Cd concentration was decreased and 3.5-5.4
times higher in wheat season than rice season.
� There was a significant negative correlation between the soil
exchangeable Cd and soil pH.
Yancheng Institute of Technology 37
4 conclusions
� The results prove that the biochar is a very environment
safe soil conditioner for inhibition the Cd crops uptake at
least two years.
� From the results, it is a safe soil conditioner to reduce the
Cd crop uptake by stabilizing, strongly adsorbing the
exchangeable Cd and improve the soil pH.

Yancheng Institute of Technology 38
Biochar application Seedling stage Jointing stage
Ripening stage Rice harvest Wheat Ripening stage