Embed Size (px)
Citation preview

Liolios 7th Annual Gateway ConferenceSeptember 5-6, 2018

Industry Data and Forward-Looking Statements Disclaimer
§ Broadwind obtained the industry and market data used throughout this presentation from our own research, internal surveys and studies conducted by third parties, independent industry associations or general publications and other publicly available information. Independent industry publications and surveys generally state that they have obtained information from sources believed to be reliable, but do not guarantee the accuracy or completeness of such information. Forecasts are particularly likely to be inaccurate, especially over long periods of time. We are not aware of any misstatements in the industry data we have presented herein, but estimates involve risks and uncertainties and are subject to change based on various factors beyond our control.
§ This presentation contains “forward-looking statements”, as defined in Section 21E of the Securities Exchange Act of 1934, as amended. Forward-looking statements include any statement that does not directly relate to a current or historical fact. Our forward-looking statements may include or relate to our beliefs, expectations, plans and/or assumptions with respect to the following: (i) state, local and federal regulatory frameworks affecting the industries in which we compete, including the wind energy industry, and the related extension, continuation or renewal of federal tax incentives and grants and state renewable portfolio standards; (ii) our customer relationships and efforts to diversify our customer base and sector focus and leverage customer relationships across business units; (iii) our ability to continue to grow our business organically and through acquisitions; (iv) the sufficiency of our liquidity and alternate sources of funding, if necessary; (v) our ability to realize revenue from customer orders and backlog; (vi) our ability to operate our business efficiently, manage capital expenditures and costs effectively, and generate cash flow; (vii) the economy and the potential impact it may have on our business, including our customers; (viii) the state of the wind energy market and other energy and industrial markets generally and the impact of competition and economic volatility in those markets; (ix) the effects of market disruptions and regular market volatility, including fluctuations in the price of oil, gas and other commodities; (x) the effects of the recent change of administrations in the U.S. federal government; (xi) our ability to successfully integrate and operate the business of Red Wolf Company, LLC and to identify, negotiate and execute future acquisitions; and (xii) the potential loss of tax benefits if we experience an “ownership change” under Section 382 of the Internal Revenue Code of 1986, as amended. These statements are based on information currently available to us and are subject to various risks, uncertainties and other factors. We are under no duty to update any of these statements. You should not consider any list of such factors to be an exhaustive statement of all of the risks, uncertainties or other factors that could cause our current beliefs, expectations, plans and/or assumptions to change.
§ This presentation contains non-GAAP financial information. We believe that certain non-GAAP financial measures may provide users of this financial information with meaningful comparisons between current results and results in prior operating periods. We believe that these non-GAAP financial measures can provide additional meaningful reflection of underlying trends of the business because they provide a comparison of historical information that excludes certain infrequently occurring or non-operational items that impact the overall comparability. Non-GAAP financial measures should be viewed in addition to, and not as an alternative to, our reported results prepared in accordance with GAAP. Please see our earnings release dated July 31, 2018 for a reconciliation of certain non-GAAP measures presented in this presentation.
2September 2018

Introduction to Broadwind EnergyTowers and Heavy Fabrications§ Leading US wind tower manufacturer with plants
strategically located in Texas and Wisconsin
§ Current capacity – 550 towers per year
§ Have produced towers for every major OEM in industry
§ Heavy Fabrications product line leverages core
competencies
Gearing§ 90+ year history
§ Large precision custom gearing manufacturer
§ Custom gearbox division launched in 2018
§ Broad market reach has boosted growth in 2017-18
Process Systems§ Kitting (3000+ components), fabrication and assembly for
natural gas turbines
§ Fabrication and assembly for complex skid and compression
packages
§ Growth focused on diversification of markets and customer
base
3September 2018
Investment Thesis§ Medium term US Wind markets fundamentally strong§ Tower and Heavy Fabrications segment recovering in 2018 due to
improved tower demand and successful customer/product diversification § Broadwind gearing gaining share in strong oil & gas and
mining/construction markets—delivering improved operational results§ Capital availability will support tower business recovery§ >$200M NOL to shelter income for foreseeable future
4September 2018

2018 Focus
§ Order intake recovering following 2017 inventory correction by primary tower customer
§ Successful ramp up of tower facilities following near shut down in Q4 17
§ Customer diversification plans on track § Multi-year 50% operating footprint consolidation nearing
completion§ Manufacturing excellence processes taking hold in
Gearing—underperforming business gaining significant traction
§ Capital management focus ongoing
5September 2018

Successful Diversification of BWEN Customer Base
$0
$5,000
$10,000
$15,000
$20,000
$25,000
$30,000
$35,000
$40,000
$45,000
Jan-1
8
Mar-18
May-18
Jul-1
8
Sep-18
Nov-18
Customer Diversification Progress
YTD actual
§ Diversification of customer base on track to meet $40M target for 2018 orders
§ Oil and gas, mining and other industrial has grown to ~$60M annual intake for BWEN
$40M target
$0
$10,000
$20,000
$30,000
$40,000
$50,000
$60,000
$70,000
Dec-16
Apr-17
Aug-17
Dec-17
Apr-18
Aug-18
Non-wind Order Trend (T12M)
Mining/OHV Oil & Gas Other Industrial
6September 2018
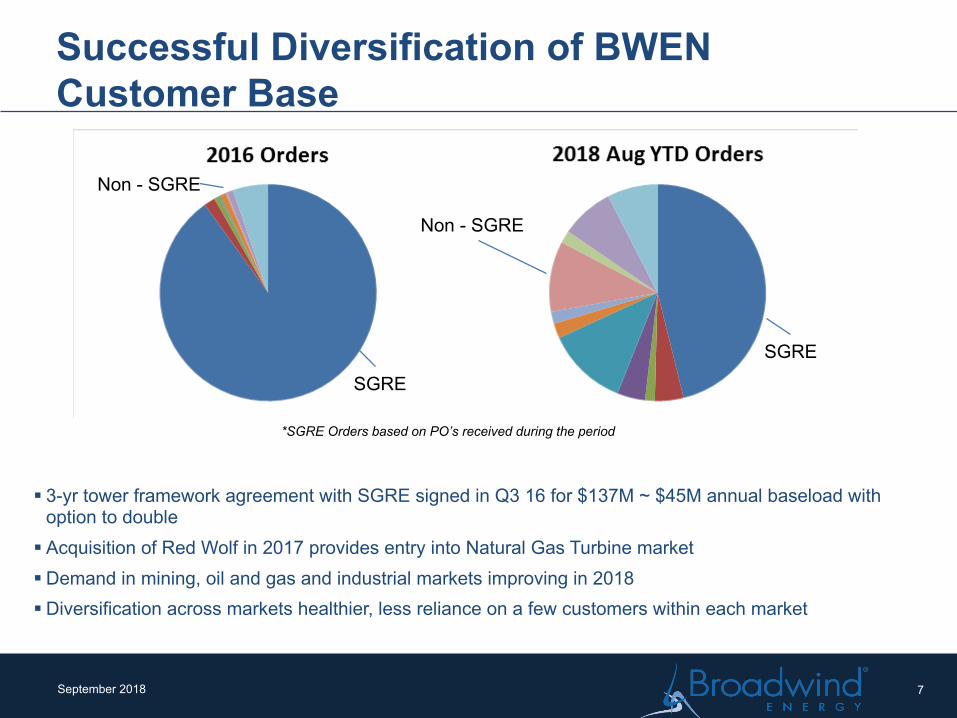
§ 3-yr tower framework agreement with SGRE signed in Q3 16 for $137M ~ $45M annual baseload with
option to double
§ Acquisition of Red Wolf in 2017 provides entry into Natural Gas Turbine market
§ Demand in mining, oil and gas and industrial markets improving in 2018
§ Diversification across markets healthier, less reliance on a few customers within each market
Successful Diversification of BWEN Customer Base
*SGRE Orders based on PO’s received during the period
SGRE
Non - SGRE
SGRE
Non - SGRE
7September 2018

Wind Energy is Becoming More Competitive with Conventional Power Generation
Forecast – GW InstallationsGlobal Onshore Wind Levelized Cost of Energy Over Time ($/MWh)
§ Cost of wind energy has declined more than 67% over the last 8 years
§ Wind energy becoming a formidable competitor with conventional power generation
§ Further cost reductions expected – taller towers, longer blades, improved capacity factors all contribute
Source: Lazard Levelized Cost of Energy Analysis (version 11)
8.0 8.2
6.4
8.4
11.0
13.0
6789
1011121314
2015a 2016a 2017a 2018e 2019e 2020e
GW
§ Slight shift of demand toward PTC-expiration year§ 2021 outlook strengthening with 80% PTC
qualifications of 10 GW§ Post-PTC uncertainty remains for 2022 and beyond
8September 2018

Tariff and Trade Uncertainties
§ Steel accounts for nearly half of material content of a wind turbine –tariff impacts steel plate but not imported towers
§ Fluctuating US vs Chinese steel prices influence tower sourcing for US OEM’s – depending on location of windfarm and shipping costs
§ Section 232 announcement has triggered domestic steel price spike of >50%
200300400500600700800900
10001100
Q1 17
Q2 17
Q3 17
Q4 17
Q1 18
Q2 18
Jul-1
8
Aug-1
8
Relative Steel Price $/ST *
US
China
Source: Platts
4.8
8.6 8.97.0
8.4
11.0
13.0
8.4 8.4
0
2
4
6
8
10
12
14
2014 2015 2016 2017 2018E 2019E 2020E
Tower Supply/Demand Balance
Demand (MAKE) Domestic Supply (MAKE)
§ Following weaker 2017, domestic tower production expected to be strong through 2020
§ US supply is 8.4 GW or ~3800 towers (includes 2017 capacity additions)
§ Imports provide additional supply especially in coastal areas
§ Import threat grows as steel differential widens
9September 2018

Towers and Heavy Fabrications§ Have produced >3000 multi-mw towers for
all major OEM’s in US: GE, Goldwind, Nordex, Siemens/Gamesa, Vestas
§ Recent $7M investment improves flow and expands capacity to 550 towers
§ Engineering experts partner with our customers to improve efficiencies and reduce costs
§ Tower production recovering in 2018 following order pause in 2H 2017
$M 2014 2015 2016 2017 1H 18Tower Sections Sold (units) 1,369 1,350 1,439 820 344
Revenue $184.9 $170.9 $160.2 $103.4 $40.8
OI 18.1 4.7 12.8 2.7 (.8)
EBITDA 22.3 9.5 17.2 7.8 2.1
10September 2018

Towers and Heavy Fabrications§ Leverage existing footprint and labor at our Tower manufacturing facilities in TX and WI
§ Strategic investments made in flexible manufacturing cells and a large horizontal milling machine
§ Strong welding capabilities developed in Tower business leveraged in adjacent markets
Heavy Fabrications Overview
Mining / Construction
Buckets, shovels, car bodies, assemblies, drill masts, crane
components
Infrastructure / O&G Industrial / Other
Sand separator, pressure vessels, asphalt/concrete
equipment
Shipbuilding fabrications, data center modular frames, Flag/Sign
poles, Medical components
11September 2018

Broadwind: Geared For Industry
Wind
O&G
Mining
General Industrial
Sales By Industry 2014-2017
§ Underground and surface mining§ Cone crushers, drive shafts, cab
rotation, crawler shafts
§ Replacement gears and gear boxes in steel processing plants
§ Waste Processing§ Paper Industry
§ On and offshore drilling§ Frack and mud pumps
§ Replacement Gearing - Wind§ Gearbox repair - Wind
12September 2018

Cost Management and Continuous Improvement Culture Leading to Operational Turnaround in Gearing
§ Custom precision gear manufacturing with state of the art machinery§ Operational turnaround evident – focus on cost management and continuous improvement,
plant lay out reconfigured to boost productivity§ Plant capacity in place to support >$50M annual production rate§ 2018 focus:
Ø Optimize production flow through plantsØ Continue diversification of customer baseØ Achieve consistent operating patternØ Generate positive operating income
$M 2014 2015 2016 2017 1H 18
Orders $41.9 $24.9 $14.2 $36.9 $21.5
Revenue 42.3 29.6 20.6 26.0 17.4
OI (9.4) (8.2) (3.2) (2.6) (1.3)
EBITDA (0.9) (2.1) (0.6) - -
Gearing Financials
13September 2018

Process SystemsQ2
2017Q2
20181H
20171H
2018
Orders ($M) $4.4 $3.0 $8.1 $7.9
Revenue ($M) 3.0 4.1 6.3 8.5
Operating (Loss) ($M)
(1.1) (5.8) (1.9) (6.7)
EBITDA* ($M) (.6) (.2) (1.1) (.5)
* Reconciliation to non-GAAP measure included in Appendix
Q2 Results§ Process Systems includes Abilene-based CNG
and fabrications, and Red Wolf as of Feb 1, 2017
§ Operating loss worse due mainly to $5.0M goodwill impairment charge
§ Continuing restructuring plan for Abilene fabrications facility and exit of CNG business
2018 Objectives§Progress Red Wolf customer diversification§Expand share with existing customers§Exit CNG
14September 2018

BWEN Consolidated Financial Results
§ Q2 18 sales down from Q2 17 but up 23% sequentially –tower production recovering and continued strength in Gearing and Heavy Fabrications
§ Operating loss for Q2 18 due primarily to low tower volume and $5.0 non-cash goodwill impairment charge
§ Return to positive EBITDA - $2.1M in Q2 18 – Tower segment recovering, improved productivity and reduced costs
Q2 17 Q1 18 Q2 18 1H 17 1H 18Total Sales $43.4 $30.0 $36.8 $99.4 $66.7Gross Profit 3.9 (.1) 2.2 10.2 2.1Gross Profit % 8.9% (.4%) 6.0% 10.3% 3.1%
Operating Expense 4.4 4.4 8.0 9.2 12.4Operating Income/(Loss) (.5) (4.5) (5.7) 1.1 (10.3)
% of sales (1.2%) (15.1%) (15.6%) 1.1% (15.4%)
Adj. EBITDA 2.0 (1.6) 2.1 5.9 .5% of sales 4.5% (5.3%) 5.8% 5.9% 0.8%
EPS, Continuing (.05) (.32) (.40) .39 (.71)$M except as noted otherwise
15September 2018

Operating Working Capital (OWC)
§ Reduction in AR past dues since year end§ Inventory turns improving because of elevated production levels§ Advance deposits expanding with addition of new customers
*Operating Working Capital = Trade A/R + Inventories – Trade Payables – Customer Deposits
12/31/17 3/31/18 6/30/18
DSO 70 48 44
Inv. Turns 5.0 5.4 6.7
DPO 44 42 41
Cash Conv. (days)
48 44 36
OWC $M 11.4 14.3 14.3
OWC* Historical Trend – cents/$ salesOWC* Management
$(0.05)
$-
$0.05
$0.10
$0.15
$0.20
Q2 2014Q4 2014
Q2 2015Q4 2015
Q2 2016Q4 2016
Q2 2017Q4 2017
Q2 2018
16September 2018

Balance Sheet and Capital Expenditures
$1.6
$6.2$6.6
2015 2016 2017 2018e2015 2016 2017 2018e
1.5-2.5%
Capital Expenditures (net)
§ Cash receipts applied reduce to balance on credit line – minimize interest expense§ $25M credit line had $10M of additional availability at quarter-end§ Capital expenditures minimal in 2018– Abilene tower facility expansion complete in
2017§ $2.6M New Markets Tax Credit debt forgiven in July ‘18
% of sales
0.8%
3.4% 4.5%12/31/2017 3/31/2018 6/30/2018
Cash Assets 0.1$ -$ 0.1$ Accounts Receivable 13.6 15.9 17.9 Inventory 19.3 22.3 20.7 PPE 55.7 53.7 52.3 Other 23.7 23.3 17.7 Total Assets 112.4 115.2 108.7 Accounts Payable 11.8 13.9 15.7 Customer Deposits 9.8 10.0 8.7 Debt + Cap Leases 16.8 21.2 21.3 Other 8.0 8.4 7.0 Total Liabilities 46.4 53.5 52.7
Equity 66.0 61.7 56.0
(In Millions)
17September 2018

AppendixConsolidated
2018 2017 2018 2017Net (Loss)/Income from continuing operations……………………………. (6,083)$ (688)$ (10,894)$ 5,794$ Interest Expense………………………………………………. 352 217 650 356 Income Tax Provision/(Benefit)……………………………… (6) (16) (33) (5,034) Depreciation and Amortization………………………………………………………………2,349 2,203 4,706 4,304 Share-based Compensation and Other Stock Payments………………………………………………………………418 241 846 462 Restructuring Costs…………………………………………. 116 - 267 - Impairment Charges…………………………………………………. 4,993 - 4,993 -
Adjusted EBITDA (Non-GAAP)…………………………. 2,139$ 1,957$ 535$ 5,882$
Three Months Ended June 30, Six Months Ended June 30,
Towers and Heavy Fabrications Segment2018 2017 2018 2017
Net (Loss)/Income…………………………………………. 629$ 2,024$ (486)$ 6028Interest Expense/(Benefit)…………………………………. 49 20 80 35Income Tax (Benefit)/Provision……………………………… 46 772 (373) 2603Depreciation and Amortization………………………………………………………………1,280 1,070 2,535 2162Share-based Compensation and Other Stock Payments………………………………………………………………169 58 312 115 Adjusted EBITDA (Non-GAAP)…………………………….. 2,173$ 3,944$ 2,068$ 10,943$
Three Months Ended June 30, Six Months Ended June 30,
Gearing Segment
2018 2017 2018 2017
Net Income/(Loss)…………...……………………………. (662)$ (638)$ (1,293)$ (2,175)$ Interest Expense…………………………………………… 2 2 5 6 Income Tax Provision/(Benefit)……………………………… (3) 2 - 4 Depreciation and Amortization………………………………………………………………586 612 1,176 1,238 Share-based Compensation and Other Stock Payments………………………………………………………………77 23 143 41 Adjusted EBITDA (Non-GAAP)……………………….. -$ 1$ 31$ (886)$
Three Months Ended June 30, Six Months Ended June 30,
18September 2018
Appendix
Process Systems
2018 2017 2018 2017
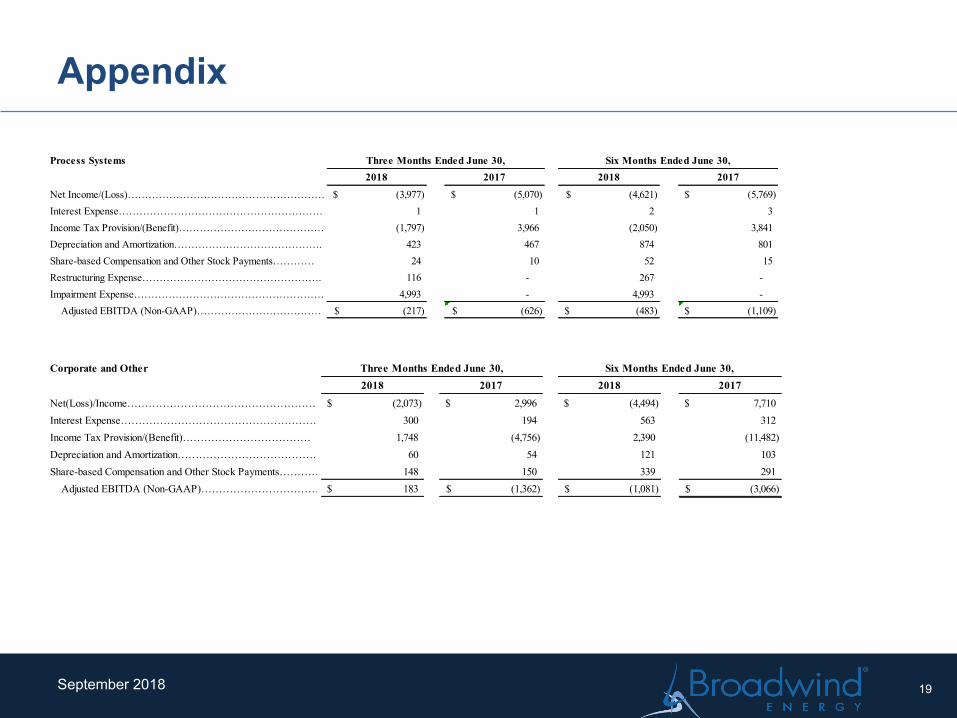
Net Income/(Loss)………………………………………………… (3,977)$ (5,070)$ (4,621)$ (5,769)$ Interest Expense……………………………………………………. 1 1 2 3 Income Tax Provision/(Benefit)…………………………………… (1,797) 3,966 (2,050) 3,841 Depreciation and Amortization……………………………………. 423 467 874 801 Share-based Compensation and Other Stock Payments………… 24 10 52 15 Restructuring Expense……………………………………………. 116 - 267 - Impairment Expense………………………………………………… 4,993 - 4,993 - Adjusted EBITDA (Non-GAAP)……………………………… (217)$ (626)$ (483)$ (1,109)$
Three Months Ended June 30, Six Months Ended June 30,
Corporate and Other2018 2017 2018 2017
Net(Loss)/Income………………………………………………….. (2,073)$ 2,996$ (4,494)$ 7,710$ Interest Expense………………………………………………… 300 194 563 312 Income Tax Provision/(Benefit)……………………………… 1,748 (4,756) 2,390 (11,482) Depreciation and Amortization………………………………………………………………60 54 121 103 Share-based Compensation and Other Stock Payments………………………………………………………………148 150 339 291 Adjusted EBITDA (Non-GAAP)……………………………. 183$ (1,362)$ (1,081)$ (3,066)$
Three Months Ended June 30, Six Months Ended June 30,
19September 2018

Broadwind Energy is a precision manufacturer of structures, equipment & components for clean tech and other specialized applications.
www.BWEN.com
20September 2018