Embed Size (px)
Citation preview

LINKING, VALIDATING, AND PREDICTING TOEFL® IBT SCORES AT ADVANCED PROFICIENCY EIKEN LEVELS 1
Upper-level EIKEN Examinations: Linking, Validating, and Predicting TOEFL® iBT Scores
at Advanced Proficiency EIKEN Levels
James Dean Brown, John McE. Davis, and Chika Takahashi
University of Hawai‘i at Mānoa
Keita Nakamura
Society for Testing English Proficiency
James Dean Brown, Department of Second Language Studies, University of Hawai‘i at
Mānoa; John McE. Davis, Department of Second Language Studies, University of Hawai‘i at
Mānoa; Chika Takahashi, Department of Second Language Studies, University of Hawai‘i at
Mānoa; Keita Nakamura, Society for Testing English Proficiency (STEP), Tokyo, Japan
Correspondence concerning this article should be addressed to James Dean Brown,
Department of Second Language Studies, University of Hawai’i at Manoa, Honolulu, HI
96822. E-mail: [email protected]
_____________________________________________________________________________________________________
©2012 Eiken Foundation of Japan
This document may not be republished in any form, in whole or in part, without the express written consent of the Eiken Foundation of Japan.
TOEFL® is a registered trademark of Educational Testing Service (ETS), Inc. This document is not endorsed or approved by ETS.

LINKING, VALIDATING, AND PREDICTING TOEFL IBT SCORES AT ADVANCED PROFICIENCY EIKEN LEVELS 2
©2012 Eiken Foundation of Japan
Executive Summary
This study was supported by the Society for Testing English Proficiency (STEP) to
examine how scores on the upper-level EIKEN examinations might better be linked,
validated, and used to predict the Test of English as a Foreign Language (TOEFL) Internet-
based Test (iBT) scores, which are widely accepted for admissions purposes in English-
speaking countries.
The report consists of the following sections. After an overview of the literature on both
the TOEFL test and the EIKEN tests, the purpose, methods, and materials used in the study
are described. The Materials section includes a description of the content of the EIKEN tests.
The methodology involved administering a number of retired EIKEN test forms to
participants in an experimental test administration organized for the purposes of this study.
Item response theory was used to link grades 1, Pre-1, and 2 of the EIKEN tests to a single
scale of scores common across these forms in order to demonstrate the concurrent criterion-
related and construct validity of those same forms and to predict TOEFL iBT scores from the
common scores derived from such a single scale. The results section details the statistical
results from the main quantitative analyses carried out, including Rasch analyses, means
comparisons, correlational analyses, principal components analyses, and regression analyses.
A detailed discussion of how to interpret the results in light of the main research questions is
provided in the Discussion section.
The main results can be summarized as follows. The trends seen in the results of the
quantitative analyses tend to support the previous EIKEN estimates of TOEFL scores that
would be obtained by EIKEN certificate holders. The study has also provided additional
evidence in support of arguments for the concurrent criterion-related and construct validity of
the EIKEN grade-level test scores. The criterion-related validity evidence is implicit in the
correlations found between various combinations of the EIKEN subtests and the subtest as
well as total TOEFL iBT scores. Convergent/discriminant validity was supported by a two-
principle-component analysis solution for the common-scale scores for all subtests of the
EIKEN and TOEFL iBT. This analysis showed a pattern of loadings indicating that the two
test batteries are measuring in similar ways. The study also provides a small-scale
demonstration of techniques that STEP could use in the future to equate its grade-level tests
to an EIKEN common scale. The limitations of the study and suggestions for further research
are discussed in the Conclusions section.

LINKING, VALIDATING, AND PREDICTING TOEFL IBT SCORES AT ADVANCED PROFICIENCY EIKEN LEVELS 3
©2012 Eiken Foundation of Japan
Introduction
The EIKEN English examinations are accepted for admissions requirements in five
countries other than Japan: the United States, Canada, New Zealand, the United Kingdom,
and Australia. In the U.S., the EIKEN is recognized in 42 states at 322 colleges, universities,
and other institutes. In Hawai‘i, the EIKEN is accepted at four schools: Brigham Young
University Hawai‘i, Hawai‘i Tokai International College, Kapi‘olani Community College,
and the University of Hawai‘i at Hilo. An additional 184 schools recognize the EIKEN in
Canada, New Zealand, the U.K., and Australia (STEP, 2010a).
As part of an effort to increase the acceptability of the EIKEN tests for admissions to
institutions around the world, this study was supported by STEP to examine how scores on
the upper-level EIKEN examinations might better be linked, validated, and used to predict
the Test of English as a Foreign Language (TOEFL) Internet-based Test (iBT) scores, which
are widely accepted for admissions purposes in some English-speaking countries. In order to
provide background for this study, we will begin by examining existing studies that have
focused on the TOEFL test and academic success, as well as studies on using EIKEN test
scores to predict TOEFL scores. Let’s turn first to the literature on the TOEFL test and
academic success.
Studies on TOEFL and Academic Success
Because one important variable in this study is the TOEFL test, we will begin by
examining what scores on the TOEFL test may represent. A number of studies have
investigated the predictive validity of TOEFL scores with respect to academic success (e.g.,
Al-Musawi & Al-Ansari, 1999; Ayers & Quattlebaum, 1992; Johnson, 1988; Krausz, Schiff,
Schiff, & Van Hise, 2005; Light, Xu, & Mossop, 1987; Neal, 1998; Nelson, Nelson, &
Malone, 2004; Stoynoff, 1997; Vinke & Jochems, 1993; Wimberley, McCloud, & Flinn,
1992). However, findings do not form a clear picture of the degree to which TOEFL scores
accurately predict academic achievement. The inconsistency in these findings seems to be
related to (a) problems with operationalizing the academic success variable; (b) confusion
with regard to what TOEFL test aims to measure; and (c) moderating variables such as
environmental factors.
In order to investigate the predictive validity of the TOEFL test, researchers have mainly
looked for correlations between TOEFL scores and grade point average (GPA). However, no
clear and consistent relationship has surfaced between these two variables. Correlations have

LINKING, VALIDATING, AND PREDICTING TOEFL IBT SCORES AT ADVANCED PROFICIENCY EIKEN LEVELS 4
©2012 Eiken Foundation of Japan
been found to be both significant and non-significant, and have shown only modest
relationships at best: the maximum effect size of the studies reviewed by Al-Musawi and Al-
Ansari (1999) was r = .50, which turns out to represent only a 25% overlap in the variance of
TOEFL scores and GPA (r2 = .502 = .25). One reason for these unimpressive and mixed
results may be the fact that GPAs were reported at different stages of students’ careers: some
were reported after the first semester, while others were final GPAs at graduation.
Another reason for such mixed findings may result from misunderstandings of what the
TOEFL test is actually designed to measure. According to the Educational Testing Service
(ETS), the TOEFL test “measures your ability to communicate in English in colleges and
universities” (ETS, 2010). Nonetheless, some researchers insist on studying the predictive
validity of the TOEFL test as a measure of future academic success. For example, Simner
(1999) argues that the real purpose of having the TOEFL test as an admission criterion is “not
to determine how well a student performs in English at the time the TOEFL is taken, but
instead to determine how well the student is likely to perform in the future” (Simner, 1999, p.
287, emphasis in the original). Thus, one explanation for the mixed results seems to be that
some researchers have wrongly taken the TOEFL test to be a predictor of academic success
when it is actually (or at least designed to be) only a measure of overall English-language
proficiency (cf. Chalhoub-Deville & Turner, 2000).
Another difficulty in using the TOEFL test to predict success derives from trying to
determine students’ long-term academic achievement using a proficiency measure taken at
the start of their studies. Many other important factors impact students during their academic
careers. For example, a student’s major, and whether a student comes to university alone or
with their family, have been found to play an important role in ultimate academic
achievement (Wimberley et al., 1992). Again, the TOEFL test and other proficiency measures
provide, at best, an estimate of one’s English proficiency, which is “only one among many
factors that affect academic success” (Graham, 1987, p. 515). See Table 1 for a summary of
the studies on the TOEFL test and academic success.

LINKING, VALIDATING, AND PREDICTING TOEFL® IBT SCORES AT ADVANCED PROFICIENCY EIKEN LEVELS 5
Table 1 Summary of Studies on the TOEFL Test and Academic Success Study authors (date)
Participants Independent variable Dependent variable
Major findings
Light, Xu, & Mossop (1987)
376 international grad students
TOEFL GPA from first semester, credits earned during first semester (moderator V: major)
• Significant correlation between TOEFL & GPA (r=.14) • Significant correlation between TOEFL scores & grad credits earned (r=.19)
Johnson (1988) 196 international undergrad students enrolled during spring 1986
TOEFL GPA Undergrad credit hours earned
• Significant correlation between TOEFL & GPA (r=.36) • Significant correlation between credit hours earned (r=.80) • Students (n=68) w/ TOEFL scores below 500 earned significantly lower grades than students (n=128) w/ TOEFL scores of 500+
Ayers & Quattlebaum (1992)
67 Asian MS students (engineering)
TOEFL, GRE Final GPA • No significant correlation between TOEFL and GPA (r=.05)• Significant correlation between TOEFL and GRE (verbal: r=.63, quant.: r=.3, anal.: r=.35)
Wimberley, McCloud, & Flinn (1992)
121 Indonesian grad students between 1969 and1983
TOEFL, undergrad GPA, semester of English at Indonesian univ., presence of dependents, total number of dependents
U.S. grad GPA, degree completion
• Undergrad GPA and TOEFL positively related to grad GPA • Presence of the student’s family in the U.S. positively affects both indications of success (p. 507)
Vinke & Jochems (1993)
90 Indonesian students (engineers) in the Netherlands (medium of instruction: English)
TOEFL, age Academic success as measured by initial written exam scores (Initial Exam Score Average, IESA)
• TOEFL and IESA: significant correlation (r=.51) • Age and IESA: significant correlation (r= -.42) • There is a range of TOEFL scores within which a better command of English increases the chance of academic success to a certain extent, and within which a limited lack of English proficiency can be offset by greater student effort/greater academic abilities
Jochems, Snippe, Smid & Verweij (1996)
• Critical of considering the TOEFL test as a predictor of academic success • “[The TOEFL] does not measure all possible aspects of proficiency in a foreign language”
Stoynoff, S. (1997)
77 freshman international students, fall 1989
TOEFL, learning and study strategies
GPA, credits earned, number of withdrawals
• Significant correlation between TOEFL and GPA (r=.26, rc=.39) • Significant correlation between TOEFL and credits earned (r=.23, rc=34)

LINKING, VALIDATING, AND PREDICTING TOEFL IBT SCORES AT ADVANCED PROFICIENCY EIKEN LEVELS 6
©2012 Eiken Foundation of Japan
Neal (1998) 47 Indian and Chinese grad students who completed MS (science/engineering) between 1994 and 1995; 1997 and 1998
TOEFL, GRE Grad GPA (final), i.e., GGPA
• No significant correlations between TOEFL (total or sub scores) and GGPA • For TOEFL total scores and GGPA ( r= -.141) • Significant correlation between GRE-quantitative and GGPA (r=.328), and between GRE-analytical and GGPA (r=.338)
Al-Musawi & Al-Ansari (1999)
86 students at Univ. of Bahrain in English Lang. and Lit. degree program
TOEFL, First Certificate of English (FCE)
GPA • TOEFL and GPA: r=.5 (statistical significance?) • TOEFL did not add as much to the model as did the scores on the cloze and sentence-transformation sections of the FCE exam
Simner (1999) • “…presumably, the major purpose of using the TOEFL as an admissions screening device is not to determine how well a student performs in English at the time the TOEFL is taken, but instead to determine how well the student is likely to perform in the future, which typically means some 8–10 months later after the student has arrived on campus and is immersed in an English-speaking environment” (p. 287, emphasis in original)
Chalhoub-Deville & Turner (2000)
• Provides summary of TOEFL-CBT developments • “The purpose of TOEFL is to measure the English proficiency of non-native speakers who intend to study in institutions of higher learning in the USA and Canada” (p. 533)
Nelson, Nelson, & Malone (2004)
866 international students at a Midwestern univ. from 1987 to 2002
TOEFL, age, gender, geographic categories of native country, grad. major, admission status, GPA from first 9 hours of grad study
Completion of the degree, grad. GPA (final)
Logistic regression • TOEFL is not a good predictor of international student completing master’s degree • TOEFL combined with other factors may serve as academic performance predictor
Krausz, Schiff, Schiff, & Van Hise (2005)
54 international MBA students enrolled between spring 2000 and fall 2001
TOEFL, GMAT, previous accounting coursework, previous accounting work experience
Final grade in the initial required graduate course in financial accounting
• No significant correlation between TOEFL and grade in graduate accounting course • GMAT is a better predictor for grades than TOEFL
Woodrow (2006)
• Mainly regarding IELTS • No significant relationship between the TOEFL & GPA BUT n=10
Mathews (2007) • Critical of considering the TOEFL test as an English proficiency measure

LINKING, VALIDATING, AND PREDICTING TOEFL IBT SCORES AT ADVANCED PROFICIENCY EIKEN LEVELS 5
©2012 Eiken Foundation of Japan
Studies on the EIKEN Exams
Some authors have complained that relatively little information is available on the EIKEN
examinations (Gorsuch, 1995; McGregor, 1995a, 1995b; Miura & Beglar, 2002). On the
contrary, we have found that a good deal of research has been produced on the EIKEN tests,
especially in recent years. This research can be classified into at least five categories: (a)
investigations into test reliability and validity (e.g., MacGregor, 1997, 1998; Henry, 1998;
Nielsen, 2000; Dunlea, 2009, 2010); (b) discussions of the EIKEN within the Action Plan set
by the Japanese Ministry of Education, Culture, Sports, Science and Technology (MEXT;
language policy implemented to help foster “Japanese with English abilities”) (e.g., Erikawa,
2005; Okuno, 2007); (c) descriptions of EIKEN administration in various Japanese high
schools, junior colleges, and universities (e.g., Tsuda & Koga, 1990; Shimatani, 2007; STEP,
2010b); (d) analyses of EIKEN test content (e.g., Hamaoka, 1997; Nagashima, 2001;
Dederick, Ban, & Oyabu, 2002); and (e) equating of EIKEN scores to other norm-referenced
English proficiency tests and training materials (e.g., the TOEFL and TOEIC tests) (i.e.,
Nagashima, 2001; Ishida, 2004; Clark & Zhang, no date; Hill, 2010). Clearly, then, a great
deal of research has been produced over the years about the EIKEN examinations (for even
more information, see http://stepeiken.org/research in English and the STEP Bulletin
available in Japanese at http://www.eiken.or.jp/teacher/research/list.html). The last studies
mentioned above—those equating EIKEN scores to other norm-referenced proficiency
tests—are the most directly related to the purpose and results of the present study. So the
focus in this literature review will turn to reviewing those four studies in a fair amount of
detail.
Equating EIKEN scores to other norm-referenced English proficiency tests. This
research involves finding equivalencies between the EIKEN and other norm-referenced
English proficiency tests, particularly the TOEFL and/or TOEIC exams. For example,
Nagashima (2001) analyzed the vocabulary sections from various EIKEN and TOEIC
preparation books and estimated that passing the EIKEN Grade Pre-2 would be about the
equivalent of a 450 TOEIC score, and Grade 2 would be the equivalent of a 500.
In another study, Ishida (2004) compared EIKEN and TOEFL/TOEIC test scores, and
analyzed vocabulary levels and thematic content on all three tests. TOEFL and TOEIC scores
were collected from 58 English teachers who had passed the EIKEN Grade Pre-1 exams in
the previous five years. Ishida analyzed distributions of participants’ TOEFL and TOEIC
scores and concluded that since 82.76% of the participants had TOEFL scores over 500 and

LINKING, VALIDATING, AND PREDICTING TOEFL IBT SCORES AT ADVANCED PROFICIENCY EIKEN LEVELS 6
©2012 Eiken Foundation of Japan
TOEIC scores over 700, the equivalent of EIKEN Grade Pre-1 was a score of at least 500 on
the TOEFL test and 700 on the TOEIC (Ishida, 2004, p. 12). Second, the researcher analyzed
the vocabulary levels of each test and argued that the vocabulary levels were about the same
for the EIKEN Grade Pre-1 exams and the TOEIC test (Ishida, 2004, p. 13). Third, by
categorizing test topics into “society-related,” “school-related,” and “business-related,” the
researcher found that the majority of the topics covered by the EIKEN Grade Pre-1 exams
were “society-related.” Compared to the TOEIC test (which covered “business-related”
topics) and the TOEFL test (which covered “school-related” topics), Ishida argued that the
EIKEN examinations targeted examinees from a broad range of backgrounds and ages (Ishida,
2004, p. 14).
Although these studies are useful, such research would have been more helpful if the
researchers had (a) analyzed all the sections of the EIKEN exams and (b) used a more
systematic way of comparing the examinations in order to produce more generalizable results.
One study that did more systematically compare the EIKEN exams and the TOEFL test is
Clark and Zhang (no date). By administering both the EIKEN examinations and the
Institutional TOEFL test to participants at community colleges in Hawai‘i, the researchers
reached three conclusions. First, a logistic regression analysis showed that a student passing
the EIKEN Grade 2 exam would have a 95% probability of getting a TOEFL score of 400 or
better. Second, the logistic regression analysis also indicated that a student passing the
EIKEN Grade Pre-1 Exam should have a 97% probability of getting a TOEFL score of 500 or
above. Third, compared to the TOEFL test, the EIKEN exams cover a wider range of
topics—not only academic situations, but also other topic areas such as business situations.
However, the researchers argued that none of the language on the EIKEN test could be
considered particularly specialized in nature (Clark & Zhang, no date, pp. 28–30). Thus, they
further suggested that the EIKEN exams should be considered as an alternative test (in
addition to the TOEFL test) to be used for purposes of making admissions decisions,
especially given that such a policy would enhance the accessibility of higher education
programs to Japanese students (Clark & Zhang, no date, p. 1).
Another study that systematically compared the EIKEN exams with the TOEFL test is
Hill (2010), which investigated the validity of using the EIKEN examinations as English-
language proficiency tests for admissions to an American community college. This
utilization-focused evaluation study used both quantitative and qualitative research methods
in a mixed-methods design to investigate the quality of the EIKEN tests, the relationships of

LINKING, VALIDATING, AND PREDICTING TOEFL IBT SCORES AT ADVANCED PROFICIENCY EIKEN LEVELS 7
©2012 Eiken Foundation of Japan
the EIKEN tests to the TOEFL paper-and-pencil test, and differences/similarities in linguistic
ability, academic performance, or experiences between students admitted with the EIKEN
test and the TOEFL test. The findings indicate that the EIKEN test “was acceptable for the
college’s admission purposes” (p. vi) and that students admitted based on the EIKEN test
were shown to be as able in terms of using academic strategies and having positive personal
traits as the other international students whose admissions were based on the TOEFL test
(Hill, 2010, p. 209). See Table 2 for a summary of studies comparing the EIKEN tests with
other norm-referenced English proficiency tests.
Table 2 Summary of Studies Comparing the EIKEN Tests with Other Norm-referenced English Proficiency Tests Research design,
variables Major findings Notes
Nagashima (2001)
Vocab analysis of EIKEN prep books, textbooks, and TOEIC prep books
• EIKEN works as a motivator (p. 185)• Pre-2 level=TOEIC score of 450 • Level 2=TOEIC score of 500 • Pre-1=TOEIC score of 650? (all analysis of university admissions criteria) • Vocab that the researcher considers to be necessary for passing Grade Pre-2 and TOEIC: 59.2% shared (p. 188)
Only vocab analysis
Ishida (2004) 58 English teachers in the Kanto area who had passed EIKEN Grade Pre-1 in the previous five years
• EIKEN Grade Pre-1= at least TOEFL score 500 and TOEIC score 700 • Vocab level: EIKEN Grade Pre-2=TOEIC • EIKEN target population: broader than TOEFL and TOEIC
Clark & Zhang (no date)
• Compare the EIKEN exams and the TOEFL test • Participants: community college students in Hawai’i
• EIKEN Grade 2=TOEFL 400+ • EIKEN Grade Pre-1=TOEFL 500+ • Topics: broader for the EIKEN than for TOEFL • EIKEN could possibly serve as an alternative to TOEFL for admission purposes
Hill (2010) • Study differences and similarities in linguistic ability, academic performance, or experience between students admitted with the EIKEN and TOEFL tests • Participants: community-college students
• EIKEN test generally found to be acceptable for admissions to community college • Students admitted with the EIKEN test were equal to or better in academic strategies and positive personal traits to those admitted with the TOEFL test
Utilization-focused evaluation that used both quantitative and qualitative methods in a mixed methods design

LINKING, VALIDATING, AND PREDICTING TOEFL IBT SCORES AT ADVANCED PROFICIENCY EIKEN LEVELS 8
©2012 Eiken Foundation of Japan
Purpose
One persistent problem that has hampered previous efforts to equate EIKEN test scores
with those on the TOEFL (and other large-scale proficiency tests as well) has been the fact
that there are basically seven level tests, each of which students must pass before moving on
to the next level. Each test is independent of the others, so passing or failing the seven
EIKEN tests effectively forms a seven-level nominal scale. This explains why Clark and
Zhang (no date) chose to use logistic regression rather than ordinary linear regression. The
lead author of the present study realized early on that using Rasch analysis to link the EIKEN
tests and create a common logit scoring scale across EIKEN grade levels tests would make
the job of equating the new common-scale scores (which would in all senses be an interval
scale) to any other interval scale (e.g., TOEFL or TOEIC scores) relatively easy using simple
linear regression analyses.
The purposes of the current study, then, as stated in the original proposal for the STEP
Research Grant supporting this investigation, were: (a) to use item response theory to link
grades 1, Pre-1, and 2 to a single scale of scores common across these forms; (b) to
demonstrate the concurrent criterion-related and construct validity of those same forms; and
(c) to predict TOEFL iBT scores from the common scores [see (a) above] and from level-test
raw scores. In these respects, this study is different from all previous studies of the EIKEN
tests.
To those ends, the following research questions were posed:
1. What steps and procedures can effectively be used in item-response theory to link
Grade 1, Pre-1, and 2 test scores to a single scale of scores common across these
forms? [Note that this part of the study is essentially a small-scale demonstration of
techniques that STEP might use in the future to equate its grade-level tests to an
EIKEN common scale, and to do so operationally and on a permanent basis. Thus
STEP would be able to report a passing grade to each examinee on each grade-level
test as well as their EIKEN common-scale score.]
2. What arguments can be made for the concurrent criterion-related and construct
validity of the EIKEN grade-level tests being examined here?
3. What EIKEN common-scale scores are equivalent to what TOEFL iBT scores? And
how do those EIKEN common-scale scores relate to raw scores and percent cut-point
scores on each of the grade-level tests?

LINKING, VALIDATING, AND PREDICTING TOEFL IBT SCORES AT ADVANCED PROFICIENCY EIKEN LEVELS 9
©2012 Eiken Foundation of Japan
Methods
Participants
A total of 123 participants took part in this study. Thirty-five participants were male
(28.5%), and 88 were female (71.5%). Their ages ranged from 18 to 39 years with a mean
age of 25.52 (SD = 4.73). At the time of the study, 29 participants were enrolled in BA/BS
programs, 62 in MA/MS programs, 23 in PhD programs, and 9 in certificate programs.
Participants’ first languages were Chinese (e.g., “Chinese,” “Mandarin,” “Cantonese,” n = 45,
or 36.6%), Japanese (n = 32, or 26.0%), Korean (n = 21, or 17.1%), and Indonesian, (n = 6, or
4.9%). The remaining 19 participants (15.4%) spoke various other languages (see Table 3).
Table 3 Participants’ First Languages
Language % (n)
Chinese 36.6% (45)
Japanese 26% (32)
Korean 17.1% (21)
Indonesian 4.9% (6)
Other 15.4% (19) The mean length of time participants had received formal English instruction was 9.93
years (SD = 4.47). The minimum number of years of instruction was one year, and the
maximum was 25 years. The mean length of time participants had resided in English-
speaking countries was 1.56 years (SD = 2.20). The minimum was three weeks, and the
maximum was 14 years and eight months. As shown in Table 4, the majority of participants
had lived in the U.S. at least once (n = 102, or 97.5%), with seven participants living in the
U.S. twice (only three participants had not lived in the U.S.). Participants had also resided in
Canada (n = 5, or 4.1%), Australia (n = 3, or 2.4%), the U.K., (n = 2, or 1.6%), India (n = 2,
or 1.6%), New Zealand (n = 2, or 1.6%), and South Africa (n = 1, or 0.8%). Six participants
(4.1%) either neglected to mention a country or listed a country in which English is not the
official language (see Table 3). Participants’ TOEFL iBT scores ranged from 47 (lowest) to
119 (highest), with a mean of 86.41 (SD = 15.85).

LINKING, VALIDATING, AND PREDICTING TOEFL IBT SCORES AT ADVANCED PROFICIENCY EIKEN LEVELS 10
©2012 Eiken Foundation of Japan
Table 4 English-speaking Countries in Which Participants Resided
Countrya % (n)
United States 97.5% (102)
Canada 4.1% (5)
Australia 2.4% (3)
Great Britain 1.6% (2)
India 1.6% (2)
New Zealand 1.6% (2)
South Africa .08% (1) a Six respondents (4.1%) did not indicate a country or indicated a non-English-speaking country. Materials
The materials of focus in this project were retired versions of the EIKEN tests from
October and November of 2007. The EIKEN testing framework consists of seven separate
pass/fail tests, each targeting a different level of ability. Each level of the framework is called
a “grade”; the framework starts at Grade 5 (the lowest proficiency level) and progresses up to
Grade 1 (the highest). From the lowest to the highest, the tests include the following seven
different levels: Grade 5, Grade 4, Grade 3, Grade Pre-2, Grade 2, Grade Pre-1, and Grade 1.
The exams used in the present study were at the upper proficiency levels: Grade Pre-2, Grade
2, Grade Pre-1, and Grade 1.
The three upper-level EIKEN exams (Grade 1, Grade Pre-1, and Grade 2) are divided into
reading, listening, writing, and speaking sub-sections. The reading, listening, and writing
sections are administered as one combined test called the “first stage.” Only test takers who
pass the first-stage test may progress to the second-stage speaking tests, which are
administered approximately one month after the first-stage tests. Test takers must pass both
stages in order to achieve certification at the appropriate grade.
Table 5 shows the number of items in the reading, listening, writing, and speaking sub-
sections of each of the grade-level tests used in this project.

LINKING, VALIDATING, AND PREDICTING TOEFL IBT SCORES AT ADVANCED PROFICIENCY EIKEN LEVELS 11
©2012 Eiken Foundation of Japan
Table 5 Number of Items in Live Administrationa
a Grade Pre-2 exams were excluded from the analysis due to an insufficient number of participants.
The structure of each of these tests for the live administrations is shown on an item-by-
item basis in Table 6, along with the total possible weighted score points for each item. Table
6 is divided into first-stage and second-stage sections, as this reflects the operational practice
of live administrations as described above.
Table 6 Structures of the Grades 1, Pre-1, and 2 Tests Used in Live Administrations in Terms of Skills Tested and Total Possible Item Scores Grade 1 Grade Pre-1 Grade 2 No. Maximum possible points No. Maximum possible points No. Maximum possible points
First stage First stage First stage R 1 1 R 1 1 R 1 1 R 2 1 R 2 1 R 2 1 R 3 1 R 3 1 R 3 1 R 4 1 R 4 1 R 4 1 R 5 1 R 5 1 R 5 1 R 6 1 R 6 1 R 6 1 R 7 1 R 7 1 R 7 1 R 8 1 R 8 1 R 8 1 R 9 1 R 9 1 R 9 1 R 10 1 R 10 1 R 10 1 R 11 1 R 11 1 R 11 1 R 12 1 R 12 1 R 12 1 R 13 1 R 13 1 R 13 1 R 14 1 R 14 1 R 14 1 R 15 1 R 15 1 R 15 1 R 16 1 R 16 1 R 16 1 R 17 1 R 17 1 R 17 1 R 18 1 R 18 1 R 18 1 R 19 1 R 19 1 R 19 1 R 20 1 R 20 1 R 20 1 R 21 1 R 21 1 W 21 1 R 22 1 R 22 1 W 22 1 R 23 1 R 23 1 W 23 1 R 24 1 R 24 1 W 24 1 R 25 1 R 25 1 W 25 1
Reading Listening Writing Speaking Total test
Grade 1 41 27 1 4 73
Grade Pre-1 41 29 1 8 79
Grade 2 40 30 5 7 82

LINKING, VALIDATING, AND PREDICTING TOEFL IBT SCORES AT ADVANCED PROFICIENCY EIKEN LEVELS 12
©2012 Eiken Foundation of Japan
R 26 1 R 26 1 R 26 1 R 27 1 R 27 1 R 27 1 R 28 1 R 28 1 R 28 1 R 29 1 R 29 1 R 29 1 R 30 1 R 30 1 R 30 1 R 31 1 R 31 1 R 31 1 R 32 2 R 32 2 R 32 1 R 33 2 R 33 2 R 33 1 R 34 2 R 34 2 R 34 1 R 35 2 R 35 2 R 35 1 R 36 2 R 36 2 R 36 1 R 37 2 R 37 2 R 37 1 R 38 2 R 38 2 R 38 1 R 39 2 R 39 2 R 39 1 R 40 2 R 40 2 R 40 1 R 41 2 R 41 2 R 41 1 L 42 1 L 42 1 R 42 1 L 43 1 L 43 1 R 43 1 L 44 1 L 44 1 R 44 1 L 45 1 L 45 1 R 45 1 L 46 1 L 46 1 L 46 1 L 47 1 L 47 1 L 47 1 L 48 1 L 48 1 L 48 1 L 49 1 L 49 1 L 49 1 L 50 1 L 50 1 L 50 1 L 51 1 L 51 1 L 51 1 L 52 1 L 52 1 L 52 1 L 53 1 L 53 1 L 53 1 L 54 1 L 54 1 L 54 1 L 55 1 L 55 1 L 55 1 L 56 1 L 56 1 L 56 1 L 57 1 L 57 1 L 57 1 L 58 1 L 58 1 L 58 1 L 59 1 L 59 1 L 59 1 L 60 1 L 60 1 L 60 1 L 61 1 L 61 1 L 61 1 L 62 2 L 62 1 L 62 1 L 63 2 L 63 1 L 63 1 L 64 2 L 64 1 L 64 1 L 65 2 L 65 1 L 65 1 L 66 2 L 66 2 L 66 1 L 67 2 L 67 2 L 67 1 L 68 2 L 68 2 L 68 1 W 69 28 L 69 2 L 69 1
Second stage L 70 2 L 70 1 S 70 30 W 71 14 L 71 1 S 71 20 Second stage L 72 1 S 72 30 S 72 5 L 73 1 S 73 20 S 73 5 L 74 1 S 74 5 L 75 1 S 75 5 Second stage S 76 5 S 76 5 S 77 5 S 77 5 S 78 5 S 78 5 S 79 3 S 79 5 S 80 5 S 81 5 S 82 3

LINKING, VALIDATING, AND PREDICTING TOEFL IBT SCORES AT ADVANCED PROFICIENCY EIKEN LEVELS 13
©2012 Eiken Foundation of Japan
Table 7 shows how the item-level data were structured for the Winsteps™ data analysis
carried out for this project. Notice that for each item, Table 7 shows the item number, the
skill tested (R = reading; L = listening; W = writing; and S = speaking), the weights given
possible score assignments, and the number of points possible for the item. For example, for
Grade 1 item 1, the skill of reading is tested with a right-wrong coding of 1 or 0 and a total
possible score of 1 point. However, there are some important differences between tables 6
and 7 which reflect the way the item-level data have been coded for the Winsteps™ analysis
in this project. As understanding these differences will be important for interpreting the
Rasch analysis output in subsequent tables and figures, they will be explained briefly here.
The reasons for formatting the data analysis in this way will be described in more detail in the
Discussion section for Research Question 1.
The first important point to note is that the tests are not separated into first and second
stages. For logistical reasons, and to reduce the burden on participants, all sections of the tests,
including speaking tests, were administered on the same day. As it was not possible within
this time frame to score the first-stage reading, listening, and writing tests separately, and
then to administer the speaking tests only to those who had passed the first-stage tests, it was
decided to administer the speaking tests to all participants on the same day.
The second important difference is the number of items in the Grade 1 test. In Table 7
there are 78 items listed for Grade 1, compared to the 73 items listed in Table 6. For Grade 1,
two graders mark all writing tests, and two examiners score all speaking items. Examinees
thus receive two scores for each item—or, for the speaking test, for each rating category.
Operationally, these scores are summed, and examinees receive one total, weighted score for
each item. Due to problems encountered in analyzing the data (to be described in more detail
in the Discussion section), a decision was made to process each of the separate scores given
by the two graders/examiners as separate items. The reader will note that for Grade 1, items
69 and 70 both refer to W1. This means that item 69 is the rating for the single Grade 1
writing task given by the first grader, and item 70 is the rating given for the same single
writing task by a second grader. Each grader awards a total possible weighted score of 14. In
the operational test, these scores are summed, and the examinee receives only one score (total
possible 28 points) for the single writing task. The same logic applies to the Grade 1 speaking
items in Table 7, with items 71 and 72 being the gradings from the first and second examiners
for the same speaking-test category (labeled here as S1). Each examiner awards a total

LINKING, VALIDATING, AND PREDICTING TOEFL IBT SCORES AT ADVANCED PROFICIENCY EIKEN LEVELS 14
©2012 Eiken Foundation of Japan
possible score of 15 for S1; in the operational tests, as shown in Table 6, these are summed
for a single total possible score of 30 for S1.
Table 7 Structures of the Grades 1, Pre-1, and 2 Tests in Terms of Skills Tested and Item Weight Used for the Data Analysis in This Project Grade 1 Grade Pre-1 Grade 2 Item Skill Weight Points Item Skill Weight Points No. Skill Weight Points1 R 0,1 1 1 R 0,1 1 1 R 0,1 1 2 R 0,1 1 2 R 0,1 1 2 R 0,1 1 3 R 0,1 1 3 R 0,1 1 3 R 0,1 1 4 R 0,1 1 4 R 0,1 1 4 R 0,1 1 5 R 0,1 1 5 R 0,1 1 5 R 0,1 1 6 R 0,1 1 6 R 0,1 1 6 R 0,1 1 7 R 0,1 1 7 R 0,1 1 7 R 0,1 1 8 R 0,1 1 8 R 0,1 1 8 R 0,1 1 9 R 0,1 1 9 R 0,1 1 9 R 0,1 1 10 R 0,1 1 10 R 0,1 1 10 R 0,1 1 11 R 0,1 1 11 R 0,1 1 11 R 0,1 1 12 R 0,1 1 12 R 0,1 1 12 R 0,1 1 13 R 0,1 1 13 R 0,1 1 13 R 0,1 1 14 R 0,1 1 14 R 0,1 1 14 R 0,1 1 15 R 0,1 1 15 R 0,1 1 15 R 0,1 1 16 R 0,1 1 16 R 0,1 1 16 R 0,1 1 17 R 0,1 1 17 R 0,1 1 17 R 0,1 1 18 R 0,1 1 18 R 0,1 1 18 R 0,1 1 19 R 0,1 1 19 R 0,1 1 19 R 0,1 1 20 R 0,1 1 20 R 0,1 1 20 R 0,1 1 21 R 0,1 1 21 R 0,1 1 21 W 0,1 1 22 R 0,1 1 22 R 0,1 1 22 W 0,1 1 23 R 0,1 1 23 R 0,1 1 23 W 0,1 1 24 R 0,1 1 24 R 0,1 1 24 W 0,1 1 25 R 0,1 1 25 R 0,1 1 25 W 0,1 1 26 R 0,1 1 26 R 0,1 1 26 R 0,1 1 27 R 0,1 1 27 R 0,1 1 27 R 0,1 1 28 R 0,1 1 28 R 0,1 1 28 R 0,1 1 29 R 0,1 1 29 R 0,1 1 29 R 0,1 1 30 R 0,1 1 30 R 0,1 1 30 R 0,1 1 31 R 0,1 1 31 R 0,1 1 31 R 0,1 1 32 R 0,2 2 32 R 0,2 2 32 R 0,1 1 33 R 0,2 2 33 R 0,2 2 33 R 0,1 1 34 R 0,2 2 34 R 0,2 2 34 R 0,1 1 35 R 0,2 2 35 R 0,2 2 35 R 0,1 1 36 R 0,2 2 36 R 0,2 2 36 R 0,1 1 37 R 0,2 2 37 R 0,2 2 37 R 0,1 1 38 R 0,2 2 38 R 0,2 2 38 R 0,1 1 39 R 0,2 2 39 R 0,2 2 39 R 0,1 1 40 R 0,2 2 40 R 0,2 2 40 R 0,1 1 41 R 0,2 2 41 R 0,2 2 41 R 0,1 1 42 L 0,1 1 42 L 0,1 1 42 R 0,1 1 43 L 0,1 1 43 L 0,1 1 43 R 0,1 1 44 L 0,1 1 44 L 0,1 1 44 R 0,1 1 45 L 0,1 1 45 L 0,1 1 45 R 0,1 1 46 L 0,1 1 46 L 0,1 1 46 L 0,1 1 47 L 0,1 1 47 L 0,1 1 47 L 0,1 1 48 L 0,1 1 48 L 0,1 1 48 L 0,1 1 49 L 0,1 1 49 L 0,1 1 49 L 0,1 1 50 L 0,1 1 50 L 0,1 1 50 L 0,1 1 51 L 0,1 1 51 L 0,1 1 51 L 0,1 1 52 L 0,1 1 52 L 0,1 1 52 L 0,1 1 53 L 0,1 1 53 L 0,1 1 53 L 0,1 1 54 L 0,1 1 54 L 0,1 1 54 L 0,1 1 55 L 0,1 1 55 L 0,1 1 55 L 0,1 1 56 L 0,1 1 56 L 0,1 1 56 L 0,1 1 57 L 0,1 1 57 L 0,1 1 57 L 0,1 1

LINKING, VALIDATING, AND PREDICTING TOEFL IBT SCORES AT ADVANCED PROFICIENCY EIKEN LEVELS 15
©2012 Eiken Foundation of Japan
58 L 0,1 1 58 L 0,1 1 58 L 0,1 1 59 L 0,1 1 59 L 0,1 1 59 L 0,1 1 60 L 0,1 1 60 L 0,1 1 60 L 0,1 1 61 L 0,1 1 61 L 0,1 1 61 L 0,1 1 62 L 0,2 2 62 L 0,1 1 62 L 0,1 1 63 L 0,2 2 63 L 0,1 1 63 L 0,1 1 64 L 0,2 2 64 L 0,1 1 64 L 0,1 1 65 L 0,2 2 65 L 0,1 1 65 L 0,1 1 66 L 0,2 2 66 L 0,2 2 66 L 0,1 1 67 L 0,2 2 67 L 0,2 2 67 L 0,1 1 68 L 0,2 2 68 L 0,2 2 68 L 0,1 1 69 W1 0,2,4,6,8,10,12,14 14 69 L 0,2 2 69 L 0,1 1 70 W1 0,2,4,6,8,10,12,14 14 70 L 0,2 2 70 L 0,1 1 71 S1 3,6,9,12,15 15 71 W 0,2,4,6,8,10,12,14 14 71 L 0,1 1 72 S1 3,6,9,12,15 15 72 S 1,2,3,4,5 5 72 L 0,1 1 73 S2 2,4,6,8,10 10 73 S 1,2,3,4,5 5 73 L 0,1 1 74 S2 2,4,6,8,10 10 74 S 1,2,3,4,5 5 74 L 0,1 1 75 S3 3,6,9,12,15 15 75 S 1,2,3,4,5 5 75 L 0,1 1 76 S3 3,6,9,12,15 15 76 S 1,2,3,4,5 5 76 S 1,2,3,4,5 5 77 S4 2,4,6,8,10 10 77 S 1,2,3,4,5 5 77 S 1,2,3,4,5 5 78 S4 2,4,6,8,10 10 78 S 1,2,3,4,5 5 78 S 1,2,3,4,5 5 79 S 1,2,3 3 79 S 1,2,3,4,5 5 80 S 1,2,3,4,5 5 81 S 1,2,3,4,5 5 82 S 1,2,3 3
The reading sections for grades 1 and Pre-1 are divided into three parts: a vocabulary section
and two reading-comprehension sections. The vocabulary section has 25 items. Each item
consists of a sentence with a missing word; examinees must select the correct vocabulary
item from four answer choices. For example:
Again, the reading sections for grades 1 and Pre-1 are divided into two parts, each with
reading-comprehension items. The first part of the reading-comprehension section consists of
two short essays (approximate length 350 words) containing a total of six cloze items.
Examinees must supply missing phrases for each item by choosing from four options. For
example:
Example 2: Though many environmental groups advocate the use of wind as a viable alternative energy source, the drawbacks of wind energy are under-reported. For example, a recent study in Norway found that maintaining wind turbines alone ( ) producing electricity from conventional sources. Answer choices: 1. was more costly than 2. seemed to help 3. did not require 4. would compensate for
For grades 1 and Pre-1, the second part of the reading-comprehension section consists of
Example 1: The student’s desk was so ( ) that she found it difficult to find her notes. Answer choices: 1. sticky 2. cluttered 3. organized 4. fragile

LINKING, VALIDATING, AND PREDICTING TOEFL IBT SCORES AT ADVANCED PROFICIENCY EIKEN LEVELS 16
©2012 Eiken Foundation of Japan
three essays and 10 multiple-choice comprehension questions.
In the Grade 2 first-stage exam there are four sections prior to the listening section. As in
grades 1 and Pre-1, the first is a vocabulary section. This is followed by five items which are
dichotomously scored and which form a subsection representing an indirect test of writing
ability (items 21 to 25 in Table 6). For each item, examinees rearrange five answer choices to
form a missing phrase. Examinees indicate the second and fourth words of the phrase on their
answer sheets. For example:
In example 3, examinees would be required to form the phrase “play golf with his friends”
and select “1. golf” (the second word) and “2. his” (the fourth word) for the correct answer.
The next two sections contain reading items similar in general format to grades 1 and Pre-
1, with two short essays (350 words) containing a total of eight cloze items. As in grades 1
and Pre-1, the final Grade 2 reading section consists of three essays and 12 multiple-choice
comprehension questions.
Listening sections for all grade levels involve listening to various types of recorded texts
(e.g., short dialogues, narrated passages, real-life speech, and interviews) and answering
multiple-choice comprehension questions (four answer choices per item). The writing
sections for grades 1 and Pre-1 consists of writing a 200- (Grade 1) or 100- (Grade Pre-1)
word essay on a given topic. For the Grade 2 exams, writing is tested indirectly with five
items targeting knowledge of sentence composition and structure (these are further described
below).
In addition to the EIKEN tests, an “anchor test” was administered to all participants for
use in creating a single scale across levels, as explained below in the Results section. The
anchor test consisted of 24 items in two sections: The first section (12 items) consisted of
sentences with a missing word (see examples 1 and 3 above). The second section consisted of
three essays and 12 cloze items (see Example 2 above).
At the second stage, the speaking tests involve individual interviews of examinees by
either one examiner (grades Pre-1 and 2) or two (Grade 1). For Grade 1, materials consist of a
topic card with five prompts/topics (e.g., “What role should the United Nations play in
international politics?”). After one minute of free conversation, examinees are given the topic
Example 3: When the weather is nice, Mr. Johnson likes to ( ) on the weekend. Answer choices: 1. golf 2. his 3. play 4. friends 5. with

LINKING, VALIDATING, AND PREDICTING TOEFL IBT SCORES AT ADVANCED PROFICIENCY EIKEN LEVELS 17
©2012 Eiken Foundation of Japan
card and allowed an additional minute to prepare a two-minute speech on one of the five
topics. After delivering the speech, the two examiners ask follow-up questions for
approximately four minutes. Grade Pre-1 examinees are similarly engaged in one minute of
free conversation before being given a topic card that visually depicts a number of scenes in a
four-panel illustration. Examinees are asked to prepare a two-minute narration of the scenes
starting with a model prompt (e.g., “One day, a new employee was about to finish his first
day of work…”). The examiner then asks questions, some of which are follow-up questions
related to the topic in the illustrations, and others which require examinees to provide their
opinions and ideas about topical issues. Grade 2 speaking tests involve two initial tasks:
reading and narration. Examinees are first given a topic card with a printed passage and a
three-panel illustration. Examinees are asked to read the passage silently for 20 seconds and
then read the passage aloud. The examinee is then asked one follow-up question about the
passage. Next, the examinee is given 20 seconds to prepare a narration of the three-panel
illustration. The examinee then narrates the illustration using a prompt supplied on the topic
card (e.g., “One day, Mr. Sato was asked something in English by a customer at his
bookstore…”). The examiner then asks questions that require the examinee to present their
own opinions and ideas.
Procedures
This study required recruiting participants who were non-native speakers of English, were
18 years old or older, and had TOEFL iBT scores less than two years old. Recruitment of
participants involved advertising the study via email lists, fliers, and word of mouth. All
advertisements included the participation requirements, the amount of compensation, and
email contact information (a dedicated email account was created for participants to register
for the study and/or make inquiries). The advertising was circulated via email lists from
departments at the University of Hawai‘i at Mānoa (UHM), UHM International Student
Services, and various English-language schools around Honolulu. Further, fliers were posted
throughout the UHM campus, including the three UHM-affiliated language schools (the
English Language Institute, the Hawaii English Language Program, and New Intensive
Courses in English) and at various Honolulu language schools. Instructors at the English
Language Institute and the Hawaii English Language Program announced the study during
class. A few UHM lecturers who were personally acquainted with members of the research
team announced the study in their undergraduate classes.
After contacting the research team, participants were sent a return email that included

LINKING, VALIDATING, AND PREDICTING TOEFL IBT SCORES AT ADVANCED PROFICIENCY EIKEN LEVELS 18
©2012 Eiken Foundation of Japan
participation procedures, consent information, and a web link to an online background
questionnaire. The research team also confirmed that participants had not taken an EIKEN
test in October of 2007 (since the same tests were being used in the study). The online
questionnaire was constructed and administered using the web-based survey application
Survey Monkey (http://www.surveymonkey.com/). Participants were asked to provide
personal background information as well as TOEFL iBT scores.1
After participants completed the background questionnaire, each was assigned an EIKEN
grade level based on their reported TOEFL iBT score. Participants with iBT scores of 44 or
lower were assigned to Grade Pre-2; participants with scores from 45 to 79 were assigned to
Grade 2; participants with scores from 80 to 99 were assigned to Grade Pre-1; and
participants with scores from 100 and above were assigned to Grade 1. The grade
assignments were based on information published by STEP that presents the minimum
TOEFL scores predicted for EIKEN certificate holders (i.e., those who have passed the test)
at each grade. (This information was based on a study by Clark and Zhang (no date) which
linked TOEFL PBT scores with EIKEN scores.) On this basis, 28 participants (22.8%) were
assigned to Grade 1; 56 (45.5%) to Grade Pre-1; and 39 (31.7%) to Grade 2. Two participants
with iBT scores below 45 participated in the study, but were excluded from the analysis due
to the insufficient number of participants at the Grade Pre-2 level.
Examiners. Additional participants were recruited as interviewers/examiners to
administer EIKEN speaking tests (they were paid $150 compensation for training and test-
day administration duties). Initially, 16 examiners were needed to administer speaking tests
for the four grade levels (i.e., four examiners were needed for each grade level).2 For grades
Pre-2, 2, and Pre-1, EIKEN testing procedures required one examiner for each examinee.
Each Grade 1 speaking interview was administered by two examiners, one of whom was a
native speaker of Japanese and the other a native speaker of English. All other examiners
were native speakers of English. However, advanced Japanese-language proficiency was
needed by the Grade Pre-2 examiners, since all Grade Pre-2 test training materials were in
Japanese.
Examiners were also asked to complete an online background questionnaire (see
1 As recruitment efforts went forward it became necessary to add items to the questionnaire asking where participants had heard about the study, since different institutions required different kinds of compensation. Some language institutes—interpreting U.S. F-1 student visa regulations conservatively—insisted that participants not be paid cash and be given gift certificates instead. 2 Again, 16 examiners were recruited initially; however, since only two Grade Pre-2 examinees participated in the study, only one Pre-2 examiner was needed, resulting in a total of 13 participating examiners.

LINKING, VALIDATING, AND PREDICTING TOEFL IBT SCORES AT ADVANCED PROFICIENCY EIKEN LEVELS 19
©2012 Eiken Foundation of Japan
Appendix B) and submit personal information, including their language-teaching experience.
Examiners were UHM graduate students from the Department of Second Language Studies
(SLS) and the Department of East Asian Languages and Literatures. Ultimately, 13
examiners participated in the study. Seven were male; six were female. The mean age of
examiners was 36.85 (SD = 6.57; minimum: 26; maximum: 52). Seven examiners were
enrolled in or had completed MA/MS degrees; six examiners were enrolled in PhD degrees.
Eleven of the examiners were native speakers of English; two were native speakers of
Japanese (again, the two Grade 1 examiners). The two native Japanese speakers had studied
English for 16.25 and 10 years. Both had spent long periods of time in the U.S. (15 and 4.5
years, respectively). Almost all examiners (12 of 13) had extensive English-language
teaching experience in various U.S. and overseas locations and contexts. Examiners had
taught in educational institutions (primarily at U.S. and foreign universities), private language
institutes, and as private tutors. The mean length of teaching experience was 6.62 years (SD =
2.95) with a minimum of 1.5 years and a maximum of 11 years.3 Table 8 shows the
proportions of examiners who had taught English in the United States, Japan, Korea, or other
locations (more precisely, percentages indicate the proportion of a given location out of all
locations and n indicates the number, or frequency, at each location). Note that most
examiners indicated more than one location.
Table 8 English Teaching Locations for EIKEN–STEP Examiners
Country % (n)
United States 42.6% (23)
Japan 35.2% (19)
Korea 11.1% (6)
Other a 11.1% (6) a Other locations included Spain (3.7%, n = 2), Africa (1.9%, n = 1), Bolivia (1.9%, n = 1), China (1.9%, n = 1), and Thailand (1.9%, n = 1). All examiners completed a self-training module independently (requiring approximately
two to three and a half hours). The training package included general information on the
EIKEN exams and test-day procedures, as well as grade-specific training information and
grading/scoring criteria. After completing the training, examiners rated two example speaking
tests from a training DVD. Examiner training ratings were analyzed by STEP specialists in
3 One of the examiners, a native speaker of Japanese, had taught Japanese for 17 years.
LINKING, VALIDATING, AND PREDICTING TOEFL IBT SCORES AT ADVANCED PROFICIENCY EIKEN LEVELS 20
©2012 Eiken Foundation of Japan
order to calibrate trainee examiners’ scoring to STEP standards. The specialists then gave
each examiner specific feedback to help them adjust their ratings accordingly.
Finally, the test administrations were organized such that examiners and examinees did
not know one another. In particular, examiners for Grade 1 were recruited from outside the
Second Language Studies (SLS) Department, since it was possible that advanced-proficiency
examinees could also be graduate students from the SLS Department.
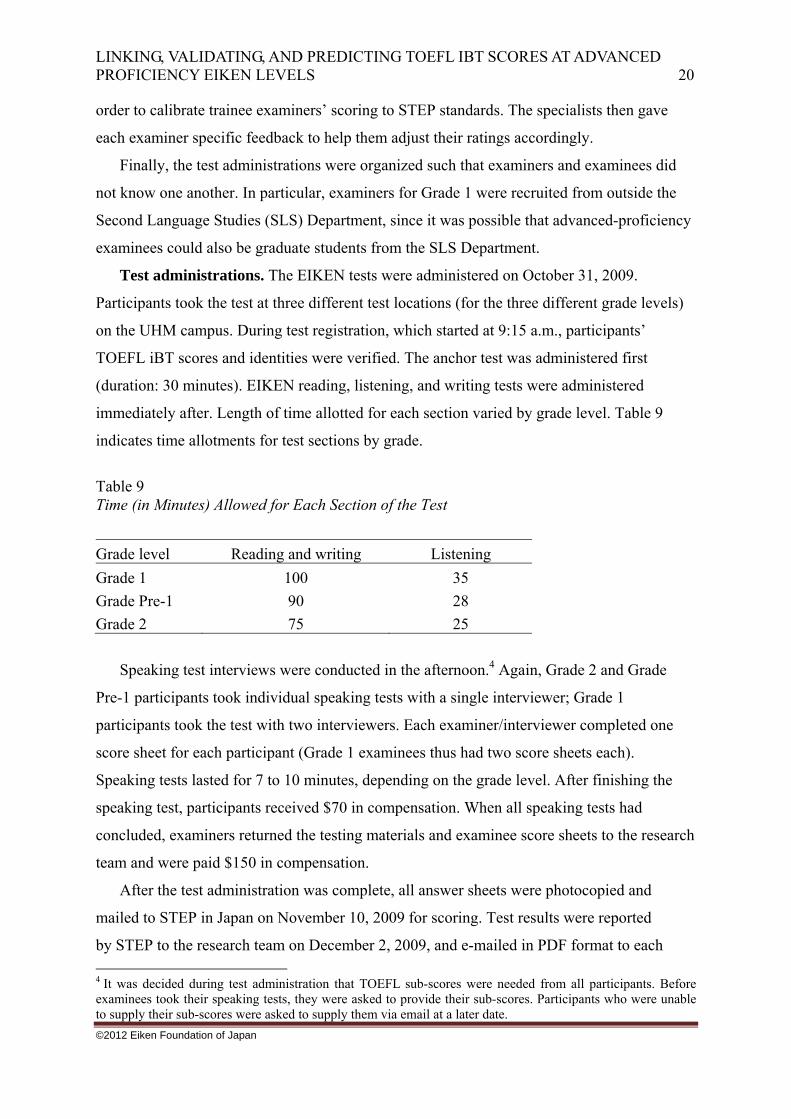
Test administrations. The EIKEN tests were administered on October 31, 2009.
Participants took the test at three different test locations (for the three different grade levels)
on the UHM campus. During test registration, which started at 9:15 a.m., participants’
TOEFL iBT scores and identities were verified. The anchor test was administered first
(duration: 30 minutes). EIKEN reading, listening, and writing tests were administered
immediately after. Length of time allotted for each section varied by grade level. Table 9
indicates time allotments for test sections by grade.
Table 9 Time (in Minutes) Allowed for Each Section of the Test
Speaking test interviews were conducted in the afternoon.4 Again, Grade 2 and Grade
Pre-1 participants took individual speaking tests with a single interviewer; Grade 1
participants took the test with two interviewers. Each examiner/interviewer completed one
score sheet for each participant (Grade 1 examinees thus had two score sheets each).
Speaking tests lasted for 7 to 10 minutes, depending on the grade level. After finishing the
speaking test, participants received $70 in compensation. When all speaking tests had
concluded, examiners returned the testing materials and examinee score sheets to the research
team and were paid $150 in compensation.
After the test administration was complete, all answer sheets were photocopied and
mailed to STEP in Japan on November 10, 2009 for scoring. Test results were reported
by STEP to the research team on December 2, 2009, and e-mailed in PDF format to each
4 It was decided during test administration that TOEFL sub-scores were needed from all participants. Before examinees took their speaking tests, they were asked to provide their sub-scores. Participants who were unable to supply their sub-scores were asked to supply them via email at a later date.
Grade level Reading and writing Listening
Grade 1 100 35
Grade Pre-1 90 28
Grade 2 75 25

LINKING, VALIDATING, AND PREDICTING TOEFL IBT SCORES AT ADVANCED PROFICIENCY EIKEN LEVELS 21
©2012 Eiken Foundation of Japan
participant shortly thereafter.
Results
In the previous section, we explained how the study was conducted. In this section, we
will describe the results of our various analyses. The descriptions will be organized under
headings for the general categories of statistical procedures that we conducted as follows:
Rasch analyses, means comparisons, correlational analyses, principal components analyses,
and regression analyses.
Rasch Analyses
One issue that has long interfered with the equating of EIKEN test scores with TOEFL
scores is the fact that the EIKEN tests have developed historically and culturally into a series
of seven increasingly difficult pass-fail tests, thus creating a series of nominal scale results
that are difficult to equate with the continuous scores of tests like the TOEFL. Clark and
Zhang (no date) attempted to overcome this problem by using logistic regression.
Unfortunately, they encountered two problems in doing that analysis. First, they were only
able to relate the pass-fail cut points to TOEFL scores. Second, logistic regression, which
depends heavily on chi-squared analysis, is by nature non-parametric. Non-parametric
analyses have the advantage of requiring few if any restrictive assumptions, but they are also
weaker than parametric statistics. The first author of this project realized several years ago
that it would be possible to overcome both of these problems if the raw scores on the EIKEN
tests could be linked and equated to a single set of general scores across multiple levels. That
author further realized that Rasch analysis was perfectly suited to such a task. In this study,
Rasch analyses were used to link the scores for grades 1, Pre-1, and 2 (recall that we were
only able to find two examinees at the level appropriate for Grade Pre-2) to a separate set of
scores common across these forms. To do that, we needed anchor items (the 24 items
described earlier in the Materials section) that all students would take while they were also
taking either the Grade 1, Grade Pre-1, or Grade 2 tests. Then the Winsteps™ computer
program was used to run Rasch analyses with the anchor items identified for each of the three
sets of test data separately (grades 1, Pre-1, and 2). The purpose of these analyses was to
separately examine the degree to which items and persons misfit the Rasch analysis model.
The same Rasch analysis was also run with the three sets of test data combined in order to
come up with a single set of adjusted scores that formed a single continuous scale across the
three forms. Thus we were able to create a single common scale across all three grade levels.

LINKING, VALIDATING, AND PREDICTING TOEFL IBT SCORES AT ADVANCED PROFICIENCY EIKEN LEVELS 22
©2012 Eiken Foundation of Japan
Figure 1 presents the person/item map for the anchored data from Grade 1. This map
allows us to examine person ability estimates (Rasch parlance for examinee performance
scores) on the same scale as the item difficulty estimates. Notice that the first column
contains logit scores ranging from +3 at the top to −4 at the bottom. For persons, positive
logits indicate increasingly high ability levels, and negative logits indicate increasingly low
ability. For items, positive logits indicate increasingly difficult items, and negative logits
indicate increasingly easy items.
Traditionally, in a Rasch analysis with no anchoring, the mean item difficulty is set at
zero logits in person/item maps. Thus the logit scale is fixed on item difficulty. Persons (i.e.,
examinees) are then shown as more or less able in relationship to the item difficulties, that is,
increasingly high positive person logit scores indicate more ability and increasingly negative
person logit scores indicate less ability. Note that the second and third columns in Figure 1
show sideways histograms of the person abilities and item difficulties, respectively, made up
of an X for each person (in the second column), and an item number for each item (in the
right-hand column). For example, the top X in the person column shows that the highest
person scored a bit above +2 logits (+2.20 logits to be exact, see entry 7 in Table 11), making
that person the most able of those who took this administration of the Grade 1 test. Similarly,
the top item in the right-hand column is item 12 (I0053), the most difficult item on the Grade
1 test.
In Rasch analyses that include anchor items, the mean item difficulty may not fall at zero
logits in person/item maps. The logit scale is still fixed on item difficulty, and the person
abilities are still shown in relationship to those item difficulties. However, in the analyses
presented here, the logit scales do not line up as we would expect in a single unanchored
analysis because each of the sets of person abilities and item difficulties has been adjusted
based on what was learned from the anchor items about the relative performances of the three
groups of persons and the relative difficulties of the three sets of items (for the Grade 1, Pre-1,
and 2 tests).
One pattern worth noting in Figure 1 is that all but two of the persons scored above the
zero logit. Indeed the logit ability scores ranged from −43 to +2.20 with a mean of .75. Thus,
they were high-ability examinees relative to the difficulty of the items on the three tests. Put
another way, this group of persons would find a large number of the items on these three tests
to be easy for them. This is not a surprising result given that they were assigned to the Grade
1 test because they had scored 100 or higher on the TOEFL iBT.

LINKING, VALIDATING, AND PREDICTING TOEFL IBT SCORES AT ADVANCED PROFICIENCY EIKEN LEVELS 23
©2012 Eiken Foundation of Japan
Figure 1. Person/item map (anchored) for Grade 1 -------------------------------------------------------------------------------- persons - MAP - items <more>|<rare> 3 + | | | | | X | 2 + T|T X | X | I0053 X | S| XXX | I0001 I0027 1 XX + I0007 I0019 XXXXXX | I0003 I0004 X M| I0006 I0025 XXX |S I0005 I0008 I0012 I0016 I0062 I0073 X | I0050 I0069 I0070 I0071 I0074 I0077 I0078 X | I0002 I0009 I0075 XXXXX S| I0020 I0061 0 + I0011 I0013 I0018 I0022 I0029 I0036 I0039 I0056 X | | I0021 I0052 X T| I0015 I0017 I0032 I0038 I0068 | I0010 |M | I0014 I0033 I0041 I0058 I0060 I0072 -1 + | I0028 I0045 I0046 | | I0037 I0043 I0051 I0055 I0057 I0063 I0067 I0076 | | | -2 +S I0023 I0026 I0030 I0048 I0054 I0059 I0065 I0066 | | | | | I0024 I0031 I0034 I0042 I0044 I0047 I0049 | -3 + | | |T | | | -4 + I0035 I0040 I0064 <less>|<frequ> --------------------------------------------------------------------------------
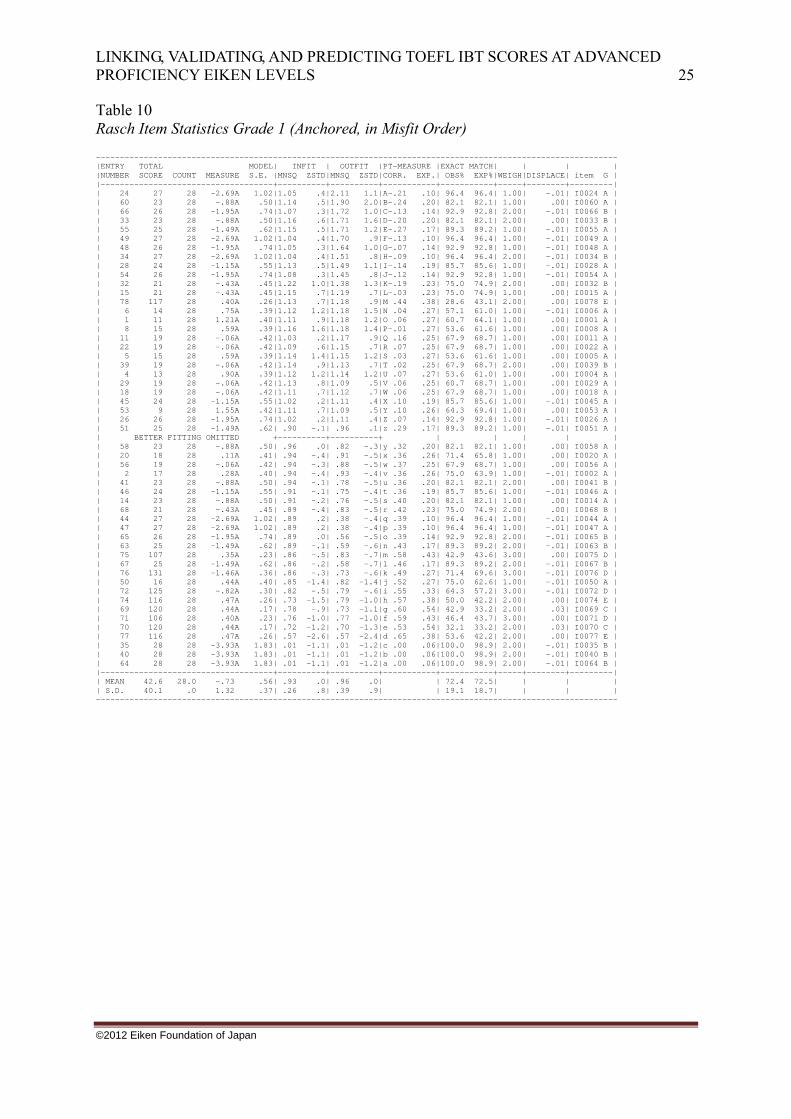
Table 10 shows the Rasch item statistics for the anchored analysis of the Grade 1 results
presented in misfit order (i.e., roughly from the item with the highest degree of misfit to
lowest). Typically, researchers pay more attention to the infit statistics than to the outfit
statistics because the infit statistics focus more on data from persons near or around the same
logit as the item difficulty, thereby minimizing the effects of outliers. The sixth column of
numbers in Table 10 shows the mean squares (MNSQ) infit statistics for each item. Mean
squares values over 1.30 (and standardized z statistics over 2.00) are traditionally considered
misfitting items. Misfitting items are items that have more variation than expected between
the observed pattern of responses and the pattern that was predicted by the Rasch model

LINKING, VALIDATING, AND PREDICTING TOEFL IBT SCORES AT ADVANCED PROFICIENCY EIKEN LEVELS 24
©2012 Eiken Foundation of Japan
calculations. Note that the infit mean squares indicate that none of the items are over 1.30, the
point at which items would be considered misfitting; nor are any of the standardized z values
over 2.00.
Mean squares values under .75 are traditionally considered overfitting items (as are
standardized z values lower than −2.00); that is, items that are in a sense too good to be true.
Such items are often answered correctly by all persons with logit abilities above the item
difficulty logit of the item, and incorrectly by all those below that point. Such items often
reflect a lack of independence. The mean squares values in column six indicate that there are
six such overfitting items for the Grade 1 results (see the bottom of column 6). However the
standardized z statistic indicates that only one item is overfitting. In either case, such
overfitting anchor items bear further scrutiny in a test development context, but they are
understandable and can reasonably be accepted in this research context.
LINKING, VALIDATING, AND PREDICTING TOEFL IBT SCORES AT ADVANCED PROFICIENCY EIKEN LEVELS 25
©2012 Eiken Foundation of Japan
Table 10 Rasch Item Statistics Grade 1 (Anchored, in Misfit Order) ------------------------------------------------------------------------------------------------------------- |ENTRY TOTAL MODEL| INFIT | OUTFIT |PT-MEASURE |EXACT MATCH| | | | |NUMBER SCORE COUNT MEASURE S.E. |MNSQ ZSTD|MNSQ ZSTD|CORR. EXP.| OBS% EXP%|WEIGH|DISPLACE| item G | |------------------------------------+----------+----------+-----------+-----------+-----+--------+---------| | 24 27 28 -2.69A 1.02|1.05 .4|2.11 1.1|A-.21 .10| 96.4 96.4| 1.00| -.01| I0024 A | | 60 23 28 -.88A .50|1.14 .5|1.90 2.0|B-.24 .20| 82.1 82.1| 1.00| .00| I0060 A | | 66 26 28 -1.95A .74|1.07 .3|1.72 1.0|C-.13 .14| 92.9 92.8| 2.00| -.01| I0066 B | | 33 23 28 -.88A .50|1.16 .6|1.71 1.6|D-.20 .20| 82.1 82.1| 2.00| .00| I0033 B | | 55 25 28 -1.49A .62|1.15 .5|1.71 1.2|E-.27 .17| 89.3 89.2| 1.00| -.01| I0055 A | | 49 27 28 -2.69A 1.02|1.04 .4|1.70 .9|F-.13 .10| 96.4 96.4| 1.00| -.01| I0049 A | | 48 26 28 -1.95A .74|1.05 .3|1.64 1.0|G-.07 .14| 92.9 92.8| 1.00| -.01| I0048 A | | 34 27 28 -2.69A 1.02|1.04 .4|1.51 .8|H-.09 .10| 96.4 96.4| 2.00| -.01| I0034 B | | 28 24 28 -1.15A .55|1.13 .5|1.49 1.1|I-.14 .19| 85.7 85.6| 1.00| -.01| I0028 A | | 54 26 28 -1.95A .74|1.08 .3|1.45 .8|J-.12 .14| 92.9 92.8| 1.00| -.01| I0054 A | | 32 21 28 -.43A .45|1.22 1.0|1.38 1.3|K-.19 .23| 75.0 74.9| 2.00| .00| I0032 B | | 15 21 28 -.43A .45|1.15 .7|1.19 .7|L-.03 .23| 75.0 74.9| 1.00| .00| I0015 A | | 78 117 28 .40A .26|1.13 .7|1.18 .9|M .44 .38| 28.6 43.1| 2.00| .00| I0078 E | | 6 14 28 .75A .39|1.12 1.2|1.18 1.5|N .04 .27| 57.1 61.0| 1.00| -.01| I0006 A | | 1 11 28 1.21A .40|1.11 .9|1.18 1.2|O .06 .27| 60.7 64.1| 1.00| .00| I0001 A | | 8 15 28 .59A .39|1.16 1.6|1.18 1.4|P-.01 .27| 53.6 61.6| 1.00| .00| I0008 A | | 11 19 28 -.06A .42|1.03 .2|1.17 .9|Q .16 .25| 67.9 68.7| 1.00| .00| I0011 A | | 22 19 28 -.06A .42|1.09 .6|1.15 .7|R .07 .25| 67.9 68.7| 1.00| .00| I0022 A | | 5 15 28 .59A .39|1.14 1.4|1.15 1.2|S .03 .27| 53.6 61.6| 1.00| .00| I0005 A | | 39 19 28 -.06A .42|1.14 .9|1.13 .7|T .02 .25| 67.9 68.7| 2.00| .00| I0039 B | | 4 13 28 .90A .39|1.12 1.2|1.14 1.2|U .07 .27| 53.6 61.0| 1.00| .00| I0004 A | | 29 19 28 -.06A .42|1.13 .8|1.09 .5|V .06 .25| 60.7 68.7| 1.00| .00| I0029 A | | 18 19 28 -.06A .42|1.11 .7|1.12 .7|W .06 .25| 67.9 68.7| 1.00| .00| I0018 A | | 45 24 28 -1.15A .55|1.02 .2|1.11 .4|X .10 .19| 85.7 85.6| 1.00| -.01| I0045 A | | 53 9 28 1.55A .42|1.11 .7|1.09 .5|Y .10 .26| 64.3 69.4| 1.00| .00| I0053 A | | 26 26 28 -1.95A .74|1.02 .2|1.11 .4|Z .07 .14| 92.9 92.8| 1.00| -.01| I0026 A | | 51 25 28 -1.49A .62| .90 -.1| .96 .1|z .29 .17| 89.3 89.2| 1.00| -.01| I0051 A | | BETTER FITTING OMITTED +----------+----------+ | | | | | | 58 23 28 -.88A .50| .96 .0| .82 -.3|y .32 .20| 82.1 82.1| 1.00| .00| I0058 A | | 20 18 28 .11A .41| .94 -.4| .91 -.5|x .36 .26| 71.4 65.8| 1.00| .00| I0020 A | | 56 19 28 -.06A .42| .94 -.3| .88 -.5|w .37 .25| 67.9 68.7| 1.00| .00| I0056 A | | 2 17 28 .28A .40| .94 -.4| .93 -.4|v .36 .26| 75.0 63.9| 1.00| -.01| I0002 A | | 41 23 28 -.88A .50| .94 -.1| .78 -.5|u .36 .20| 82.1 82.1| 2.00| .00| I0041 B | | 46 24 28 -1.15A .55| .91 -.1| .75 -.4|t .36 .19| 85.7 85.6| 1.00| -.01| I0046 A | | 14 23 28 -.88A .50| .91 -.2| .76 -.5|s .40 .20| 82.1 82.1| 1.00| .00| I0014 A | | 68 21 28 -.43A .45| .89 -.4| .83 -.5|r .42 .23| 75.0 74.9| 2.00| .00| I0068 B | | 44 27 28 -2.69A 1.02| .89 .2| .38 -.4|q .39 .10| 96.4 96.4| 1.00| -.01| I0044 A | | 47 27 28 -2.69A 1.02| .89 .2| .38 -.4|p .39 .10| 96.4 96.4| 1.00| -.01| I0047 A | | 65 26 28 -1.95A .74| .89 .0| .56 -.5|o .39 .14| 92.9 92.8| 2.00| -.01| I0065 B | | 63 25 28 -1.49A .62| .89 -.1| .59 -.6|n .43 .17| 89.3 89.2| 2.00| -.01| I0063 B | | 75 107 28 .35A .23| .86 -.5| .83 -.7|m .58 .43| 42.9 43.6| 3.00| .00| I0075 D | | 67 25 28 -1.49A .62| .86 -.2| .58 -.7|l .46 .17| 89.3 89.2| 2.00| -.01| I0067 B | | 76 131 28 -1.46A .36| .86 -.3| .73 -.6|k .49 .27| 71.4 69.6| 3.00| -.01| I0076 D | | 50 16 28 .44A .40| .85 -1.4| .82 -1.4|j .52 .27| 75.0 62.6| 1.00| -.01| I0050 A | | 72 125 28 -.82A .30| .82 -.5| .79 -.6|i .55 .33| 64.3 57.2| 3.00| -.01| I0072 D | | 74 116 28 .47A .26| .73 -1.5| .79 -1.0|h .57 .38| 50.0 42.2| 2.00| .00| I0074 E | | 69 120 28 .44A .17| .78 -.9| .73 -1.1|g .60 .54| 42.9 33.2| 2.00| .03| I0069 C | | 71 106 28 .40A .23| .76 -1.0| .77 -1.0|f .59 .43| 46.4 43.7| 3.00| .00| I0071 D | | 70 120 28 .44A .17| .72 -1.2| .70 -1.3|e .53 .54| 32.1 33.2| 2.00| .03| I0070 C | | 77 116 28 .47A .26| .57 -2.6| .57 -2.4|d .65 .38| 53.6 42.2| 2.00| .00| I0077 E | | 35 28 28 -3.93A 1.83| .01 -1.1| .01 -1.2|c .00 .06|100.0 98.9| 2.00| -.01| I0035 B | | 40 28 28 -3.93A 1.83| .01 -1.1| .01 -1.2|b .00 .06|100.0 98.9| 2.00| -.01| I0040 B | | 64 28 28 -3.93A 1.83| .01 -1.1| .01 -1.2|a .00 .06|100.0 98.9| 2.00| -.01| I0064 B | |------------------------------------+----------+----------+-----------+-----------+-----+--------+---------| | MEAN 42.6 28.0 -.73 .56| .93 .0| .96 .0| | 72.4 72.5| | | | | S.D. 40.1 .0 1.32 .37| .26 .8| .39 .9| | 19.1 18.7| | | | -------------------------------------------------------------------------------------------------------------

LINKING, VALIDATING, AND PREDICTING TOEFL IBT SCORES AT ADVANCED PROFICIENCY EIKEN LEVELS 26
©2012 Eiken Foundation of Japan
Table 11 shows the same sorts of analyses for persons (test takers) for the Grade 1 test.
Notice that the sixth and seventh columns of numbers show two misfitting persons (i.e.,
entries 11 and 27 are over the 1.30 threshold for mean squares and over 2.00 for standardized
z). In addition, seven persons appear to be overfitting, with mean squares values below .75
according to the mean square statistic (while only six are overfitting according to the
standardized z). Given that these mean squares values are close to the mean squares .75 cut
point, these possible overfitters do not present a problem for this research study.
Table 11 Rasch Person Statistics Grade 1 (Anchored, in Misfit Order) -------------------------------------------------------------------------------------------- |ENTRY TOTAL MODEL| INFIT | OUTFIT |PT-MEASURE |EXACT MATCH| | |NUMBER SCORE COUNT MEASURE S.E. |MNSQ ZSTD|MNSQ ZSTD|CORR. EXP.| OBS% EXP%| person| |------------------------------------+----------+----------+-----------+-----------+-------| | 26 178 109 1.15 .20| .99 .0|1.56 1.4|A .25 .36| 67.0 75.7| 118 | | 6 183 109 1.37 .22|1.02 .2|1.54 1.2|B .37 .34| 69.7 77.9| 014 | | 15 175 109 1.03 .20| .72 -1.6|1.45 1.2|C .40 .38| 75.2 74.7| 070 | | 11 150 109 .17 .18|1.45 2.6| .96 -.1|D .48 .47| 69.7 67.1| 041 | | 27 163 109 .59 .18|1.42 2.3|1.11 .5|E .40 .43| 68.8 70.3| 121 | | 5 188 109 1.62 .23| .61 -2.0|1.30 .7|F .28 .31| 86.2 81.5| 013 | | 4 189 109 1.68 .24|1.25 1.1|1.01 .2|G .31 .31| 79.8 82.0| 012 | | 28 172 109 .91 .19|1.21 1.2|1.15 .5|H .41 .39| 59.6 73.6| 123 | | 21 131 109 -.43 .18|1.04 .3|1.20 1.1|I .37 .52| 56.0 65.3| 099 | | 24 168 109 .77 .19|1.18 1.1| .97 .0|J .33 .41| 71.6 72.2| 111 | | 14 164 109 .63 .19|1.13 .8| .84 -.5|K .48 .42| 67.9 70.6| 059 | | 19 150 109 .17 .18|1.01 .1|1.06 .3|L .47 .47| 72.5 67.1| 090 | | 17 176 109 1.07 .20|1.04 .3|1.04 .2|M .41 .37| 63.3 75.0| 079 | | 3 177 109 1.11 .20| .74 -1.4|1.04 .2|N .30 .37| 80.7 75.3| 011 | | 25 171 109 .88 .19|1.04 .3| .83 -.4|n .48 .40| 69.7 73.3| 113 | | 2 157 109 .39 .18|1.02 .2| .89 -.3|m .40 .45| 75.2 69.0| 009 | | 22 153 109 .26 .18| .80 -1.3| .98 .0|l .33 .46| 66.1 67.6| 100 | | 18 150 109 .17 .18| .87 -.9| .93 -.2|k .49 .47| 65.1 67.1| 089 | | 7 197 109 2.20 .28| .74 -1.0| .91 .0|j .23 .25| 89.0 88.0| 019 | | 20 139 109 -.18 .18| .76 -1.7| .85 -.7|i .52 .50| 68.8 65.4| 091 | | 16 170 109 .84 .19| .73 -1.6| .83 -.4|h .40 .40| 76.1 72.8| 071 | | 12 170 109 .84 .19| .76 -1.4| .71 -.9|g .45 .40| 76.1 72.8| 048 | | 23 147 109 .07 .18| .60 -3.1| .72 -1.3|f .48 .48| 78.0 66.2| 107 | | 10 161 109 .53 .18| .69 -2.1| .56 -1.8|e .52 .43| 78.0 69.9| 030 | | 9 147 109 .07 .18| .66 -2.5| .69 -1.5|d .58 .48| 63.3 66.2| 028 | | 1 171 109 .88 .19| .63 -2.4| .63 -1.1|c .43 .40| 77.1 73.3| 006 | | 8 171 109 .88 .19| .62 -2.4| .49 -1.8|b .57 .40| 82.6 73.3| 027 | | 13 179 109 1.19 .21| .58 -2.4| .58 -1.1|a .43 .36| 75.2 76.0| 058 | |------------------------------------+----------+----------+-----------+-----------+-------| | MEAN 166.0 109.0 .75 .20| .90 -.6| .96 -.2| | 72.4 72.5| | | S.D. 15.5 .0 .58 .02| .25 1.5| .27 .9| | 7.6 5.4| | --------------------------------------------------------------------------------------------
Turning to the second set of Rasch analyses (for the Grade Pre-1 data), readers should be
able to interpret Figure 2 based on the explanation of Figure 1 above. However, one pattern
that stands out is that the examinees taking this Grade Pre-1 test generally scored lower than
did those taking the Grade 1 test. Indeed, the logit ability scores on this test ranged from
−1.12 to +1.46, with a mean of .19. Thus, this group of Grade Pre-1 test takers had lower
abilities relative to the Grade 1 group and relative to the item difficulties on the three tests,
which makes sense given that they were assigned to the Grade Pre-1 test based on their lower
TOEFL iBT scores (ranging from 80 to 99). It should also be remembered that these test
takers were taking items on the Pre-1 test, which is designed to be easier than the Grade 1 test

LINKING, VALIDATING, AND PREDICTING TOEFL IBT SCORES AT ADVANCED PROFICIENCY EIKEN LEVELS 27
©2012 Eiken Foundation of Japan
and more difficult than the Grade 2 test. Indeed, the anchored item measures for Grade Pre-1
relative to the item difficulties of the other tests are, on average, slightly easier than Grade 1
items and more difficult than Grade 2 items, as can be seen from the mean item measures in
tables 10, 12, and 14.
Figure 2. Person/item map (anchored) for Grade Pre-1 -------------------------------------------------------------------------------- persons - MAP - items <more>|<rare> 2 + | | XX | T| X | 1 XX + XXX S| XXXXXX | XXXXXX |T I0052 XXXXX | I0060 I0062 XXXXXXX M| I0057 0 XXXXXXXX + I0009 XXXX | I0071 XXX S| I0059 I0061 I0069 I0070 XXXX |S I0023 XXX | I0032 I0051 | I0035 I0058 I0063 I0074 I0075 I0079 -1 X T+ I0001 I0003 I0027 I0048 I0054 I0077 X | I0004 I0008 I0011 I0030 I0064 I0066 I0073 I0076 I0078 | I0012 I0039 I0045 | I0002 I0013 I0015 I0021 I0025 I0033 I0065 I0067 I0072 |M I0007 I0010 I0014 I0016 I0022 I0047 | I0006 I0037 I0049 -2 + I0055 | I0024 I0028 I0034 I0050 | | I0018 I0029 I0040 I0043 I0046 I0068 |S | I0020 I0031 I0038 I0042 I0044 I0056 -3 + | I0017 I0019 I0026 | | | |T -4 + I0005 I0036 I0041 | | | | | -5 + | I0053 | | | | -6 + <less>|<frequ> --------------------------------------------------------------------------------
Table 12 shows the Rasch item statistics for the anchored analysis of the Grade Pre-1
results presented in misfit order (i.e., roughly from the item with the highest degree of misfit
to the lowest). Again, the sixth column of numbers shows the mean squares (MNSQ) infit
statistics for each item. Recall that mean squares values over 1.30 are traditionally considered
misfitting items. Misfitting items are those that show greater variation between the observed
pattern of responses and the pattern that was predicted by the Rasch model calculations. Note
that the mean squares values indicate that none of the items on this test are misfitting, though

LINKING, VALIDATING, AND PREDICTING TOEFL IBT SCORES AT ADVANCED PROFICIENCY EIKEN LEVELS 28
©2012 Eiken Foundation of Japan
the standardized z identifies entry 62 as misfitting.
Mean squares values under .75 are traditionally considered overfitting items, which, as
stated above, are items that are in a sense too good to be true. The mean squares values in
column six indicate that there are four such overfitting items for the Grade Pre-1 results—all
four of which were easy to very-easy items. However, only one of those, entry 64, is
identified as misfitting by the standardized z statistic.
Table 12 Rasch Item Statistics Grade Pre-1 (Anchored, in Misfit Order) ------------------------------------------------------------------------------------------------------------- |ENTRY TOTAL MODEL| INFIT | OUTFIT |PT-MEASURE |EXACT MATCH| | | | |NUMBER SCORE COUNT MEASURE S.E. |MNSQ ZSTD|MNSQ ZSTD|CORR. EXP.| OBS% EXP%|WEIGH|DISPLACE| item G | |------------------------------------+----------+----------+-----------+-----------+-----+--------+---------| | 50 51 56 -2.25A .47|1.09 .4|1.70 1.4|A-.14 .16| 91.1 91.0| 1.00| -.01| I0050 A | | 19 54 56 -3.24A .72|1.03 .3|1.41 .7|B-.05 .10| 96.4 96.4| 1.00| -.01| I0019 A | | 67 46 56 -1.43A .36|1.15 .7|1.37 1.3|C-.11 .21| 82.1 82.1| 2.00| -.01| I0067 B | | 44 53 56 -2.81A .60|1.04 .3|1.29 .6|D-.03 .12| 94.6 94.6| 1.00| -.01| I0044 A | | 71 250 56 -.25A .12|1.25 1.3|1.28 1.4|E .56 .54| 26.8 33.4| 2.00| .00| I0071 C | | 17 54 56 -3.24A .72|1.03 .3|1.28 .6|F-.03 .10| 96.4 96.4| 1.00| -.01| I0017 A | | 64 44 56 -1.19A .33|1.14 .8|1.23 1.0|G-.05 .22| 78.6 78.5| 1.00| -.01| I0064 A | | 34 51 56 -2.25A .47|1.06 .3|1.22 .6|H-.01 .16| 91.1 91.0| 2.00| -.01| I0034 B | | 38 53 56 -2.81A .60|1.03 .2|1.21 .5|I .01 .12| 94.6 94.6| 2.00| -.01| I0038 B | | 62 27 56 .27A .28|1.16 2.2|1.20 2.4|J-.02 .27| 50.0 60.9| 1.00| .00| I0062 A | | 77 228 56 -1.04A .17|1.19 1.0|1.14 .7|K .51 .40| 46.4 46.6| 1.00| .00| I0077 D | | 42 53 56 -2.81A .60|1.04 .3|1.18 .5|L-.02 .12| 94.6 94.6| 1.00| -.01| I0042 A | | 7 48 56 -1.71A .39|1.04 .2|1.14 .5|M .09 .19| 85.7 85.7| 1.00| .00| I0007 A | | 15 47 56 -1.56A .37| .96 -.1|1.14 .5|N .20 .20| 83.9 83.8| 1.00| -.01| I0015 A | | 43 52 56 -2.50A .52|1.03 .2|1.13 .4|O .04 .14| 92.9 92.8| 1.00| -.01| I0043 A | | 61 35 56 -.36A .29|1.07 .7|1.10 .9|P .13 .26| 66.1 65.2| 1.00| .00| I0061 A | | 45 45 56 -1.31A .34|1.04 .3|1.09 .4|Q .13 .21| 80.4 80.3| 1.00| .00| I0045 A | | 79 133 56 -.77A .22|1.08 .6|1.08 .5|R .27 .32| 53.6 54.6| 1.00| .11| I0079 E | | 23 36 56 -.44A .29|1.08 .8|1.05 .4|S .14 .26| 62.5 66.2| 1.00| .00| I0023 A | | 49 49 56 -1.87A .41|1.07 .3|1.06 .3|T .07 .18| 87.5 87.5| 1.00| .00| I0049 A | | 39 45 56 -1.31A .34|1.04 .2|1.06 .3|U .14 .21| 80.4 80.3| 2.00| .00| I0039 B | | 59 35 56 -.36A .29|1.05 .6|1.06 .6|V .17 .26| 62.5 65.2| 1.00| .00| I0059 A | | 57 28 56 .19A .28|1.05 .8|1.06 .7|W .17 .27| 53.6 60.8| 1.00| .00| I0057 A | | 63 40 56 -.79A .30|1.05 .4|1.05 .3|X .15 .24| 71.4 71.8| 1.00| .00| I0063 A | | 4 44 56 -1.19A .33| .98 .0|1.05 .3|Y .21 .22| 78.6 78.5| 1.00| -.01| I0004 A | | 25 47 56 -1.56A .37|1.02 .2|1.05 .3|Z .14 .20| 83.9 83.8| 1.00| -.01| I0025 A | | BETTER FITTING OMITTED +----------+----------+ | | | | | | 16 48 56 -1.71A .39| .98 .0| .93 -.1|z .24 .19| 85.7 85.7| 1.00| .00| I0016 A | | 28 51 56 -2.25A .47| .98 .1| .89 -.1|y .20 .16| 91.1 91.0| 1.00| -.01| I0028 A | | 24 51 56 -2.25A .47| .98 .1| .96 .1|x .18 .16| 91.1 91.0| 1.00| -.01| I0024 A | | 10 48 56 -1.71A .39| .97 .0| .97 .0|w .23 .19| 85.7 85.7| 1.00| .00| I0010 A | | 30 44 56 -1.19A .33| .97 -.1| .93 -.2|v .28 .22| 78.6 78.5| 1.00| -.01| I0030 A | | 1 43 56 -1.08A .32| .97 -.1| .96 -.1|u .27 .23| 75.0 76.7| 1.00| -.01| I0001 A | | 14 48 56 -1.71A .39| .96 .0| .81 -.5|t .30 .19| 85.7 85.7| 1.00| .00| I0014 A | | 41 55 56 -3.96A 1.01| .96 .3| .48 -.2|s .21 .07| 98.2 98.2| 2.00| -.01| I0041 B | | 72 244 56 -1.57A .20| .90 -.4| .96 -.1|r .38 .36| 62.5 52.0| 1.00| -.01| I0072 D | | 55 50 56 -2.05A .44| .96 .0| .86 -.2|q .26 .17| 89.3 89.3| 1.00| .00| I0055 A | | 2 47 56 -1.56A .37| .96 -.1| .84 -.5|p .29 .20| 83.9 83.8| 1.00| -.01| I0002 A | | 31 53 56 -2.81A .60| .95 .1| .78 -.2|o .23 .12| 94.6 94.6| 1.00| -.01| I0031 A | | 6 49 56 -1.87A .41| .92 -.2| .95 .0|n .29 .18| 87.5 87.5| 1.00| .00| I0006 A | | 75 221 56 -.84A .16| .95 -.2| .93 -.3|m .56 .42| 55.4 45.7| 1.00| .00| I0075 D | | 18 52 56 -2.50A .52| .94 .0| .67 -.5|l .30 .14| 92.9 92.8| 1.00| -.01| I0018 A | | 8 44 56 -1.19A .33| .89 -.6| .94 -.2|k .39 .22| 78.6 78.5| 1.00| -.01| I0008 A | | 37 49 56 -1.87A .41| .94 -.1| .75 -.6|j .34 .18| 87.5 87.5| 2.00| .00| I0037 B | | 40 52 56 -2.50A .52| .93 .0| .64 -.6|i .32 .14| 92.9 92.8| 2.00| -.01| I0040 B | | 26 54 56 -3.24A .72| .93 .1| .49 -.5|h .31 .10| 96.4 96.4| 1.00| -.01| I0026 A | | 51 38 56 -.61A .30| .92 -.7| .87 -.9|g .40 .25| 73.2 68.7| 1.00| .00| I0051 A | | 48 43 56 -1.08A .32| .91 -.5| .87 -.6|f .38 .23| 78.6 76.7| 1.00| -.01| I0048 A | | 60 26 56 .35A .28| .90 -1.5| .90 -1.3|e .44 .26| 73.2 61.3| 1.00| -.01| I0060 A | | 78 231 56 -1.13A .17| .71 -1.5| .77 -1.2|d .46 .39| 57.1 47.2| 1.00| .00| I0078 D | | 76 234 56 -1.22A .18| .68 -1.7| .73 -1.4|c .49 .39| 62.5 47.7| 1.00| .00| I0076 D | | 74 219 56 -.79A .16| .48 -3.2| .48 -3.2|b .52 .42| 62.5 45.5| 1.00| .00| I0074 D | | 53 56 56 -5.18A 1.82| .01 -1.2| .01 -1.3|a .00 .04|100.0 99.5| 1.00| -.01| I0053 A | |------------------------------------+----------+----------+-----------+-----------+-----+--------+---------| | MEAN 64.7 56.0 -1.63 .42| .99 .1| .99 .1| | 79.1 78.9| | | | | S.D. 56.2 .0 1.08 .24| .14 .6| .22 .7| | 15.4 15.6| | | | -------------------------------------------------------------------------------------------------------------
Table 13 shows the same sorts of analyses for persons (test takers) on the Grade Pre-1 test.
Notice that the sixth column of numbers indicates eight misfitting persons over the 1.30
threshold for mean squares (only three of those are similarly identified by the standardized z
statistic). Five persons appear to be overfitting with mean squares values below .75 (i.e., the
last five in column six), though only the last one is similarly identified as such by the

LINKING, VALIDATING, AND PREDICTING TOEFL IBT SCORES AT ADVANCED PROFICIENCY EIKEN LEVELS 29
©2012 Eiken Foundation of Japan
standardized z statistic. Given that these mean squares values are close to the .75 cut point,
these possible overfitters do not present a problem for the analysis.
Table 13 Rasch Person Statistics Grade Pre-1 (Anchored, in Misfit Order) -------------------------------------------------------------------------------------------- |ENTRY TOTAL MODEL| INFIT | OUTFIT |PT-MEASURE |EXACT MATCH| | |NUMBER SCORE COUNT MEASURE S.E. |MNSQ ZSTD|MNSQ ZSTD|CORR. EXP.| OBS% EXP%| person| |------------------------------------+----------+----------+-----------+-----------+-------| | 30 109 95 .08 .23|1.02 .2|2.37 3.2|A .08 .33| 78.9 78.0| 067 | | 6 119 95 .71 .27|1.63 2.1|2.15 2.1|B .16 .27| 76.8 83.9| 010 | | 42 99 95 -.41 .21|1.87 3.5|1.00 .1|C .43 .37| 84.2 72.7| 103 | | 35 119 95 .71 .27|1.64 2.2|1.24 .7|D .07 .27| 83.2 83.9| 076 | | 45 119 95 .71 .27|1.13 .6|1.53 1.2|E .35 .27| 74.7 83.9| 108 | | 53 122 95 .95 .29|1.51 1.7|1.06 .3|F .43 .25| 78.9 86.4| 126 | | 28 116 95 .50 .26|1.19 .8|1.43 1.1|G .28 .29| 75.8 82.1| 064 | | 49 119 95 .71 .27|1.41 1.5| .89 -.1|H .20 .27| 87.4 83.9| 117 | | 13 117 95 .56 .26|1.39 1.5|1.19 .6|I .26 .29| 81.1 82.8| 023 | | 3 117 95 .56 .26|1.05 .3|1.38 1.0|J .26 .29| 78.9 82.8| 005 | | 54 127 95 1.46 .35| .93 -.1|1.38 .8|K .15 .21| 91.6 91.0| 128 | | 39 109 95 .08 .23|1.35 1.5| .60 -1.4|L .35 .33| 84.2 78.0| 093 | | 8 110 95 .13 .23|1.28 1.3|1.33 1.0|M .24 .32| 69.5 78.4| 017 | | 44 86 95 -.93 .19|1.23 1.2|1.30 1.6|N .17 .40| 54.7 67.4| 106 | | 16 114 95 .37 .25|1.30 1.3|1.22 .7|O .27 .30| 77.9 80.6| 036 | | 47 120 95 .78 .28|1.28 1.1| .90 -.1|P .26 .27| 86.3 84.5| 114 | | 15 105 95 -.13 .22|1.03 .2|1.27 1.0|Q .34 .35| 71.6 75.9| 032 | | 48 97 95 -.49 .21|1.24 1.2|1.24 1.0|R .31 .37| 64.2 71.8| 116 | | 37 121 95 .86 .29|1.11 .5|1.24 .6|S .33 .26| 78.9 85.5| 087 | | 23 112 95 .25 .24|1.10 .5|1.22 .7|T .33 .31| 78.9 79.6| 050 | | 11 113 95 .31 .24|1.20 .9|1.18 .6|U .37 .31| 72.6 80.1| 021 | | 10 92 95 -.70 .20| .82 -.9|1.19 .9|V .36 .39| 75.8 69.7| 020 | | 5 106 95 -.08 .22|1.18 .9|1.02 .2|W .35 .34| 76.8 76.5| 008 | | 55 110 95 .13 .23|1.14 .7| .94 -.1|X .23 .32| 78.9 78.4| 131 | | 21 116 95 .50 .26|1.11 .5| .58 -1.1|Y .33 .29| 89.5 82.1| 047 | | 2 104 95 -.18 .22| .82 -.9|1.09 .4|Z .29 .35| 76.8 75.4| 002 | | 4 101 95 -.32 .21| .84 -.8|1.05 .3|z .18 .36| 75.8 73.8| 007 | | 31 107 95 -.03 .23| .86 -.6|1.03 .2|y .34 .34| 78.9 77.0| 072 | | 25 101 95 -.32 .21| .93 -.3|1.02 .2|x .32 .36| 73.7 73.8| 055 | | 36 111 95 .19 .24| .75 -1.2|1.02 .2|w .32 .32| 78.9 79.0| 078 | | 41 110 95 .13 .23| .85 -.7|1.02 .2|v .13 .32| 80.0 78.4| 098 | | BETTER FITTING OMITTED +----------+----------+ | | | | 43 103 95 -.22 .22| .93 -.3| .97 .0|u .37 .35| 74.7 74.9| 105 | | 12 113 95 .31 .24| .94 -.2| .67 -.9|t .41 .31| 83.2 80.1| 022 | | 24 109 95 .08 .23| .92 -.3| .64 -1.2|s .40 .33| 81.1 78.0| 054 | | 46 81 95 -1.12 .19| .92 -.4| .78 -1.4|r .50 .41| 67.4 66.0| 110 | | 50 110 95 .13 .23| .83 -.7| .91 -.2|q .31 .32| 80.0 78.4| 120 | | 17 97 95 -.49 .21| .74 -1.3| .90 -.4|p .40 .37| 68.4 71.8| 037 | | 1 94 95 -.62 .20| .81 -.9| .89 -.4|o .43 .38| 66.3 70.6| 001 | | 29 121 95 .86 .29| .89 -.3| .64 -.7|n .37 .26| 86.3 85.5| 065 | | 33 92 95 -.70 .20| .89 -.5| .81 -.9|m .50 .39| 74.7 69.7| 074 | | 7 95 95 -.58 .20| .87 -.6| .83 -.7|l .43 .38| 70.5 71.0| 015 | | 27 127 95 1.46 .35| .82 -.5| .50 -.8|k .30 .21| 91.6 91.0| 063 | | 19 105 95 -.13 .22| .82 -.8| .65 -1.3|j .46 .35| 80.0 75.9| 039 | | 51 110 95 .13 .23| .81 -.8| .77 -.6|i .28 .32| 82.1 78.4| 122 | | 40 109 95 .08 .23| .79 -1.0| .80 -.6|h .42 .33| 78.9 78.0| 096 | | 32 118 95 .63 .27| .78 -.8| .65 -.8|g .25 .28| 88.4 83.4| 073 | | 14 113 95 .31 .24| .76 -1.1| .57 -1.3|f .33 .31| 85.3 80.1| 025 | | 9 95 95 -.58 .20| .74 -1.4| .70 -1.4|e .46 .38| 76.8 71.0| 018 | | 26 123 95 1.04 .30| .72 -1.0| .63 -.7|d .31 .24| 91.6 87.3| 060 | | 56 106 95 -.08 .22| .64 -1.9| .65 -1.3|c .41 .34| 76.8 76.5| 132 | | 18 115 95 .43 .25| .64 -1.7| .53 -1.3|b .41 .30| 86.3 81.3| 038 | | 34 118 95 .63 .27| .54 -2.1| .51 -1.2|a .34 .28| 90.5 83.4| 075 | |------------------------------------+----------+----------+-----------+-----------+-------| | MEAN 109.7 95.0 .19 .24|1.02 .0| .99 .0| | 79.1 78.9| | | S.D. 10.2 .0 .57 .04| .27 1.1| .37 1.0| | 7.4 5.7| | --------------------------------------------------------------------------------------------
Now, turning to the Rasch analysis of the Grade 2 data, readers should again be able to
interpret Figure 3 based on the explanation of Figure 1 above. Note that these examinees

LINKING, VALIDATING, AND PREDICTING TOEFL IBT SCORES AT ADVANCED PROFICIENCY EIKEN LEVELS 30
©2012 Eiken Foundation of Japan
generally scored lower on this Grade 2 test than did those taking the other two tests. Indeed,
the logit ability scores were mostly negative, ranging from −2.40 to +0.64 with a mean of
−.84. Thus, this group of Grade 2 test takers had lower abilities relative to the grades 1 and
Pre-1 groups and relative to the item difficulties on the three tests. This makes sense given
that they were assigned to the Grade 2 test based on their lower TOEFL iBT scores (ranging
from 45 to 79).
Figure 3. Person/item map for Grade 2 -------------------------------------------------------------------------------- persons - MAP - items <more>|<rare> 1 + | | X T| | | XX | XX | 0 + XX S| XXX | XXXXX | X |T | I0025 | XXXXX M| -1 XX + I0013 I0016 I0077 XX | I0055 XXXX | XX | I0021 XX S| I0080 XX | I0005 I0063 X | X |S I0029 I0043 I0058 I0079 -2 + I0017 I0020 I0038 I0041 I0076 | I0018 I0036 I0039 I0072 I0081 X T| I0009 X | I0078 | I0022 I0026 I0037 I0040 I0044 I0045 | I0023 I0075 | | I0008 I0010 I0014 I0024 I0030 I0031 I0049 I0051 -3 + |M I0035 I0047 I0050 I0053 I0054 I0061 I0066 | I0082 | | I0003 I0006 I0019 I0027 I0046 I0062 I0069 I0071 I0073 | | | -4 + I0001 I0007 I0032 I0034 I0057 I0060 I0074 | | | |S | I0002 I0004 I0011 I0012 I0033 I0048 I0064 I0065 I0067 I0070 | | -5 + | | | | | |T | I0015 I0028 I0042 I0052 I0056 I0059 I0068 -6 + <less>|<frequ> --------------------------------------------------------------------------------
Table 14 shows the Rasch item statistics for the anchored analysis of the Grade 2 results
presented in misfit order. Again, the sixth column of numbers in Table 14 shows the mean
squares (MNSQ) infit statistics for each item. The mean squares values indicate that the first
four items are misfitting—one of them (Entry 82) quite dramatically so, with an MNSQ value

LINKING, VALIDATING, AND PREDICTING TOEFL IBT SCORES AT ADVANCED PROFICIENCY EIKEN LEVELS 31
©2012 Eiken Foundation of Japan
of 7.30. Three of the four are similarly identified as misfitting by the standardized z statistic.
Mean squares values under .75 (and/or z values of −2.00 or lower) are considered
overfitting items, which, as previously stated, are items that are in a sense too good to be true.
The mean squares values in column six indicate that there are eight such overfitting items for
the Grade 2 results (though none of them are shown to be overfitting by the standardized z
statistic). All eight of these items were easy to very easy for this group of persons.
Table 14 Rasch Item Statistics Grade 2 (Anchored, in Misfit Order) ------------------------------------------------------------------------------------------------------- |ENTRY TOTAL MODEL| INFIT | OUTFIT |PT-MEASURE |EXACT MATCH| | | |NUMBER SCORE COUNT MEASURE S.E. |MNSQ ZSTD|MNSQ ZSTD|CORR. EXP.| OBS% EXP%|DISPLACE| item G | |------------------------------------+----------+----------+-----------+-----------+--------+---------| | 82 102 39 -3.28A .64|7.30 4.4|6.29 3.3|A .54 .17| 69.2 94.0| 1.91| I0082 C | | 65 38 39 -4.68A 1.00|1.03 .3|2.61 1.3|B-.17 .11| 97.4 97.3| -.03| I0065 A | | 2 38 39 -4.68A 1.00|1.03 .3|2.02 1.1|C-.12 .11| 97.4 97.3| -.03| I0002 A | | 48 38 39 -4.68A 1.00|1.03 .3|2.02 1.1|D-.12 .11| 97.4 97.3| -.03| I0048 A | | 1 37 39 -3.95A .73|1.07 .3|1.88 1.1|E-.12 .15| 94.9 94.7| -.03| I0001 A | | 71 36 39 -3.50A .60|1.13 .4|1.86 1.3|F-.17 .19| 92.3 92.1| -.03| I0071 A | | 81 159 39 -2.10A .21|1.62 2.2|1.71 2.5|G .47 .49| 30.8 47.6| -.02| I0081 B | | 80 143 39 -1.50A .18|1.56 2.3|1.47 1.9|H .67 .54| 28.2 41.9| -.02| I0080 B | | 31 34 39 -2.91A .49|1.03 .2|1.55 1.2|I .06 .23| 87.2 86.9| -.03| I0031 A | | 29 28 39 -1.85A .37|1.28 1.6|1.50 2.0|J-.13 .30| 69.2 72.5| -.03| I0029 A | | 54 35 39 -3.17A .53|1.07 .3|1.46 .9|K .02 .21| 89.7 89.4| -.03| I0054 A | | 77 128 39 -1.04A .17|1.30 1.4|1.41 1.8|L .32 .57| 25.6 39.8| -.02| I0077 B | | 61 35 39 -3.17A .53| .99 .1|1.40 .8|M .09 .21| 89.7 89.4| -.03| I0061 A | | 6 36 39 -3.50A .60|1.08 .3|1.38 .7|N-.02 .19| 92.3 92.1| -.03| I0006 A | | 35 35 39 -3.17A .53|1.09 .4|1.31 .7|O .01 .21| 89.7 89.4| -.03| I0035 A | | 23 33 39 -2.68A .45|1.11 .5|1.25 .7|P .04 .25| 84.6 84.2| -.03| I0023 A | | 40 32 39 -2.49A .43|1.10 .5|1.25 .8|Q .07 .26| 82.1 81.7| -.02| I0040 A | | 38 29 39 -1.99A .38|1.03 .2|1.19 .8|R .19 .29| 79.5 74.7| -.03| I0038 A | | 9 31 39 -2.31A .41|1.12 .6|1.18 .7|S .07 .27| 76.9 79.2| -.03| I0009 A | | 47 35 39 -3.17A .53|1.09 .4|1.17 .5|T .04 .21| 89.7 89.4| -.03| I0047 A | | 32 37 39 -3.95A .73| .95 .1|1.16 .5|U .15 .15| 94.9 94.7| -.03| I0032 A | | 74 37 39 -3.95A .73| .95 .1|1.16 .5|V .15 .15| 94.9 94.7| -.03| I0074 A | | 43 28 39 -1.85A .37|1.10 .7|1.07 .4|W .17 .30| 64.1 72.5| -.03| I0043 A | | 17 29 39 -1.99A .38|1.08 .5|1.01 .1|X .20 .29| 69.2 74.7| -.03| I0017 A | | 72 30 39 -2.15A .40|1.06 .4|1.08 .4|Y .19 .28| 76.9 77.0| -.02| I0072 A | | 16 21 39 -.99A .34|1.07 .7|1.04 .4|Z .25 .33| 53.8 64.2| -.02| I0016 A | | BETTER FITTING OMITTED +----------+----------+ | | | | | 8 34 39 -2.91A .49| .94 -.1| .68 -.6|z .35 .23| 87.2 86.9| -.03| I0008 A | | 73 36 39 -3.50A .60| .94 .0| .61 -.5|y .31 .19| 92.3 92.1| -.03| I0073 A | | 12 38 39 -4.68A 1.00| .94 .2| .46 -.2|x .23 .11| 97.4 97.3| -.03| I0012 A | | 58 28 39 -1.85A .37| .93 -.4| .92 -.3|w .38 .30| 74.4 72.5| -.03| I0058 A | | 62 36 39 -3.50A .60| .92 .0| .65 -.4|v .30 .19| 92.3 92.1| -.03| I0062 A | | 57 37 39 -3.95A .73| .91 .1| .56 -.4|u .30 .15| 94.9 94.7| -.03| I0057 A | | 79 152 39 -1.82A .19| .75 -1.1| .90 -.3|t .31 .51| 69.2 44.1| -.02| I0079 B | | 3 36 39 -3.50A .60| .89 -.1| .57 -.6|s .36 .19| 92.3 92.1| -.03| I0003 A | | 60 37 39 -3.95A .73| .89 .0| .53 -.4|r .33 .15| 94.9 94.7| -.03| I0060 A | | 66 35 39 -3.17A .53| .87 -.2| .60 -.7|q .40 .21| 89.7 89.4| -.03| I0066 A | | 55 22 39 -1.10A .34| .87 -1.2| .84 -1.3|p .50 .33| 71.8 64.6| -.02| I0055 A | | 53 35 39 -3.17A .53| .87 -.2| .63 -.6|o .40 .21| 89.7 89.4| -.03| I0053 A | | 33 38 39 -4.68A 1.00| .86 .2| .28 -.5|n .35 .11| 97.4 97.3| -.03| I0033 A | | 75 33 39 -2.68A .45| .86 -.4| .77 -.5|m .41 .25| 84.6 84.2| -.03| I0075 A | | 22 32 39 -2.49A .43| .86 -.5| .80 -.5|l .43 .26| 82.1 81.7| -.02| I0022 A | | 20 29 39 -1.99A .38| .84 -.8| .75 -1.0|k .50 .29| 79.5 74.7| -.03| I0020 A | | 27 36 39 -3.50A .60| .81 -.3| .47 -.8|j .46 .19| 92.3 92.1| -.03| I0027 A | | 45 32 39 -2.49A .43| .77 -.9| .57 -1.3|i .58 .26| 82.1 81.7| -.02| I0045 A | | 76 157 39 -2.02A .20| .63 -1.7| .69 -1.4|h .55 .50| 43.6 46.6| -.02| I0076 B | | 15 39 39 -5.91A 1.80| .01 -1.2| .01 -1.2|g .00 .06|100.0 99.2| -.04| I0015 A | | 28 39 39 -5.91A 1.80| .01 -1.2| .01 -1.2|f .00 .06|100.0 99.2| -.04| I0028 A | | 42 39 39 -5.91A 1.80| .01 -1.2| .01 -1.2|e .00 .06|100.0 99.2| -.04| I0042 A | | 52 39 39 -5.91A 1.80| .01 -1.2| .01 -1.2|d .00 .06|100.0 99.2| -.04| I0052 A | | 56 39 39 -5.91A 1.80| .01 -1.2| .01 -1.2|c .00 .06|100.0 99.2| -.04| I0056 A | | 59 39 39 -5.91A 1.80| .01 -1.2| .01 -1.2|b .00 .06|100.0 99.2| -.04| I0059 A | | 68 39 39 -5.91A 1.80| .01 -1.2| .01 -1.2|a .00 .06|100.0 99.2| -.04| I0068 A | |------------------------------------+----------+----------+-----------+-----------+--------+---------| | MEAN 43.0 39.0 -3.17 .65| .99 .1| .98 .0| | 83.4 83.8| | | | S.D. 31.7 .0 1.31 .41| .76 .8| .76 .9| | 16.3 14.6| | | -------------------------------------------------------------------------------------------------------

LINKING, VALIDATING, AND PREDICTING TOEFL IBT SCORES AT ADVANCED PROFICIENCY EIKEN LEVELS 32
©2012 Eiken Foundation of Japan
Table 15 shows the same sorts of analyses for persons on the Grade 2 test. Notice that the
sixth and seventh columns of numbers indicate 11 misfitting persons, who are over the 1.30
threshold for mean squares, but only one of whom was over the 2.00 threshold for
standardized z. One person also appears to be overfitting, with mean squares values
below .75 (i.e., the last entry with a value of .68). Given that these mean squares values are
close to the .75 cut point, and the fact that the standardized z statistics do not indicate overfit,
these possible overfitters do not present a problem for the analysis.
Table 15 Rasch Person Statistics Grade 2 (Anchored, in Misfit Order) -------------------------------------------------------------------------------------------- |ENTRY TOTAL MODEL| INFIT | OUTFIT |PT-MEASURE |EXACT MATCH| | |NUMBER SCORE COUNT MEASURE S.E. |MNSQ ZSTD|MNSQ ZSTD|CORR. EXP.| OBS% EXP%| person| |------------------------------------+----------+----------+-----------+-----------+-------| | 31 99 82 -.07 .37|1.08 .3|2.77 1.8|A .10 .26| 89.0 90.0| 101 | | 10 97 82 -.33 .34|1.19 .7|1.72 1.1|B .29 .28| 82.9 88.3| 043 | | 5 95 82 -.55 .32|1.31 1.1|1.61 1.0|C .22 .31| 90.2 86.6| 029 | | 14 91 82 -.92 .29|1.57 2.0|1.14 .4|D .39 .34| 76.8 83.7| 052 | | 18 101 82 .24 .41|1.54 1.4| .95 .2|E .16 .23| 92.7 92.1| 066 | | 27 87 82 -1.23 .27|1.46 1.8|1.27 .7|F .39 .37| 70.7 80.9| 092 | | 25 97 82 -.33 .34|1.34 1.1|1.45 .8|G .27 .28| 82.9 88.3| 085 | | 13 83 82 -1.50 .25| .97 -.1|1.43 1.1|H .29 .40| 82.9 78.2| 051 | | 8 92 82 -.83 .30|1.41 1.5| .74 -.3|I .40 .33| 80.5 84.4| 034 | | 37 90 82 -1.00 .28|1.39 1.5| .64 -.6|J .38 .35| 90.2 83.0| 129 | | 34 97 82 -.33 .34|1.07 .3|1.37 .7|K .28 .28| 89.0 88.3| 112 | | 16 98 82 -.20 .36|1.37 1.1| .54 -.5|L .35 .27| 87.8 89.1| 061 | | 33 87 82 -1.23 .27|1.33 1.4| .67 -.7|M .46 .37| 84.1 80.9| 109 | | 30 98 82 -.20 .36|1.33 1.0| .65 -.3|N .23 .27| 92.7 89.1| 097 | | 9 86 82 -1.30 .26|1.31 1.3|1.10 .4|O .30 .38| 76.8 80.3| 035 | | 2 97 82 -.33 .34| .99 .1|1.30 .6|P .24 .28| 87.8 88.3| 004 | | 39 99 82 -.07 .37|1.20 .7| .46 -.6|Q .32 .26| 92.7 90.0| 133 | | 23 86 82 -1.30 .26|1.11 .5|1.19 .6|R .36 .38| 75.6 80.3| 082 | | 19 98 82 -.20 .36|1.18 .7|1.11 .4|S .26 .27| 84.1 89.1| 068 | | 15 78 82 -1.80 .24|1.13 .7|1.07 .3|T .43 .43| 76.8 75.0| 057 | | 4 97 82 -.33 .34|1.09 .4| .46 -.7|s .33 .28| 89.0 88.3| 026 | | 24 92 82 -.83 .30|1.09 .4| .96 .1|r .37 .33| 80.5 84.4| 083 | | 12 100 82 .08 .39|1.09 .4| .90 .1|q .24 .25| 91.5 91.0| 046 | | 32 92 82 -.83 .30| .99 .0|1.01 .2|p .32 .33| 80.5 84.4| 104 | | 26 92 82 -.83 .30|1.01 .1| .83 -.1|o .34 .33| 85.4 84.4| 086 | | 17 81 82 -1.62 .25| .74 -1.3|1.00 .1|n .38 .41| 79.3 76.9| 062 | | 1 81 82 -1.62 .25| .90 -.4| .99 .1|m .45 .41| 79.3 76.9| 003 | | 6 88 82 -1.15 .27| .99 .0| .93 .0|l .36 .37| 84.1 81.5| 031 | | 35 70 82 -2.24 .23| .98 .0| .99 .0|k .45 .46| 65.9 71.4| 115 | | 38 100 82 .08 .39| .98 .1| .63 -.3|j .32 .25| 89.0 91.0| 130 | | 21 67 82 -2.40 .23| .98 -.1| .98 .0|i .49 .47| 72.0 70.4| 080 | | 3 90 82 -1.00 .28| .96 -.1| .76 -.4|h .39 .35| 82.9 83.0| 016 | | 22 83 82 -1.50 .25| .93 -.2| .68 -.8|g .48 .40| 80.5 78.2| 081 | | 20 103 82 .64 .48| .92 .0| .20 -1.1|f .25 .20| 96.3 94.2| 077 | | 28 77 82 -1.86 .24| .88 -.6| .90 -.2|e .42 .43| 75.6 74.4| 094 | | 7 84 82 -1.43 .26| .82 -.8| .84 -.3|d .39 .39| 80.5 78.8| 033 | | 36 88 82 -1.15 .27| .82 -.7| .79 -.3|c .33 .37| 82.9 81.5| 124 | | 11 101 82 .24 .41| .77 -.6| .38 -.8|b .35 .23| 91.5 92.1| 044 | | 29 85 82 -1.37 .26| .68 -1.5| .70 -.7|a .41 .39| 80.5 79.6| 095 | |------------------------------------+----------+----------+-----------+-----------+-------| | MEAN 90.4 82.0 -.84 .31|1.10 .4| .98 .1| | 83.4 83.8| | | S.D. 8.6 .0 .72 .06| .22 .8| .44 .6| | 6.7 5.9| | --------------------------------------------------------------------------------------------
In this section, we have shown how the EIKEN common-scale scores were derived to
connect the three levels of tests for grades 2, Pre-1, and 1 to a single common scale. That
single common scale will figure in a number of the analyses that follow. As such, this section

LINKING, VALIDATING, AND PREDICTING TOEFL IBT SCORES AT ADVANCED PROFICIENCY EIKEN LEVELS 33
©2012 Eiken Foundation of Japan
will serve as the basis for the rest of the study, and though it was fairly complex, it was
presented first in the Results section.
In addition, this section serves to demonstrate how the STEP organization could proceed
in creating such a common logit scale across levels of the EIKEN tests. More detailed
information is given in appendices D through G regarding how the Winsteps™ program was
actually run. Creating such a common logit scale across the top three or four grades of the
EIKEN tests could be quite advantageous to the STEP organization. STEP could run a larger-
scale TOEFL equating study of its own by offering free TOEFL tests to subsets of EIKEN
examinees (in exchange for score reports from ETS) and then creating a common logit scale
across grades as demonstrated in this section.
The equating could then be accomplished as shown in the Regression Analyses
subsection below. Basically, the process would involve using simple regression with the
EIKEN common-scale score as the predictor variable and the TOEFL iBT scores as the
predicted variable, and creating tables of equivalents as shown in the Regression Analyses
subsection.
Means Comparisons
Three means-comparison analyses were performed in this study: (a) a single-sample t-test
with the Hawaii sample in this study (n = 122) being compared in terms of EIKEN common-
scale scores on the test to a large population (n = 44,655) of examinees taking the same tests
in Japan; (b) a one-way ANOVA comparing the means for the three grade levels with their
TOEFL iBT scores as the dependent variable; and (c) another one-way ANOVA comparing
the means for the three grade levels with their EIKEN common-scale scores as the dependent
variable. Because three separate analyses are performed in this single study, all comparison-
wise significance tests will be interpreted at the conservative alpha = .01 level to help
maintain an experiment-wise alpha of at least .05.
Single-sample t-test. The goal of the single-sample t-test was to determine how the
Hawaii sample in this study (n = 122) fit into the larger picture of examinees who normally
take the upper three grade-level EIKEN tests in Japan. To that end, data were assembled to
represent the larger population of examinees in Japan (n = 44,655). These data were
combined with the Hawaii sample, and a Rasch analysis was run to calculate the EIKEN
common-scale scores for the written first-stage (reading, listening, and writing) total scores,
which were the only three subtests that all of the students had taken, given the fact that the
speaking test is normally only administered to examinees who pass the written test.

LINKING, VALIDATING, AND PREDICTING TOEFL IBT SCORES AT ADVANCED PROFICIENCY EIKEN LEVELS 34
©2012 Eiken Foundation of Japan
The results of the single-sample t-test indicate that the mean of 1.37 (SD = .7415) for the
Hawaii sample was significantly different from the population mean of −.0026 (SD = .7598)
(t = 20.52; df = 121; p < .01, two-tailed). Further analyses found that the power was 1.00
(meaning that there was sufficient power in this design to avoid Type II errors) and the eta
squared was .009 (meaning that less than 1% of the variance in these logit scores was
accounted for by the mean of the Hawaii group differing from the mean of the population).
The box-and-whisker plot in Figure 4a shows the distribution of EIKEN common-scale
scores (across grades 1, Pre-1, and 2 RLW total scores) for the Hawaii sample in this study
(on the left), side-by-side with the distribution for the population of examinees in Japan.
Notice that the distribution of scores for the population has a mean very close to zero and
that the scores range widely from a high of nearly +6.00 to a low of beyond −3.00. Compared
to that population, the Hawaii sample generally scored higher with its mean of 1.37. Given
that these box-and-whisker plots are divided into quartiles, it is clear that more than three
quarters of the Hawaii sample falls in the top quartile of scores for the population. This is
probably as it should be, given that the Hawaii sample is made up of people with the fairly
high TOEFL iBT scores generally found among people studying in the United States.
Figure 4a. Box-and-whisker plot comparing the distribution of scores for the Hawaii sample (at left) with that for the population in Japan

LINKING, VALIDATING, AND PREDICTING TOEFL IBT SCORES AT ADVANCED PROFICIENCY EIKEN LEVELS 35
©2012 Eiken Foundation of Japan
Figure 4b shows that the Hawaii sample, with its mean of 1.37 (SD = .7415), is more like
the population of Japanese examinees who passed their respective EIKEN tests (grades 1,
Pre-1, or 2) with their EIKEN common-scale score mean of .9203 (SD = .5903). This makes
sense given that the examinees in Hawaii were assigned to their respective groups because
they were predicted (on the basis of their TOEFL iBT scores) to pass their respective tests.
Figure 4b. Box-and-whisker plot comparing the distribution of scores for the Hawaii sample (at left) with that for the population of people who passed their EIKEN Grade 1, Pre-1, or 2 tests in Japan
One-way ANOVA comparing grade levels on TOEFL iBT scores. Table 16 shows the
descriptive statistics for the TOEFL iBT scores of the examinees who took the three grade-
level tests. They are shown for each grade separately and together. Notice that in the right-
hand column the three groups were not the same in size: there were 28 in Grade 1, 56 in
Grade Pre-1, and 38 in Grade 2, for a total of 122 examinees. Clearly, the mean (M) for those
examinees who took the Grade 1 EIKEN test was the highest at 106.54, meaning that these
students had the highest average proficiency according to their TOEFL iBT scores; followed
by the Grade Pre-1 examinees, with a mean of 89.11; and the Grade 2 examinees, with a
mean of 67.84. Note also that Grade 1 had the lowest standard deviation (SD), at 4.849,
meaning that these examinees varied less from one another than did those in the other two
groups. Grade Pre-1 and Grade 2 varied to increasing degrees, with standard deviations of
5.723 and 8.964, respectively.
Table 16 Descriptive Statistics for the TOEFL iBT Scores of the Three Grades Grade M SD N
Grade 1 106.54 4.85 28
Grade Pre-1 89.11 5.72 56
Grade 2 67.84 8.96 38
Total 86.48 15.81 122
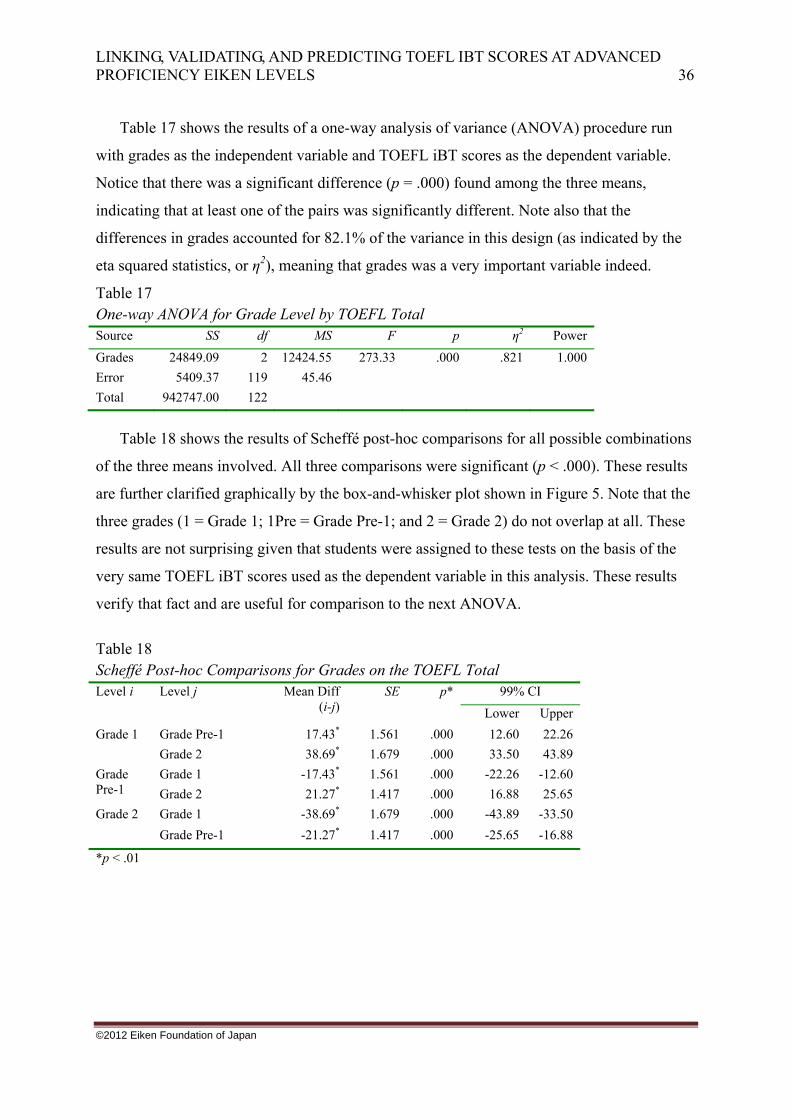
LINKING, VALIDATING, AND PREDICTING TOEFL IBT SCORES AT ADVANCED PROFICIENCY EIKEN LEVELS 36
©2012 Eiken Foundation of Japan
Table 17 shows the results of a one-way analysis of variance (ANOVA) procedure run
with grades as the independent variable and TOEFL iBT scores as the dependent variable.
Notice that there was a significant difference (p = .000) found among the three means,
indicating that at least one of the pairs was significantly different. Note also that the
differences in grades accounted for 82.1% of the variance in this design (as indicated by the
eta squared statistics, or η2), meaning that grades was a very important variable indeed.
Table 17 One-way ANOVA for Grade Level by TOEFL Total Source SS df MS F p η2 Power
Grades 24849.09 2 12424.55 273.33 .000 .821 1.000
Error 5409.37 119 45.46
Total 942747.00 122
Table 18 shows the results of Scheffé post-hoc comparisons for all possible combinations
of the three means involved. All three comparisons were significant (p < .000). These results
are further clarified graphically by the box-and-whisker plot shown in Figure 5. Note that the
three grades (1 = Grade 1; 1Pre = Grade Pre-1; and 2 = Grade 2) do not overlap at all. These
results are not surprising given that students were assigned to these tests on the basis of the
very same TOEFL iBT scores used as the dependent variable in this analysis. These results
verify that fact and are useful for comparison to the next ANOVA.
Table 18 Scheffé Post-hoc Comparisons for Grades on the TOEFL Total Level i Level j Mean Diff
(i-j)SE p* 99% CI
Lower Upper
Grade 1 Grade Pre-1 17.43* 1.561 .000 12.60 22.26
Grade 2 38.69* 1.679 .000 33.50 43.89
Grade Pre-1
Grade 1 -17.43* 1.561 .000 -22.26 -12.60
Grade 2 21.27* 1.417 .000 16.88 25.65
Grade 2 Grade 1 -38.69* 1.679 .000 -43.89 -33.50
Grade Pre-1 -21.27* 1.417 .000 -25.65 -16.88
*p < .01

LINKING, VALIDATING, AND PREDICTING TOEFL IBT SCORES AT ADVANCED PROFICIENCY EIKEN LEVELS 37
©2012 Eiken Foundation of Japan
Figure 5. Box-and-whisker plot for grade level on the total TOEFL iBT
One-way ANOVA comparing grade levels on EIKEN common-scale scores. Table 19
shows the descriptive statistics for the EIKEN common-scale scores of the examinees who
took the three grade-level tests. These common-scale scores are for the total EIKEN with all
sub-sections: reading, listening, writing, and speaking. They are shown for each grade
separately and together. Clearly, the mean (M) for those examinees who took the Grade 1
EIKEN test was the highest at .7450, meaning that these students had the highest average
proficiency according to the EIKEN common-scale scores; followed by the Grade Pre-1
examinees with a mean of .1896; and the Grade 2 examinees with a mean of −.8361. Note
also that Grade Pre-1 had the lowest standard deviation (SD) at .5736, meaning that these
examinees varied less from one another than did the other two groups. Grade 1 and Grade 2
varied to increasing degrees, with standard deviations of .5936 and .7364, respectively.
Table 19 Descriptive Statistics for Grades on the EIKEN Total Level M SD N
Grade 1 .7450 .5936 28
Grade Pre-1 .1896 .5736 56
Grade 2 -.8361 .7364 38
Total -.0091 .8705 122
Table 20 shows the results of a one-way analysis of variance (ANOVA) procedure run
with grades as the independent variable and EIKEN total common-scale scores (RLWS) as
the dependent variable. Notice in Table 20 that there was a significant difference (p = .000)
found among the three means, meaning that at least one of the pairs was significantly
different. Note also that the differences in grades accounted for 48.1% of the variance in this
design (as indicated by the eta squared statistics, or η2), meaning that “Grades” was an
important variable.

LINKING, VALIDATING, AND PREDICTING TOEFL IBT SCORES AT ADVANCED PROFICIENCY EIKEN LEVELS 38
©2012 Eiken Foundation of Japan
Table 20 One-way ANOVA for Grade Levels on the EIKEN Total Source SS df MS F p η2 Power
Grades 44.12 2 22.06 55.08 .000 .481 1.000
Error 47.66 119 .40
Total 92.78 122
Notice also that Table 21 shows the results of Scheffé post-hoc comparisons for all possible
combinations of the three means involved. All three comparisons were significant (p < .01).
These results are further illustrated graphically by the box-and-whisker plot shown in Figure
6. Note that the three grades (Grade 1 Pre = Grade Pre-1) do overlap somewhat—more so for
grades 1 and Pre-1 than for grades Pre-1 and 2, or Grade 1 and Grade 2. These results support
the idea of using the TOEFL iBT scores to assign students to these three grade levels.
Table 21 Scheffé Post-hoc Comparisons for Level by Total EIKEN Score Level i Level j Mean diff
(i-j) SE p* 99% CI
Lower Upper
Grade 1 Grade Pre-1 .5554* .14648 .001 .1923 .9185
Grade 2 1.5811* .15762 .000 1.1903 1.9718
Grade Pre-1
Grade 1 -.5554* .14648 .001 -.9185 -.1923
Grade 2 1.0257* .13301 .000 .6960 1.3554
Grade 2 Grade 1 -1.5811* .15762 .000 -1.9718 -1.1903
Grade Pre-1 -1.0257* .13301 .000 -1.3554 -.6960
*p < .01
Figure 6. Box-and-whisker plot for grade level by total EIKEN score
Correlational Analyses
A number of variables (in this case, subtest scores or various combinations of subtest
scores) will be analyzed in terms of correlation coefficients, principal components analyses,

LINKING, VALIDATING, AND PREDICTING TOEFL IBT SCORES AT ADVANCED PROFICIENCY EIKEN LEVELS 39
©2012 Eiken Foundation of Japan
and regression analyses here and in the next two sections.
Descriptive statistics. Table 22 shows the descriptive statistics, including the number of
persons (N); the minimum (Min) and maximum (Max) values in the set; the mean (M); the
standard deviation (SD); and the skew statistic (Skew) with its standard error (SES). The
variables include the common-scale scores for the EIKEN reading, listening, writing, and
speaking subtests in various combinations (abbreviated as follows: EikR, EikL, EikW, EikS,
EikRL, EikRLW, and EikRLWS); as well as the TOEFL iBT scores for the reading, listening,
writing, and speaking subtests and their total (abbreviated as follows: TflR, TflL, TflW, TflS,
and TflTotal).
Table 22 Descriptive Statistics for Various EIKEN and TOEFL Subtests and Subtest Combinations
The number of people was the same in all cases (N = 122). For the EIKEN subtests, the
minimum logit values ranged from −2.40 to −5.46, while the maximum values ranged from
+2.20 to +6.36. The means for the single EIKEN subtests in logit scores ranged from +.0385
to .2919, while the combined subtests were lower ranging, from −.0024 to .0212. The
difference between the single and combined subtests may have resulted from interactions in
the scores of individuals on various subtests or regression to the mean. The standard
deviations for the single EIKEN subtests logit scores ranged from 1.13568 to 1.67520, but
were a bit lower for the combined subtests (ranging from .87090 to 1.01882). Again, this
difference may be attributable to interactions in the scores of individuals on various subtests
or to regression to the mean. The skew statistics for the EIKEN subtests indicate that only
one of the distributions was skewed; that is, the common-scale scores for the EIKEN
speaking test produced a skew statistic of .743, which is greater than two times the standard
Test N Min Max M SD Skew SES
EikR 122 -2.85 3.43 .0385 1.1357 .030 .219
EikW 122 -5.46 3.56 .2919 1.6752 -.436 .219
EikL 122 -2.84 3.70 .1074 1.3824 .240 .219
EikS 122 -3.21 6.36 .1372 1.6535 .743 .219
EikRLWS 122 -2.40 2.20 -.0024 .8709 -.358 .219
EikRLW 122 -2.58 2.86 .0175 .9759 -.138 .219
EikRL 122 -2.68 2.64 .0212 1.0188 -.089 .219
TflR 122 5.00 30.00 22.29 5.84 -.870 .219
TflL 122 5.00 30.00 22.32 5.67 -.751 .219
TflW 122 3.00 30.00 21.59 4.50 -.662 .219
TflS 122 10.00 30.00 20.29 3.793 .595 .219
TotTfl 122 47.00 119.00 86.48 15.814 -.325 .219

LINKING, VALIDATING, AND PREDICTING TOEFL IBT SCORES AT ADVANCED PROFICIENCY EIKEN LEVELS 40
©2012 Eiken Foundation of Japan
error of skew (which is 2 × .219 = .438). This distribution appears to be positively skewed.
For the TOEFL iBT subtests, the minimum values ranged from 3 to 10, while the
maximum values were all 30, except of course the total scores, which had a maximum of 119.
The means for the single subtests ranged from 20.29 to 22.32, and the mean was 86.48 for the
total TOEFL scores. The standard deviations for the TOEFL iBT subtests ranged from 3.79 to
5.84. The skew statistics for the TOEFL iBT reading, listening, and writing subtests were all
negatively skewed, with skew statistics ranging from −.662 to −.870, while the speaking
scores were all positively skewed, with a skew value of .595. All of the skew statistics for the
TOEFL subtests were greater than two times the standard error of skew (which is 2 × .219
= .438). Thus these distributions appear to be skewed. Interestingly, following the same
reasoning, the total TOEFL iBT scores do not appear to be skewed, possibly because the
positive skew of the speaking scores balanced out the negative skew of the other subtests. It
is worth noting that the speaking scores in this sample may have been different from the
speaking scores of the overall population of TOEFL examinees because these examinees
were all living in the English-speaking environment of Hawai‘i.
Correlation coefficients. Table 23 shows the correlation coefficients (above the diagonal
line of 1.00s that divides the table in half) for all possible combinations of the subtests of the
EIKEN and TOEFL iBT tests described in Table 22. The values given below the diagonal are
the coefficients of determination; these are the squared values for each of the correlation
coefficients above the diagonal. They are interesting because, unlike correlation coefficients,
the coefficients of determination indicate the proportion of variance that overlaps between the
two variables. Thus, the correlation coefficient of .46 between the EikR and EikL could be
interpreted as indicating a moderate relationship—nothing more precise—whereas the
corresponding coefficient of determination of .21 for the same two variables indicates that
21% of the variance in the EikR scores overlaps with variance in the EikL scores. Stated
another way, 21% of the variance in the EikR scores is accounted for by the variance in EikL
scores.
In terms of any overall pattern, note that all variables are significantly correlated with
all other variables. Beyond that, we can only point out the rather unremarkable conclusion
that all of the EIKEN and TOEFL subtests correlate with each other in the low to moderate
range, with the combined subtests correlating higher because they include variables with
which they are being correlated. Nonetheless, there is clearly shared variance here, and
nothing strange appears to be showing up in these relationships (like, say, a negative

LINKING, VALIDATING, AND PREDICTING TOEFL IBT SCORES AT ADVANCED PROFICIENCY EIKEN LEVELS 41
©2012 Eiken Foundation of Japan
correlation coefficient). The correlation coefficients shown here served as the basis for the
principal components analyses discussed in the next section.
Table 23 Correlation Coefficients and Coefficients of Determination for Various EIKEN and TOEFL Subtests and Subtest Combinations
Principal Components Analyses
In an attempt to make some sense of the correlation matrix shown in Table 23, we chose
to use factor-analytic techniques to analyze the common-scale scores for the four EIKEN
reading, listening, writing, and speaking subtests and the four TOEFL iBT reading, listening,
writing, and speaking subtests, for a total of eight variables. Within the general category of
factor-analytic techniques, we chose the principal components analysis (PCA) subcategory
rather than the factor analysis subcategory because PCA is more appropriate when
researchers are exploring; that is, when they have no particular theory (formal or informal)
about how many components there might be and which variables might fit into each.
Figure 7 shows a scree plot of the relationship between the eigenvalues (on the vertical
axis) and the number of components in the analysis (on the horizontal axis). The point at
which the line turns sharply to the right appears to be at two factors. Traditionally, this would
indicate that a one-component solution would be appropriate. However, given that a second
component had an eigenvalue very near to the traditional cut point of 1.00, we decided to run
both one- and two-component solutions. We tried several orthogonal and oblique rotation
methods and got very similar results regardless of method. We settled on Varimax rotation
EikR EikL EikW EikS Eik RLWS
Eik RLW
EikRL TflR TflL TflW TflS TotTfl
EikR 1.00 0.46 0.52 0.40 0.79 0.87 0.88 0.53 0.60 0.51 0.37 0.65
EikL 0.21 1.00 0.34 0.39 0.68 0.74 0.79 0.34 0.59 0.36 0.55 0.57
EikW 0.28 0.12 1.00 0.44 0.67 0.67 0.52 0.47 0.51 0.44 0.29 0.55
EikS 0.16 0.15 0.19 1.00 0.77 0.47 0.45 0.39 0.49 0.49 0.56 0.59
EikRLWS 0.62 0.47 0.45 0.60 1.00 0.89 0.87 0.56 0.70 0.60 0.57 0.77
EikRLW 0.75 0.54 0.44 0.22 0.79 1.00 0.97 0.53 0.67 0.53 0.48 0.70
EikRL 0.78 0.62 0.27 0.21 0.75 0.94 1.00 0.54 0.68 0.53 0.50 0.71
TflR 0.28 0.12 0.22 0.15 0.31 0.28 0.29 1.00 0.53 0.61 0.27 0.80
TflL 0.36 0.35 0.26 0.24 0.49 0.45 0.47 0.28 1.00 0.61 0.56 0.86
TflW 0.26 0.13 0.20 0.24 0.36 0.28 0.28 0.38 0.37 1.00 0.43 0.83
TflS 0.14 0.31 0.09 0.31 0.33 0.23 0.25 0.07 0.31 0.19 1.00 0.66
TotTfl 0.42 0.33 0.30 0.35 0.59 0.49 0.51 0.64 0.74 0.69 0.44 1.00
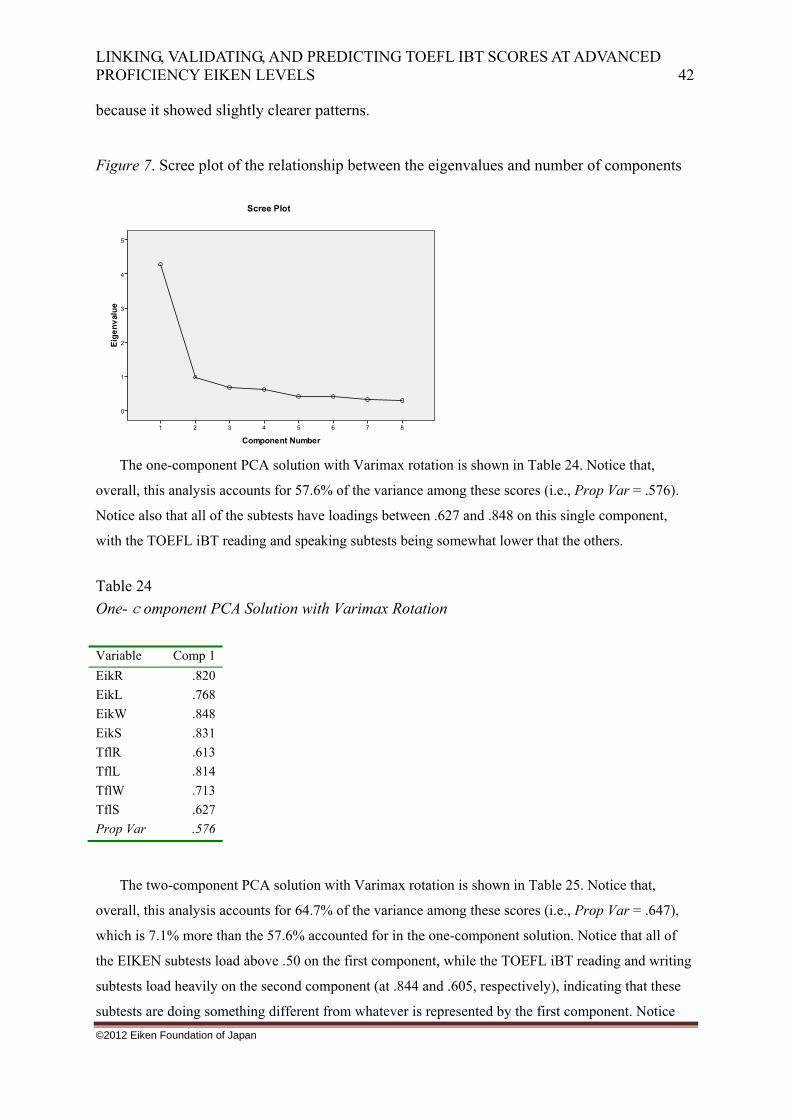
LINKING, VALIDATING, AND PREDICTING TOEFL IBT SCORES AT ADVANCED PROFICIENCY EIKEN LEVELS 42
©2012 Eiken Foundation of Japan
because it showed slightly clearer patterns.
Figure 7. Scree plot of the relationship between the eigenvalues and number of components
The one-component PCA solution with Varimax rotation is shown in Table 24. Notice that,
overall, this analysis accounts for 57.6% of the variance among these scores (i.e., Prop Var = .576).
Notice also that all of the subtests have loadings between .627 and .848 on this single component,
with the TOEFL iBT reading and speaking subtests being somewhat lower that the others.
Table 24
One-component PCA Solution with Varimax Rotation
The two-component PCA solution with Varimax rotation is shown in Table 25. Notice that,
overall, this analysis accounts for 64.7% of the variance among these scores (i.e., Prop Var = .647),
which is 7.1% more than the 57.6% accounted for in the one-component solution. Notice that all of
the EIKEN subtests load above .50 on the first component, while the TOEFL iBT reading and writing
subtests load heavily on the second component (at .844 and .605, respectively), indicating that these
subtests are doing something different from whatever is represented by the first component. Notice
Variable Comp 1
EikR .820
EikL .768
EikW .848
EikS .831
TflR .613
TflL .814
TflW .713
TflS .627
Prop Var .576

LINKING, VALIDATING, AND PREDICTING TOEFL IBT SCORES AT ADVANCED PROFICIENCY EIKEN LEVELS 43
©2012 Eiken Foundation of Japan
that the TOEFL iBT listening and speaking subtests load most heavily with all the EIKEN subtests.
Put another way, the EIKEN common-scale scores load most heavily on the first component, whereas
the TOEFL iBT scores appear to be spread across the two components, with the reading and writing
subtests on component 2 and the listening and speaking subtests on component 1 with all the EIKEN
subtests. Clearly, there is much overlap in what the EIKEN and TOEFL subtests measure and how,
but there are also some differences. This analysis seems to indicate that all but three subtests are
loading above .35 on both components. The other five subtests are therefore complex (i.e., loading on
both). The three that are not complex (EikL, TflR, and TflS) point to the possibility that the first
component is more related to oral skills (listening and speaking), while the second component is more
related to written skills (reading and writing). This interpretation is supported by the fact that the two
highest loadings for the TOEFL iBT subtests on the second component are TflR and TflW, which
both relate to written skills. Whatever is going on, however, it appears to be happening to a lesser or
greater degree on the two components for five of the subtests.
Table 25 Two-component PCA Solution with Varimax Rotation
Regression Analyses
The descriptive statistics and correlational analyses above should also help readers to interpret the
regression analyses that are discussed in this section. This section will describe the one step-wise
multiple regression analysis and three simple regression analyses that were performed. These will be
explained in turn, but they are all based on some of the same variables as those described in previous
sections.
Table 26 shows the results of a stepwise multiple regression analysis, with the TOEFL iBT total
scores as the dependent variable and the EIKEN common-scale score reading, listening, writing, and
speaking subtests entered as potential independent variables. Notice that the first step used the EIKEN
reading scores as the only independent variable, and the results show a statistically significant
multiple R of .645, with the equivalent R2 of .416. So variation in the EIKEN common-scale reading
scores accounted for 41.6% of the variation in the TOEFL iBT total scores. The second step included
Variable Comp 1 Comp 2 h2
EikR .680 .448 0.662
EikL .752 .267 0.636
EikW .751 .396 0.720
EikS .766 .350 0.709
TflR .223 .844 0.762
TflL .672 .451 0.654
TflW .458 .605 0.576
TflS .657 .159 0.457
Prop Var 0.415 0.232 0.647

LINKING, VALIDATING, AND PREDICTING TOEFL IBT SCORES AT ADVANCED PROFICIENCY EIKEN LEVELS 44
©2012 Eiken Foundation of Japan
both the EIKEN common-scale reading and speaking scores as independent variables, and the results
show a statistically significant multiple R of .741 with the equivalent R2 of .549 for an R2 change
of .133. So variation in the EIKEN common-scale reading and speaking scores together accounted for
54.9% of the variation in the TOEFL iBT total scores, which is 11.3% more than the amount of
variance accounted for in the first step. The third step included the EIKEN common-scale reading,
speaking, and listening scores as independent variables, and the results show a statistically significant
multiple R of .774 with the equivalent R2 of .600 for an R2 change of .051. So variation in the EIKEN
common-scale reading, speaking, and listening scores together accounted for 60% of the variation in
the TOEFL iBT total scores, which is 5.1% more than the amount of variance accounted for in the
first two steps. The fourth step included the EIKEN common-scale reading, speaking, listening, and
writing scores as independent variables, and the results show a statistically significant multiple R
of .786 with the equivalent R2 of .618 for an R2 change of .018. So variation in the EIKEN common-
scale reading, speaking, listening, and writing scores together accounted for 61.8% of the variation in
the TOEFL iBT total scores, which is only 1.8% more than the amount of variance accounted for in
the first three steps (though this is a significant addition at p < .01). The best prediction of TOEFL
iBT total scores by EIKEN common-scale subtest scores is produced by the combination of the
reading, speaking, listening, and writing subtests, at least in these data.
Table 26 Stepwise Multiple Regression EikR, S, L, and W on Total TOEFL iBT
Accordingly, we ran a simple regression analysis with the TOEFL iBT total scores as the
dependent variable and the total EIKEN (including reading, listening, writing, and speaking all
together) subtest common-scale scores as the independent variable. Table 27 shows the results of this
simple regression analysis. Notice that the total EIKEN common-scale scores show a statistically
significant R of .765 with the equivalent R2 of .586. So variation in the total EIKEN common-scale
scores accounted for 58.6% of the variation in the TOEFL iBT total scores. In addition to being more
sensible from a practical point of view, predicting the total TOEFL iBT scores from the total EIKEN
common-scale scores appears to account for considerable overlapping variance. The intercept for the
resulting regression equation for this analysis was 86.517, and the slope turned out to be 13.898. Thus,
the regression equation can be expressed as follows:
Model R R2 R2 change
F change
p
1 - EikR .645 .416 .416 85.603 .000
2 - EikRS .741 .549 .133 72.404 .000
3 - EikRSL .774 .600 .051 58.913 .000
4 - EikRSLW .786 .618 .018 47.394 .000

LINKING, VALIDATING, AND PREDICTING TOEFL IBT SCORES AT ADVANCED PROFICIENCY EIKEN LEVELS 45
©2012 Eiken Foundation of Japan
Predicted TOEFL iBT score = 86.517 + 13.898 × (total EIKEN common-scale score)
In words, this means that the predicted TOEFL iBT score equals the intercept of 86.517 plus the slope
of 13.898 times the total EIKEN common-scale score. The standard error of estimate (see) for this
prediction was 10.219 (see Table 27).
Table 27 Total EIKEN (R, L, W, and S) Regression on the TOEFL iBT Total Scores
R R2 see F .765 .586 10.219 169.735*
*p < .01
The scatter plot for the analysis explained in the previous paragraph is shown in Figure 8. Notice
that the total TOEFL iBT scores are on the vertical axis and the EIKEN total is on the horizontal axis.
Figure 8. Scatter plot for the EIKEN total regression on the TOEFL iBT total scores
Under operational conditions, only the EIKEN examinees who reach a threshold score for passing
go on to take the EIKEN speaking subtest. Consequently, in order to make predictions for all
examinees (not just those who passed the written parts), it would be useful to know how, and how
well, the EIKEN common-scale scores for written subtests predict the total TOEFL (i.e., excluding
the speaking subtest). Accordingly, we did a second simple regression analysis with the TOEFL iBT
total scores as the dependent variable and the total first-stage EIKEN written subtest (reading,
listening, and writing) common-scale scores taken together as the independent variable. Table 28
shows the results of this simple regression analysis. Notice that the total first-stage EIKEN common-
scale scores show a statistically significant R of .701 with the equivalent R2 of .491. So variation in

LINKING, VALIDATING, AND PREDICTING TOEFL IBT SCORES AT ADVANCED PROFICIENCY EIKEN LEVELS 46
©2012 Eiken Foundation of Japan
the total EIKEN common-scale written subtest scores accounts for 49.1% of the variation in the
TOEFL iBT total scores. The intercept for the resulting regression equation for this analysis was
86.248 and the slope turned out to be 11.356. Thus, the regression equation can be expressed as
follows:
Predicted TOEFL iBT score = 86.248 + 11.356 × (RLW EIKEN common-scale score)
In other words, this means that the predicted TOEFL iBT score equals the intercept of 86.248 plus the
slope of 11.356, times the total first-stage EIKEN common-scale score. The standard error of
estimate for this prediction is 11.327.
Table 28 First-stage EIKEN (R, L, and W) Regression on the TOEFL iBT Total Scores
*p < .01
The scatter plot for the analysis explained in the previous paragraph is shown in Figure 9. Notice
that the total TOEFL iBT scores are on the vertical axis and the first-stage EIKEN written common-
scale scores are on the horizontal axis. Notice the outliers in the middle to the right. These individuals
probably help to explain why the R2 of .491 reported in Table 28 (and shown in Figure 9) is lower
than the parallel statistic of .586 reported in Table 27 (and shown in Figure 8).
Figure 9. Scatter plot for the EIKEN first-stage (RLW) regression on the TOEFL iBT total scores
R R2 see F
.701 .491 11.327 115.844*

LINKING, VALIDATING, AND PREDICTING TOEFL IBT SCORES AT ADVANCED PROFICIENCY EIKEN LEVELS 47
©2012 Eiken Foundation of Japan
Discussion
To help organize this section of the report, the research questions posed at the end of the
Introduction section will be used as subheadings. Each will be addressed in turn.
1. What Steps and Procedures Can Effectively Be Used in Item Response Theory to Link the Grades 1, Pre-1, and 2 Test Scores to a Single Scale of Scores Common Across These Forms?
Recall that this part of the study was essentially a small-scale demonstration of techniques
that STEP could use in the future to equate its grade-level tests to an EIKEN common scale
and do so operationally on a permanent basis. Thus EIKEN could report a passing grade to
each examinee on each grade-level test, and also give them their EIKEN common-scale score.
Using Winsteps™, the following two main steps were taken in the analysis:
1. Item logits for all of the item subsets (RLWS, RLW, RL, R, L, W, and S) were estimated
across the Grade 1, Pre-1, and 2 tests taken together, while adjusting using the anchor test
items. [See Step (1) in Figure 10.]
2. By treating the estimated item logits as all fixed for RLWS, RLW, RL, R, L, W, and S,
the logit scores of examinees taken together across the Grade 1, Pre-1, and 2 tests were
then estimated. [See Step (2) in Figure 10.]
These steps are illustrated in more detail in Figure 10.

LINKING, VALIDATING, AND PREDICTING TOEFL IBT SCORES AT ADVANCED PROFICIENCY EIKEN LEVELS 48
©2012 Eiken Foundation of Japan
Figure 10. Person/item map (anchored) for Grade 1 Item ID Item Logit
・・・・・・・・ ・・・・・・・・・・・・・・・・ ・・・・・・・・・・・・・・・・ ・・・・・・・・・・・・・・・・ ・・・・・・・・・・・・・・・・ ・・・・・・・・・・・・・・・・ ・・・・・・・・・・・・・・・・ ・・・・・・・・・・・・・・・・ ・・・・・・・・・・・・・・・・ ・・・・・・・・・・・・・・・・ ・・・・・・・・・・・・・・・・ ・・・・・・・・
Person ID Person Logit Raw Score・・・・・・・・ ・・・・・・・・ ・・・・・・・・・・・・・・・・ ・・・・・・・・ ・・・・・・・・・・・・・・・・ ・・・・・・・・ ・・・・・・・・
Person ID Person Logit Raw Score・・・・・・・・ ・・・・・・・・ ・・・・・・・・・・・・・・・・ ・・・・・・・・ ・・・・・・・・・・・・・・・・ ・・・・・・・・ ・・・・・・・・
Person ID Person Logit Raw Score・・・・・・・・ ・・・・・・・・ ・・・・・・・・・・・・・・・・ ・・・・・・・・ ・・・・・・・・・・・・・・・・ ・・・・・・・・ ・・・・・・・・
SubjectID
AnchorTest
Grade 1RLWS
Student ID
Grade 2RLWS
Those items are all treated asfixed to estimate person ligits.
GradePre1RLWS
Student ID
Student ID
GradePre1RLWS
Anchor test worked as a bridgeto estimate item logits
Grade 2RLWS
Grade 1RLWS
Estimation
EStimation
In the process of doing these analyses, a number of issues arose that we would like to
document here so that anyone who replicates this study or follows similar procedures will be
able to do so.
One problem that we initially had to deal with was that in Winsteps™, we were unable to
enter and analyze weighted responses that involved two-digit numbers in a single column.
For example, weighted rating scales for writing and speaking that ranged from 0–10, 0–14,
0–15 could not be recorded under the xwide=1 command (i.e., in a single column). However,
by converting the two-digit numbers to alphabetical symbols, such as A for 10, B for 11, C
for 12, and so on up to Z, we were able to include weighted items with possible double-digit
responses in single columns and thus in the analysis.
Such partial-credit model items in the reading, writing, and speaking sections were first
specified using the ISGROUPS= and IREFER= commands and were coded using the
CODES= command. They were then weighted using the IWEIGHT= command. For example,
some writing items could be rated on a scale that had possible scores of 0, 2, 4, 6, 8, 10, 12,
and 14 (note that odd-numbered scores did not exist). Such items with structural zeros were
thus properly treated as having only the observable number of intervals, while still keeping
the original score scale to establish the person-logit raw-score table. In addition, for the

LINKING, VALIDATING, AND PREDICTING TOEFL IBT SCORES AT ADVANCED PROFICIENCY EIKEN LEVELS 49
©2012 Eiken Foundation of Japan
partial-credit items, step parameters were treated as fixed in order to estimate person logits
using SAFILE=. Weighted items in Grade 1 were those from 32 through 41 and 62 to 68.
Weighted items in Grade Pre-1 were from 32 to 41 and 66 through 70.
Another important issue relates to the treatment of ratings for the Grade 1 writing and
speaking items, which were discussed in the Materials section when explaining Table 7. The
reason that each rating was treated as a different item also stems from problems encountered
in running the analysis. Not only were there problems dealing with two-digit scores, but there
was also a problem seeming to arise from the large difference between the scale ranges for
the dichotomous items and the much longer scale ranges for the Grade 1 writing and speaking
items. Because the total possible scores of 28 or 30 for writing and speaking items appeared
too large in conjunction with the shorter ranges for the dichotomous items, they prevented the
analysis from running. The solution to this problem was to treat each grader’s rating as a
separate item, thus reducing the length of the scale to manageable levels. This resulted in two
items (actually ratings for the same task) being measured when there was in fact only one
scored test task or item (e.g., the writing test for Grade 1).
The problems encountered here have implications with regard to designing procedures for
operational usage as well. A difficulty measure for the actual writing task, and for each
speaking task (S1, S2, S3, S4), would obviously need to be derived. There are two possible
solutions. The first would be to assume equal grader severity, ignore the effects of individual
graders, and to only calculate the difficulty based on the summed score of both
graders/examiners; in other words, to treat the final summed rating for each task as the test
taker’s item score. Doing this would entail overcoming the problem encountered in this
analysis, which might be achieved by taking account of structural zeroes within the total 0–28
or 0–30 scales, reducing the scales to the actual number of steps (with a subsequently smaller
total possible score), and then using IWEIGHT= to incorporate the correct weighting (e.g., 28
points for G1 writing). This should allow Winsteps™ to process the wide scale ranges such as
0–28 for the writing in conjunction with the other dichotomously scored items. The second
alternative would be to explore using Facets™ to derive a single measure for each task—W1,
S1, S2, S3, S4—by taking into account the different grader severities, though this would be a
complex design when doing a large-scale administration with many graders.
2. What Arguments Can Be Made for the Concurrent Criterion-Related and Construct Validity of the EIKEN Grade Levels Tests Being Examined Here?

LINKING, VALIDATING, AND PREDICTING TOEFL IBT SCORES AT ADVANCED PROFICIENCY EIKEN LEVELS 50
©2012 Eiken Foundation of Japan
Argument 1. Concurrent criterion-related validity: The EIKEN common-scale scores are
correlated with the TOEFL iBT scores for the total EIKEN, and the written subtests (reading,
listening, and writing), at .765 for the total scores on both tests and at .701 for the written
subtests (reading, listening, and writing taken together) on the EIKEN with the total scores on
the TOEFL iBT. These results constitute concurrent criterion-related validity arguments.
Argument 2. Construct validity (convergent/discriminant): In a two-component principle
components analysis, the common-scale scores for the EIKEN reading, listening, writing, and
speaking subtests, and the TOEFL iBT reading, listening, writing, and speaking subtest
scores, showed a pattern of loadings indicating that the two test batteries are measuring in
similar ways to lesser and greater degrees depending on the subtest involved and the
component being analyzed. These results contribute to a convergent/discriminant construct
validity argument.
Argument 3. Construct validity (differential groups): The three groups in this study were
created on the basis of differences in their overall English-language proficiency as measured
on the TOEFL iBT. The ANOVA and Scheffé post-hoc results (see tables 20 and 21 above)
that used the EIKEN common-scale scores as the dependent variable and the TOEFL iBT-
based groups as the dependent variable showed that there were significant differences in all
possible combinations of mean differences. In addition, Figure 6 showed that these
differences were not only significant but also large. This demonstrates that the EIKEN Grade
1, Pre-1, and 2 tests separated the groups efficiently, which provides differential groups
evidence for the construct validity of the EIKEN scores studied here.
3. What EIKEN Common-Scale Scores Are Equivalent to What TOEFL iBT Scores? And How Do Those EIKEN Common-Scale Scores Relate to Raw Scores and Percent Cut-point Scores on Each of the Grade-level Tests?
What do the regression analyses tell us in practical decision-making terms? In order to
address that question, we must first understand that the EIKEN tests are largely viewed by the
examinee population as a series of steps that they must pass one after another to move to the
next level. Understanding the cut points on the various EIKEN grade-level tests is important
to thinking about how the regression models developed in this study can be applied to
decision making. For the Grade 1, Pre-1, and 2 operational tests used in this study, the cut
points were set at 70% for the first stage of the Grade 1 and Pre-1 tests, and at 60% for the
first stage of Grade 2. For the second-stage speaking tests the cut point is 60% for all grades.
The first seven columns of numbers in Table 29 show the total raw-score points possible on

LINKING, VALIDATING, AND PREDICTING TOEFL IBT SCORES AT ADVANCED PROFICIENCY EIKEN LEVELS 51
©2012 Eiken Foundation of Japan
the reading (Rtotal), listening (Ltotal), writing (Wtotal), and speaking (Stotal) scores, as well
as the total possible for various combinations of RL, RLW, and RLWS. The next two
columns show the raw-score equivalents for the RLW combination at 60% or 70% as
appropriate. The final column shows the cut points in terms of raw-score equivalents for the
three different speaking tests.
Table 29 EIKEN Raw Item Numbers and Cut Scores
Table 30 shows the relationships among the EIKEN subtest and total scores as well as
their relationships with the predicted TOEFL iBT scores. This table was the first step in
examining ways to convert total EIKEN common-scale scores (for all four reading, listening,
writing, and speaking subtests combined) to TOEFL iBT scores, while also simultaneously
considering the EIKEN raw-score totals and percentages. The examinee identification
numbers (ID) are shown in the first column; the second column shows what test grade the
examinee took, followed by a third column displaying the total EIKEN common-scale score
(EikRLWS) for each examinee. Continuing from left to right from the fourth column, the
table displays EIKEN subtest raw scores for the reading (RawR), listening (RawL), writing
(RawW), and speaking (RawS) subtests, as well as a column for total EIKEN raw scores
(EIKEN Raw Total) and percentage scores (EIKEN Raw%). The last three columns on the
right show the predicted TOEFL iBT (Predicted TOEFL) scores derived from the regression
equation, with the EIKEN common-scale scores the independent variable and the TOEFL
iBT scores as the dependent variable. The last two columns are based on subtracting and
adding one standard error of estimate to and from the predicted TOEFL iBT scores; they
therefore represent a 68% confidence interval around the predicted TOEFL iBT scores. In
other words, for examinee 019 (who took the Grade 1 test and received an EIKEN common-
scale score of 2.20; raw subtest and total scores of 46, 32, 22, 97, and 197, respectively; and a
Rtotal Ltotal Wtotal Stotal RLtotal
RLW total
RLWS total
RLW 60%
cut score
RLW 70%
cut score
S 60%
cut score
Grade 1 51 34 28 100 85 113 213 ***** 79 60
Grade Pre-1 51 34 14 38 85 99 137 ***** 69 22
Grade 2 40 30 5 33 70 75 108 45 ***** 19

LINKING, VALIDATING, AND PREDICTING TOEFL IBT SCORES AT ADVANCED PROFICIENCY EIKEN LEVELS 52
©2012 Eiken Foundation of Japan
raw-percentage score of 92.5), the best prediction for this student’s TOEFL iBT score would
be 117.1. However, the 68% confidence interval indicates that, 68% of the time, the
examinee could score as low as 106.9 and as high as 127.3. Naturally, a 95% confidence
interval could be constructed that would be considerably wider, but for the purposes of this
study, the 68% (about two thirds) confidence interval seemed sufficiently accurate.
Notice that a blank row has been left between grade levels. It would not be appropriate to
use the EIKEN total raw scores—which include speaking—or percentage of total raw scores
in Table 30 to make inferences about EIKEN certificate holders for the following reasons.
Firstly, the operational cut points for grades 1 and Pre-1 differ for the first stage and second
stage, as shown in Table 29 (70% for the written sub-tests total, 60% for speaking), so it is
not possible to identify one point on the total raw-score scale which would represent a
“passing” point. Secondly (and more importantly), operationally, only test takers who display
a sufficient level of ability on the first stage take the speaking test, and examinees must pass
both stages to achieve certification. This makes the EIKEN test a hybrid scoring model in
terms of the commonly used dichotomy of compensatory/conjunctive scoring. Within the first
stage and within the second stage, scoring is compensatory, and test takers can compensate
for a poor performance on one section with a high performance on another section. This
reflects the scoring models on many large-scale, high-stakes tests. However, the EIKEN tests
are also a partial conjunctive model, in that test takers cannot compensate for a poor
performance on the first stage with a high speaking score, and vice versa. For example,
despite the fact that the raw-score percentage of test takers 059, 121, 030, 009, 100, 041, 089,
and 099 total more than 70% with speaking included, none of these test takers apart from
examinees 030 and 041 would have passed the first-stage test based on their raw scores for
the written subtests. They therefore would not have achieved certification at the Grade 1 level.
Interpreting Table 30 in terms of what the data can tell us about EIKEN certificate holders is
dealt with in more detail in a later section.
Notice also, however, that the predicted TOEFL iBT scores for the examinees passing the
three tests ranged very widely—from 61.1 to 117.5. From another perspective, there are
examinees on all three of these tests who are predicted to achieve both high and relatively
low scores on the TOEFL iBT test. Thus, in this data set, knowing the test takers’ TOEFL
iBT scores—or at least predicting what are likely to be—provides useful additional
information beyond simply knowing whether or not the examinees passed a particular test.

LINKING, VALIDATING, AND PREDICTING TOEFL IBT SCORES AT ADVANCED PROFICIENCY EIKEN LEVELS 53
©2012 Eiken Foundation of Japan
Table 30 EIKEN RLWS to TOEFL Regression Prediction Results
ID Grade
EIKEN RLWS
logits EIKEN
rawR EIKEN
rawL EIKEN
rawWEIKEN
rawSEIKEN
Raw totalEIKEN
raw%Predicted
TOEFL 68% lower 68% upper019 Grade 1 2.20 46 32 22 97 197 92.5 117.1 106.9 127.3
012 Grade 1 1.68 44 31 22 92 189 88.7 109.9 99.6 120.1
013 Grade 1 1.62 46 30 22 90 188 88.3 109.0 98.8 119.3
014 Grade 1 1.37 35 30 24 94 183 85.9 105.6 95.3 115.8
058 Grade 1 1.19 38 32 20 89 179 84.0 103.1 92.8 113.3
118 Grade 1 1.15 36 29 16 97 178 83.6 102.5 92.3 112.7
011 Grade 1 1.11 38 32 20 87 177 83.1 101.9 91.7 112.2
079 Grade 1 1.07 30 30 16 100 176 82.6 101.4 91.2 111.6
070 Grade 1 1.03 29 32 20 94 175 82.2 100.8 90.6 111.1
123 Grade 1 0.91 32 25 24 91 172 80.8 99.2 88.9 109.4
006 Grade 1 0.88 41 29 18 83 171 80.3 98.7 88.5 109.0
027 Grade 1 0.88 36 33 20 82 171 80.3 98.7 88.5 109.0
113 Grade 1 0.88 37 24 14 96 171 80.3 98.7 88.5 109.0
048 Grade 1 0.84 44 26 22 78 170 79.8 98.2 88.0 108.4
071 Grade 1 0.84 41 29 16 84 170 79.8 98.2 88.0 108.4
111 Grade 1 0.77 42 33 22 71 168 78.9 97.2 87.0 107.4
059 Grade 1 0.63 36 28 12 88 164 77.0 95.3 85.1 105.5
121 Grade 1 0.59 30 32 8 93 163 76.5 94.7 84.5 104.9
030 Grade 1 0.53 40 29 12 80 161 75.6 93.9 83.7 104.1
009 Grade 1 0.39 39 28 8 82 157 73.7 91.9 81.7 102.2
100 Grade 1 0.26 33 31 12 77 153 71.8 90.1 79.9 100.3
041 Grade 1 0.17 42 32 20 56 150 70.4 88.9 78.7 99.1
089 Grade 1 0.17 32 21 18 79 150 70.4 88.9 78.7 99.1
090 Grade 1 0.17 36 22 16 76 150 70.4 88.9 78.7 99.1
028 Grade 1 0.07 34 25 16 72 147 69.0 87.5 77.3 97.7
107 Grade 1 0.07 37 26 14 70 147 69.0 87.5 77.3 97.7
091 Grade 1 -0.18 23 24 12 80 139 65.3 84.0 73.8 94.2
099 Grade 1 -0.43 41 19 14 57 131 61.5 80.5 70.3 90.8
063 Grade Pre-1 1.46 49 31 10 37 127 92.7 106.8 96.6 117.0
128 Grade Pre-1 1.46 49 29 12 37 127 92.7 106.8 96.6 117.0
088 Grade Pre-1 1.23 49 33 8 35 125 91.2 103.6 93.4 113.8
060 Grade Pre-1 1.04 51 27 10 35 123 89.8 101.0 90.8 111.2
126 Grade Pre-1 0.95 48 22 14 38 122 89.1 99.7 89.5 109.9
065 Grade Pre-1 0.86 48 29 10 34 121 88.3 98.5 88.3 108.7
087 Grade Pre-1 0.86 43 28 12 38 121 88.3 98.5 88.3 108.7
114 Grade Pre-1 0.78 47 28 14 31 120 87.6 97.4 87.1 107.6
010 Grade Pre-1 0.71 39 30 14 36 119 86.9 96.4 86.2 106.6
076 Grade Pre-1 0.71 43 34 6 36 119 86.9 96.4 86.2 106.6
108 Grade Pre-1 0.71 49 20 12 38 119 86.9 96.4 86.2 106.6
117 Grade Pre-1 0.71 49 30 6 34 119 86.9 96.4 86.2 106.6
073 Grade Pre-1 0.63 46 31 8 33 118 86.1 95.3 85.1 105.5
075 Grade Pre-1 0.63 48 29 10 31 118 86.1 95.3 85.1 105.5
005 Grade Pre-1 0.56 40 30 12 35 117 85.4 94.3 84.1 104.5
023 Grade Pre-1 0.56 47 25 14 31 117 85.4 94.3 84.1 104.5
047 Grade Pre-1 0.50 49 31 10 26 116 84.7 93.5 83.2 103.7
064 Grade Pre-1 0.50 43 27 12 34 116 84.7 93.5 83.2 103.7
125 Grade Pre-1 0.50 46 32 6 32 116 84.7 93.5 83.2 103.7
038 Grade Pre-1 0.43 48 27 10 30 115 83.9 92.5 82.3 102.7
036 Grade Pre-1 0.37 49 23 12 30 114 83.2 91.7 81.4 101.9
021 Grade Pre-1 0.31 42 23 12 36 113 82.5 90.8 80.6 101.0
022 Grade Pre-1 0.31 45 27 12 29 113 82.5 90.8 80.6 101.0
025 Grade Pre-1 0.31 43 33 10 27 113 82.5 90.8 80.6 101.0
040 Grade Pre-1 0.31 45 24 12 32 113 82.5 90.8 80.6 101.0
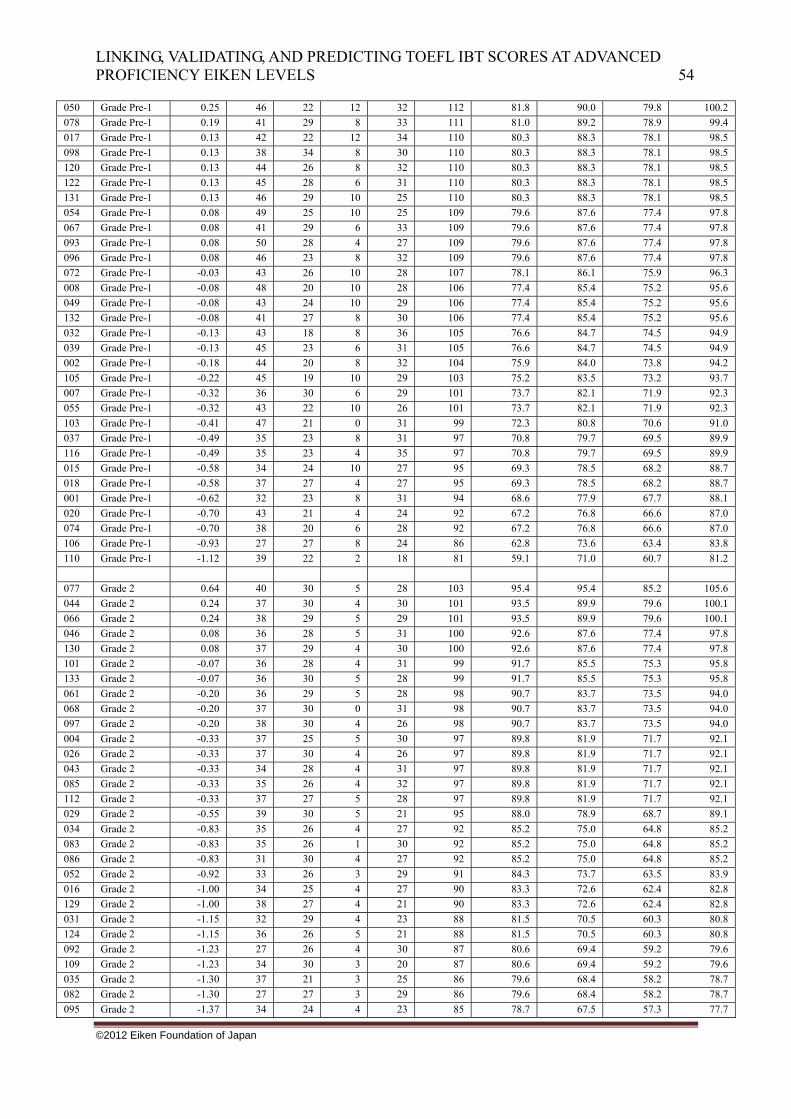
LINKING, VALIDATING, AND PREDICTING TOEFL IBT SCORES AT ADVANCED PROFICIENCY EIKEN LEVELS 54
©2012 Eiken Foundation of Japan
050 Grade Pre-1 0.25 46 22 12 32 112 81.8 90.0 79.8 100.2
078 Grade Pre-1 0.19 41 29 8 33 111 81.0 89.2 78.9 99.4
017 Grade Pre-1 0.13 42 22 12 34 110 80.3 88.3 78.1 98.5
098 Grade Pre-1 0.13 38 34 8 30 110 80.3 88.3 78.1 98.5
120 Grade Pre-1 0.13 44 26 8 32 110 80.3 88.3 78.1 98.5
122 Grade Pre-1 0.13 45 28 6 31 110 80.3 88.3 78.1 98.5
131 Grade Pre-1 0.13 46 29 10 25 110 80.3 88.3 78.1 98.5
054 Grade Pre-1 0.08 49 25 10 25 109 79.6 87.6 77.4 97.8
067 Grade Pre-1 0.08 41 29 6 33 109 79.6 87.6 77.4 97.8
093 Grade Pre-1 0.08 50 28 4 27 109 79.6 87.6 77.4 97.8
096 Grade Pre-1 0.08 46 23 8 32 109 79.6 87.6 77.4 97.8
072 Grade Pre-1 -0.03 43 26 10 28 107 78.1 86.1 75.9 96.3
008 Grade Pre-1 -0.08 48 20 10 28 106 77.4 85.4 75.2 95.6
049 Grade Pre-1 -0.08 43 24 10 29 106 77.4 85.4 75.2 95.6
132 Grade Pre-1 -0.08 41 27 8 30 106 77.4 85.4 75.2 95.6
032 Grade Pre-1 -0.13 43 18 8 36 105 76.6 84.7 74.5 94.9
039 Grade Pre-1 -0.13 45 23 6 31 105 76.6 84.7 74.5 94.9
002 Grade Pre-1 -0.18 44 20 8 32 104 75.9 84.0 73.8 94.2
105 Grade Pre-1 -0.22 45 19 10 29 103 75.2 83.5 73.2 93.7
007 Grade Pre-1 -0.32 36 30 6 29 101 73.7 82.1 71.9 92.3
055 Grade Pre-1 -0.32 43 22 10 26 101 73.7 82.1 71.9 92.3
103 Grade Pre-1 -0.41 47 21 0 31 99 72.3 80.8 70.6 91.0
037 Grade Pre-1 -0.49 35 23 8 31 97 70.8 79.7 69.5 89.9
116 Grade Pre-1 -0.49 35 23 4 35 97 70.8 79.7 69.5 89.9
015 Grade Pre-1 -0.58 34 24 10 27 95 69.3 78.5 68.2 88.7
018 Grade Pre-1 -0.58 37 27 4 27 95 69.3 78.5 68.2 88.7
001 Grade Pre-1 -0.62 32 23 8 31 94 68.6 77.9 67.7 88.1
020 Grade Pre-1 -0.70 43 21 4 24 92 67.2 76.8 66.6 87.0
074 Grade Pre-1 -0.70 38 20 6 28 92 67.2 76.8 66.6 87.0
106 Grade Pre-1 -0.93 27 27 8 24 86 62.8 73.6 63.4 83.8
110 Grade Pre-1 -1.12 39 22 2 18 81 59.1 71.0 60.7 81.2
077 Grade 2 0.64 40 30 5 28 103 95.4 95.4 85.2 105.6
044 Grade 2 0.24 37 30 4 30 101 93.5 89.9 79.6 100.1
066 Grade 2 0.24 38 29 5 29 101 93.5 89.9 79.6 100.1
046 Grade 2 0.08 36 28 5 31 100 92.6 87.6 77.4 97.8
130 Grade 2 0.08 37 29 4 30 100 92.6 87.6 77.4 97.8
101 Grade 2 -0.07 36 28 4 31 99 91.7 85.5 75.3 95.8
133 Grade 2 -0.07 36 30 5 28 99 91.7 85.5 75.3 95.8
061 Grade 2 -0.20 36 29 5 28 98 90.7 83.7 73.5 94.0
068 Grade 2 -0.20 37 30 0 31 98 90.7 83.7 73.5 94.0
097 Grade 2 -0.20 38 30 4 26 98 90.7 83.7 73.5 94.0
004 Grade 2 -0.33 37 25 5 30 97 89.8 81.9 71.7 92.1
026 Grade 2 -0.33 37 30 4 26 97 89.8 81.9 71.7 92.1
043 Grade 2 -0.33 34 28 4 31 97 89.8 81.9 71.7 92.1
085 Grade 2 -0.33 35 26 4 32 97 89.8 81.9 71.7 92.1
112 Grade 2 -0.33 37 27 5 28 97 89.8 81.9 71.7 92.1
029 Grade 2 -0.55 39 30 5 21 95 88.0 78.9 68.7 89.1
034 Grade 2 -0.83 35 26 4 27 92 85.2 75.0 64.8 85.2
083 Grade 2 -0.83 35 26 1 30 92 85.2 75.0 64.8 85.2
086 Grade 2 -0.83 31 30 4 27 92 85.2 75.0 64.8 85.2
052 Grade 2 -0.92 33 26 3 29 91 84.3 73.7 63.5 83.9
016 Grade 2 -1.00 34 25 4 27 90 83.3 72.6 62.4 82.8
129 Grade 2 -1.00 38 27 4 21 90 83.3 72.6 62.4 82.8
031 Grade 2 -1.15 32 29 4 23 88 81.5 70.5 60.3 80.8
124 Grade 2 -1.15 36 26 5 21 88 81.5 70.5 60.3 80.8
092 Grade 2 -1.23 27 26 4 30 87 80.6 69.4 59.2 79.6
109 Grade 2 -1.23 34 30 3 20 87 80.6 69.4 59.2 79.6
035 Grade 2 -1.30 37 21 3 25 86 79.6 68.4 58.2 78.7
082 Grade 2 -1.30 27 27 3 29 86 79.6 68.4 58.2 78.7
095 Grade 2 -1.37 34 24 4 23 85 78.7 67.5 57.3 77.7

LINKING, VALIDATING, AND PREDICTING TOEFL IBT SCORES AT ADVANCED PROFICIENCY EIKEN LEVELS 55
©2012 Eiken Foundation of Japan
033 Grade 2 -1.43 31 28 3 22 84 77.8 66.6 56.4 76.9
051 Grade 2 -1.50 33 28 3 19 83 76.9 65.7 55.5 75.9
081 Grade 2 -1.50 33 26 0 24 83 76.9 65.7 55.5 75.9
003 Grade 2 -1.62 29 26 3 23 81 75.0 64.0 53.8 74.2
062 Grade 2 -1.62 34 22 4 21 81 75.0 64.0 53.8 74.2
057 Grade 2 -1.80 32 21 3 22 78 72.2 61.5 51.3 71.7
094 Grade 2 -1.86 31 25 2 19 77 71.3 60.7 50.4 70.9
115 Grade 2 -2.24 23 22 3 22 70 64.8 55.4 45.2 65.6
080 Grade 2 -2.40 26 24 2 15 67 62.0 53.2 42.9 63.4
Table 31 presents information similar to that shown in Table 30 for the predictions of
TOEFL iBT scores from EIKEN common-scale scores; however, these results are based
solely on the first-stage written subtests (i.e., the reading, listening, and writing subtests).
This table is provided because only those who pass each test among the EIKEN examinees in
these grade levels take the speaking subtest. Thus, this table is useful operationally for
considering TOEFL iBT predictions even for those students who did not pass the first-stage
written tests at a sufficient level to be allowed to take the speaking test.
Notice that Table 31 is organized with column labels very similar to those in the previous
table; and that, again, a blank row has been left between grade levels. For Grade 1, 12
examinees had percentage scores that would not allow them to pass the first-stage test (i.e.,
70% or higher), while the remaining examinees would pass the first-stage test based on their
raw scores for the written subtests. For Grade Pre-1, 11 test takers failed to score above 70%,
and so would not pass the first-stage test. For Grade 2, where the cut point is 60%, all
examinees achieved raw-score percentages that would indicate a level sufficient to pass the
first stage. Notice also, however, that the predicted TOEFL iBT scores for the examinees
passing these three tests ranged widely, from 62.9 to 115.3. Once again, there are examinees
predicted to score high and relatively low on the TOEFL iBT test on all three of these tests.
Thus, for this data set, knowing—or at least predicting—what test takers’ TOEFL iBT scores
are likely to be provides additional information beyond simply knowing whether or not the
examinees passed a particular test.
Table 31 EIKEN RLW to TOEFL Regression Prediction Results
ID Grade EIKEN
RLW logits EIKEN
rawR EIKEN
rawLEIKEN
rawWEIKEN
Raw RLW
EIKEN RLW raw%
Predicted TOEFL
68% lower
68% upper
019 Grade 1 2.08 46 32 22 100 88.5 109.9 98.6 121.2
013 Grade 1 1.88 46 30 22 98 86.7 107.6 96.3 119.0
012 Grade 1 1.79 44 31 22 97 85.8 106.6 95.3 117.9
111 Grade 1 1.79 42 33 22 97 85.8 106.6 95.3 117.9
041 Grade 1 1.54 42 32 20 94 83.2 103.8 92.4 115.1
048 Grade 1 1.39 44 26 22 92 81.4 102.1 90.7 113.4

LINKING, VALIDATING, AND PREDICTING TOEFL IBT SCORES AT ADVANCED PROFICIENCY EIKEN LEVELS 56
©2012 Eiken Foundation of Japan
011 Grade 1 1.25 38 32 20 90 79.6 100.5 89.2 111.8
058 Grade 1 1.25 38 32 20 90 79.6 100.5 89.2 111.8
014 Grade 1 1.19 35 30 24 89 78.8 99.8 88.5 111.1
027 Grade 1 1.19 36 33 20 89 78.8 99.8 88.5 111.1
006 Grade 1 1.12 41 29 18 88 77.9 99.0 87.7 110.3
071 Grade 1 1.00 41 29 16 86 76.1 97.6 86.3 109.0
030 Grade 1 0.71 40 29 12 81 71.7 94.3 83.0 105.7
070 Grade 1 0.71 29 32 20 81 71.7 94.3 83.0 105.7
118 Grade 1 0.71 36 29 16 81 71.7 94.3 83.0 105.7
123 Grade 1 0.71 32 25 24 81 71.7 94.3 83.0 105.7
107 Grade 1 0.49 37 26 14 77 68.1 91.8 80.5 103.2
059 Grade 1 0.44 36 28 12 76 67.3 91.3 80.0 102.6
079 Grade 1 0.44 30 30 16 76 67.3 91.3 80.0 102.6
100 Grade 1 0.44 33 31 12 76 67.3 91.3 80.0 102.6
009 Grade 1 0.38 39 28 8 75 66.4 90.6 79.3 101.9
028 Grade 1 0.38 34 25 16 75 66.4 90.6 79.3 101.9
113 Grade 1 0.38 37 24 14 75 66.4 90.6 79.3 101.9
090 Grade 1 0.33 36 22 16 74 65.5 90.0 78.7 101.4
099 Grade 1 0.33 41 19 14 74 65.5 90.0 78.7 101.4
089 Grade 1 0.18 32 21 18 71 62.8 88.3 77.0 99.7
121 Grade 1 0.13 30 32 8 70 61.9 87.8 76.4 99.1
091 Grade 1 -0.43 23 24 12 59 52.2 81.4 70.1 92.7
047 Grade Pre-1 1.19 49 31 10 90 90.9 99.8 88.5 111.1
063 Grade Pre-1 1.19 49 31 10 90 90.9 99.8 88.5 111.1
088 Grade Pre-1 1.19 49 33 8 90 90.9 99.8 88.5 111.1
128 Grade Pre-1 1.19 49 29 12 90 90.9 99.8 88.5 111.1
114 Grade Pre-1 1.05 47 28 14 89 89.9 98.2 86.9 109.5
060 Grade Pre-1 0.93 51 27 10 88 88.9 96.8 85.5 108.2
065 Grade Pre-1 0.81 48 29 10 87 87.9 95.5 84.2 106.8
075 Grade Pre-1 0.81 48 29 10 87 87.9 95.5 84.2 106.8
023 Grade Pre-1 0.71 47 25 14 86 86.9 94.3 83.0 105.7
025 Grade Pre-1 0.71 43 33 10 86 86.9 94.3 83.0 105.7
038 Grade Pre-1 0.61 48 27 10 85 85.9 93.2 81.9 104.5
073 Grade Pre-1 0.61 46 31 8 85 85.9 93.2 81.9 104.5
117 Grade Pre-1 0.61 49 30 6 85 85.9 93.2 81.9 104.5
131 Grade Pre-1 0.61 46 29 10 85 85.9 93.2 81.9 104.5
022 Grade Pre-1 0.51 45 27 12 84 84.8 92.1 80.7 103.4
036 Grade Pre-1 0.51 49 23 12 84 84.8 92.1 80.7 103.4
054 Grade Pre-1 0.51 49 25 10 84 84.8 92.1 80.7 103.4
125 Grade Pre-1 0.51 46 32 6 84 84.8 92.1 80.7 103.4
126 Grade Pre-1 0.51 48 22 14 84 84.8 92.1 80.7 103.4
010 Grade Pre-1 0.42 39 30 14 83 83.8 91.1 79.7 102.4
076 Grade Pre-1 0.42 43 34 6 83 83.8 91.1 79.7 102.4
087 Grade Pre-1 0.42 43 28 12 83 83.8 91.1 79.7 102.4
005 Grade Pre-1 0.34 40 30 12 82 82.8 90.1 78.8 101.5
064 Grade Pre-1 0.34 43 27 12 82 82.8 90.1 78.8 101.5
093 Grade Pre-1 0.34 50 28 4 82 82.8 90.1 78.8 101.5
040 Grade Pre-1 0.25 45 24 12 81 81.8 89.1 77.8 100.5
108 Grade Pre-1 0.25 49 20 12 81 81.8 89.1 77.8 100.5
050 Grade Pre-1 0.17 46 22 12 80 80.8 88.2 76.9 99.5
098 Grade Pre-1 0.17 38 34 8 80 80.8 88.2 76.9 99.5
072 Grade Pre-1 0.10 43 26 10 79 79.8 87.4 76.1 98.7
122 Grade Pre-1 0.10 45 28 6 79 79.8 87.4 76.1 98.7
008 Grade Pre-1 0.03 48 20 10 78 78.8 86.6 75.3 98.0
078 Grade Pre-1 0.03 41 29 8 78 78.8 86.6 75.3 98.0
120 Grade Pre-1 0.03 44 26 8 78 78.8 86.6 75.3 98.0
021 Grade Pre-1 -0.05 42 23 12 77 77.8 85.7 74.4 97.0
049 Grade Pre-1 -0.05 43 24 10 77 77.8 85.7 74.4 97.0
096 Grade Pre-1 -0.05 46 23 8 77 77.8 85.7 74.4 97.0
017 Grade Pre-1 -0.11 42 22 12 76 76.8 85.0 73.7 96.4

LINKING, VALIDATING, AND PREDICTING TOEFL IBT SCORES AT ADVANCED PROFICIENCY EIKEN LEVELS 57
©2012 Eiken Foundation of Japan
067 Grade Pre-1 -0.11 41 29 6 76 76.8 85.0 73.7 96.4
132 Grade Pre-1 -0.11 41 27 8 76 76.8 85.0 73.7 96.4
055 Grade Pre-1 -0.18 43 22 10 75 75.8 84.2 72.9 95.6
039 Grade Pre-1 -0.25 45 23 6 74 74.7 83.4 72.1 94.8
105 Grade Pre-1 -0.25 45 19 10 74 74.7 83.4 72.1 94.8
002 Grade Pre-1 -0.37 44 20 8 72 72.7 82.1 70.8 93.4
007 Grade Pre-1 -0.37 36 30 6 72 72.7 82.1 70.8 93.4
032 Grade Pre-1 -0.55 43 18 8 69 69.7 80.0 68.7 91.4
015 Grade Pre-1 -0.61 34 24 10 68 68.7 79.4 68.0 90.7
018 Grade Pre-1 -0.61 37 27 4 68 68.7 79.4 68.0 90.7
020 Grade Pre-1 -0.61 43 21 4 68 68.7 79.4 68.0 90.7
103 Grade Pre-1 -0.61 47 21 0 68 68.7 79.4 68.0 90.7
037 Grade Pre-1 -0.72 35 23 8 66 66.7 78.1 66.8 89.4
074 Grade Pre-1 -0.83 38 20 6 64 64.6 76.9 65.5 88.2
001 Grade Pre-1 -0.88 32 23 8 63 63.6 76.3 65.0 87.6
110 Grade Pre-1 -0.88 39 22 2 63 63.6 76.3 65.0 87.6
106 Grade Pre-1 -0.93 27 27 8 62 62.6 75.7 64.4 87.0
116 Grade Pre-1 -0.93 35 23 4 62 62.6 75.7 64.4 87.0
077 Grade 2 2.86 40 30 5 75 100.0 118.8 107.4 130.1
029 Grade 2 1.64 39 30 5 74 98.7 104.9 93.6 116.2
066 Grade 2 0.47 38 29 5 72 96.0 91.6 80.3 102.9
097 Grade 2 0.47 38 30 4 72 96.0 91.6 80.3 102.9
026 Grade 2 0.14 37 30 4 71 94.7 87.9 76.5 99.2
044 Grade 2 0.14 37 30 4 71 94.7 87.9 76.5 99.2
133 Grade 2 0.14 36 30 5 71 94.7 87.9 76.5 99.2
061 Grade 2 -0.12 36 29 5 70 93.3 84.9 73.6 96.2
130 Grade 2 -0.12 37 29 4 70 93.3 84.9 73.6 96.2
046 Grade 2 -0.33 36 28 5 69 92.0 82.5 71.2 93.9
112 Grade 2 -0.33 37 27 5 69 92.0 82.5 71.2 93.9
129 Grade 2 -0.33 38 27 4 69 92.0 82.5 71.2 93.9
101 Grade 2 -0.52 36 28 4 68 90.7 80.4 69.1 91.7
004 Grade 2 -0.69 37 25 5 67 89.3 78.4 67.1 89.8
068 Grade 2 -0.69 37 30 0 67 89.3 78.4 67.1 89.8
109 Grade 2 -0.69 34 30 3 67 89.3 78.4 67.1 89.8
124 Grade 2 -0.69 36 26 5 67 89.3 78.4 67.1 89.8
043 Grade 2 -0.84 34 28 4 66 88.0 76.7 65.4 88.1
031 Grade 2 -0.98 32 29 4 65 86.7 75.2 63.8 86.5
034 Grade 2 -0.98 35 26 4 65 86.7 75.2 63.8 86.5
085 Grade 2 -0.98 35 26 4 65 86.7 75.2 63.8 86.5
086 Grade 2 -0.98 31 30 4 65 86.7 75.2 63.8 86.5
051 Grade 2 -1.11 33 28 3 64 85.3 73.7 62.4 85.0
016 Grade 2 -1.23 34 25 4 63 84.0 72.3 61.0 83.6
033 Grade 2 -1.35 31 28 3 62 82.7 71.0 59.6 82.3
052 Grade 2 -1.35 33 26 3 62 82.7 71.0 59.6 82.3
083 Grade 2 -1.35 35 26 1 62 82.7 71.0 59.6 82.3
095 Grade 2 -1.35 34 24 4 62 82.7 71.0 59.6 82.3
035 Grade 2 -1.45 37 21 3 61 81.3 69.8 58.5 81.1
062 Grade 2 -1.56 34 22 4 60 80.0 68.6 57.2 79.9
081 Grade 2 -1.66 33 26 0 59 78.7 67.4 56.1 78.8
003 Grade 2 -1.75 29 26 3 58 77.3 66.4 55.1 77.7
094 Grade 2 -1.75 31 25 2 58 77.3 66.4 55.1 77.7
082 Grade 2 -1.84 27 27 3 57 76.0 65.4 54.1 76.7
092 Grade 2 -1.84 27 26 4 57 76.0 65.4 54.1 76.7
057 Grade 2 -1.93 32 21 3 56 74.7 64.4 53.0 75.7
080 Grade 2 -2.27 26 24 2 52 69.3 60.5 49.2 71.8
115 Grade 2 -2.58 23 22 3 48 64.0 57.0 45.7 68.3

LINKING, VALIDATING, AND PREDICTING TOEFL IBT SCORES AT ADVANCED PROFICIENCY EIKEN LEVELS 58
©2012 Eiken Foundation of Japan
Table 32 presents similar information for the predictions of TOEFL iBT scores from
EIKEN total common-scale scores (based on the total scores from reading, listening, writing,
and speaking combined). However, these results are organized very differently: the table has
columns showing the EIKEN common-scale scores; the equivalent hensachi score (with a
mean of 50 and standard deviation); a new STEP standardized score that we created for this
report (with a mean of 100 and standard deviation of 20); six columns that show the raw and
percentage scores of the appropriate examinees separately for EIKEN grade levels 1, Pre-1,
and 2; and the same TOEFL iBT predicted scores, 68% lower, and 68% upper. Notice that
the rows are sorted from the highest EIKEN common-scale score to lowest (from +2.20 to
−2.40). All examinees with duplicate logit scores were eliminated. In other words, there is
only one examinee shown for each logit score that was achieved (for an equivalent table
showing all scores, see Appendix G).
Notice in Table 32 that the Grade 1 raw scores ranged from 131 (61.5%) to 197 (92.5%),
and that a score of 70% would be equivalent to about 89 on the TOEFL iBT test. Similarly,
the Grade Pre-1 raw scores ranged from 81 (59.1%) to 127 (92.7%), and a score of 70%
would be equivalent to about 80 on the TOEFL iBT. And finally, the Grade 2 raw scores
ranged from 67 (62.0%) to 103 (95.4%). The lowest score, 62%, would be equivalent to
about 53 on the TOEFL iBT. However, once again, for the reasons explained above, it needs
to be stressed that the total scores and percentages in Table 32 combine speaking with the
written subtests, and so these total scores cannot be taken at face value to make judgments
about whether a test taker would pass or fail in terms of achieving certification at a specific
grade. However, in terms of the first research question of this project, demonstrating
procedures for creating a common EIKEN scoring scale across grades, the figures are of
course very useful for exploring possible future alternatives to the present scoring model.
Note also how easy it was to transform the EIKEN common scale to a hensachi scale and
a new STEP standardized scoring scale. Both scales were calculated using all the data for the
EIKEN total scores (reading, listening, writing, and speaking combined) to calculate a mean
(−.002377) and standard deviation (.867325) for the EIKEN common scale. For the hensachi
transformation score, the mean was then subtracted from each score and this difference was
divided by the standard deviation to yield a z score for that examinee. The z score was then
multiplied by 10 and a constant of 50 was added. This whole process can be summarized as
follows: hensachi score = ((logit score – mean of logit scores)/standard deviation of logit
scores) times 10 plus 50. For example, the logit score of the highest-performing examinee

LINKING, VALIDATING, AND PREDICTING TOEFL IBT SCORES AT ADVANCED PROFICIENCY EIKEN LEVELS 59
©2012 Eiken Foundation of Japan
was 2.20, so for that person, the hensachi would = ((2.20 – −.002377)/.867325) × 10 + 50 =
(2.202377/.867325) × 10 + 50 = 2.5392753 × 10 + 50 = 25.392753 + 50 = 75.392753 ≈ 75.39.
The STEP standardized score would be calculated the same way, but the z score would be
multiplied by 20 and a constant of 100 would be added; using the same example of 2.20
logits, the STEP standardized score would = ((2.20 – −.002377)/.867325) × 20 + 100 =
((2.202377/.867325) × 20 + 100 = 2.5392753 × 20 + 100 = 50.785506 + 100 = 150.785506 ≈
150.79.
Table 32 Predictions of TOEFL iBT Scores from EIKEN Total Common-Scale Scores EIKEN common scores EIKEN grade level TOEFL iBT
Rasch logit
Hensachi STEP stdzd
1 raw 1%
Pre-1 raw
Pre-1 %
2 raw 2%
Predicted score
68% lower
68% upper
2.20 75.39 150.79 197 92.5 117.1 106.9 127.3
1.68 69.40 138.79 189 88.7 109.9 99.6 120.1
1.62 68.71 137.41 188 88.3 109.0 98.8 119.3
1.46 66.86 133.72 127 92.7 106.8 96.6 117.0
1.37 65.82 131.65 183 85.9 105.6 95.3 115.8
1.23 64.21 128.42 125 91.2 103.6 93.4 113.8
1.19 63.75 127.50 179 84.0 103.1 92.8 113.3
1.15 63.29 126.57 178 83.6 102.5 92.3 112.7
1.11 62.83 125.65 177 83.1 101.9 91.7 112.2
1.07 62.36 124.73 176 82.6 101.4 91.2 111.6
1.04 62.02 124.04 123 89.8 101.0 90.8 111.2
1.03 61.90 123.81 175 82.2 100.8 90.6 111.1
0.95 60.98 121.96 122 89.1 99.7 89.5 109.9
0.91 60.52 121.04 172 80.8 99.2 88.9 109.4
0.88 60.17 120.35 171 80.3 98.7 88.5 109.0
0.86 59.94 119.89 121 88.3 98.5 88.3 108.7
0.84 59.71 119.42 170 79.8 98.2 88.0 108.4
0.78 59.02 118.04 120 87.6 97.4 87.1 107.6
0.77 58.91 117.81 168 78.9 97.2 87.0 107.4
0.71 58.21 116.43 119 86.9 96.4 86.2 106.6
0.64 57.41 114.81 103 95.4 95.4 85.2 105.6
0.63 57.29 114.58 164 77.0 118 86.1 95.3 85.1 105.5
0.59 56.83 113.66 163 76.5 94.7 84.5 104.9
0.56 56.48 112.97 117 85.4 94.3 84.1 104.5
0.53 56.14 112.28 161 75.6 93.9 83.7 104.1
0.50 55.79 111.58 116 84.7 93.5 83.2 103.7
0.43 54.99 109.97 115 83.9 92.5 82.3 102.7
0.39 54.52 109.05 157 73.7 91.9 81.7 102.2
0.37 54.29 108.59 114 83.2 91.7 81.4 101.9
0.31 53.60 107.20 113 82.5 90.8 80.6 101.0
0.26 53.03 106.05 153 71.8 90.1 79.9 100.3
0.25 52.91 105.82 112 81.8 90.0 79.8 100.2

LINKING, VALIDATING, AND PREDICTING TOEFL IBT SCORES AT ADVANCED PROFICIENCY EIKEN LEVELS 60
©2012 Eiken Foundation of Japan
0.24 52.79 105.59 101 93.5 89.9 79.6 100.1
0.19 52.22 104.44 111 81.0 89.2 78.9 99.4
0.17 51.99 103.97 150 70.4 88.9 78.7 99.1
0.13 51.53 103.05 110 80.3 88.3 78.1 98.5
0.08 50.95 101.90 109 79.6 100 92.6 87.6 77.4 97.8
0.07 50.83 101.67 147 69.0 87.5 77.3 97.7
-0.03 49.68 99.36 107 78.1 86.1 75.9 96.3
-0.07 49.22 98.44 99 91.7 85.5 75.3 95.8
-0.08 49.11 98.21 106 77.4 85.4 75.2 95.6
-0.13 48.53 97.06 105 76.6 84.7 74.5 94.9
-0.18 47.95 95.90 139 65.3 104 75.9 84.0 73.8 94.2
-0.20 47.72 95.44 98 90.7 83.7 73.5 94.0
-0.22 47.49 94.98 103 75.2 83.5 73.2 93.7
-0.32 46.34 92.68 101 73.7 82.1 71.9 92.3
-0.33 46.22 92.45 97 89.8 81.9 71.7 92.1
-0.41 45.30 90.60 99 72.3 80.8 70.6 91.0
-0.43 45.07 90.14 131 61.5 80.5 70.3 90.8
-0.49 44.38 88.76 97 70.8 79.7 69.5 89.9
-0.55 43.69 87.37 95 88.0 78.9 68.7 89.1
-0.58 43.34 86.68 95 69.3 78.5 68.2 88.7
-0.62 42.88 85.76 94 68.6 77.9 67.7 88.1
-0.70 41.96 83.91 92 67.2 76.8 66.6 87.0
-0.83 40.46 80.92 92 85.2 75.0 64.8 85.2
-0.92 39.42 78.84 91 84.3 73.7 63.5 83.9
-0.93 39.30 78.61 86 62.8 73.6 63.4 83.8
-1.00 38.50 77.00 90 83.3 72.6 62.4 82.8
-1.12 37.11 74.23 81 59.1 71.0 60.7 81.2
-1.15 36.77 73.54 88 81.5 70.5 60.3 80.8
-1.23 35.85 71.69 87 80.6 69.4 59.2 79.6
-1.30 35.04 70.08 86 79.6 68.4 58.2 78.7
-1.37 34.23 68.46 85 78.7 67.5 57.3 77.7
-1.43 33.54 67.08 84 77.8 66.6 56.4 76.9
-1.50 32.73 65.47 83 76.9 65.7 55.5 75.9
-1.62 31.35 62.70 81 75.0 64.0 53.8 74.2
-1.80 29.27 58.55 78 72.2 61.5 51.3 71.7
-1.86 28.58 57.16 77 71.3 60.7 50.4 70.9
-2.24 24.20 48.40 70 64.8 55.4 45.2 65.6
-2.40 22.36 44.71 67 62.0 53.2 42.9 63.4
Table 33 also presents information for the predictions of TOEFL iBT scores from EIKEN
scores, but this time the EIKEN common scale is based only on the written subtests (reading,
listening, and writing combined). For ease of interpretation, Table 33 is organized very
similarly to Table 32. Again, examinees with the same logit scores as others were
eliminated; in other words, there is only one examinee representing each logit score that was
achieved (for an equivalent table with all scores, see Appendix H).

LINKING, VALIDATING, AND PREDICTING TOEFL IBT SCORES AT ADVANCED PROFICIENCY EIKEN LEVELS 61
©2012 Eiken Foundation of Japan
Notice in Table 33 that the Grade 1 raw scores ranged from 59 (52.2%) to 100 (88.5%),
and that a passing score of 70% would be equivalent to about 94 on the TOEFL iBT.
Similarly, the Grade Pre-1 raw scores ranged from 62 (62.6%) to 90 (90.9%); a passing score
of 70% would be equivalent to about 80 on the TOEFL iBT. And finally, the Grade 2 raw
scores ranged from 48 (64.0%) to 75 (100.0%), with the lowest score, 64%, being equivalent
to about 57 on the TOEFL iBT. More importantly, notice that the three tests overlap
considerably when put on a common scale.
The EIKEN common-scale transformations to a hensachi scale and the new STEP
standardized scoring scale were once again very easy. Both scales were calculated using the
data for the EIKEN written test scores (reading, listening, and writing combined) to calculate
a mean (.017541) and standard deviation (.971934) for the EIKEN common scale. For the
hensachi transformation score, the mean was then subtracted from each score, and this
difference was divided by the standard deviation to yield a z score for that examinee. The z
score was then multiplied by 10 and a constant of 50 was added. This whole process can be
summarized as follows: hensachi score = ((logit score – mean of logit scores)/standard
deviation of logit scores) times 10 plus 50. For example, the logit score of the highest-
performing examinee was 2.86, so for that person the hensachi would = ((2.86 –
.017541)/.971934) × 10 + 50 = (2.842459/.971934) × 10 + 50 = 2.9245391 × 10 + 50 =
29.245391 + 50 = 79.245391 ≈ 79.25. Similarly, the STEP standardized score would be
calculated the same way, but the z score would be multiplied by 20 and a constant of 100
would be added. Using the same example of 2.86 logits, the STEP standardized score would
= ((2.86 –.017541)/.971934) × 20 + 100 = (2.842459/.971934) × 20 + 100 = 2.9245391 × 20
+ 100 = 58.490782 + 100 = 158.490782 ≈ 158.49.
Table 33 Predictions of TOEFL iBT Scores from EIKEN Written (RLW) Common-scale Scores
EIKEN common scores EIKEN grade level TOEFL iBT Rasch
logit Hensachi STEP
stdzd 1
Raw 1
%Pre-1
rawPre-1 %
2 raw 2%
Predicted score
68% lower
68% upper
2.86 79.25 158.49 (75)* (100.0) 118.76 107.44 130.09
2.08 71.22 142.44 100 88.5 109.90 98.58 121.23
1.88 69.16 138.32 98 86.7 107.63 96.31 118.96
1.79 68.24 136.47 97 85.8 106.61 95.28 117.94
1.64 66.69 133.39 (74)* (98.7) 104.91 93.58 116.23
1.54 65.66 131.33 94 83.2 103.77 92.45 115.10
1.39 64.12 128.24 92 81.4 102.07 90.74 113.40
1.25 62.68 125.36 90 79.6 100.48 89.15 111.81
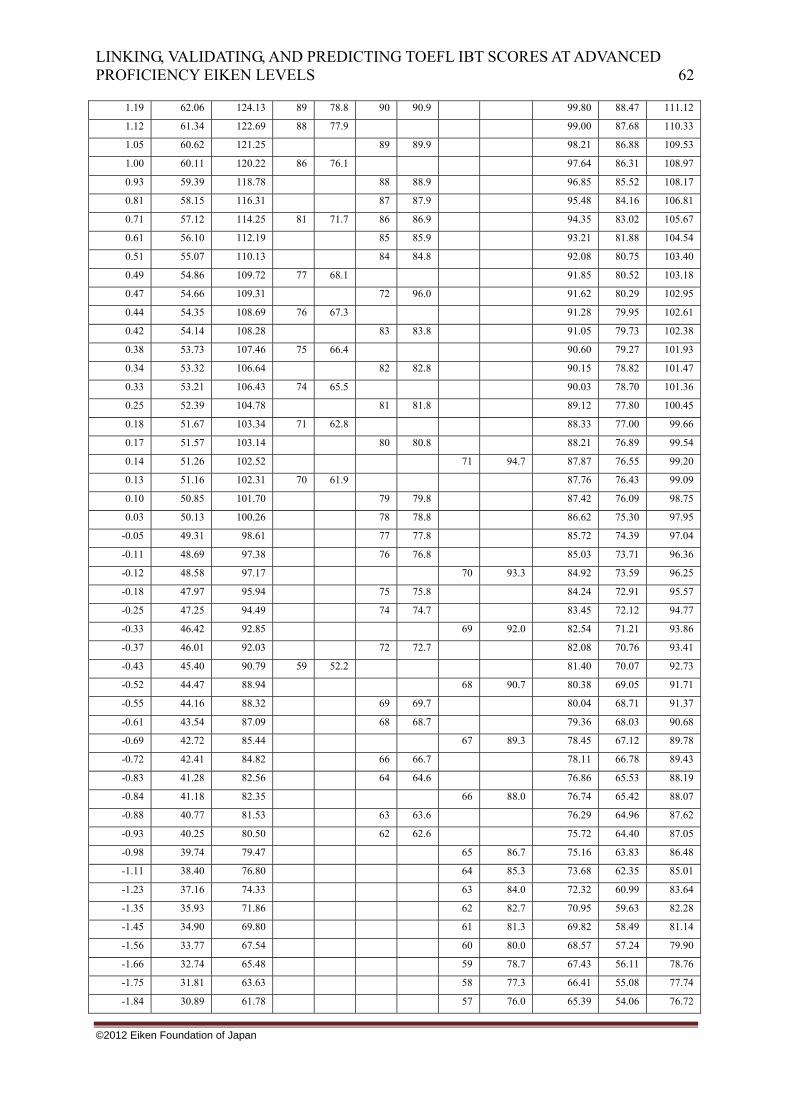
LINKING, VALIDATING, AND PREDICTING TOEFL IBT SCORES AT ADVANCED PROFICIENCY EIKEN LEVELS 62
©2012 Eiken Foundation of Japan
1.19 62.06 124.13 89 78.8 90 90.9 99.80 88.47 111.12
1.12 61.34 122.69 88 77.9 99.00 87.68 110.33
1.05 60.62 121.25 89 89.9 98.21 86.88 109.53
1.00 60.11 120.22 86 76.1 97.64 86.31 108.97
0.93 59.39 118.78 88 88.9 96.85 85.52 108.17
0.81 58.15 116.31 87 87.9 95.48 84.16 106.81
0.71 57.12 114.25 81 71.7 86 86.9 94.35 83.02 105.67
0.61 56.10 112.19 85 85.9 93.21 81.88 104.54
0.51 55.07 110.13 84 84.8 92.08 80.75 103.40
0.49 54.86 109.72 77 68.1 91.85 80.52 103.18
0.47 54.66 109.31 72 96.0 91.62 80.29 102.95
0.44 54.35 108.69 76 67.3 91.28 79.95 102.61
0.42 54.14 108.28 83 83.8 91.05 79.73 102.38
0.38 53.73 107.46 75 66.4 90.60 79.27 101.93
0.34 53.32 106.64 82 82.8 90.15 78.82 101.47
0.33 53.21 106.43 74 65.5 90.03 78.70 101.36
0.25 52.39 104.78 81 81.8 89.12 77.80 100.45
0.18 51.67 103.34 71 62.8 88.33 77.00 99.66
0.17 51.57 103.14 80 80.8 88.21 76.89 99.54
0.14 51.26 102.52 71 94.7 87.87 76.55 99.20
0.13 51.16 102.31 70 61.9 87.76 76.43 99.09
0.10 50.85 101.70 79 79.8 87.42 76.09 98.75
0.03 50.13 100.26 78 78.8 86.62 75.30 97.95
-0.05 49.31 98.61 77 77.8 85.72 74.39 97.04
-0.11 48.69 97.38 76 76.8 85.03 73.71 96.36
-0.12 48.58 97.17 70 93.3 84.92 73.59 96.25
-0.18 47.97 95.94 75 75.8 84.24 72.91 95.57
-0.25 47.25 94.49 74 74.7 83.45 72.12 94.77
-0.33 46.42 92.85 69 92.0 82.54 71.21 93.86
-0.37 46.01 92.03 72 72.7 82.08 70.76 93.41
-0.43 45.40 90.79 59 52.2 81.40 70.07 92.73
-0.52 44.47 88.94 68 90.7 80.38 69.05 91.71
-0.55 44.16 88.32 69 69.7 80.04 68.71 91.37
-0.61 43.54 87.09 68 68.7 79.36 68.03 90.68
-0.69 42.72 85.44 67 89.3 78.45 67.12 89.78
-0.72 42.41 84.82 66 66.7 78.11 66.78 89.43
-0.83 41.28 82.56 64 64.6 76.86 65.53 88.19
-0.84 41.18 82.35 66 88.0 76.74 65.42 88.07
-0.88 40.77 81.53 63 63.6 76.29 64.96 87.62
-0.93 40.25 80.50 62 62.6 75.72 64.40 87.05
-0.98 39.74 79.47 65 86.7 75.16 63.83 86.48
-1.11 38.40 76.80 64 85.3 73.68 62.35 85.01
-1.23 37.16 74.33 63 84.0 72.32 60.99 83.64
-1.35 35.93 71.86 62 82.7 70.95 59.63 82.28
-1.45 34.90 69.80 61 81.3 69.82 58.49 81.14
-1.56 33.77 67.54 60 80.0 68.57 57.24 79.90
-1.66 32.74 65.48 59 78.7 67.43 56.11 78.76
-1.75 31.81 63.63 58 77.3 66.41 55.08 77.74
-1.84 30.89 61.78 57 76.0 65.39 54.06 76.72

LINKING, VALIDATING, AND PREDICTING TOEFL IBT SCORES AT ADVANCED PROFICIENCY EIKEN LEVELS 63
©2012 Eiken Foundation of Japan
-1.93 29.96 59.92 56 74.7 64.37 53.04 75.69
-2.27 26.46 52.93 52 69.3 60.51 49.18 71.83
-2.58 23.27 46.55 48 64.0 56.99 45.66 68.31
* Note that perfect scores of 100% are routinely deleted from Rasch analyses on the theory that the Rasch model is unable to incorporate people whose level might be higher, or even much higher, than their score of 100% places them on the logit scale. A similar problem may exist for the next person down who scored 98.7%.
What Do the Results for Research Question 3 Mean for Future Predictions of TOEFL iBT and Other Standardized Proficiency Tests? From an operational standpoint, the most important aspect of this study was Research
Question 3, which showed how EIKEN common-scale scores are equivalent to TOEFL iBT
scores, and how those EIKEN common-scale scores relate to raw scores and percent cut-point
scores on each of the grade-level tests. Given the importance of this last issue, we will devote
a separate section to discussing and interpreting these results.
Comparing the RLWS results in tables 30 and 32 with the RLW results in tables 31 and
33, it seems clear that the full RLWS regression model shown in tables 30 and 32 creates the
clearest pattern in terms of separating examinees from the EIKEN grades 1, Pre-1, and 2 on
the EIKEN common scale. Certainly there is still overlap, with the top Grade 2 candidates
having measures overlapping with the bottom Grade 1 candidates, in both the RLWS and
RLW analyses, but the separation is clearer in the RLWS analysis. From a content validity
perspective, we would certainly expect some overlap between these three tests. Further
research might usefully investigate the nature and degree of these overlaps in items.
Readers may have noticed that, in the RLW model results (tables 31 and 33), some Grade
2 examinees are above the top Grade 1 and Pre-1 candidates. It is worth noting that perfect
scores of 100% (like that of the top Grade 2 person) are routinely deleted from Rasch
analyses. This is based on the theory that the Rasch model is unable to incorporate such
people whose level might be higher or even much higher than their score of 100% places
them on the logit scale that serves as the basis of the EIKEN common scale. A similar
problem may exist for the next person down, who scored 98.7%. Given that these two people
clearly do not fit the overall pattern in the Grade 2 data, they may be outliers or errors created
by putting examinees into groups on the basis of TOEFL iBT scores that are up to two years
old. Also, given that the Grade 2 sample is particularly small, a larger study would probably
resolve this apparent anomaly.
Considering the regression results from another perspective, STEP has estimated
elsewhere that EIKEN certificate holders for grades 1, Pre-1, and 2 would have certain

LINKING, VALIDATING, AND PREDICTING TOEFL IBT SCORES AT ADVANCED PROFICIENCY EIKEN LEVELS 64
©2012 Eiken Foundation of Japan
minimum TOEFL scores: (a) Grade 1 certificate holders are likely to score at least 100 on
TOEFL iBT, (b) Grade Pre-1 at least 80, and (c) Grade 2 at least 45. So the question arises as
to whether the results in this study support those estimates. Looking at Grade 1 raw scores in
Table 30, only two examinees would have failed the speaking test (based on the unadjusted
cutoff score of 60% for all grades on the speaking test). However, if we look at the total for
RLW, from the bottom (examinee 099) up to examinee 059, only two examinees (030, 041)
would have passed the first-stage test (which is made up of RLW). The remaining 10
examinees would have failed the first-stage test (based on the unadjusted cut-off of 70% for
grades 1 and Pre-1).
Recall that the regression analysis results reported in Table 30 are based on the EIKEN
common-scale scores derived from the RLWS Rasch analysis. Nonetheless, we see that until
examinees’ logit scores predict a TOEFL score of close to 100, they do not have first-stage
raw scores (RLW) that would be high enough to pass the RLW first-stage test. By contrast,
once their EIKEN common-scale scores (based on all four skills, RLWS) predict a TOEFL
score of 100 or more (i.e., from test taker 079 up), examinees’ first-stage raw test scores
would also achieve a passing level on the first-stage test. As these examinees would also have
passed the second stage (based on their raw scores), we can say that examinees in this sample
whose EIKEN common-scale scores predict a TOEFL score of 100 or more would also have
passed this form of the EIKEN test. In fact, examinees predicted to score 97 or higher on the
TOEFL would also have passed the EIKEN first and second stages for Grade 1.
A similar pattern appears for Grade Pre-1. Examinees who are predicted to score less
than 80 on the TOEFL test would tend to fail the first-stage EIKEN test (with a 70% cut-off
for grades 1 and Pre-1), though here it is often by one or two points, which is within the
standard error of measurement. For Grade 2, all examinees are predicted to have TOEFL test
scores higher than 45, which STEP has identified as the minimum score expected for a Grade
2 certificate. Except for examinee 080, who would fail the second stage, all examinees who
took the Grade 2 test would pass both the first and second stages based on their raw scores.
Thus the trends in the results based on this sample tend to support the previous EIKEN
estimates of TOEFL scores that would be obtained by EIKEN certificate holders. In these
results, examinees do not demonstrate raw scores that would allow them to pass the first-
stage written test until their EIKEN common-scale scores predict a TOEFL score roughly
similar to the cut points mentioned above. By the same token, once students demonstrate raw
scores that would be passing on the first-stage test, their EIKEN common-scale scores predict

LINKING, VALIDATING, AND PREDICTING TOEFL IBT SCORES AT ADVANCED PROFICIENCY EIKEN LEVELS 65
©2012 Eiken Foundation of Japan
a TOEFL score at or above the level previously predicted as a minimum for EIKEN
certificate holders (i.e., Grade 1 certificate holders have at least 100 on TOEFL iBT, Grade
Pre-1 at least 80, and Grade 2 at least 45).
Conclusions
Limitations of the Current Study and Suggestions for Future Research
As with any statistical study, this study has limitations. The first limitation is that we were
only able to recruit 123 examinees and only for the EIKEN tests for grades 1, Pre-1, and 2.
Certainly, using strategies first proposed, explored, and demonstrated in this study, the STEP
organization may want to carry out further research with larger sample sizes. Such studies
should lead to even more stable Rasch analyses that can then serve as the basis of better,
more conclusive correlational, factor, and regression analyses.
Second, forming the three grade-level groups based on their TOEFL iBT scores, though
necessitated by the conditions under which the study was conducted, may have been a less-
than-ideal strategy. Such selection procedures may have created somewhat truncated
distributions for these three groups that could have affected the Rasch analyses as well as the
subsequent correlational, factor, and regression analyses. A better strategy might have been to
select large samples of all the students from the wide range of abilities represented by those
taking the three grade-level tests under real operational conditions in Japan. Perhaps in a
future study in Japan, larger groups of examinees taking these three grade-level tests under
actual operational conditions could be offered the opportunity to take a free TOEFL iBT test
(paid for by STEP) in order for STEP to gather data for larger samples of examinees taking
actual operational versions of the tests.
Third, we expected and certainly found some overlap between the results for the three
groups taking the three tests in this study. That might at first seem problematic from a content
validity perspective. However, given what we wrote in the previous paragraph, we are not
surprised. Indeed, the larger follow-up study described in that paragraph might usefully
investigate the nature and degree of these overlaps in item difficulty level and test-taker
ability.
Fourth, the 24 anchor items used in this study were sufficient in number, but they may
have been too easy in relation to the ability levels of the examinees across the three groups.
Any future study should use anchor items predetermined to include items with difficulties
that range across the entire range of examinee abilities. Such an anchoring design would

LINKING, VALIDATING, AND PREDICTING TOEFL IBT SCORES AT ADVANCED PROFICIENCY EIKEN LEVELS 66
©2012 Eiken Foundation of Japan
probably provide more stable Rasch analyses overall and would therefore create logit scores
that would work better throughout the study.
Fifth, the biodata results from the questionnaire indicate that 85 out of the 125 people, or
68%, took the TOEFL iBT between one and two years before the current research was
undertaken (that is, before they took the EIKEN tests for this study). Many of them would
have been living or studying in the U.S. for some time after taking the TOEFL iBT, and even
if they continued in their home countries until just before the current research (32 participants
had two months’ experience in the U.S. or less), many would probably have continued
preparing and improving their English proficiency after taking the TOEFL iBT. ETS states
that using scores up to two years old is permissible, and it was therefore reasonable for us to
assume that such scores would remain useful and relevant. However, as TOEFL iBT scores
got older they may have led to an underestimation of the actual English ability levels of the
students living in the United States by the time of this study, which would naturally affect all
the analyses in this study, especially the predictions of TOEFL iBT scores.
Final Comments
Direct answers to the three research questions were provided in the Discussion section
along with our interpretations of the related results. To sum up, the answer to Research
Question 1 was that this study provides a small-scale demonstration of techniques that STEP
can use in the future to equate its grade-level tests to an EIKEN common scale. It might
prove useful if they were to do so operationally and on a permanent basis. Under those
conditions STEP could report an EIKEN passing grade to each examinee on each grade-level
test as well as their EIKEN common-scale score.
The answer to Research Question 2 was that the results of this study have provided
additional evidence in support of arguments for the concurrent criterion-related and construct
validity of the EIKEN grade-level test scores. The criterion-related validity evidence is
implicit in the moderate to high correlations found between various combinations of the
EIKEN subtests and the subtest as well as total TOEFL iBT scores. Evidence in support of
the construct validity of the EIKEN total took two forms. Convergent/discriminant validity
was supported by a two-principle-component analysis solution for the common-scale scores
for all subtests of the EIKEN and TOEFL iBT. This analysis showed a pattern of loadings
indicating that the two test batteries are measuring in similar ways. Differential-group
validity was indicated in one of the ANOVA studies: three groups were created on the basis
of differences in their overall English language proficiency as measured on the TOEFL iBT;

LINKING, VALIDATING, AND PREDICTING TOEFL IBT SCORES AT ADVANCED PROFICIENCY EIKEN LEVELS 67
©2012 Eiken Foundation of Japan
the ANOVA and Scheffé post-hoc results for the EIKEN common-scale scores showed that
there were significant differences for all possible combinations of mean differences.
The answer to Research Question 3 is that we have been able to predict what the EIKEN
common-scale scores equivalent to TOEFL iBT scores will be—not just in terms of what
passing Grade 1, Pre-1, or 2 means in terms of equivalent TOEFL iBT scores (like the
previous research by Clark & Zhang, no date; Hill, 2010), but rather in terms of which scores
along the entire EIKEN common scale predict which TOEFL iBT scores. Naturally, those
scores can be used to further consider what passing Grade 1, Pre-1, or 2 means in terms of
equivalent TOEFL iBT scores; in addition, the intermediary predictions between the passing
points on the scale—that is, the scores all along the EIKEN common scale (along with the
equivalent percentage and hensachi scores shown in our tables)—provide additional
information that should prove useful in the future to examinees, STEP staff, and the general
educational establishment in Japan. We hope that this study will thus serve as a jumping-off
point to further research into the validity, decision making, and other contributions that
EIKEN tests make in Japan year after year.

LINKING, VALIDATING, AND PREDICTING TOEFL IBT SCORES AT ADVANCED PROFICIENCY EIKEN LEVELS 68
©2012 Eiken Foundation of Japan
References
Al-Musawi, N. M., & Al-Ansari, S. H. (1999). Test of English as a Foreign Language and
First Certificate of English tests as predictors of academic success for undergraduate
students at the University of Bahrain. System, 27, 389–399.
Ayers, J. B., & Quattlebaum, R. F. (1992). TOEFL performance and success in a master’s
program in engineering. Educational and Psychological Measurement, 52, 973–975.
Chalhoub-Deville, M., & Turner, C. E. (2000). What to look for in ESL admission tests:
Cambridge certificate exams, IELTS, and TOEFL. System, 28, 523–539.
Clark, M., & Zhang, Y. (no date). Broadening international student access: Looking at
alternative English proficiency tests. Manoa, Hawai‘i: University of Hawai‘i at Manoa.
Dederick, T., Ban, H., & Oyabu, T. (2002). Metrical analysis and comparison of English
proficiency tests. Bulletin of Hokuriku University, 26, 73–84.
Dunlea, J. (2009). The EIKEN Can-do List: improving feedback for an English proficiency
test in Japan. In L. Taylor & C. Weir (Eds.), Language testing matters: Investigating the
wider social and educational impact of assessment – Proceedings of the ALTE
Cambridge Conference, April 2008, Studies in Language Testing: Vol. 31 (pp. 245–262).
Cambridge: Cambridge University.
Dunlea, J. (2010). Designing a research agenda to justify the uses and interpretations of the
EIKEN tests. Proceedings of the 12th Academic Forum on English Language Testing in
Asia, 18–37. Language Training and Testing Centre, Taipei.
Erikawa, H. (2005). A critical examination of “a strategic plan to cultivate ‘Japanese with
English abilities.’” 34th Bulletin of the Chubu English Language Education Society, 321–
328.
Educational Testing Service (ETS). (2010). The TOEFL Test: Find your format. Retrieved
February 5, 2010, from
http://www.ets.org/bin/getprogram.cgi?test=toefl&redirect=format
Gorsuch, G. J. (1995). Tests, testing companies, educators, and students. The Language
Teacher 19, 37, 39, 41.
Graham, J. G. (1987). English language proficiency and the prediction of academic success.
TESOL Quarterly, 21, 505–521.
Hamaoka, Y. (1997). Readability sukoa to goi no sokumen yori mita jitsuyou eigo ginou
kentei no datousei (Validity of the EIKEN exams with respect to readability and
vocabulary). STEP Bulletin, 9, 41–59.

LINKING, VALIDATING, AND PREDICTING TOEFL IBT SCORES AT ADVANCED PROFICIENCY EIKEN LEVELS 69
©2012 Eiken Foundation of Japan
Henry, N. (1998). A reaction to MacGregor’s “the EIKEN test: an investigation.” JALT
Journal, 20, 83–85.
Hill, Y. Z. (2010). Validation of the STEP EIKEN test for college admission (Unpublished
doctoral dissertation). Manoa, Hawai‘i: University of Hawai‘i at Manoa.
Ishida, M. (2004). Eigo kyouin ga sonaete okubeki eigoryoku: EIKEN jun 1-kyuu, TOEFL
550 ten, TOEIC 730 ten no mokuhyouchi wo chuushin ni (English ability required for
English teachers: With respect to the benchmarks of the EIKEN exam Level Pre-1,
TOEFL score of 550, and TOEIC score of 730). ELEC Bulletin, 111, 10–17.
Jochems, W., Snippe, J., Smid, H. J., & Verweij, A. (1996). The academic progress of foreign
students: Study achievement and study behaviour. Higher Education, 31, 325–340.
Johnson, P. (1988). English language proficiency and academic performance of
undergraduate international students. TESOL Quarterly, 22, 164–168.
Krausz, J., Schiff, A., Schiff, J., & Van Hise, J. (2005). The impact of TOEFL scores on
placement and performance of international students in the initial graduate accounting
class. Accounting Education, 14, 103–111.
Light, R. L., Xu, M., & Mossop, J. (1987). English proficiency and academic performance of
international students. TESOL Quarterly, 21, 251–261.
MacGregor, L. (1995a). Preparing for the EIKEN test. The Language Teacher, 19, 29–30.
MacGregor, L. (1995b). More on the EIKEN. The Language Teacher, 19, 51, 86.
MacGregor, L. (1997). The EIKEN test: An investigation. JALT Journal, 19, 24–42.
MacGregor, L. (1998). The author responds: A brief clarification. JALT Journal, 20, 85–86.
Mathews, J. (2007). Predicting international students’ academic success…may not always be
enough: Assessing Turkey’s foreign study scholarship program. Higher Education, 53,
645–673.
Miura, T., & Beglar, D. (2002). The EIKEN vocabulary section: An analysis and
recommendations for change. JALT Journal, 24, 107–129.
Nagashima, K. (2001). TOEIC, EIKEN, chuugaku, koukou de motomerareteiru eitango no
dankaibetsu bunrui (Stepwise classification of English vocabulary required for TOEIC,
the EIKEN exams, junior high schools, and high schools). STEP Bulletin, 13, 184–201.
Neal, M. E. (1998). The predictive validity of the GRE and TOEFL exams with GPA as the
criterion of graduate success for international graduate students in science and
engineering. (ED424294)
Nelson, C. V., Nelson, J. S., & Malone, B. G. (2004). Predicting success of international

LINKING, VALIDATING, AND PREDICTING TOEFL IBT SCORES AT ADVANCED PROFICIENCY EIKEN LEVELS 70
©2012 Eiken Foundation of Japan
graduate studies in an American university. College and University Journal, 80, 19–27.
Nielsen, B. (2000). Determining test reliability and quality of EIKEN test items: A statistical
analysis of first year Kosen student responses to test items of an EIKEN third level test.
Bulletin of Kushiro National College of Technology, 34, 81–91.
Okuno, H. (2007). A critical discussion on the Action Plan to cultivate “Japanese with
English abilities.” The Journal of Asia TEFL, 4, 133–158.
Shimatani, H. (2007). External tests and their washback effects on EFL teaching and learning.
Memories of the Faculty of Education, Kumamoto University, 56, 111–120.
Simner, M. L. (1999). Reply to the universities’ reaction to the Canadian Psychological
Association’s position statement on the Test of English as a Foreign Language. European
Journal of Psychological Assessment, 15, 284–294.
STEP (2010a). Colleges, universities, and institutes worldwide recognizing EIKEN for
international admissions. Retrieved January 25, 2010, from
http://stepeiken.org/benefits/internationally-recognized.shtml
STEP (2010b). EIKEN no meritto (Advantages of EIKEN). Retrieved January 25, 2010, from
http://www.eiken.or.jp/advice/treatment/entrance.html and
http://www.eiken.or.jp/advice/treatment/unit.html
Stoynoff, S. (1997). Factors associated with international students’ academic achievement.
Journal of Instructional Psychology, 24, 56–68.
Tsuda, Y., & Koga, S. (1990). EIKEN no kekka to eigoka no hyouka tono kanren ni tsuiteno
kenkyuu (Study on the relationship between the results of the EIKEN exams and the
performance assessment at the English department). STEP Bulletin, 2, 118–125.
Vinke, A. A., & Jochems, W. M. G. (1993). English proficiency and academic success in
international postgraduate education. Higher Education, 26, 275–285.
Wimberley, D. W. (2002).
Wimberley, D. W., McCloud, D. G., & Flinn, W. L. (1992). Focus on international students
in the United States: Predicting success of Indonesian graduate students in the United
States. Comparative Education Review, 36, 487–508.
Woodrow, L. (2006). Academic success of international postgraduate education students and
the role of English proficiency. University of Sydney Papers in TESOL, 1, 51–70.
Yule, G., & Hoffman, P. (1990). Predicting success for international teaching assistants in a
U.S. university. TESOL Quarterly, 24, 227–243.

LINKING, VALIDATING, AND PREDICTING TOEFL IBT SCORES AT ADVANCED PROFICIENCY EIKEN LEVELS 75
©2012 Eiken Foundation of Japan
Appendix A
Online Background Questionnaire for Examinees
Page 1
Page 2

LINKING, VALIDATING, AND PREDICTING TOEFL IBT SCORES AT ADVANCED PROFICIENCY EIKEN LEVELS 76
©2012 Eiken Foundation of Japan
Page 3
Page 4

LINKING, VALIDATING, AND PREDICTING TOEFL IBT SCORES AT ADVANCED PROFICIENCY EIKEN LEVELS 77
©2012 Eiken Foundation of Japan
Page 5

LINKING, VALIDATING, AND PREDICTING TOEFL IBT SCORES AT ADVANCED PROFICIENCY EIKEN LEVELS 78
©2012 Eiken Foundation of Japan
Appendix B Online Background Questionnaire for Examiners
Page 1

LINKING, VALIDATING, AND PREDICTING TOEFL IBT SCORES AT ADVANCED PROFICIENCY EIKEN LEVELS 79
©2012 Eiken Foundation of Japan
Page 2
Page 3

LINKING, VALIDATING, AND PREDICTING TOEFL IBT SCORES AT ADVANCED PROFICIENCY EIKEN LEVELS 80
©2012 Eiken Foundation of Japan
Page 4

©2012 Eiken Foundation of Japan
81
Appendix C Winsteps™ Anchor Item Files
(Reading, Listening, Writing, and Speaking Combined) D1: Anchor Item Linking File Grade 1 1 1.21 2 0.28 3 0.9 4 0.9 5 0.59 6 0.75 7 1.06 8 0.59 9 0.28 10 -0.64 11 -0.06 12 0.59 13 -0.06 14 -0.88 15 -0.43 16 0.59 17 -0.43 18 -0.06 19 1.06 20 0.11 21 -0.24 22 -0.06 23 -1.95 24 -2.69 25 0.75 26 -1.95 27 1.21 28 -1.15 29 -0.06 30 -1.95 31 -2.69 32 -0.43 33 -0.88 34 -2.69 35 -3.93 36 -0.06 37 -1.49 38 -0.43 39 -0.06 40 -3.93 41 -0.88 42 -2.69 43 -1.49 44 -2.69 45 -1.15 46 -1.15 47 -2.69 48 -1.95 49 -2.69 50 0.44 51 -1.49 52 -0.24 53 1.55 54 -1.95

©2012 Eiken Foundation of Japan
82
55 -1.49 56 -0.06 57 -1.49 58 -0.88 59 -1.95 60 -0.88 61 0.11 62 0.59 63 -1.49 64 -3.93 65 -1.95 66 -1.95 67 -1.49 68 -0.43 69 0.44 70 0.44 71 0.4 72 -0.82 73 0.54 74 0.47 75 0.35 76 -1.46 77 0.47 78 0.4 D2: Anchor Item Linking File Grade Pre-1 1 -1.08 2 -1.56 3 -0.98 4 -1.19 5 -3.96 6 -1.87 7 -1.71 8 -1.19 9 -0.04 10 -1.71 11 -1.19 12 -1.31 13 -1.56 14 -1.71 15 -1.56 16 -1.71 17 -3.24 18 -2.5 19 -3.24 20 -2.81 21 -1.43 22 -1.71 23 -0.44 24 -2.25 25 -1.56 26 -3.24 27 -0.98 28 -2.25 29 -2.5 30 -1.19 31 -2.81 32 -0.7 33 -1.56

©2012 Eiken Foundation of Japan
83
34 -2.25 35 -0.88 36 -3.96 37 -1.87 38 -2.81 39 -1.31 40 -2.5 41 -3.96 42 -2.81 43 -2.5 44 -2.81 45 -1.31 46 -2.5 47 -1.71 48 -1.08 49 -1.87 50 -2.25 51 -0.61 52 0.42 53 -5.18 54 -1.08 55 -2.05 56 -2.81 57 0.19 58 -0.88 59 -0.36 60 0.35 61 -0.36 62 0.27 63 -0.79 64 -1.19 65 -1.56 66 -1.19 67 -1.43 68 -2.5 69 -0.36 70 -0.36 71 -0.25 72 -1.57 73 -1.19 74 -0.79 75 -0.84 76 -1.22 77 -1.04 78 -1.13 79 -0.77 D3: Anchor Item Linking File Grade 2 1 -3.95 2 -4.68 3 -3.5 4 -4.68 5 -1.59 6 -3.5 7 -3.95 8 -2.91 9 -2.31 10 -2.91 11 -4.68
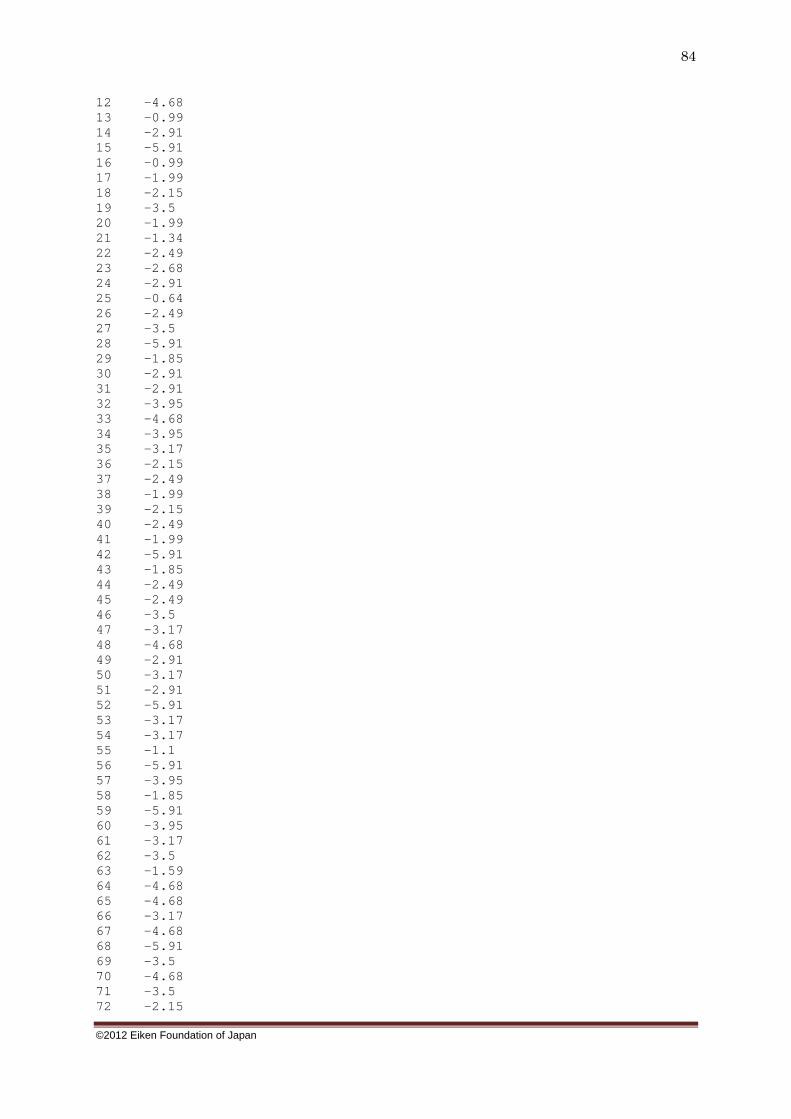
©2012 Eiken Foundation of Japan
84
12 -4.68 13 -0.99 14 -2.91 15 -5.91 16 -0.99 17 -1.99 18 -2.15 19 -3.5 20 -1.99 21 -1.34 22 -2.49 23 -2.68 24 -2.91 25 -0.64 26 -2.49 27 -3.5 28 -5.91 29 -1.85 30 -2.91 31 -2.91 32 -3.95 33 -4.68 34 -3.95 35 -3.17 36 -2.15 37 -2.49 38 -1.99 39 -2.15 40 -2.49 41 -1.99 42 -5.91 43 -1.85 44 -2.49 45 -2.49 46 -3.5 47 -3.17 48 -4.68 49 -2.91 50 -3.17 51 -2.91 52 -5.91 53 -3.17 54 -3.17 55 -1.1 56 -5.91 57 -3.95 58 -1.85 59 -5.91 60 -3.95 61 -3.17 62 -3.5 63 -1.59 64 -4.68 65 -4.68 66 -3.17 67 -4.68 68 -5.91 69 -3.5 70 -4.68 71 -3.5 72 -2.15

©2012 Eiken Foundation of Japan
85
73 -3.5 74 -3.95 75 -2.68 76 -2.02 77 -1.04 78 -2.42 79 -1.82 80 -1.5 81 -2.1 82 -3.28

©2012 Eiken Foundation of Japan
86
Appendix D Winsteps™ Grade 1 Analysis
(FOR READING, LISTENING, WRITING, AND SPEAKING COMBINED) E1: Command File &INST TITLE =***** TEST Person =person; persons are P ITEM =item; items are I DATA = G1RLWSd.txt; IAFILE = LAlinksG1.txt; SAFILE =* 69 1 -.38 69 2 -2.32 69 3 -.92 69 4 -.19 69 5 .22 69 6 1.10 69 7 2.49 70 1 -.38 70 2 -2.32 70 3 -.92 70 4 -.19 70 5 .22 70 6 1.10 70 7 2.49 71 3 -.82 71 4 -.31 71 5 1.13 72 3 -.82 72 4 -.31 72 5 1.13 73 4 -.35 73 5 .35 74 4 -.35 74 5 .35 75 3 -.82 75 4 -.31 75 5 1.13 76 3 -.82 76 4 -.31 76 5 1.13 77 4 -.35 77 5 .35 78 4 -.35 78 5 .35 * ITEM1 =4; NI =78; NAME1 =1; NAMELEN=3; ALPHANUM = 0123456789ABCDEF; XWIDE =1; ISGROUPS=* 1-31 A;0/1 32-41 B;0/2 42-61 A;0/1 62-68 B;0/2 69-70 C;0,2,4,6,8,10,12,14 71-72 D;3,6,9,12,15 73-74 E;2,4,6,8,10 75-76 D;3,6,9,12,15 77-78 E;2,4,6,8,10 * IREFER=* 1-31 A;0/1 32-41 B;0/2 42-61 A;0/1 62-68 B;0/2 69-70 C;0,2,4,6,8,10,12,14 71-72 D;3,6,9,12,15 73-74 E;2,4,6,8,10 75-76 D;3,6,9,12,15 77-78 E;2,4,6,8,10 * CODES =0123456789ABCDEF; IVALUEA =01**************; IVALUEB =0*1*************; IVALUEC =0*1*2*3*4*5*6*7*; IVALUED =***1**2**3**4**5; IVALUEE =**1*2*3*4*5*****;

©2012 Eiken Foundation of Japan
87
IWEIGHT=* 1-31 1; 32-41 2; 42-61 1; 62-68 2 69-70 2; 71-72 3; 73-74 2; 75-76 3; 77-78 2; * UPMEAN =0; USCALE =1; UDECIM =2; &END END LABELS E2: Data File 00611101111011111001001111111010112222022222111011111111111111000222222A8CC68CF8A 0090101110000111110101010011101111222222222211110111011011111110222202244CCA8CC88 01111101110101011111111111110010110222200222111111111100111111112222222AA9F88CFAA 01211110100111111111111111111001110222222222111111111111111111010222222ACFFA6FFA6 01311011011111111111111101101011112222222222111111011110111111112222022CACF8ACF8A 01400001100111001000001001011111112222222222111111111010101111102222222CCFF8AFF88 01901111011110111111111111111111112022222222111111111110111111012222222CACFAAFFAA 02700100101010011111101111101011112222022022111111111110111111112222222AA9F8A9F88 02800111101110010010000101100011112222222022111111110100110101110222220889C66CF66 0301110001011100111011010111101011222222222211111111111011010111022222266CC689F8A 04100011011011110111111111101001112222222222111111110110111111112222222AA69666968 04801100011111111111101111101011112222222222111011111101111011100222220ACCC88CC86 05811000101111111111000101101111112222220022111111111111111111110222222AACCA8CFAA 0590101110100100110010110110111011222222222011111111010011001110222222266FF68FF86 07000000000010011011101111111011112002020222111111111100111111112222222AACFAACFAA 07101111110111111111101111101010112222022022111111110111010110102222222889F8A9F8A 0790001110111100100100001110100111002222202211111111111010111111022222288FFAAFFAA 08901101000010001101101011101010112222220220111111110110111000110022200A8CF86CC86 09000000110110011111101011101111112222020222001101010100110111110222202886F886F8A 09100000001100000100001111111011012222000020111111110000110111102022220669CA8CF86 099101111011111111011100011010111122220222221100001110101111110102202006869666C66 1001000001101010000100011111111111222220222010111111111111111111222022266CCA89C68 10711010000011011111110011111110110022222222111111110111110101100022222689C669C88 11101111011011111001111101111111012222022222111101111111111111112222222CAC968CC66 1130100000011110010010011111110111222222222211111111010011011100022222068FFA8FFA8 1181111000110111110101101110111011022202202211101110111000111111222222288FFAACFAA 1211100101001111110010011111101110002222002011111111011011111111222222244CF8AFF8A 12300000100100001111111010101110110222222022101111110111110101100222220CCCFAA9FAA

©2012 Eiken Foundation of Japan
88
Appendix E Winsteps™ Grade Pre-1 Analysis
(For Reading, Listening, Writing, and Speaking Combined) F1: Command File &INST TITLE =***** TEST Person =person; persons are P ITEM =item; items are I DATA = P1RLWSd.txt; IAFILE = LAlinksP1.txt; SAFILE =* 71 1 -.38 71 2 -2.32 71 3 -.92 71 4 -.19 71 5 .22 71 6 1.10 71 7 2.49 72 2 -1.12 72 3 -.58 72 4 .08 72 5 1.61 73 2 -1.12 73 3 -.58 73 4 .08 73 5 1.61 74 2 -1.12 74 3 -.58 74 4 .08 74 5 1.61 75 2 -1.12 75 3 -.58 75 4 .08 75 5 1.61 76 2 -1.12 76 3 -.58 76 4 .08 76 5 1.61 77 2 -1.12 77 3 -.58 77 4 .08 77 5 1.61 78 2 -1.12 78 3 -.58 78 4 .08 78 5 1.61 79 2 -1.01 29 3 1.01 * ITEM1 =4; NI =79; NAME1 =1; NAMELEN=3; ALPHANUM = 0123456789ABCDE; XWIDE =1; ISGROUPS=* 1-31 A;0/1 32-41 B;0/2 42-65 A;0/1 66-70 B;0/2 71 C;0,2,4.6.8.10,12,14 72-78 D;1,2,3,4,5 79 E;1,2,3 * IREFER=* 1-31 A;0/1 32-41 B;0/2 42-65 A;0/1 66-70 B;0/2 71 C;0,2,4.6.8.10,12,14 72-78 D;1,2,3,4,5 79 E;1,2,3 * CODES =0123456789ABCDE; IVALUEA =01*************; IVALUEB =0*1************; IVALUEC =0*1*2*3*4*5*6*7; IVALUED =*12345*********; IVALUEE =*123***********; IWEIGHT=* 1-31 1;

©2012 Eiken Foundation of Japan
89
32-41 2; 42-65 1; 66-70 2; 71 2; 72-78 1; 79 1; * UPMEAN =0; USCALE =1; UDECIM =2; &END END LABELS
F2: Data File 0010110101001100110101111011111101002020222211111001100101100110111022220854344443 0021111111111111011111111011111101202220222211010010000111100110010122220844445542 0051101111111111111111111001111001000222222211111111110111101110011122222C54445553 0070111111100100010111110111111011200220222211111011111111101111111122202644444342 0081111111101111111111111111100111222222222211111101101100101001111022000A53444143 0101101110101101111111111011111101022222002211011111011111101011111122222E55445553 0150100111011000000101101010111101022222222211111101110100110001011122220A43334442 0171011111111111111111100011111011022022222211101101111111111101110100020C45454453 0181010101000001110101101011111111022222222211111101110111100100011122222444333442 0201101111111011101111110111111111222222202011101011100111101100000022220434334232 0211111111110111111111111111101101002222202211111111110111010000011120220C55454553 0221101111001111101111111010111111222222222211111111110111110101001102222C44335442 0231111111111111110111011111111111202222222211111111100111101111100120220E44544442 0251101111101101111111111011111111222022202211111111111111101111111122222A44433432 0320001111111101111111111111101101222222220211111101100111000000010022002854555543 0361111111111111111111111111111100222222222201111110111101100011101122200C52354443 0371101111100011110111111101101101022022200211111100100111111101011002202844444443 0381101111111111111111111111111111022222222211111110101111101110011122220A44445342 0391011111101111011111111011111111022222222211101111110111111101001100220643454542 0401001110101111101111111110111111222222222211111100111111101100001022202C53454443 0471110111111111111111111011111111222222222211111111101111111100111122222A35423441 0491101011111111111111111011101111022022222211101111100111101101101102202A45444332 0501111111001111111111111001101111222222222201011101110101111101010120202C44435552 0541111111111111100111111111111111222222222211111111100111101111010102220A33333532 0550111110101111111111111111101111222222200211111111101100110001001122002A43444331 0601111111111111111111111111111111222222222211101111110111101011110102222A55445552 0631111111111111111111111111111111222022222211111111111111111111011122202A55555543 0641110111100110101011111011110111222222222211111111100101111100100122222C53455552 0650111111100111111111111111111111222222222211111111111111101111001122202A35455552 0670011111101111111001110111111111022202222201111111110111101111111102222654444552 0721101111101111111110111011111111220222202211111111110101111101011120202A43344451 0730111110111011111111111111111111222222202211111111111111111011111122202854444543 0740111110001000111111001110101111222022222211101111100101101001111002200654414343 0751111111111111111111111110111111222022222211111111110111111111011022220A44444443 0760111110111101111111111110111111220222202211111111111111111111111122222655555533 0780011111101111111111101010111111222022022211111101111111101111011122220855445442 0871110101101001111111101111111111022222222211110111110111111011011122220C55555553 0881111111111110111111111111101111222222222211111111110111111111111122222855454552 0931111111111111111111111011111111222222222211111111111101111000111120222445334242 0961111111001011011111111111101111222222222210111010100111111000011122202853345453 0981110111111110111111101110101111220020202211111111111111111111111122222845444342 1031111111111111111111111111111111222022022211111111111101000000001122200045544432 1051111111110111111111011111111111022022222211100011101100100001011120202A44444243 1060110100001011001111101110010000222020200211110101110110101011101122222845432222 1081111111111111111110111011111111222222222211101011110100101100000022202C55555553 1101010101000111101111110101101111202222222211111101100111101100111102200232213331 1141111111111011110111101111101111222222222211111111111111110111011120220E54444442 1161001111011010111111111011010100002220222210101111110111111000101102202455444553 1171111101101111111111111111111111222222222210101111111111111111010122222655454533 1201111111001110011111111001101111222222222211101110010111110100101122222834445453 1221111110111111011111111111111111222020222211111111011111111010011122202644444443 1251110111101111111111110111111111202222222211111111110111111101111122222655443443 1261110111111011111111110111111111222222222211111101110111100000011102220E55555553 1281111111011111101111111111111111222222222211111111011111101110111120222C55555453 1311111111111111111111110111110101022222222210111011111111111001101122222A34323541 1320100101111101111111101111111111022022222211111111101111110001110122220854344442

©2012 Eiken Foundation of Japan
90
Appendix F Winsteps™ Grade 2 Analysis
(For Reading, Listening, Writing, and Speaking Combined) G1: Command File &INST TITLE =***** TEST Person =person; persons are P ITEM =item; items are I DATA = G2RLWSd.txt; IAFILE = LAlinksG2.txt; SAFILE=* 76 2 -1.12 76 3 -.58 76 4 .08 76 5 1.61 77 2 -1.12 77 3 -.58 77 4 .08 77 5 1.61 78 2 -1.12 78 3 -.58 78 4 .08 78 5 1.61 79 2 -1.12 79 3 -.58 79 4 .08 79 5 1.61 80 2 -1.12 80 3 -.58 80 4 .08 80 5 1.61 81 2 -1.12 81 3 -.58 81 4 .08 81 5 1.61 82 2 -1.12 82 3 -.58 82 4 .08 82 5 1.61 * ITEM1 =4; NI =82; NAME1 =1; NAMELEN=3; ALPHANUM = 012345; XWIDE =1; ISGROUPS=* 1-75 A;0/1 76-81 B;1,2,3,4,5 82 C;1,2,3 * IREFER=* 1-75 A;0/1 76-81 B;1,2,3,4,5 82 C;1,2,3 * CODES =012345; IVALUEA=01****; IVALUEB=*12345; IVALUEC=*123**; IWEIGHT=* 1-75 1; 76-81 1; 82 1; * UPMEAN =0; USCALE =1; UDECIM =2; &END END LABELS
G2: Data File 0031100011011110111001001110111111111110111010110111101110111111101111111111113444242 0041111111101111110111111111111111111110111111111111111110110111111111111011004454553 0161111111011110110111001111111011111011111111111010111111110111101111111101114444533 0261111111101111110111101111111111111101111111111111111111111111111111111111114333553 0291111111111111111011111111111111111111111111111111111111111111111111111111113333351 0311111010101110110111101111111011111110111111010111111111111111111111111111114444322

©2012 Eiken Foundation of Japan
91
0331111111110110110110010110111111111110111010100011111111111111111111111111113333442 0341111111111111110111101111111011111101111010111111111111110111101111111001115534253 0351101111111111111111101101111111111101101111111111011110110101101101111100104454143 0431011011101110110111011110111111111111111111111110011111111111111111111111115544553 0441111111111110111111111110111011111111011111111111111111111111111111111111114455543 0461111011111111111111111111111011111111110011111111111111110110111111111111115554453 0511111111111011110111111100011111110011111111001110111110111111111111111111113233341 0521111111111111110001101110111100111111110111011011111100111111101111111111115555252 0571111111111110110111101110111101110111001110101111001000110111101100111111113345142 0611111111111110111111111111111111111111100110111111111110111111111111111111115253553 0621111011011111011111111110111111111111111010011111111110110111100111101100104243332 0661111111111111111111111111111010111111111111111111111101111111111111111111115255543 0681111101111111111101100000111011111111111111111111111111111111111111111111115545453 0771111111111111111111111111111111111111111111111111111111111111111111111111114453453 0801111111110110010101000110101101101101001011101111111110110100111101111111102243121 0811111011101110110011100000111011111111111111101110101111110110111111111111114333533 0821111000110111110001101110001101111110010111111111111110101111111111111111104454453 0831111111100111111111100010011111111111011110111111111010111111101111101111114454553 0851111011111111111111101111111001011111111011111011111110111110101111111111115554553 0861111111101110011100111110111011111011111110011111111111111111111111111111114254543 0921111111110111011001011110011111111101000110001111111110111111101101110111115255553 0941111011011100111111010010111110111101101011111111111010110111111111101110114233133 0951111011011111111010111110011111111110111111111111101110110111001111111101113343343 0971111111111111010111111011111111111111111111111111111111111111111111111111114444523 1010111111111111111111111110111111111001011111111111111111111111111011111011115454553 1040111001111110110101111011011111111101110110111111111111111111111111111111113454453 1091111111111110111001001110111111111100111111111111111111111111111111111111114245122 1121111111111111110111111111111111111111101011111101111110111111111111111101115254453 1151101011101110110111010101001010011111000011001111111010101111001111111101004343242 1241111011111110111111011111111111111111011111111111001111111111011111111101113244332 1291111111111110111011111110111111111111111111111110111101111111101111111111114234413 1301111111111110111111111110111110111111011111111111111111111111111111111101114355553 1331111111111111110011111111111111111111101110111111111111111111111111111111114254553
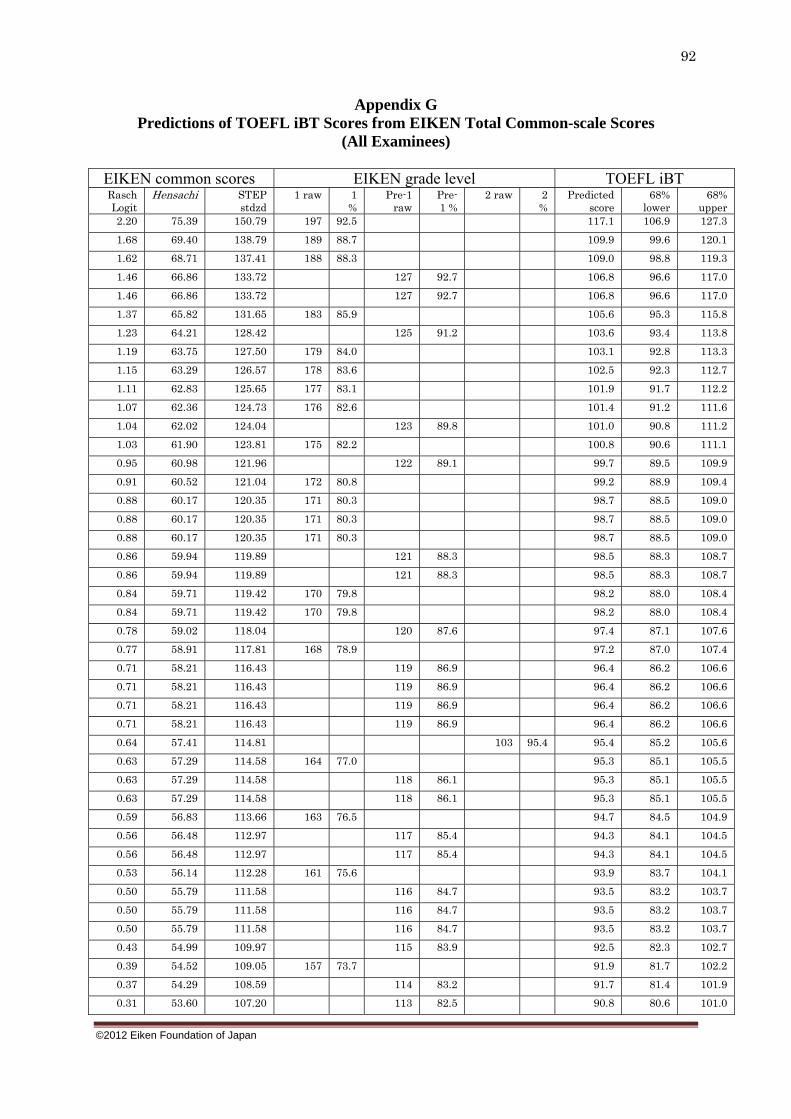
©2012 Eiken Foundation of Japan
92
Appendix G Predictions of TOEFL iBT Scores from EIKEN Total Common-scale Scores
(All Examinees)
EIKEN common scores EIKEN grade level TOEFL iBT Rasch Logit
Hensachi STEP stdzd
1 raw 1%
Pre-1 raw
Pre-1 %
2 raw 2%
Predicted score
68% lower
68% upper
2.20 75.39 150.79 197 92.5 117.1 106.9 127.3
1.68 69.40 138.79 189 88.7 109.9 99.6 120.1
1.62 68.71 137.41 188 88.3 109.0 98.8 119.3
1.46 66.86 133.72 127 92.7 106.8 96.6 117.0
1.46 66.86 133.72 127 92.7 106.8 96.6 117.0
1.37 65.82 131.65 183 85.9 105.6 95.3 115.8
1.23 64.21 128.42 125 91.2 103.6 93.4 113.8
1.19 63.75 127.50 179 84.0 103.1 92.8 113.3
1.15 63.29 126.57 178 83.6 102.5 92.3 112.7
1.11 62.83 125.65 177 83.1 101.9 91.7 112.2
1.07 62.36 124.73 176 82.6 101.4 91.2 111.6
1.04 62.02 124.04 123 89.8 101.0 90.8 111.2
1.03 61.90 123.81 175 82.2 100.8 90.6 111.1
0.95 60.98 121.96 122 89.1 99.7 89.5 109.9
0.91 60.52 121.04 172 80.8 99.2 88.9 109.4
0.88 60.17 120.35 171 80.3 98.7 88.5 109.0
0.88 60.17 120.35 171 80.3 98.7 88.5 109.0
0.88 60.17 120.35 171 80.3 98.7 88.5 109.0
0.86 59.94 119.89 121 88.3 98.5 88.3 108.7
0.86 59.94 119.89 121 88.3 98.5 88.3 108.7
0.84 59.71 119.42 170 79.8 98.2 88.0 108.4
0.84 59.71 119.42 170 79.8 98.2 88.0 108.4
0.78 59.02 118.04 120 87.6 97.4 87.1 107.6
0.77 58.91 117.81 168 78.9 97.2 87.0 107.4
0.71 58.21 116.43 119 86.9 96.4 86.2 106.6
0.71 58.21 116.43 119 86.9 96.4 86.2 106.6
0.71 58.21 116.43 119 86.9 96.4 86.2 106.6
0.71 58.21 116.43 119 86.9 96.4 86.2 106.6
0.64 57.41 114.81 103 95.4 95.4 85.2 105.6
0.63 57.29 114.58 164 77.0 95.3 85.1 105.5
0.63 57.29 114.58 118 86.1 95.3 85.1 105.5
0.63 57.29 114.58 118 86.1 95.3 85.1 105.5
0.59 56.83 113.66 163 76.5 94.7 84.5 104.9
0.56 56.48 112.97 117 85.4 94.3 84.1 104.5
0.56 56.48 112.97 117 85.4 94.3 84.1 104.5
0.53 56.14 112.28 161 75.6 93.9 83.7 104.1
0.50 55.79 111.58 116 84.7 93.5 83.2 103.7
0.50 55.79 111.58 116 84.7 93.5 83.2 103.7
0.50 55.79 111.58 116 84.7 93.5 83.2 103.7
0.43 54.99 109.97 115 83.9 92.5 82.3 102.7
0.39 54.52 109.05 157 73.7 91.9 81.7 102.2
0.37 54.29 108.59 114 83.2 91.7 81.4 101.9
0.31 53.60 107.20 113 82.5 90.8 80.6 101.0

©2012 Eiken Foundation of Japan
93
0.31 53.60 107.20 113 82.5 90.8 80.6 101.0
0.31 53.60 107.20 113 82.5 90.8 80.6 101.0
0.31 53.60 107.20 113 82.5 90.8 80.6 101.0
0.26 53.03 106.05 153 71.8 90.1 79.9 100.3
0.25 52.91 105.82 112 81.8 90.0 79.8 100.2
0.24 52.79 105.59 101 93.5 89.9 79.6 100.1
0.24 52.79 105.59 101 93.5 89.9 79.6 100.1
0.19 52.22 104.44 111 81.0 89.2 78.9 99.4
0.17 51.99 103.97 150 70.4 88.9 78.7 99.1
0.17 51.99 103.97 150 70.4 88.9 78.7 99.1
0.17 51.99 103.97 150 70.4 88.9 78.7 99.1
0.13 51.53 103.05 110 80.3 88.3 78.1 98.5
0.13 51.53 103.05 110 80.3 88.3 78.1 98.5
0.13 51.53 103.05 110 80.3 88.3 78.1 98.5
0.13 51.53 103.05 110 80.3 88.3 78.1 98.5
0.13 51.53 103.05 110 80.3 88.3 78.1 98.5
0.08 50.95 101.90 109 79.6 87.6 77.4 97.8
0.08 50.95 101.90 109 79.6 87.6 77.4 97.8
0.08 50.95 101.90 109 79.6 87.6 77.4 97.8
0.08 50.95 101.90 109 79.6 87.6 77.4 97.8
0.08 50.95 101.90 100 92.6 87.6 77.4 97.8
0.08 50.95 101.90 100 92.6 87.6 77.4 97.8
0.07 50.83 101.67 147 69.0 87.5 77.3 97.7
0.07 50.83 101.67 147 69.0 87.5 77.3 97.7
-0.03 49.68 99.36 107 78.1 86.1 75.9 96.3
-0.07 49.22 98.44 99 91.7 85.5 75.3 95.8
-0.07 49.22 98.44 99 91.7 85.5 75.3 95.8
-0.08 49.11 98.21 106 77.4 85.4 75.2 95.6
-0.08 49.11 98.21 106 77.4 85.4 75.2 95.6
-0.08 49.11 98.21 106 77.4 85.4 75.2 95.6
-0.13 48.53 97.06 105 76.6 84.7 74.5 94.9
-0.13 48.53 97.06 105 76.6 84.7 74.5 94.9
-0.18 47.95 95.90 139 65.3 84.0 73.8 94.2
-0.18 47.95 95.90 104 75.9 84.0 73.8 94.2
-0.20 47.72 95.44 98 90.7 83.7 73.5 94.0
-0.20 47.72 95.44 98 90.7 83.7 73.5 94.0
-0.20 47.72 95.44 98 90.7 83.7 73.5 94.0
-0.22 47.49 94.98 103 75.2 83.5 73.2 93.7
-0.32 46.34 92.68 101 73.7 82.1 71.9 92.3
-0.32 46.34 92.68 101 73.7 82.1 71.9 92.3
-0.33 46.22 92.45 97 89.8 81.9 71.7 92.1
-0.33 46.22 92.45 97 89.8 81.9 71.7 92.1
-0.33 46.22 92.45 97 89.8 81.9 71.7 92.1
-0.33 46.22 92.45 97 89.8 81.9 71.7 92.1
-0.33 46.22 92.45 97 89.8 81.9 71.7 92.1
-0.41 45.30 90.60 99 72.3 80.8 70.6 91.0
-0.43 45.07 90.14 131 61.5 80.5 70.3 90.8
-0.49 44.38 88.76 97 70.8 79.7 69.5 89.9
-0.49 44.38 88.76 97 70.8 79.7 69.5 89.9
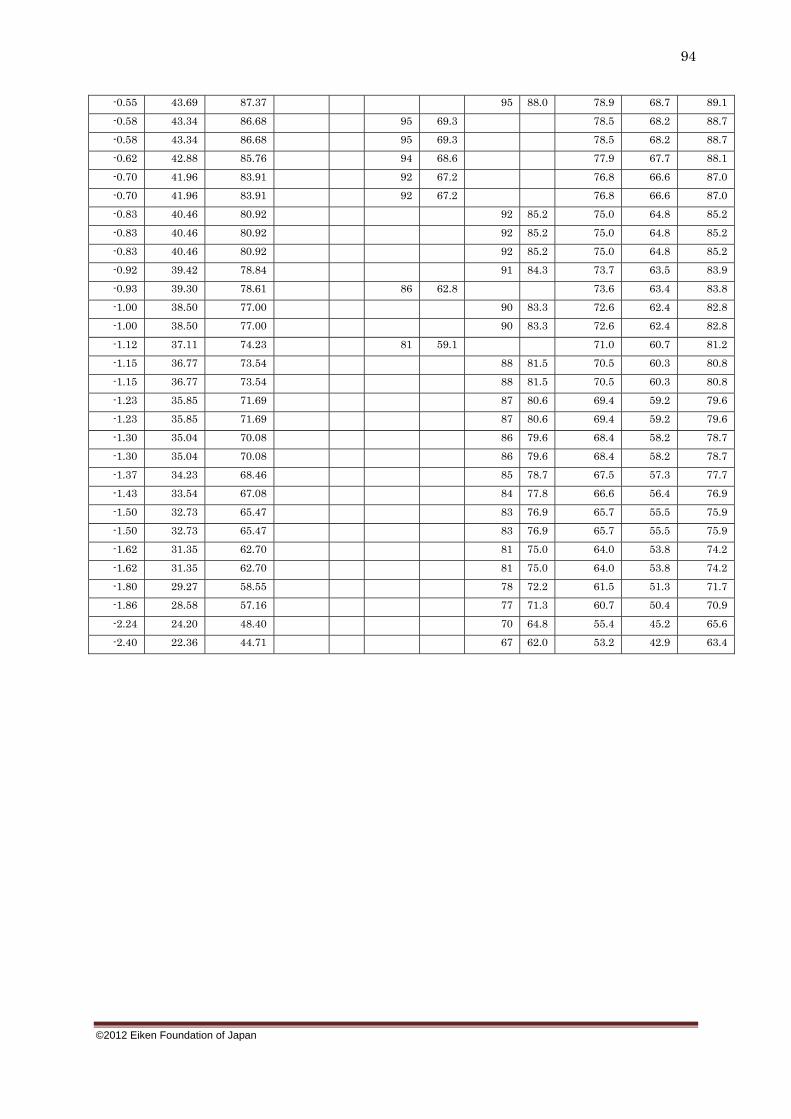
©2012 Eiken Foundation of Japan
94
-0.55 43.69 87.37 95 88.0 78.9 68.7 89.1
-0.58 43.34 86.68 95 69.3 78.5 68.2 88.7
-0.58 43.34 86.68 95 69.3 78.5 68.2 88.7
-0.62 42.88 85.76 94 68.6 77.9 67.7 88.1
-0.70 41.96 83.91 92 67.2 76.8 66.6 87.0
-0.70 41.96 83.91 92 67.2 76.8 66.6 87.0
-0.83 40.46 80.92 92 85.2 75.0 64.8 85.2
-0.83 40.46 80.92 92 85.2 75.0 64.8 85.2
-0.83 40.46 80.92 92 85.2 75.0 64.8 85.2
-0.92 39.42 78.84 91 84.3 73.7 63.5 83.9
-0.93 39.30 78.61 86 62.8 73.6 63.4 83.8
-1.00 38.50 77.00 90 83.3 72.6 62.4 82.8
-1.00 38.50 77.00 90 83.3 72.6 62.4 82.8
-1.12 37.11 74.23 81 59.1 71.0 60.7 81.2
-1.15 36.77 73.54 88 81.5 70.5 60.3 80.8
-1.15 36.77 73.54 88 81.5 70.5 60.3 80.8
-1.23 35.85 71.69 87 80.6 69.4 59.2 79.6
-1.23 35.85 71.69 87 80.6 69.4 59.2 79.6
-1.30 35.04 70.08 86 79.6 68.4 58.2 78.7
-1.30 35.04 70.08 86 79.6 68.4 58.2 78.7
-1.37 34.23 68.46 85 78.7 67.5 57.3 77.7
-1.43 33.54 67.08 84 77.8 66.6 56.4 76.9
-1.50 32.73 65.47 83 76.9 65.7 55.5 75.9
-1.50 32.73 65.47 83 76.9 65.7 55.5 75.9
-1.62 31.35 62.70 81 75.0 64.0 53.8 74.2
-1.62 31.35 62.70 81 75.0 64.0 53.8 74.2
-1.80 29.27 58.55 78 72.2 61.5 51.3 71.7
-1.86 28.58 57.16 77 71.3 60.7 50.4 70.9
-2.24 24.20 48.40 70 64.8 55.4 45.2 65.6
-2.40 22.36 44.71 67 62.0 53.2 42.9 63.4

©2012 Eiken Foundation of Japan
95
Appendix H Predictions of TOEFL iBT Scores from EIKEN Written (RLW) Common-scale Scores
(All Examinees)
EIKEN common scores EIKEN grade level TOEFL iBT Rasch
logit Hensachi STEP
stdzd 1 raw 1
%Pre-1
rawPre-1 %
2 raw 2 %
Predicted score
68% lower
68% upper
2.86 79.25 158.49 75 100.0 118.76 107.44 130.09
2.08 71.22 142.44 100 88.5 109.90 98.58 121.23
1.88 69.16 138.32 98 86.7 107.63 96.31 118.96
1.79 68.24 136.47 97 85.8 106.61 95.28 117.94
1.79 68.24 136.47 97 85.8 106.61 95.28 117.94
1.64 66.69 133.39 74 98.7 104.91 93.58 116.23
1.54 65.66 131.33 94 83.2 103.77 92.45 115.10
1.39 64.12 128.24 92 81.4 102.07 90.74 113.40
1.25 62.68 125.36 90 79.6 100.48 89.15 111.81
1.25 62.68 125.36 90 79.6 100.48 89.15 111.81
1.19 62.06 124.13 89 78.8 99.80 88.47 111.12
1.19 62.06 124.13 89 78.8 99.80 88.47 111.12
1.19 62.06 124.13 90 90.9 99.80 88.47 111.12
1.19 62.06 124.13 90 90.9 99.80 88.47 111.12
1.19 62.06 124.13 90 90.9 99.80 88.47 111.12
1.19 62.06 124.13 90 90.9 99.80 88.47 111.12
1.12 61.34 122.69 88 77.9 99.00 87.68 110.33
1.05 60.62 121.25 89 89.9 98.21 86.88 109.53
1.00 60.11 120.22 86 76.1 97.64 86.31 108.97
0.93 59.39 118.78 88 88.9 96.85 85.52 108.17
0.81 58.15 116.31 87 87.9 95.48 84.16 106.81
0.81 58.15 116.31 87 87.9 95.48 84.16 106.81
0.71 57.12 114.25 81 71.7 94.35 83.02 105.67
0.71 57.12 114.25 81 71.7 94.35 83.02 105.67
0.71 57.12 114.25 81 71.7 94.35 83.02 105.67
0.71 57.12 114.25 81 71.7 94.35 83.02 105.67
0.71 57.12 114.25 86 86.9 94.35 83.02 105.67
0.71 57.12 114.25 86 86.9 94.35 83.02 105.67
0.61 56.10 112.19 85 85.9 93.21 81.88 104.54
0.61 56.10 112.19 85 85.9 93.21 81.88 104.54
0.61 56.10 112.19 85 85.9 93.21 81.88 104.54
0.61 56.10 112.19 85 85.9 93.21 81.88 104.54
0.51 55.07 110.13 84 84.8 92.08 80.75 103.40
0.51 55.07 110.13 84 84.8 92.08 80.75 103.40
0.51 55.07 110.13 84 84.8 92.08 80.75 103.40
0.51 55.07 110.13 84 84.8 92.08 80.75 103.40
0.51 55.07 110.13 84 84.8 92.08 80.75 103.40
0.49 54.86 109.72 77 68.1 91.85 80.52 103.18
0.47 54.66 109.31 72 96.0 91.62 80.29 102.95
0.47 54.66 109.31 72 96.0 91.62 80.29 102.95
0.44 54.35 108.69 76 67.3 91.28 79.95 102.61
0.44 54.35 108.69 76 67.3 91.28 79.95 102.61
0.44 54.35 108.69 76 67.3 91.28 79.95 102.61

©2012 Eiken Foundation of Japan
96
0.42 54.14 108.28 83 83.8 91.05 79.73 102.38
0.42 54.14 108.28 83 83.8 91.05 79.73 102.38
0.42 54.14 108.28 83 83.8 91.05 79.73 102.38
0.38 53.73 107.46 75 66.4 90.60 79.27 101.93
0.38 53.73 107.46 75 66.4 90.60 79.27 101.93
0.38 53.73 107.46 75 66.4 90.60 79.27 101.93
0.34 53.32 106.64 82 82.8 90.15 78.82 101.47
0.34 53.32 106.64 82 82.8 90.15 78.82 101.47
0.34 53.32 106.64 82 82.8 90.15 78.82 101.47
0.33 53.21 106.43 74 65.5 90.03 78.70 101.36
0.33 53.21 106.43 74 65.5 90.03 78.70 101.36
0.25 52.39 104.78 81 81.8 89.12 77.80 100.45
0.25 52.39 104.78 81 81.8 89.12 77.80 100.45
0.18 51.67 103.34 71 62.8 88.33 77.00 99.66
0.17 51.57 103.14 80 80.8 88.21 76.89 99.54
0.17 51.57 103.14 80 80.8 88.21 76.89 99.54
0.14 51.26 102.52 71 94.7 87.87 76.55 99.20
0.14 51.26 102.52 71 94.7 87.87 76.55 99.20
0.14 51.26 102.52 71 94.7 87.87 76.55 99.20
0.13 51.16 102.31 70 61.9 87.76 76.43 99.09
0.10 50.85 101.70 79 79.8 87.42 76.09 98.75
0.10 50.85 101.70 79 79.8 87.42 76.09 98.75
0.03 50.13 100.26 78 78.8 86.62 75.30 97.95
0.03 50.13 100.26 78 78.8 86.62 75.30 97.95
0.03 50.13 100.26 78 78.8 86.62 75.30 97.95
-0.05 49.31 98.61 77 77.8 85.72 74.39 97.04
-0.05 49.31 98.61 77 77.8 85.72 74.39 97.04
-0.05 49.31 98.61 77 77.8 85.72 74.39 97.04
-0.11 48.69 97.38 76 76.8 85.03 73.71 96.36
-0.11 48.69 97.38 76 76.8 85.03 73.71 96.36
-0.11 48.69 97.38 76 76.8 85.03 73.71 96.36
-0.12 48.58 97.17 70 93.3 84.92 73.59 96.25
-0.12 48.58 97.17 70 93.3 84.92 73.59 96.25
-0.18 47.97 95.94 75 75.8 84.24 72.91 95.57
-0.25 47.25 94.49 74 74.7 83.45 72.12 94.77
-0.25 47.25 94.49 74 74.7 83.45 72.12 94.77
-0.33 46.42 92.85 69 92.0 82.54 71.21 93.86
-0.33 46.42 92.85 69 92.0 82.54 71.21 93.86
-0.33 46.42 92.85 69 92.0 82.54 71.21 93.86
-0.37 46.01 92.03 72 72.7 82.08 70.76 93.41
-0.37 46.01 92.03 72 72.7 82.08 70.76 93.41
-0.43 45.40 90.79 59 52.2 81.40 70.07 92.73
-0.52 44.47 88.94 68 90.7 80.38 69.05 91.71
-0.55 44.16 88.32 69 69.7 80.04 68.71 91.37
-0.61 43.54 87.09 68 68.7 79.36 68.03 90.68
-0.61 43.54 87.09 68 68.7 79.36 68.03 90.68
-0.61 43.54 87.09 68 68.7 79.36 68.03 90.68
-0.61 43.54 87.09 68 68.7 79.36 68.03 90.68
-0.69 42.72 85.44 67 89.3 78.45 67.12 89.78

©2012 Eiken Foundation of Japan
97
-0.69 42.72 85.44 67 89.3 78.45 67.12 89.78
-0.69 42.72 85.44 67 89.3 78.45 67.12 89.78
-0.69 42.72 85.44 67 89.3 78.45 67.12 89.78
-0.72 42.41 84.82 66 66.7 78.11 66.78 89.43
-0.83 41.28 82.56 64 64.6 76.86 65.53 88.19
-0.84 41.18 82.35 66 88.0 76.74 65.42 88.07
-0.88 40.77 81.53 63 63.6 76.29 64.96 87.62
-0.88 40.77 81.53 63 63.6 76.29 64.96 87.62
-0.93 40.25 80.50 62 62.6 75.72 64.40 87.05
-0.93 40.25 80.50 62 62.6 75.72 64.40 87.05
-0.98 39.74 79.47 65 86.7 75.16 63.83 86.48
-0.98 39.74 79.47 65 86.7 75.16 63.83 86.48
-0.98 39.74 79.47 65 86.7 75.16 63.83 86.48
-0.98 39.74 79.47 65 86.7 75.16 63.83 86.48
-1.11 38.40 76.80 64 85.3 73.68 62.35 85.01
-1.23 37.16 74.33 63 84.0 72.32 60.99 83.64
-1.35 35.93 71.86 62 82.7 70.95 59.63 82.28
-1.35 35.93 71.86 62 82.7 70.95 59.63 82.28
-1.35 35.93 71.86 62 82.7 70.95 59.63 82.28
-1.35 35.93 71.86 62 82.7 70.95 59.63 82.28
-1.45 34.90 69.80 61 81.3 69.82 58.49 81.14
-1.56 33.77 67.54 60 80.0 68.57 57.24 79.90
-1.66 32.74 65.48 59 78.7 67.43 56.11 78.76
-1.75 31.81 63.63 58 77.3 66.41 55.08 77.74
-1.75 31.81 63.63 58 77.3 66.41 55.08 77.74
-1.84 30.89 61.78 57 76.0 65.39 54.06 76.72
-1.84 30.89 61.78 57 76.0 65.39 54.06 76.72
-1.93 29.96 59.92 56 74.7 64.37 53.04 75.69
-2.27 26.46 52.93 52 69.3 60.51 49.18 71.83
-2.58 23.27 46.55 48 64.0 56.99 45.66 68.31