Embed Size (px)
Citation preview


LINKING THE BALANCED SCORECARD
TO HUMAN RESOURCE MANAGEMENT
By
Chun-Che Chen
A dissertation submitted to the faculty of Business and Law in
fulfillment of the requirement for the degree of
DOCTOR OF PHILOSOPHY
VICTORIA UNIVERSITY LIBRARY
VICTORIA UNIVERSITY
FACULTY OF BUSINESS AND LAW
SCHOOL OF ACCOUNTING AND FINANCE
MELBOURNE, AUSTRALIA
OCTOBER 2003

: } .U9UJ8BBUBLU
e o j n o s e j UBuinii o^. p jBoaJoos psouBLBq 8 M ; 6uL>|un
9L|0-UnL|0 'U9M0 Z.029e9800l.000e
3H0 £'899 SISaHi 110
Acknowledgement
1 do appreciate those who helped me to accomplish this dissertation. First, I greatly
appreciate Professor R. Cleft and Dr A. Brooks, both of whom are my research
supervisors, from the depth of my heart for their cordiality and efforts to review the
first drafts of my dissertation, correct the errors and encourage me. In the course of
composing this dissertation, I felt crestfallen and fatigued several times and even
wanted to give up, but my research supervisors kept on encouraging me, thus boosting
my courage and confidence by stepping forward continuously. What is worthy of
mention is that Professor R. Clift and Dr A. Brooks not only continued to direct me
but also illuminate me with revelations of life when I encountered the greatest setback
in my life, i.e., transferring from The University of Melbourne to Victoria University,
all of which I would cherish in my mind.
Second, I also want to express my appreciation to those superiors and friends in my
working unit. In addition, I greatly appreciate Professor Kuo-Feng Liao of National
Defense University and Mr An-Yu Cheng of Combined Services Forces Headquarters,
Ministry of National Defense of R.O.C., who offered their assistance as they could;
that would be imprinted on my mind forever. Besides, I thank my teachers at The
University of Melbourne for their instraction and direction who enlightened me on the
theories of accounting. Of course, I do appreciate the shuttlecock correspondence
through e-mail by Professor Annie Wu of National Cheng Chi University.
Finally, I do appreciate my family members' support, my wife, Chung-Ying Chang, in
particular. This dissertation would not have been accomplished in such a short period
without their support and encouragement.

Any contributions this dissertation makes to the academic and business literature
should be attributed to those mentioned above. Should there be any defects in the
dissertation, the author shall be one who takes responsibility.
Ill
Abstract This study examines whether the relationship between strategic human capital
management practices (HCMPs) and employee capability is moderated by personnel
control mechanisms, and whether the relationship between employee capability and
corporate performance is affected by an intervening variable, customer loyalty, and
whether efficient development and effective deployment of strategic HCMPs act as
leading indicators of corporate performance. The possible moderating and intervening
relationships among four constmcts — strategic HCMPs, persormel control mechanisms,
employee capability and customer loyalty — are considered. Propositions concerning
the moderating and intervening relationships among these constmcts are made, and a
LISREL model of their relationships to business performance is specified.
The model is tested with data from a sample of 265 stores pertaining to five large,
intemational companies: two high-tech manufacturing companies taking JIT inventory
control and TQM into consideration; one traditional multi-plant manufacturing
company making highly homogeneous products; one life insurance company fulfilling
customer needs and striving for continuous improvements; and one fast food self-
service company making quality a major responsibility of employees.
The research implications for academics, and the ramifications for practitioners are
discussed. The results highlight the role that personnel control mechanisms play in
moderating the relationship between strategic HCMPs and employee capability. This
study also indicates that the development and protection of strategic HCMPs moderated
by personnel control mechanisms correlate positively with employee motivation toward
customers, and the deployment of strategic HCMPs moderated by personnel control
mechanisms brings a significant positive effect to employee productivity.

IV
Contents
Page
Acknowledgement i Abstract iii Chapter 1 Introduction 1
1.1 Background to the research 1 1.2 The research question 3 1.3 Definition 5 1.4 Justification for the research 6
1.4.1 The primary theory underlying the research 6 1.4.2 Contribution to knowledge 7 1.4.3 Contribution to practical benefits 9
1.5 Methodology 10 1.6 Outline of the thesis 15
Chapter 2 The development of theoretical framework and testable hypothesis 17
2.1 Introduction 17 2.2 The development of a theoretical framework 18
2.2.1 The claims for the balanced seorecard model 21 2.2.2 Limitations of the prior empirical work 28 2.2.3 Barriers to the implementation of corporate strategy 30
2.2.3.1 The function of management control 34 2.2.3.2 The function of strategy communication 39
2.2.4 The theoretical framework of human capital management practices 43 2.2.4.1 The contingency view of human capital management
practices 45 2.2.4.2 Limitations of the prior empirical work 46
2.3 The development of testable hypotheses 49 2.3.1 Strategic human capital management practices, persormel control
mechanisms and employee capability 49 2.3.1.1 Strategic human capital management practices 50 2.3.1.2 Strategic human capital management practices and
personnel control mechanisms 53 2.3.1.3 Difficulties of empirical analysis 62 2.3.1.4 The first testable hypothesis 65
2.3.2 Strategic human capital management practices, employee capability and customer loyalty 70 2.3.2.1 Limitations of the prior empirical work 73 2.3.2.2 The second testable hypothesis 75
2.3.3 Strategic human capital management practices, customer loyalty and financial performance 77 2.3.3.1 Limitations of the prior empirical work 80 2.3.3.2 The third testable hypothesis 82
2.3.4 Strategic human capital management practices and financial performance 84

2.3.4.1 Limitations of the prior empirical work 87 2.3.4.2 The fourth testable hypothesis 88
Chapter 3 Research design 92 3.1 Introduction 92 3.2 Framework of the research and justification for survey-based research method—93
3.2.1 The conceptual framework of the research 93 3.2.2 Justification for survey-based research method 95
3.3 Definition of variables and measuring methods 96 3.3.1 Strategic human capital management practices 96
3.3.1.1 Operational definition 96 3.3.1.2 Measuring methods 98
3.3.2 Personnel control mechanisms 101 3.3.2.1 Operational definition 101 3.3.2.2 Measuring methods 105
3.3.3 Employee capability 107 3.3.3.1 Operational definition 107 3.3.3.2 Measuring methods 108
3.3.4 Customer loyalty 110 3.3.4.1 Operational definition 110 3.3.4.2 Measuring methods 112
3.3.5 Company financial performance 113 3.3.5.1 Operational definition 113 3.3.5.2 Measuring methods 114
3.3.6 Control variables 116 3.4 Measuring tools 120
3.4.1 Pilot test 120 3.4.2 Data collection 121
3.5 Data analysis methods 128 3.6 Factor analysis 131 3.7 Reliability analysis 143 3.8 Validity analysis 153 3.9 Research limitations 162
Chapter 4 The analysis for the moderating and intervening effects and research results 165
4.1 Introduction 165 4.2 Stmctural analysis of sample data 167 4.3 The correlation analysis between each dimension of four constructs 174 4.4 The causal relationship between strategic human capital management
practices and employee capability 181 4.5 The analysis for the moderating effect of persormel control mechanisms 198
4.5.1 Additional interpretative analyses for the moderating effect of personnel control mechanisms 213
4.6 The regression analysis for exploring the intervening effect 224 4.6.1 The causal relationship between employee capability and customer
loyalty 224 4.6.2 The causal relationship between customer loyalty and financial
performance of an organization 226
VI
4.6.3 The causal relationship between employee capability and financial performance of an organization 229
4.6.4 The causal relationship between strategic human capital management practices and customer loyalty 232
4.6.5 The causal relationship between strategic human capital management practices and financial performance of an organization 234
4.7 The nested-model analysis for exploring the intervening effect 238 4.8 The assessment and correction of the theoretical model 242
Chapter 5 Conclusions and Implications 256 5.1 Introduction 256 5.2 Implications for theory development 262 5.3 Implications for practising managers 265 5.4 Limitations 269 5.5 Further research 271
Appendices 277 Appendix 1 hivitation letter, the item stmcture of the questiormaire
(English version) and variable factors for each dimension of four multi-dimensional constmcts after deleting items with poor inconsistency 277
Appendix 2 The item stmcture of the questiormaire (Chinese version) 329
Appendix 3 Interview questions 350 Appendix 4 The external and internal quality of data in the LISREL model 352 Appendix 5 The definition of each dimension of all multi-dimensional
constmcts 393 Appendix 6 Null model, the direct model, the completely mediated model
and the partially mediated model 394
References 398
Vll
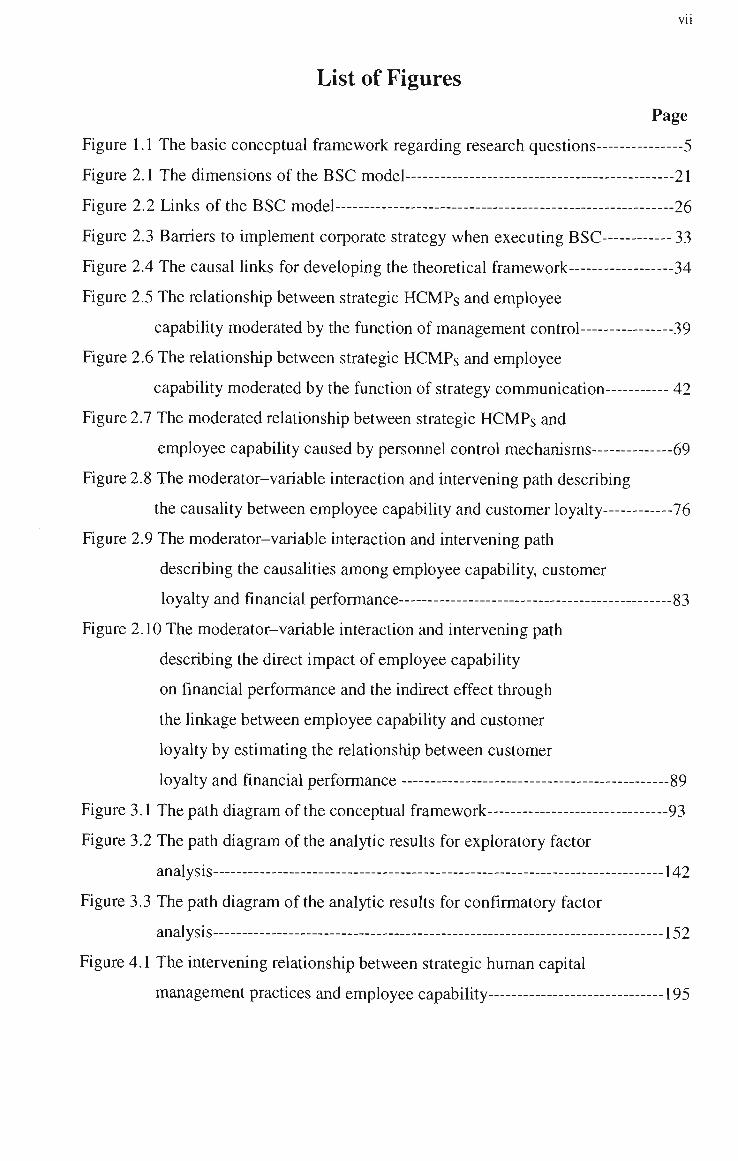
List of Figures
Page
Figure 1.1 The basic conceptual framework regarding research questions 5
Figure 2.1 The dimensions of the BSC model 21
Figure 2.2 Links of the BSC model 26
Figure 2.3 Barriers to implement corporate strategy when executing BSC 33
Figure 2.4 The causal Hnks for developing the theoretical framework 34
Figure 2.5 The relationship between strategic HCMPs and employee
capability moderated by the function of management control 39
Figure 2.6 The relationship between strategic HCMPs and employee
capability moderated by the function of strategy communication 42
Figure 2.7 The moderated relationship between strategic HCMPs and
employee capability caused by personnel control mechanisms 69
Figure 2.8 The moderator-variable interaction and intervening path describing
the causality between employee capability and customer loyalty 76
Figure 2.9 The moderator-variable interaction and intervening path
describing the causalities among employee capability, customer
loyalty and financial performance 83
Figure 2.10 The moderator-variable interaction and intervening path
describing the direct impact of employee capability
on financial performance and the indirect effect through
the linkage between employee capability and customer
loyalty by estimating the relationship between customer
loyalty and financial performance 89
Figure 3.1 The path diagram of the conceptual framework 93
Figure 3.2 The path diagram of the analytic results for exploratory factor
analysis 142
Figure 3.3 The path diagram of the analytic results for confirmatory factor
analysis 152
Figure 4.1 The intervening relationship between strategic human capital
management practices and employee capability 195

VIU
Figure 4.2 The moderating effect of personnel control mechanisms on the
relationship between strategic human capital management
practices and employee capability 213
Figure 4.3 The moderated relationship between identifying human
capital management practices and employee productivity
caused by the control factor of persormel control mechanisms 214
Figure 4.4 The moderated relationship between developing human
capital management practices and the change in envirormient
caused by the control factor of personnel control mechanisms -214
Figure 4.5 The moderated relationship between developing human
capital management practices and employee skill and
organizational stmcture caused by the control factor of
personnel control mechanisms 215
Figure 4.6 The moderated relationship between developing human
capital management practices and employee motivation caused
by the control factor of persormel control mechanisms 216
Figure 4.7 The moderated relationship between developing human
capital management practices and employee productivity caused
by the control factor of personnel control mechanisms 217
Figure 4.8 The moderated relationship between protecting human
capital management practices and employee skill and
organizational stmcture caused by the control factor of persormel
control mechanisms 217
Figure 4.9 The moderated relationship between protecting human
capital management practices and employee motivation caused
by the control factor of personnel control mechanisms 218
Figure 4.10 The moderated relationship between protecting human
capital management practices and employee productivity caused
by the control factor of personnel control mechanisms 219
Figure 4.11 The moderated relationship between deploying human
capital management practices and the change in envirorunent
caused by the control factor of persormel control mechanisms 219

IX
Figure 4.12 The moderated relationship between deploying human
capital management practices and employee skill and
organizational stmcture caused by the control factor of
personnel control mechanisms 220
Figure 4.13 The moderated relationship between deploying human
capital management practices and employee motivation caused
by the control factor of personnel control mechanisms 221
Figure 4.14 The moderated relationship between deploying human
capital management practices and employee productivity
caused by the control factor of persormel control mechanisms 221
Figure 4.15 The moderated relationship between developing human
capital management practices and employee skill and
organizational stmcture caused by the communication-
coordination factor of persormel control mechanisms 222
Figure 4.16 The moderated relationship between protecting human
capital management practices and employee motivation caused
by the communication-coordination factor of personnel
control mechanisms 223
Figure 4.17 The direct intervening effect of employee capability on
financial performance and indirect intervening effect of
strategic human capital management practices on
financial performance 241
Figure 4.18 The path diagram of Model A 247
Figure 4.19 The path diagram of Model G 248
Figure 4.20 The direct and indirect intervening effects 251
Figure 5.1 Significant moderator and intervening variable in the moderating
and intervening effects 261
Figure A4.1 Causation path diagram of LISREL model 392
X
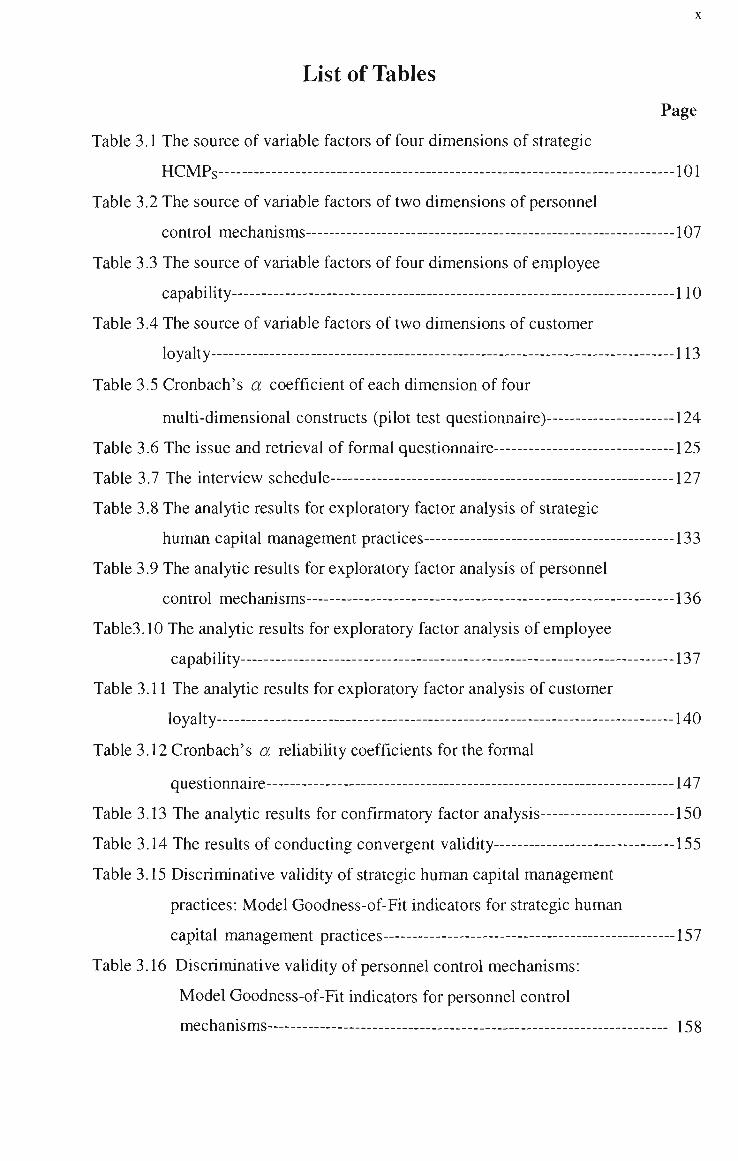
List of Tables Page
Table 3.1 The source of variable factors of four dimensions of strategic
HCMPs 101
Table 3.2 The source of variable factors of two dimensions of personnel
control mechanisms 107
Table 3.3 The source of variable factors of four dimensions of employee
capability 110
Table 3.4 The source of variable factors of two dimensions of customer
loyalty 113
Table 3.5 Cronbach's a coefficient of each dimension of four
multi-dimensional constmcts (pilot test questionnaire) 124
Table 3.6 The issue and retrieval of formal questionnaire 125
Table 3.7 The interview schedule 127
Table 3.8 The analytic results for exploratory factor analysis of strategic
human capital management practices 133
Table 3.9 The analytic results for exploratory factor analysis of personnel
control mechanisms 136
Table3.10 The analytic results for exploratory factor analysis of employee
capability 137
Table 3.11 The analytic results for exploratory factor analysis of customer
loyalty 140
Table 3.12 Cronbach's a reliability coefficients for the formal
questionnaire 147
Table 3.13 The analytic results for confirmatory factor analysis 150
Table 3.14 The results of conducting convergent validity 155
Table 3.15 Discriminative validity of strategic human capital management
practices: Model Goodness-of-Fit indicators for strategic human
capital management practices 157
Table 3.16 Discriminative validity of personnel control mechanisms:
Model Goodness-of-Fit indicators for personnel control
mechanisms 158
XI
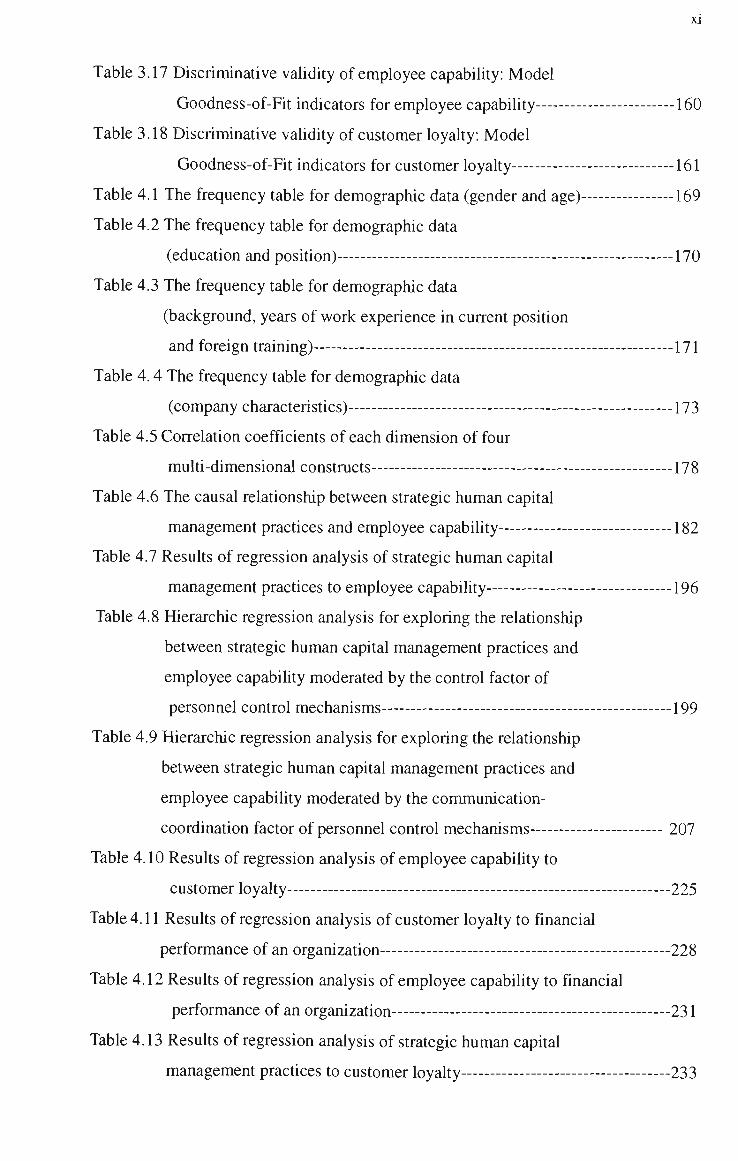
Table 3.17 Discriminative vaUdity of employee capability: Model
Goodness-of-Fit indicators for employee capability 160
Table 3.18 Discriminative validity of customer loyalty: Model
Goodness-of-Fit indicators for customer loyalty 161
Table 4.1 The frequency table for demographic data (gender and age) 169
Table 4.2 The frequency table for demographic data
(education and position) 170
Table 4.3 The frequency table for demographic data
(background, years of work experience in current position
and foreign training) 171
Table 4.4 The frequency table for demographic data
(company characteristics) 173
Table 4.5 Correlation coefficients of each dimension of four
multi-dimensional constmcts 178
Table 4.6 The causal relationship between strategic human capital
management practices and employee capability 182
Table 4.7 Results of regression analysis of strategic human capital
management practices to employee capability 196
Table 4.8 Hierarchic regression analysis for exploring the relationship
between strategic human capital management practices and
employee capability moderated by the control factor of
personnel control mechanisms 199
Table 4.9 Hierarchic regression analysis for exploring the relationship
between strategic human capital management practices and
employee capability moderated by the communication-
coordination factor of personnel control mechanisms 207
Table 4.10 Results of regression analysis of employee capability to
customer loyalty 225
Table 4.11 Results of regression analysis of customer loyalty to financial
performance of an organization 228
Table 4.12 Results of regression analysis of employee capability to financial
performance of an organization 231
Table 4.13 Results of regression analysis of strategic human capital
management practices to customer loyalty 233

Xll
Table 4.14 Results of regression analysis of strategic human capital
management practices to financial performance of
an organization 236
Table 4.15 Comparative analysis of the nested-model for the intervening
effects 240
Table 4.16 Comparative analysis of the nested-model for theoretical
models 244
Table 4.17 Results of synthetic analysis for strategic human capital
management practices, employee capability, customer loyalty
and company's financial performance 252
Table A4.1 The numerical range and ideal numerical value of the nine
indices of the overall model fit 385

Xl l l
List of abbreviations
Abbreviation
HCMPs
IDEN
DEVE
PROT
DEPL
CONT
COMM
TCIE
ESAOS
EM
EP
CC
Meaning
Human capital management practices
Identifying strategic human capital management practices
Developing strategic human capital management practices
Protecting strategic human capital management practices
Deploying strategic human capital management practices
The first dimension of personnel control mechanisms, human resource
management control
The second dimension of personnel control mechanisms, strategy
communication
The changes in environment facing the organization
Employee skill and organizational stmcture
Employee motivation
Employee productivity
Customer complaint

XIV
Abbreviation
CS
SRG
NIBT
GRROC
The BSC
JIT inventory control
TQM
LISREL
ABC
EFA
SEM
CFA
Meaning
Customer satisfaction
Sales revenue growth
Net income before tax
Gross rate of return on capital
The balanced seorecard
Just-in-Time inventory control
Total quality management
Linear stmctural relation
Activity-based costing
Exploratory factor analysis
Stmctural equation modeling
Confirmatory factor analysis
XV
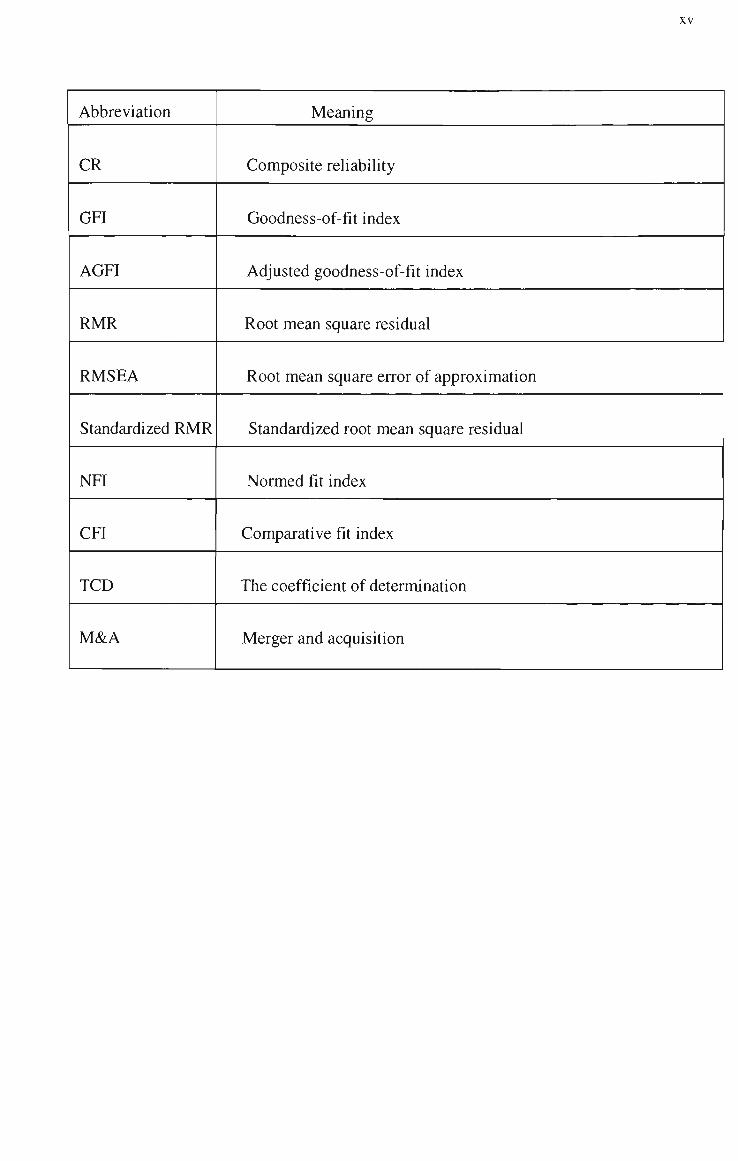
Abbreviation
CR
GFI
AGFI
RMR
RMSEA
Standardized RMR
NFI
CFI
TCD
M&A
Meaning
Composite reliability
Goodness-of-fit index
Adjusted goodness-of-fit index
Root mean square residual
Root mean square error of approximation
Standardized root mean square residual
Normed fit index
Comparative fit index
The coefficient of determination
Merger and acquisition

XVI
Declaration
This thesis contains no material which has been submitted for examination in any
other course or accepted for the award of any other degree or diploma in any
university. The material presented in this thesis is the author's research work under
the supervision of Professor R. Clift and Dr. A. Brooks.
Chun-Che Chen
School of Accounting and Finance
Faculty of Business and Law
Victoria University, Melbourne
1 October, 2003

Chapter 1 Introduction
1.1 Background to the research
Improvements in an organization should be motivated by the organization's ability to
apply human capital management practices (HCMPs) strategically and effectively to
create competitive advantage. One of the sources of competitive advantage of a firm
stems from exploiting the capability of talented employees to produce precious ideas
for improving the firm's internal processes and generating significant value to
customers when HCMPs are aligned with the firm's competitive strategy. Tichy et al.
(1982), and Johnson (1992), among others, have highlighted the fact that
organizations will best serve customers by strategically developing HCMPs •
Kaplan and Norton (1992) base their balanced seorecard (BSC) model on activities
that develop human capital, known as HCMPs, organizational learning and growth
capabiHty. Employee capability motivates internal process improvement in an
organization that, in turn, drives customer loyalty . Also, Grahn (1995) states that
"the most important driver of internal process improvement of an organization is
skilled and motivated employees" (p67). However, there has been no empirical
investigation performing direct testing for the association between employee
capability and customer loyalty in the management control literature (e.g., Widener,
2000). Moreover, earlier research on the BSC has produced partly contradictory
evidence about the role of intervention variables in explaining the relationship
between employee capability and financial performance of an organization (e.g..
Stivers et al., 1998; Ittner and Larcker, 1998a). In the present study, how employee
capability affects customer loyalty is examined. It is also proposed to concentrate on
customer loyalty as a singular intervention factor of the relationships between

employee capability and financial outcomes of an organization.
Skilled and motivated employees, in practice, are expected to improve resource
allocation of an organization and increase future profitability, and then enhance
shareholder value. However, prior research studying the role of non-financial
measures as an indicator of financial performance has mostly disregarded interactions
with other potential value drivers such as employee capability (Ittner and Larcker,
1996, 1998a) or organizational citizenship (Pillai et al., 1999). Moreover, earlier
studies on human resource management have produced little evidence about the role
of situational moderator variables in explaining the relationship between strategic
HCMPs and employee capabihty (e.g., Tichy et al., 1982; Snell and Dean, 1992). hi
the present study, the effect of employee capability on financial performance of an
organization is investigated. Also, it is intended to focus on personnel control
mechanisms as a moderator of the relationship between strategic HCMPs and
employee capability.
Non-financial measures have recently been used as an integral part of the
management control systems by many firms (Banker et al., 2000). The major
motivation stems from the argument that non-financial measures are a better indicator
of long-term firm value than financial performance. Also, empirical evidence
indicates that firms relying heavily on HCMPs are likely to consider non-financial
measures such as employee satisfaction and customer loyalty to be leading key
indicators which provide them with information related to their strategic objectives
(Tichy et al., 1982; Balkcom et al., 1997). Banker et al. (2000) further highUght
that firms adopting traditional accounting-based measures give insufficient
consideration to intangible assets and human capital. Hence, many firms seek to

create a set of tools measuring firm value by incorporating non-financial indicators
into their measurement systems. However, a review of prior studies on management
control systems reveals that there is a lack of empirical work on systematic and
contextual links between employee capability, customer loyalty and financial
performance measures (e.g., Ittner and Larker, 1998a; Banker et al., 2000; Widener,
2000).
According to the findings of Jones and Sasser (1995), customer loyalty is an
important non-financial measure that is increasingly monitored by many firms
recently. However, prior empirical work examining the association between
customer satisfaction and future financial performance has produced mixed results^
(e.g., Anderson et al , 1997; Ittner and Larker, 1998a; Banker et al., 2000). hi
addition, little research has been conducted on the implementation and performance
consequences of constructs of the BSC, despite widespread practitioner interest in the
subject (e.g.. Amir and Lev, 1996). In the present study, the relationship between
customer loyalty and financial performance is examined in order to evaluate the
impact of employee capability on financial performance through its links with
customer loyalty.
1.2 The research question
As stated above, the present study is motivated by a belief that existing
performance-measurement systems, primarily depending on financial accounting
information, are out of date. In the present study it is contended that reliance on
summary financial performance measures are holding back organizations' abihties to
generate future economic value. In addition, although the role of HCMPs in
capturing sustainable competitive advantage for an organization is of the essence,
applying strategic HCMPs engenders management challenges that must be overcome
to achieve an advantage. It is believed that strategic HCMPs influence employee
capability through the identification and development of HCMPs, and that the
protection and deployment of HCMPs help firms to capture the benefits of
information asymmetries for clients through trast and satisfaction with prior services.
The appUcation of strategic HCMPs putting the emphasis on persormel control
mechanisms leads to improvements in both customer loyalty and financial
performance of an organization. In the present study it is expected that employee
capability and customer loyalty (non-financial measures) are leading indicators of
Tobin's q, sales revenue growth, net income before tax and gross rate of return on
capital (financial performance).
The basic objective of the present study, therefore, is to investigate the association
between employee capability and corporate performance through the direct impact of
employee capability on corporate performance, and its indirect effect through the
Unkage between employee capability and customer loyalty. In other words, the
following three research questions are further investigated.
• Is the relationship between strategic HCMPs and employee capability moderated by
personnel control mechanisms?
• Is the relationship between employee capability and corporate performance affected
by an intervening variable, customer loyalty?
• Do efficient development and effective deployment of HCMPs act as leading
indicators of corporate performance?
In the present study, evidence on the sensitivity of these causation linkages to
contextual variables is provided. The basic conceptual framework regarding
research questions is illustrated as follows.

Figure 1.1 The basic conceptual framework regarding research questions
Persormel control mechanisms
Strategic human
capital management
practices
'' t Employee
capability
Customer
loyalty
Financial
performance i i
1.3 Definition
Based on Tichy et al. (1982), Barney (1991) and Snell and Dean (1992), human
capital management is defined as extensive recraitment and selective staffing,
comprehensive training procedures, stay-on of talents, the development and
deployment of the relationships with customers and suppliers, and the identification
and protection of insight of individual managers and workers. Additionally,
strategic HCMPs in terms of human capital management are to identify, to develop, to
protect, and to deploy HCMPs for recognizing and rewarding employee merit, and
providing the firm with a sustainable competitive advantage and, thereby, a superior
return on HCMPs. Strategic HCMPs, therefore, not only involve non-financial
facets of employee capability but also include firm-specific financial aspects that
competitors cannot duplicate"*. Extended definitions of terms are as follows.
1. Strategic human capital management practices (Tichy et al, 1982; Barney, 1991;
Grant, 1991; Snell and Dean, 1992; Amit and Schoemaker, 1993; Husehd, 1995; Coff,
1997; Abemethy and Brownell, 1997; Widener, 2000; Hitt et al., 2001). 2. Personnel
control mechanisms (Jung, Dalessio, and Johnson, 1986; Snell, 1992; Horn,
Caranikas-Walker, Prussia, and Griffeth, 1992; Bass and Avolio, 1993; Kaplan and
Norton, 1996; Pillai et al., 1999). 3. Employee capabihty (Tichy et al., 1982; Katz,

Kochan, and Gobeille, 1983; Katz, Kochan, and Weber, 1985; Guzzo, Jette, and
Katzell, 1985; Amit and Schoemaker, 1993; Huselid, 1995; Pillai et al., 1999). 4.
Customer loyalty (Jones and Sasser, 1995; Batra and Sinha, 2000)
1.4 Justification for the research
1.4.1 The primary theory underlying the research
The first theoretical framework underlying the research stems from the theory of BSC.
The role of accounting information within a firm has traditionally focused on the
financial accounting data reported for external purposes. Many firms question
whether traditional financial accounting information provides them with the best
indicators for control, decision-making purposes and strategic management (Ittner and
Larcker, 1998 b). There is evidence that while financial measures of performance
are lagged indicators, non-financial measures (e.g., product quality and customer
satisfaction) are leading indicators that evaluate and reward managerial performance
in terms of timely and useful accounting information (Banker, Potter, and Srinivasan,
2000). It is believed that, in this study, a traditional accounting control system
focuses on the controls of financial results while a non-traditional one emphasizes the
controls of non-financial results and the moderation of personnel control mechanisms.
A principal justification for the use of non-financial measures for performance
evaluation is that financial measures of performance may be imperfect and noisy
signals of a manager's effort, while non-financial performance measures can put in
value by encouraging long-mn attentive effort. Another justification for the use of
non-financial measures and controls is that they are leading indicators of financial
performance (Ittner and Larcker, 1998 a). Non-financial measures and controls can
complement short-mn financial figures as indicators of progress toward a firm's
long-term goals. Current profit and other financial measures only partially reflect
the effects of past and existing activities, whereas non-financial measures reflect the
effect of current managerial actions that will not show up in financial performance
until later (Malina and Seho, 2000).
The second theoretical framework underlying the research is the resource-based
theory of HCMPs. Human resource theory highhghts that firms capture and control
unique HCMPs. This distinctive resource provides the firm with the basis for
attaining sustainable competitive advantages (Amit and Schoemaker, 1993).
Attributes of idiosyncratic HCMPs — asset specificity, causal ambiguity and social
complexity — make resources difficult to imitate or trade (Coff, 1997). An
organization that relies on firm-specific HCMPs can achieve high returns because
there is no competitive market to bid up wages. Additionally, elements of HCMPs
with social complexity are difficult to replicate because they are embedded in
complex social systems (Barney, 1991). Finally, causal ambiguity makes HCMPs
hard to reproduce since the link between the input (resource) and the output
(performance) is not understood by competitors.
1.4.2 Contribution to knoM Iedge
In spite of its limitation, results of the present study show that a number of insights
can be obtained through the application of strategic HCMPs and the use of the BSC
model.
First, by empirically testing whether the relationship between strategic HCMPs and
employee capability is moderated by personnel control mechanisms, this study
provides one of the first pieces of empirical evidence with which to evaluate the
prescriptions in the human resource strategy literature. It is expected, in the present
study, that when strategic HCMPs involve more non-financial facets of employee
capability"*, moderating effects resulting from the control factor of personnel control
mechanisms are significant, and thereby more firm-specific financial aspects that
competitors cannot duplicate will be displayed such as valued relationships with
specific customers, gross rate of returns on capital, sales revenue growth and net
income before tax. This finding is complementary to those by Arthur (1994),
Huselid (1995), and Hitt et al. (2001). In those studies, variables of sociahzation and
the application of HCMPs were the major focal points. The present study intends to
discover whether the development and protection of strategic HCMPs moderated by
personnel control mechanisms correlate positively with employee's motivation toward
customers, and the deployment of strategic HCMPs moderated by personnel control
mechanisms brings a significant positive effect to employee productivity. These
findings have one practical implication. Managers can expend efforts toward
implementing strategic HCMPs and remove impediments to develop and deploy the
capability of motivated and skilled employees.
Second, by applying LISREL (Linear Stmctural Relation) involving stmctural
equation modelling and the measurement model about causal relationship among the
chosen BSC constmcts to confirmatory factor analysis and the analyses of the
moderating and intervening effects (Appendix 4), the present study intends to show
that firms relying more on personnel control mechanisms pay more attention to
strategic HCMPs and depend more on non-traditional accounting controls.
Additionally, by documenting the intervening effect of contextual variables on the
linkage between employee capability and financial performance of an organization,
the contribution to knowledge is expected to be the fiUing of the gaps caused by the

failure of the existing theory to account for the interactions of financial performance
measures with value drivers of the intemal-business-process improvement of an
organization. In addition, the development, protection and deployment of strategic
HCMPs promise to add significantly to understanding the relationship between
employee capability and customer loyalty. Although these resuhs should be seen as
prehminary because of data limitations, the present study will provide future
researchers with some empirical evidence supporting a promising new perspective
with which to study the effects of intra-organization changes in personnel control
mechanisms on the effectiveness of the development and deployment of strategic
HCMPs, and thereby on the financial performance measures associated with the
format of the BSC.
1.4.3 Contribution to practical benefits
Although suggestions from prior empirical work are often based on observations of
actual firms, they are not generally drawn from theory. Likewise, managers adopt
some of the policies implemented by successful firms without the benefit of a theory
explaining precisely what the policies accomplish. All dimensions of strategic
HCMPs in the present study are either the design of organizational strategy for
identifying, developing, protecting and deploying HCMPs or strategies for coping
with both the threat of employee turnover and the problem of asymmetric information
associated with the BSC model. The present research will be significant because it
is expected to pick up the company's beliefs about the causal relationships among the
chosen BSC constmcts, and to enhance the practitioner's interest in the development
and deployment of strategic HCMPs. An increasing number of firms is adopting
BSC and recognizing the role of strategic HCMPs in enhancing firm effectiveness and
performance. It may be practical for firms implementing the BSC to understand how

10
non-financial measures and controls help to reflect the effect of current managerial
efforts, and how HCMPs align with the firm's competitive strategy.
The present study is also expected to contribute to practical benefits. One important
implication, for current accounting practitioners, is that firms designing their
management control systems must first identify and protect their strategic HCMPs
and then match the design of management control systems to the development and
deployment of strategic HCMPs. The contingency fit between strategic HCMPs and
organizational strategy is needed, especially in dynamic environments. The present
study provides empirical support for the understanding of the value of the application
of strategic HCMPs in the implementation of organizational strategies. This
suggests that strategic factors of HCMPs are value drivers of the dimensions of the
BSC model.
1.5 Methodology
There are many gaps identified in the literature regarding the dimensions of strategic
HCMPs and the combination of non-financial measures and financial performance
associated with the format of the BSC. Given that the research questions mentioned
earlier address five inter-related areas, the present study involves two interconnected
parts: the external and internal quality of LISREL model; and stmctural equation
modeling used to test a theoretical model.
A review of the Uterature relating strategic HCMPs with BSC constmcts is undertaken.
Because the topics fall within a number of disciplines such as management accounting,
strategy management, organization theory and human resource management, material
is gathered from sources other than the accounting literature. The detailed study

11
undertaken will be reported in Chapters 2, 3 and 4. One stage of this research is an
exploratory study focused on what are the theoretical and practical issues of
evaluating and rewarding managerial performance in terms of BSC and strategic
HCMPs- The purpose of this stage is to clarify and specify the research questions
and testable hypotheses.
The survey-based method is the preferred research tool because in the present study
there is little control over behavioural events, and the focus is to identify and develop
a contemporary phenomenon within some real-life context. According to Yin
(1984), a survey can be readily designed to answer a "what" question. Furthermore,
"who" and "where" questions or their derivatives are likely to favour the survey-based
research method. In the present study, one question is what have been the outcomes
from applying strategic HCMPs? Identifying such outcomes is more likely to be
achieved by survey-based study than others (e.g., experiment). In addition, one of
the research goals of the present study is to make out the articulation of the links
between non-financial measures such as employee capability and customer loyalty
and financial performance of an organization. In such a case, a survey investigation
might be the favoured research tool and it would be less likely to rely on doing
experiments.
Data collection criteria include the following requirements. The research setting
includes two different kinds of requirements. The first one reUes more on the
development of strategic HCMPs. The second one pays less attention to the
deployment of strategic HCMPs. Firms taking strategic HCMPs into consideration
differ in their reliance on the dimensions of strategic HCMPs. This variability in
operation efforts highlights the significance of concentrating on the intensity of the
12
operation, not just on the presence of strategic HCMPs^. The main reason is as
follows: the change in the use of advanced manufacturing technology is often
accompanied by complementary changes in strategic HCMPs (Snell and Dean, 1992).
Strategic HCMPs may be even more important for modem manufacturing companies
taking Just-in-Time (JIT) inventory control and Total Quality Management (TQM)
into consideration (Ohver and Davies, 1990; Klein, 1991). Next, companies treating
human and technical systems as integrated entities and managing them in concert are
much more deliberate and comprehensive in their operation of strategic HCMPs than
are others (Snell and Dean, 1992). Finally, to gain the full potential of strategic
HCMPs, knowledge-based firms (e.g., law firms, hospitals, audit firms and high-tech
manufacturing companies) implement all dimensions of strategic HCMPs to the
greatest extent possible (Tichy et al., 1982). These firms may be even more likely to
consider non-financial measures to be leading indicators which provide them with
information related to corporate performance. Moreover, employee capabilities in
these firms with observable financial improvements drive improved
intemal-business-processes and, in turn, create customer values (Kaplan and Norton,
1996b).
On the other hand, the business strategies of cost-efficiency companies paying less
attention to JIT inventory control and TQM (e.g., a multi-plant cement manufacturing
company producing highly homogeneous goods) are related to technological
developments and investments in tangible assets, rather than the development and
deployment of strategic HCMPs (Snell, 1992). The primary organizational resources
of these companies are emphasized in turning out to be a low cost producer in its
principal market-place.

13
Trade publications and annual reports indicated the companies which were likely to
satisfy one or more of the criteria set out in the two previous paragraphs. They also
indicated the number of branches operated by most firms. An additional criterion
was at least 50 branches. In this study, direct contact with the head offices of
sample firms resulted in the five companies shown below agreeing to participate in
the project.
Based on the aforementioned requirements, the research sites chosen for this study
include: two high-tech manufacturing companies taking JIT inventory control and
TQM into consideration, Channel Well Technology Group (CWTG) and Goin
Integrated Service Group (GISG); one traditional multi-plant manufacturing company
making highly homogeneous products and ensuring the manufacturing processes are
capable of consistently high quality but supplying a simple target for reducing average
cost can suffice, Jian Kwang Machine Industrial Group (JKMIG); one life insurance
company fulfilling customer needs and striving for continuous improvements. Nan
Shan Life Insurance Group (NSLIG); and one fast food self-service company making
quality a major responsibility of employees, Tong Hai Fish Village Group (THFVG).
With the survey-based tailored design proposed by Dillman (2000), mailed
questionnaires are to be used to collect data. They are to be completed by store
managers responsible for the implementation of management control and strategic
HCMPs. It is also intended to conduct personal interviews with a self-selecting
sub-sample to enrich the data to provide a type of cross-check on validity.
Questiormaires are to be distributed to all store managers in the five companies,
CWTG, GISG, JKMIG, NSLIG and THFVG, approximately 265 store managers, hi
addition, there to be interviews with six managers in each group to provide insights

14
into historical and cultural background of the research site that influence management
controls and performance. Store-specific annual data on area demographics,
financial performance measures and other store-level details are available for the most
recent three fiscal year.
Quantitative data will be processed by using the LISREL model involving stmctural
equation modelling and the measurement model with the SMPLIS command
language. The proposed causation relationships described in testable hypotheses are
translated into a series of stmctural equations for each latent dependent variable.
This attribute settles on stmctural equation modelling with the exception of
techniques that accommodate multiple dependent variables — multivariate analysis of
variance and canonical correlation — in that they permit only a single relationship
between dependent and independent variables. The qualitative data collected from
the interviews will be analysed by using the STATISTICA program.
The relationships among dimensions of non-financial and financial performance at
five large, intemational manufacturing companies (e.g., CWTQ GISG and JKMIG)
and service firms (e.g., NSLIG and THFVG) will be examined with interviews and
archival data obtained from store managers whose divisions are implementing the
BSC and strategic HCMPs. As stated earher, a tailored design of survey
investigation is undertaken because latent independent variables in the present study
are difficult to reproduce in a laboratory setting. In addition, although the case
study is a distinctive form of empirical inquiry, case studies have been viewed as a
less desirable form than surveys in the present study. Why is this? The greatest
concern about case studies is that they provide little basis for scientific generalization
(Abemethy et al., 1999). Furthermore, the abiUty to estimate with considerable
15
precision the percentage of a population that has a particular attribute by obtaining
data from only a small fraction of the total population is what distinguishes the
tailored design of survey investigation from all other research methods. Neither
small group experiments nor case studies have this capability (Dillman, 2000).
1.6 Outline of the thesis
The present study is organized as follows. The first chapter introduces the argument
for inclusion of strategic HCMPs in management control systems and reviews BSC
constmcts. Theoretical background and the development of testable hypotheses are
described in Chapter 2. Additionally, a BSC-based reward system in terms of
internal or external fit is developed, and the resource-based theory of strategic
HCMPs is explored. The following chapter introduces the research sites and
develops the research methodology employed. The external and internal quality of
LISREL model is stated in Appendix 4. Chapter 4 not only reports the analysis for
the moderating and intervening effects but also discusses statistical results of the
nested-model analysis. Implications of the results, concluding contributions and
remarks, and avenues for future resejirch are arranged in Chapter 5.
Notes
1. Every firm has access to the same physical capital, technology, and strategy.
The true source of competitive advantage is found in exploiting the capabilities of
superior employees who can create successful ideas for improving internal
business processes and the value delivered to customers (Tichy et al, 1982).
According to Johnson (1992), "the investment in employee capabilities involves
the following activities: investing in employees through selective hiring and
training, investing in information systems to support decision making, motivating

16
and aligning goals of employees with corporate goals, and empowering
employees to use their knowledge and skills to the benefit of the organization."
2. Accounting research on constructional antecedents of corporate performance (e.g.,
Ulrich and Lake, 1990; Baldwin et al., 2000) has identified a number of internal
process improvement activities (i.e., activity-based costing and management,
innovations, improvements in post-sale services) that affect customer value.
3. Prior studies examining the association between customer satisfaction and
financial performance of an organization created mixed results. For example.
Banker et al. (2000) find that there are significant linkages between customer
satisfaction scores and future financial performance. However, Anderson et al.
(1997) argue that productivity and future profitability can be adversely affected by
higher customer satisfaction scores under certain conditions.
4. In this study, strategic HCMPs not only involve non-financial facets of employee
capability (e.g., the design of challenging work, job enrichment interventions,
realistic job previews, advancement opportunities and promotion, formal
information sharing, grievance procedures, labor-management participation
programs, and performance appraisal), but also include firm-specific financial
aspects that competitors cannot duplicate (e.g., valued relationships with specific
co-workers) (Tichy et al.,1982; Barney,1991; Snell and Dean, 1992).
5. Camana et al. (1999) hold that there are no worldwide mles that have been
appropriate for all organizations' operations, and not all obtainable ways are
regularly effective.

17
Chapter 2 The development of theoretical framework
and testable hypotheses
2.1 Introduction
Regarding non-accounting information used to appraise employees' performance,
some valuable farsighted views come from Hop wood (1972, 1974) who distinguishes
three styles of budgetary information used to measure managerial personnel's
performance. The three styles eue: budget-constrained style; profit-conscious style;
and non-accounting style.
The former two must use budgetary information, with the difference being:
budget-constrained style emphasizes managers' ability to accomplish short-term
budgetary goal, while the profit-conscious style focuses on managers' ability to hft
the operating performance of their departments which have close relevance with the
corporation's long-term operating goal. The non-accounting style features no
budgetary information to be used while appraising managerial personnel's functioning
performance, with the point of differentiation from budget-constrained style as:
non-accounting style not only connects with slight job-related tensions and less adroit
manipulation of accounting information, but with the promotion of harmonious
relationship between superiors and subordinates as well. Besides, non-accounting
style also has close connection with enhancement of employees'job satisfaction.
The balanced seorecard (BSC), started in 1990s, is regarded as a tool of management
control and strategy communication used to assist each departmental (or each shop)
manager in measuring the operating performance. In 1990s, a booming development
of activity-based costing (ABC) was used to overcome shortcomings of traditional
costing systems as follows: not being able to develop the cost drivers that make a
direct contact of the operating cost of each activity with the demand quantity of each
product. Most use of the BSC is made by most corporations to organize and
formulate their process of management around the budget and operating plan (Kaplan
and Norton, 2001b). Apparently, the interaction between the BSC and activity-based
budgeting lies in that the BSC is a tool of implementing management control and
strategy communication which is judging the effectiveness of operating activities of
an organization.
Organizations implementing the BSC and activity-based budgeting disregard those
aspects of the business strategy estimated to be without future economic values and
operating activity estimated to be without strategic values usually, since these
strategies and activities do not have a single redeeming feature to the organization's
future operating performance. Furthermore, those organizations draw up a
strategy-based and activity-based budget according to the business strategy estimated
to be having economic value and operating activity estimated to have strategic value
in the future. Consequently, a combination of business strategy with future
economic value, operating activity with strategic value and strategy-based and
activity-based budget enables those organizations implementing BSC and ABC to get
new capabilities, win new customers, acquire new markets and make essential
improvements in existing process and capabilities.
2.2 The development of a theoretical framework
Traditional accounting research has long been criticized by academics for methods of
performance measurement and tools of management control, since traditional views
neglect the causation between each departmental manager's short-term operating

19
activity and the organization's long-term business strategy while measuring the
impact of yesterday's operating strategy on today's management control.
As was indicated by Banker et al. (2000), traditional views caimot really reflect the
possible impact of today's business strategy of the organization on future operating
performance. Besides, the usefulness and adequacy of the traditional views have
long been doubted by practitioners. Dixon et al. (1990) indicated that an
organization's long-term business strategy which takes improvement of product
quality, development of manufacturing flexibility and lessening of manufacturing time
as the base of design will not make a mutual contact with the traditional views which
squares accounts in every detail on cost improvement.
Ittner et al. (1998b) also indicate that an organization may not reflect appropriately the
operating performance while facing highly uncertain exterior influences by merely
relying on traditional views that emphasize results of performance measurement and
management control but neglect the processes of management control and causes
bringing results of performance. Therefore, traditional views will be of great benefit
to the operating performance while an organization faces a stable exterior
environment and a simple manufacturing process of the products.
In this study, it is argued that reasons the traditional views can hardly emphasize
processes of management control and causes bringing resuhs of performance lie in
financial measurements of performance and resuhs of these measurements bemg
over-aggregated that thus carmot generate useful feedback information to assist the
organization in mapping out the business strategy as well as each departmental (or
each shop) manager in enhancing operating performance. Kaplan and Norton

20
(2001a,b) adopt similar views as well.
For the past two decades, both academics and practitioners have stressed repeatedly
that an organization must apply non-financial indicators to measure the performance
of management control while drawing up long-term business strategies as most of
these indicators emphasize the processes of management control and causes of
corporate performance (Bank et al., 2000). As indicated by Behn and Riley (1999)
non-financial indicators to measure the performance of management control are
leading indicators which can bring each departmental manager useful and timely
accounting information.
Views held by Bank et al. (2000) and Behn and Riley (1999) have already enabled
numerous organizations not only to use non-financial indicators to supplement
shortcomings of traditional performance measurement while reporting operating
performance but also to redesign management control systems so as to make the
functions of management control reflect the possible impact of today's business
strategy on future operating performance.
In academia, the BSC, initiated in early 1990s, has been used to link enterprise vision
with its operating strategy. The key for the BSC is to make a suitable combination
of corporate vision, business strategies of a company, flow process of internal
business and employee capability, to take advantage of adequate communication, to
decide on proper measuring indicators of financial performance, and further acquire
action plans from each measuring indicator. The purpose of implementing BSC is to
encourage a development towards the corporate vision and reach the operating target
of an organization. Based on Kaplan and Norton (1992), the BSC model involves

21
three subjects: performance measurement, management control and strategy
communication. The dimensions included in the BSC model can be described as
follows.
Figure 2.1 The dimensions of the BSC model
Customer value
Financial performance
Learning and growth
Internal business process
Source: Kaplan and Norton (1992)
2.2.1 The claims for the balanced seorecard model
The BSC model is claimed to be an effective combination of management control of
strategy and strategy communication (Kaplan and Norton, 1992). Atkinson et al.
(1997) regard the BSC model as one of the most important advances of scientific
knowledge in management accounting. In terms of the application of the BSC
model, Silk (1998) calculates that approximately 60 % of the US Fortune 500
companies have put into practice or are carrying out trials with the BSC model. The
BSC model offers three major improvements over traditional management control
systems:

22
(l)the establishment of links;
(2)the usage of non-financial indicators; and
(3)a congmence between the internal business process and an ABC system.
The first claim: setting up links
The first claim is that BSC has designed three links among four dimensions which
would benefit greatly the promotion of competitiveness of an organization. Those
dimensions are as follows (Kaplan and Norton, 1992):
(i)invest funds in items that would benefit learning and growth;
(ii)promote the internal business process efficiently;
(iii)create considerable customer value; and
(iv)improve financial performance.
Invest funds in items that would benefit learning and growth
As to the first dimension, Tichy et al. (1982) and Johnson (1992) insist that the
organization enables customers to enjoy the best service quality by pmdently
selecting talents, training talents and keeping them as well as investing in HCMPs.
BSC advocated by Kaplan and Norton (1992, 1993, 1996a, b, c and 2001a, b)
demands that the organization invest in information systems, encourage employees to
be diligent and work hard, authorize them to bring their working experiences and
specialized skills into full play to develop a smooth process of the organization's
production and marketing decisions, make employees' personal goals and the
organization's business goal congment and enable the organization to gain the highest
business profit.
According to Kaplan and Norton's views concerning the investment in HCMPs, there

23
are three methods of evaluation for the performance: measure employees' satisfaction;
evaluate the impact from employees' resignation rate on the organization's business
operation; and measure employees' production capabihty. Apparently, promotion of
employees' satisfaction is a factor which results in employees' low resignation rate,
increases of production capability, enhancement of the centripetal force towards the
organization, higher quality of product and enhancement of customers' satisfaction.
An organization with high customer satisfaction must have employees in high morale
that would definitely enhance their satisfaction.
According to the preceding inferences, this study postulates as follows. Employees'
production capability will increase (e.g., enhancement of satisfaction and low
resignation rate that would give rise to production capability of the employees' unit)
when an organization efficiently applies HCMPs (e.g., pmdently select talents, train
talents and keep them).
Promote the internal business process efficiently
For the second dimension, BSC advocated by Kaplan and Norton (1992, 1993 and
1996a, b c and 2001a, b) maintains that the target design and performance evaluation
shall be in conformity with the shareholders' maximum interest and will satisfy
customers' expectation.
Following the preceding inference and postulation, employees' production capacity
increases, internal business process improves and consumers' rights and interests gain
the greatest protection when an organization efficiently applies strategic HCMPs.
This study supposes that BSC can efficiently promote the internal business process of
an organization and then strengthen the friendly relationship between the organization

24
and customers through innovation of the products, quaUty improvement and intimate
after-sale service to gain an advantageous competitive position in the market. To
maintain an advantageous competitive position, each organization must design a set of
unique internal business processes which competitors are not able to imitate and thus
increase financial performance.
According to the preceding inference, this study makes the following postulation:
there exists a close causation among an increase of employees' production capacity,
improvement of internal business process and maintenance of friendly relationship
between the organization and customers when an organization efficiently applies
HCMPs.
Create considerable customer value
For the third dimension, the present and prospective customers' preference on
products may not necessarily be the same (Bomcki and Burke, 1999). In a word, the
present and prospective customers may have different intensities of preference (e.g.,
"like it very much" and "like it slightly"), and they may apply different methods to
evaluate the product quality. The subjective value that customers recognize in
products not only will affect customers' satisfaction but also indirecUy affect the
growth rate of sales revenue and profitabihty of an organization's products through
the increase and decrease of customers and changes of consumers' subjective value.
Kaplan and Norton (1996c) insist that lows and highs of customer satisfaction,
increases and decreases of customers, fluctuation of the growth rate of sales revenue
and changes in profitability are common characteristics regarding customer value for
an organization.

25
This study supposes that an organization shall set the goal for the customer groups
when creating considerable customer value: for the maximum growth rate of sales
revenue and profitability from the customer group expected by the organization.
Based on the above-mentioned inference, this study makes the following postulations:
there exists a close relationship between customer value and the organization's growth
rate of sales revenue when the organization efficiently applies BSC.
Improve financial performance
As to the fourth dimension, a realization of each production strategy (e.g., promote
the total quality management), marketing strategy (e.g., establish circumspect
marketing channel) and investment strategy (e.g., develop human resources) can serve
as the goal to be pursued by each activity when implementing BSC (Kaplan and
Norton, 1996c).
For products of the corporation, there are different missions to be accomplished for
each phase of the product life cycle. Based on research by Kaplan and Norton
(1996a, b, c), the life cycle for products includes three phases: start growing, keep on
growing and stop growing.
In the phase "to start growing", what a corporation has to accomplish is: increase
R&D for products; strengthen employees' production capability; enhance growth rate
of sales revenue; and estabhsh new marketing charmels and enlarge existing ones.
For the phase "to keep on growing", what should be accomplished by a corporation is:
make use of discounted value of cash flow, economic value-added and shareholder
value to evaluate financial performance for each investment activity. As to the phase
"to stop growing", the mission to be accomplished by a corporation is: obtain direct

26
and rehable cash flow to make up for each cash disbursement flow already paid or yet
to be paid as well as to calculate the effective growth rate of net profit.
This study holds that the corporation implementing BSC may use the following
indicators to measure the financial performance of the corporation: employees'
production capabihty, the growth rate of sales revenue, gross rate of return on capital
and the growth rate of net income before tax. When making use of these financial
indicators, however, it is necessary to consider at what phase of product Mfe cycle the
corporation is positioned. The Hnks described above can be depicted as follows.
Figure 2.2 Links of the BSC model
Invest funds in
items that would
benefit learning and
growth
Improve financial
performance
Promote
the intemal
business
process
efficiently
Create
considerable
customer value
Source: Kaplan and Norton (1992)
The second claim: the treatment of non-financial indicators
The preceding hnks elaborate the first claim of BSC, while the second one is: in
addition to the above-mentioned financial indicators used for implementing the BSC,
non-financial indicators are also used frequentiy to evaluate a corporation's

27
operational performance. Examples of those indicators are: employees' centripetal
force toward the corporation; degree of support by employees to the enterprise culture
of the corporation; level of tmst by employees in the leadership of the leading rank;
and customers' loyalty to products (Ittner and Larcker, 1998a, b; Mahna emd Selto,
2000).
According to Kaplan and Norton (1996c), financial and non-financial indicators can
fully reflect the causation between employees' production activity and the
corporation's operating performance, but there appears to be a causal relationship
between financial and non-financial indicators. In a word, non-financial performance
measures are the leading indicators for the corporation's operating performance, while
financial performance measures are lagging indicators. This study supposes that the
amount of non-financial indicators and numerical value of financial indicators may
sometimes change simultaneously, thus leading to a difficulty to confirm the
causation. For example, a lessening of employees' centripetal force towards the
corporation and a decreasing level of support by employees for the enterprise cuhure
may make employees' short-term productivity lower.
Similarly, customers' level of satisfaction towards products of the corporation shps
and customers' level of complaint increases making customers' willingness to
re-purchase in the short-term lower and thus influences customers' loyalty.
Consequently, the causation between financial and non-financial indicators is
determined by the difference of time period for applying the two indicators. When
the designated time period for applying financial and non-financial indicators is closer,
it will be harder to confirm the causation between the two; similarly, causation
between the two shall be hard to confirm when financial and non-financial indicators
28
appear simultaneously.
The third claim: the congruence between the internal business process and an
ABC system
The third claim of BSC is: there exists a considerable congmence between the
operational measures of the intemal business process and an ABC system which is
used to explore the relationship among the input of operating resources, the execution
of operating activity and the object of operating cost. The main function of an ABC
system is to help managers to understand the real cost and practical consumption of
operating resources and confirm whether specific operations produce value-added so
as to assist the corporation to achieve the purpose of cost planning and control.
When a corporation applies an ABC system, cost planning and control are traced back
to a developmental process, a marketing phase, the manufacturing process, the
distributional phase and the transport process of each product. Moreover, after
implementing BSC, those corporations shall precisely calculate the increases and
decreases of customers, lows and highs of customer satisfaction and growth rate of
sales revenue in order to measure the profitability brought by customers' purchases.
If those corporations apply ABC system simultaneously, it is possible to have a good
command of the preceding cost planning and control.
2.2.2 Limitations of the prior empirical work
The first claim discussed in BSC seems to be general commercial knowledge, but
recently, numerous scholars have explored the causation between financial and
non-financial performance measures empirically (e.g.. Banker et al., 2000; Malina and
Selto, 2000). Though the focal point of that research centre on whether or not

29
non-financial performance measures are leading indicators; whether financial
performance measures are lagging indicators of operating performance for a
corporation; and whether there exists a causation between financial and non-financial
performance measures.
These authors, however, did not explore the causation between financial performance
and human resources strategy of the corporation. Research by Kaplan and Norton
(1996c) indicates that what BSC discusses is a causal model, basically, while the
financial goals of the corporation are the centre of the four important hnks discussed
in the first claim (i.e., invest funds to items that would benefit learning and growth,
promote the intemal business process efficiently, create considerable customer value
and increase the financial performance). As to human resources strategy, it has a
close causation with the intensification of employees' production capability, the
improvement of intemal business processes, the enhancement of excellent customer
value, the creation of considerable financial performance and the establishment of
sound management control system. The corporation creates its long-term advantages
in the market through the causal relationship between human resources strategy and
financial performance.
Besides, for the sake of improving the intemal business processes (e.g., increase
employees' productivity, strengthen the corporation's manufacturing processes, and
enhance customers' loyalty to products), employee performance appraisal systems can
be used to strengthen employees' centripetal force towards the corporation and
enhance their intensity of support to the enterprise cuhure (Tichy et al., 1982). Prior
empirical work did not concentrate on those issues. This study supposes that the
employee performance appraisal system tmthfully reflects the effectiveness of

30
HCMPs (e.g., the influence of pmdently selecting talents, training talents and keeping
them on operating performance of the corporation) and changes of employee
production capability (e.g., the elevation of employee satisfaction, the decrease of
employee resignation rate and the increase of employee productivity), and the
relationship between the two. Particularly, when the corporation develops each new
business strategy (e.g., promote JIT inventory control, establish new marketing
channel and develop new human resources policies), the employee performance
appraisal system must be appropriately amended to enhance employee morale and
increase their performance at the time the corporation promotes the new business
strategy.
Finally, financial and non-financial indicators used to measure the operating
performance of HCMPs shall be carried out in a special combination so as to reflect in
time the causations between human resources strategies and results after the
promotion of those strategies. Every causation revealed by the dimension of BSC,
leaming and growth, can help the corporation to develop, communicate and promote
each kind of human resources strategy. The corporation obtains reliable feedback
information through BSC to achieve a good intemal control and accomplish employee
performance appraisal.
2.2.3 Barriers to the implementation of corporate strategy
As described in the preceding paragraph, methods of performance measurement and
calculation of employees' remuneration based on performance adopted by traditional
views are quite dissimilar to modem ones. What is emphasized by the traditional
views is lowering of cost for each unit of product, enhancement of rate of return on
investment and increasing net income before tax. The modem views, however, stress

31
the enhancement of employees' job satisfaction, lifting of employees' working morale,
improvement of intemal business processes, increasing customers' loyalty and
incessant hfting of the organization's competitive advantages (Grahn, 1995).
Why do modem views advocate applying non-financial indicators to supplement the
accounting information required to promote the management control systems?
According to Banker et al. (2000), an organization uses non-financial measurements
of performance to make up for an insufficiency of short-term performance indicators
to successfully draw up long-term business strategy which requires accounting
information and performance measurements. Moreover, Ittner and Larcker (1998b)
also indicate that an apphcation of non-financial measures for performance evaluation
is consistent with theoretical work on compensation in agency settings.
It is supposed that one reason to use non-financial indicators is that departmental
managers' efforts, working experience and specialized knowledge have not been
considered important by senior executives when the traditional methods of short-term
performance measurement is used to evaluate each manager's performance. Also,
departmental managers may consider that the operation of management control and
resuhs of performance measurement are ineffective or unfair, and these phenomena
shall easily result in managers' working pressure and fatigue as well as low intemal
morale under circumstances lacking appropriate communication.
According to Kaplan and Norton (1996c), the cmx of unsuccessful execution of BSC
lies in the failure to implement efficient business strategy. The barriers to execute
corporate strategy are always due to the following four items (Kaplan and Norton,

32
1996a, b, c): the obstacle to enterprise vision; the blockade from the employees at the
basic level; managerial obstmction; and the shortage of sufficient resources.
On the other hand, the main reasons for unsuccessfully conquering the barriers can be
described as follows. First, employees at the basic level will generate a state of
resistance due to misapprehension and insecurity when challenging a great
reformation such as the implementation of the BSC. Second, numbers of enterprises
carrying out the BSC do not hnk budget-organizing whh strategy-execution. Third,
the implementation of the BSC does not have a close causation with the accurate
evaluation to enterprises' operating performance. Based on the motivation of rising
above the barriers mentioned above, the development of the theoretical framework in
this study steps forward in terms of the following links.
First, emphasize the function of management control when implementing the BSC
(The development of the theoretical framework is described in subsection 2.2.3.1).
Second, highlight the function of strategy communication when executing the BSC
(The development of the theoretical framework is described in subsection 2.2.3.2).
Third, show up human capital management practices (The development of the
theoretical framework is described in subsection 2.2.4).
Fourth, pay attention to the moderating effect of persormel control mechanisms (The
development of the theoretical framework is described in subsection 2.2.4).
The following figure depicts the whole ideas noted above.

33
Figure 2.3 Barriers to implement corporate strategy when executing BSC
Employees'
misapprehension
and insecurity
Barriers to execute
corporate strategies
No hnks between
budget-organization
and strategy-execution
Lack of close relationship
between the implementation
of BSC and the evaluation of
corporate performance
Emphasize the
function of
management
control
Highhght the
function of strategy
communication
Show up
human capital
management
practices
Pay attention
to personnel
control
mechanisms
Source: Kaplan and Norton (1996 a, b, c, 2001a, b) and Tichy et al. (1982)
The whole hnks noted above can be depicted as the following figure. According to
Snell (1992), the implementation of strategic HCMPs in Figure 2.4 indicates that
strategic HCMPs are regarded as the driver of successfully executing corporate vision
and improving financial performance.

34
Figure 2.4 The causal Hnks for developing the theoretical framework
Strategic human
capital management
practices
Management control
Strategy communication
Employee
capabiHty
(leaming and
growth)
Customer
value
Intemal
business
process
Financial
performance
Sources: Kaplan and Norton (1992) and SneU (1992)
2.2.3.1 The function of management control
Management control of business strategy signifies one system trying to enable the
production activity of employees to be consistent with the overall strategy of their
employing firm (Tannenbaum, 1968; Tichy et al, 1982). According to Ouchi (1977),
Cheng and McKinley (1983) and Kerr (1985), there are three ways that management
control of business strategy can operate.
(i) Leaders of the organization declare the business philosophy and their ambition,
(ii) Intemal organization forms one operating faith with a deep influence,
(iii) Leaders of the organization evaluate employees' performance at any time and
receive feedback generated from employees' activity.
BSC advocated by Kaplan and Norton (1992, 1993, 1996a, b, c, 2001a, b) aims at
requesting those leaders to keep on declaring the business philosophy and their
ambition, evaluating employees' performance, and laying emphasis on feedback.

35
Consequently, one goal of implementing BSC is to recognize BSC as one tool in
management control of strategy. As noted earlier, one objective of this study is to
explore the characteristic of HCMPs and the strategic factors they involves.
According to Tichy et al. (1982) and Snell (1992), strategic HCMPs are the driver of
corporate vision, business strategy and financial performance and management
control of strategy has three patterns as follows:
(i) control the production behaviors of employees directly;
(ii) control the yield and quality of products; and
(iii) control the input of production factors.
Control the production behaviors of employees directly
Controlling the production behaviors of employees directly originates from the
following business philosophy: each activity is closely connected in sequence on a
series of relevant production activities (Hitt et al., 1990). To make sure all personnel
on the product line observe this stipulation, the leadership (for example, the foreman
of the production line, chief of section, chief of department or manager) supervises
personnel's production activity at any time and appraises their production
performance. Generally speaking, the appraisal of the employee's production
performance is based on the subjective evaluation by the leader Consequently, the
feedback generated from employees' production activity would be used to correct the
error In a word, the feedback is used to lessen the difference between employees'
actual production outcome and the leadership's expected result.
On the other hand, controlhng employees' production behaviors aims at turning
leaders' ambitions into employees' practical production activities. Therefore, direct
control of employees' production behavior can easily result in the following

36
after-effects.
First, the leadership of the organization must spend a considerable sum on
supervision.
Second, a high cost resulted from controlling employees' production behavior directly
will turn into an ineffective controlling activity. That is, the controlled scope of
employees' production behavior will be reduced greatly. Besides, to achieve a
purpose of taking control of employees' production behavior, each step for a series of
production activities will be standardized to implement the supervision and
performance appraisal, thus making employees more careful while engaging in
production activity for fear of error.
SneU (1992: 296) supposed that "while there exists the causation of mutual
correspondence between the actual outcome generated from employees' production
activity and the production activity on the product line, if the leadership of the
organization does not have a good or deep grasp of the causation, then each step in the
employees' production activities carmot be standardized in advance". Furthermore,
the leadership will never find a reasonable estimation basis to evaluate and appraise if
employees' working performance or their production activities actually fulfill the
philosophy and ambition of the leadership of the organization. In these
circumstances, controlhng employees' production behaviors directly will bring no
benefit to the organization.
Control the yield and quality of products
A direct control of product yield and quahty by foremen, chiefs of sections and
37
departments is the second pattern of the control system (Tichy et al., 1982; Snell,
1992). The organization must estabhsh the expected financial goal in advance for
employees to observe when product yield and quality are under direct control.
Production activities are not necessarily standardized and operating philosophy and
ambition of the leadership are not necessarily transformed into employees' practical
production activity (Hill and Hoskisson, 1987). Under such a circumstance, each
employee will be authorized to apply all useful production methods to achieve the
expected goal.
In light of a view from agency theory under a lack of rigorous procedural supervision
and quality control, a direct control of product yield and quality may result in less
information about practical production activity acquired by leadership than by those
employees on the production line (Wilhamson, 1975). To avoid these issues and to
stimulate employees' efforts to accomplish the leadership's managerial philosophy
and ambition, employees' performance and their rewards shall reveal an obvious
causation with their practical production activities (Ouchi, 1977). In a word,
employees are authorized to try their best to make a good command of each
self-performance opportunity by eliminating each possible disadvantage on the
production line, increasing product yield and enhancing product quahty to obtain
higher remuneration.
As a direct control of product yield and quahty is an ex post behavior control, the
inner organization of the corporation will have no built-in system to stop
manufacturing error occurring as employees engage in production activities.
Besides, what responsibility and risk employees and foremen, etc. can bear and face is
far greater than under direct control (Snell and Dean, 1992). Therefore, those

38
employees and foremen, etc. might select the production plan with financial goals
easily achieved and the working performance with an immediate effect produced,
rather than the one uneasily achieved as well as the one revealed in the long-term span
which are significant to the integral operation of the organization. To avoid these
circumstances, the leadership must map out a reliable and effective performance
accrediting system to assess the contribution level for performance of the integral
operation on each production line.
Control the input of production factors
The third pattern of the control system is a control of input of production factors (i.e.,
investment in human resources) (Snell, 1992). Research by Tichy et al. (1982) and
Jaeger and Baliga (1985) indicate that seeking appropriate talents, cultivating
excellent talents and keeping useful talents are one control on the input of production
factors that enables a combination of employees' personal interests with those of the
organization. Selection and training can take control of employees' professional
knowledge and technique to decide if they are in conformity with the corporation's
demands, employees' production capability is sufficient to promote product quality
and engage in innovative activities, and employees' working performance meets the
leadership's expectation.
Each of these three mentioned above shows advantages and defects, and a
combination of them (simuhaneous apphcation) is exactiy what is described in this
study, i.e., the role of the BSC for management control of strategy. As Wash and
Seward (1990) indicate, the basic spirit of a control system is to stimulate employees'
production motivation, cultivate employees' production capability and carry out
communication between leadership's managerial philosophy emd employees'

39
production activity. Consequently, the theoretical model in this chapter advocates
that an effective apphcation of strategic HCMPs is an important premise to execute
the BSC. The relationship between them moderated by the function of management
control can be depicted as follows.
Figure 2.5 The relationship between strategic HCMPs and employee capabiHty
moderated by the function of management control
The function of management control
Strategic human
capital management
practices
1 ' Employee
capabiHty
Source: this study
2.2.3.2 The function of strategy communication
Research by Kaplan and Norton (1996c) indicates that BSC Hnks up the anticipated
operating results of the organization and the energy that pushes these anticipated
results to become close causation, while the leadership unifies one power with a
strong centripetal force by cormecting each employee's speciaHzed knowledge with
working skiU through BSC to achieve a strategic goal. Consequently, BSC not only
helps the organization implement beneficial business strategy but also enables its
intemal communication charmels to remain unimpeded.
Tichy et al. (1982) think that the financial performance of an organization wiU worsen
when its intemal commurucation channels are impeded. Therefore, one important
factor in maintaining a long-term operating advantage in the market would be to open

40
one good intemal communication channel and link up the business strategy and
employees' speciahzed knowledge and skill through the BSC.
According to Barker and Camarata (1998) and Goodman (1998), the distinctive
features of effective communication and communication quahty can be classified as
follows: (i) complete communication process and brief and concise communication
language; (u) create good quality of enterprise culture by demands of self-esteem and
self-realization; and (iii) legacy of working experience and giving and acceptance of
specialized skill.
Complete communication process and brief and concise communication language
If the language used in the communication process is simple and easy to understand,
employees are quite willing to communicate and the communication process will
benefit greatly their production activity. Besides, effective communication should be
frequent, while the effect of communication can be anticipated in advance. The
results of communication will be substantial and would win tmst from employees of
the organization if the process were complete (Barker and Camarata, 1998).
According to Goodman (1998), effective communication methods should be able to
ehminate the employees' untmthful reports of working performance, thus improving
the centripetal force towards the organization.
Create good quality of enterprise culture by demands of self-esteem and
self-realization
The development of enterprise culture enables employees to be able to cooperate with
each other to combat the disadvantageous impacts from the outer environment and
think of the prospective orientation of development for the organization so as to build
41
an aspect of continuing prosperity. As described above, a depiction of the
communication resuhs shall be expressed in clear and definite and concrete methods.
An excellent enterprise culture will be able to integrate different operating
philosophies to eliminate the behaviours generated by employees deviating from the
production activity.
In the organization, each employee thinks himself/herself a person with values who is
capable of fulfilling each assigned mission and solving problems with the greatest
ease while facing all kinds of challenges. Therefore, each of them would identify
what they have done, hoping his/her ability would receive recognition from others.
Effective communication methods can satisfy such needs for self-esteem while
communication can help employees to develop their own communication capabilities
to improve inter-personality and strengthen friendships with others. When needs of
self-esteem are satisfied, needs of self-realization start to be activated while
employees will urge themselves to bring their own aptitude, potential and natural
endowments into full play and have them realized.
Legacy of working experience and giving and acceptance of specialized skill
Communication is a skill which is like other skills such as playing piano and termis
that require time and effort. First of all, leaming communication skill requires a
self-examination and understanding of personal status and behaviors, and accordingly,
communication needs experience and practice.
With different working experiences and specialized skills as well as various practice
processes to obtain them in the organization, accumulation and exchange of these
working experiences and specialized skiUs are indispensable sources to design.

42
implementation of production or marketing or investment strategy. The benefits of
working experience and giving and acceptance of speciaHzed skill can be achieved
through communication. The establishment of new production methods, invention
of new operating philosophies and design of new marketing strategies rely on a
mutual communication, exchange and brainstorming of working experiences and
SpeciaHzed skills between employees that lead to an incessant brew, integration and
development. As expressed by de Hass and Kleingeld (1996), efficient two-way
communication encourages employees to participate in the design of performance
accreditation systems which keep on offering rehable and tmstworthy working
experiences to be in conformity to enterprise culture, providing all other employees
with opportunities to share. Strategy communication of BSC discussed in this study
includes three important distinctive features in communication: a complete
communication process and a brief and concise communication language; needs of
self-esteem and self-reaHzation to create good quahty of enterprise culture; legacy of
working experience and giving and acceptance of specialized skill. The relationship
between human capital management practices and employee capabiHty moderated by
strategy communication can be depicted as foUows.
Figure 2.6 The relationship between strategic HCMPs and employee capabiHty
moderated by the function of strategy communication
The function of strategy communication
Strategic human
capital management
practices
Employee
capabiHty
Source: this study

43
2.2.4 The theoretical framework of human capital management practices
Traditional views regarding HCMPs research put the focal points on the distinction of
managers and direct labour force (Arthur, 1994). The function of managers is to
apply statistical skills and intellectual faculties to design products and decide the
production processes simultaneously, and search for the direction of customers'
preference according to the position of the products on market. The function of a
direct labour force is to apply physical strength to manufacture products under
managers' direct supervision and have the products transported to the market.
However, modem research regarding HCMPs argues that not only managers apply
statistical skills and intellectual faculties to engage in product design and production
process analysis, but engineers, marketing, management and accounting persormel
work on issues concerning product design and process analysis as well, while they
keep on thinking how to improve the quality of the products, lower cost and shorten
the manufacturing time (Huselid, 1995; Hitt et al., 2001).
This study supposes that if a corporation implementing strategic HCMPs actively can
emphasize the operation of personnel control mechanisms at the same time (e.g.,
carefully selecting talents, pmdently training talents and practically keeping them),
then the main mission for employees with specialized knowledge and production
skills is to keep searching for solutions to problems and to engage in irmovative
activities. Under such circumstances, employees are intelligent and clever people
who search for problems and solve problems rather than robots merely engaging in
dull and repetitive production processes.
Consequently, the scale of production keeps on growing under those problem-solvers'
hard work. As indicated by Tichy et al. (1982) and Kaplan and Norton (1996c),

44
encouraging employees to detect problems, supporting employees to solve problems
and developing their potential are important factors in the rise and fall of a
corporation.
Employees' behaviour has a great impact on operating performance. According to
SneU and Dean (1992) and Arthur (1994), cost control and treating others with utmost
sincerity are the one and the only way to develop employees' willingness to face
challenges and work hard. The purpose of cost control is aimed at lowering direct
labour cost and enhancing production efficiency, while treating others with utmost
sincerity aims at understanding employees' ideas and motive of behaviour and giving
appropriate recognition.
This study holds that courses of action for cost control and treating others with utmost
sincerity are different due to different purposes. Cost control is to ask employees to
observe regulations regarding production activity, announce the appraisal method of
working performance and the calculation of rewards to employees so as to let them try
their best to promote working efficiency and cam the highest remuneration, as
suggested by Walton (1985). On the other hand, treating others with utmost sincerity
is to believe employees' behaviour valuable to the operating performance and,
consequently, to give appropriate respect to their production behaviour Pillai et al.
(1999) suggested that treating others with utmost sincerity determined whether a
leader could be effective or not. They postulated that when the objectives of the
organization require greater diversity of effort and greater coordination, treating
others with utmost sincerity becomes much more important to implement human
capital management practices. In this study, treating others with utmost sincerity
describes encouraging behaviours of a supervisor towards a subordinate in order to

45
make the subordinate go over activities before attempting them (De Vries, Roe, and
Tailheu, 2002). It is contextual in the sense that it depends on the individual's
assessment of the particular practices. Under such circumstances, the corporation
actively encourages employees to participate in the management and operating
decisions and work cooperatively to find solutions and proposals to the problems that
the corporation faces. Moreover, there exists a certain relationship between
employees' working performance appraisal and the corporation's operating strategy.
In a word, methods of performance appraisal and the management system shall be
amended appropriately when employees' performance is particularly remarkable and
transcends that expected by the management, as suggested by Tichy et al. (1982).
Based on the preceding inferences, this study makes the following postulation: a
corporation applying strategic HCMPs actively but failing to understand employees'
ideas and motive of behavior and giving inappropriate influence cannot enhance
employees' production capabihty by relying only on cost control and supervision of
employees' production behavior.
2.2.4.1 The contingency view of human capital management practices
Huselid (1995) and Hitt et al. (2001) indicate that the impact of a corporation's
business strategy on operating performance depends on the level of close combination
of cost control and strategic HCMPs • Deming (1989) and Snell (1992) argue that the
significance of cost control for operating performance goes beyond treating others
with utmost sincerity if the supervisor has a rich specialized knowledge and working
experience on production process of products and a full grasp of employees' working
performance appraisal.

46
This study holds that cost control and treating others with utmost sincerity should be
applied together to elevate the operating performance if a corporation lacks these
chcumstances mentioned by SneU (1992). According to Pfeffer and Cohen (1984)
and Arthur (1994), how to combine cost control and treating others with utmost
sincerity is one management philosophy while the two are different management
practices. hi the tight of different corporations with different management
philosophy, this study holds that combining cost control with treating others with
utmost sincerity is a clever application of strategic HCMPs.
Corporations actively applying strategic HCMPs lift employees' production capability
through the development of human capital. Pmdent selection of new employees is
equivalent to a rigorous demand of the production technology a rookie should possess,
while strict before-the-job training after being employed and frequent on-the-job
training are equivalent to an elevation of their production technology (Huselid, 1995).
Moreover, those corporations can also enhance employees' motive to work hard on
production through employee working performance appraisal and a close relationship
between performance appraisal and employees' working rewards. Finally, through
the regulation of organizational stmcture (e.g., shift and transfer of working position,
design of quality circle and establishment of production team), those corporations can
encourage employees' active participation in management and operational decisions,
thus helping to lift the entire operating performance.
2.2.4.2 Limitations of the prior empirical work
To achieve cost control, production line managers must supervise employees'
production activity continuously to appraise their performance. Those managers
must also make use of the feedback generated by employees' production activity to

47
cortect the differences between their practical production results and those expected.
Consequently, the leadership of the corporation devotes resources to supervision.
If a close relationship exists between employees' production activity and practical
results generated by production activity and the management is unaware of it, they
cannot evaluate whether employees' production performance or production activity
actually fulfills the operating philosophy of the corporation. Consequently, the
leadership and employees must share the same information about the production
activity, otherwise the appraisal of employees' production performance cannot be
objective and employees' morale will be affected disadvantageously. That would
result in a failure of the management decision and a total disintegration of cost
control.
Asymmetric information between the leadership and employees can be solved through
extensive collection and positive integration of the intemal messages (e.g.,
employees' mutual appraisals on production performance and swift circulation of
messages concerning the production activity between each department). Pfeffer and
Cohen (1984: 550-572) also hold similar views. To achieve cost control, this study
supposes that the management can take employees' self-appraisals on production
performance and customers' appraisals on employees (e.g., shop assistants) as
important information to assess employees' performance. Deming (1989: 27-36)
also holds similar views.
The purpose of the assessment for operating performance of the corporation is to
expect a consistency between goals foUowed by each departmental manager and those
pursued by higher levels of management. As stated above, the assessment of

48
performance of the corporation is quite comphcated. GeneraUy speaking, there are
obstacles required to be overcome while assessing the operating performance of the
corporation: for departmental managers, non-financial indicators are used frequently
to assess results of each departmental operating process, with their importance being
not less than the financial ones. However, the difficulties faced in collecting
information for non-financial indicators are far greater than for financial indicators.
Kaplan and Norton (1996c) also hold similar views. On the other hand, the
coUection of qualitative information is intentionally or unintentionally neglected
frequently by academics while assessing the corporation's operating performance and,
consequently, financial indicators used to assess corporate performance lose
reliability.
This study holds that economic benefits brought by intellectual assets (e.g.,
employees' working experience) ought to be taken into account when using the
mixture of financial and non-financial indicators.
Sometimes, the contribution of these intellectual assets to the corporation's long-term
operating performance is far more important than that of the tangible or physical
assets. Coff (1997: 374-402) also holds similar views. If the economic benefits
brought by intellectual assets can be measured by a set of objective indicators
resembling that of tangible or physical assets, those corporations developing
intellectual assets can make a complete report about the economic benefits brought by
intellectual assets on the profit-and-loss statement and have it shown to shareholders
and employees. However, the greatest difficulty confronted by academics while
handling these issues is how to identify objective indicators to reveal the economic
value of these intellectual assets on the balance sheet.

49
The calculation of accounting profit does not take opportunity cost generated from an
apphcation of strategic HCMPs into account and that may result in inefficient
allocation of intemal human resources of a corporation (e.g., human resources used by
some departments are far more than that by other departments, but the application of
strategic HCMPs is inferior to that of other departments).
In addition, if the assessment of operating performance intentionaUy emphasizes the
measurement of short-term performance, it may force each departmental manager to
engage in a second, high-profit, strategy with hs performance shown in a short-term
period by giving up first, high-profit, strategy with their performance only shown in a
long-term period.
This study supposes that if corporations using BSC actively can identify qualitative
non-financial indicators and apply the preceding management practices by blending
cost control and treating others with utmost sincerity, accounting information required
to assess operating performance for each department can be completely displayed.
In this way, employees of each production line or shop assistants can learn, instantly,
the results generated by their efforts from individual financial or non-financial
indicators. Also, higher-level managers can learn from the combined resuhs
generated by financial or non-financial indicators.
2.3 The development of testable hypotheses
2.3.1 Strategic human capital management practices, personnel control mechanisms and employee capability
Organizations usually apply tangible assets and intangible resources simultaneously
when developing and deploying business strategies, but the operating performance of

50
different organizations demonstrates a great difference in the relative amounts used
and the effectiveness of their use. Some intangible resources are so intricate to
understand and so difficult to acquire that market competitors may not be able to
imitate. Consequently, those resources (strategic HCMPs, in particular) are
recognized by most as significant economic resources (Hitt et al., 2001).
2.3.1.1 Strategic human capital management practices
As indicated in the preceding paragraph, an organization creates considerable
competitive advantage with its source generally originating from those useful and
specific human resources employed by the organization that its market competitors
are not able to mimic. Nevertheless, an organization merely applying strategic
HCMPs will not necessarily create competitive advantage.
An organization which is applying strategic HCMPs will not be easily followed by its
market competitors, while this phenomenon may make the organization face obstacles
while managing the human resources which are quite professional and specific (Teece,
1982; Hitt et al., 2001). As indicated by Chiang and Chiang (1990), the
differentiation of human resources from physical assets is that: serious and
insufficient information circulation may occur in an organization while applying
highly specific and socially complex human resources; and the organization may
sometimes face the abmpt resignation from employees with speciahzed knowledge
and skiUs.
General human resources can be traded on the competitive labour market while
employees can change jobs at will that makes some organizations think general
production technologies are not really able to create competitive advantage (Barney,

51
1991). According to Amit and Schoemaker (1993), competitive advantage for an
organization comes from its apphcation of strategic HCMPs, with its power to use
specific human resources held by the organization. Specific production technology
and specialized knowledge, interpersonal relationships in pohtical and business circles
and enterprise cuUure are fitted into strategic HCMPs which can only be apphed
strategically in a particular organization. Although the abmpt resignation of
employees may pose threats, production technology, specialized knowledge,
interpersonal relationships in political and business circles and enterprise culture
might lower those threats. Consequently, important and urgent issues to be solved
for the organization are: how does the management of an organization efficiently
apply their specific and unique human resources and have them managed
appropriately to create a considerable competitive advantage.
How can the management of an organization efficiently apply its specific and unique
human resources and have them developed appropriately? The most important
method is to overcome managerial obstacles caused by the social complexity and
uncertainty of causation behind these unique and specific human resources (Coff,
1997). Causation uncertainty of specific human resources is the source from which
the organization creates competitive advantage, mainly because it makes market
competitors not able to emulate.
Interpersonal relationships in political and business circle and enterprise culture may
make specific human resources of an organization reveal considerable social
complexity. The social complexity is tangled with the preceding causation
uncertainty of human resources. Under the circumstances, the business strategy of
an organization may be influenced by adverse factors such as adverse selection, moral

52
hazard and bound rationality while the management try to identify, develop, protect
and deploy strategic HCMPs (Barney, 1991).
Some impacts from unique production technology, specialized knowledge and
specific interpersonal relationships in political and business circles cannot be
observed directly and that may result in good practices being replaced with bad ones
in the labour market. Besides, ambiguous causation behind specific human
resources may bring about this predicament while the management tries to identify
strategic HCMPs (Coff, 1997). An example is the recmitment process, an
interviewee falsifies or exaggerates past experiences while the information about the
interviewee's knowledge and technology in the past held by the organization is quite
vague. This eventually makes the organization give the interviewee an important
assignment beyond his / her capacity.
On the other hand, moral hazard may occur when the management of an organization
fails to understand the employees' efforts and contributions through inappropriate
performance evaluation during the processes of production. For example, employees
may not be certain whether their efforts will have an influence on the measurement of
performance when individual contributions are entangled in some team settings (Coff,
1997). Under such circumstances, it would be like getting water from a stone to ask
employees to increase their efforts and give of their best if the organization fails to
present an impartial measurement of performance and a reasonable calculation
formula for work remuneration.
The protection of strategic HCMPs may decrease the preceding moral hazard. For
example, the management faces uncertainty of causation behind specific human

53
resources but uses subjective measurement of performance as well as generous
rewards and severe punishment to handle promptly those activities that they can
hardly understand, take control in advance and bring influence into full play.
On the other hand, when the management of an organization applies strategic HCMPs,
it would be a risk for senior executives with bounded rationality to make decisions
under circumstances of asymmetric information. They need one impartial
measurement of performance and calculation formula for reasonable work
remuneration but do not know how to collect the necessary accounting information
while employees do not know how to provide that accounting information either As
indicated by Ouchi (1980), each dimension of the management control mechanisms
will eventually be futile as a result of asymmetric accounting information.
This study supposes that the business strategy of an organization wiU suffer great loss
if the organization is unable to overcome issues arising out of asymmetric accounting
information but identifies, develops, protects and deploys strategic HCMPs recklessly.
2.3.1.2 Strategic human capital management practices and personnel control
mechanisms
The function of management control is to enable the main goal of the production
activities of employees to be consistent with the goal pursued by the long-term
business strategy of the organization (SneU, 1992). When the management have a
fuU grasp of the input-output relationship, they will take effective control of the final
resuhs (output) of the production activity (Seal, 1993).

54
Such a view has practically indicated that the traditional management control system
will be operated effectively and brings improved function when the management has a
full grasp of the cause-effect relationship. For example, an organization uses a direct
management control over the causation between employees' production activity and
the practical resuhs of the activhy. To do this, the management must conduct
rigorous supervision and measurement of employees' performance at all times to
confirm employees' production activity to be exactly in conformity with the
standardized operating process. Under such circumstances, the management needs
the feedback arising out of employees' production activity (i.e., as soon as deviations
of subordinates' actions crop up, feedback is used primarily as a remedial tool to
correct them).
But Widener (2000) indicates that the management wiU lack rehable accounting
information to establish an impartial measurement of performance and calculation
formula for reasonable work remuneration when the causal relationship between
employees' production activity and the practical results of the activity is vague or
senior executives do not have a full grasp of the input-output relationship. Besides,
the interdependence of job satisfaction among employees of the organization applying
strategic HCMPs actively will make the measurement of performance lose rehabihty
and objectivity.
Jaeger and Baliga (1985) hold that the mechanism for bringing management control
into full play is important for organizations implementing strategic HCMPs, as close
coordination between the management control mechanism and human resources
management will make the goal of employees' production activhy consistent with the
business strategy of the organization. Snell (1992) further indicates that an
55
organization uses personnel control mechanisms to judge if employees' production
technology, specialized knowledge and interpersonal relationships are in conformity
with the organization's requirement as well as if employees' potential, values and
endowments are required to be developed further.
Bringing the personnel control mechanisms into full play is an important premise to
pursue excellent operating performance of the organization. This study supposes
that personnel control mechanisms aspiring to establish an impartial and efficient
measurement of performance lower the threats from employees' abrapt resignations
through pmdently selecting talents, training talents and keeping them. When the
causation between employees' production activity and the practical results of the
activity is ambiguous, the management lacks a full grasp of the input-output
relationship and the appraisal and measurement of employees' work performance are
partial and inefficient. Bringing the personnel control mechanisms into full play
may hft employees' morale, intensify the intemal unity and lower the loss as a result
of employees' abmpt resignations.
For those organizations deploying strategic HCMPs actively, lowering employees'
abmpt resignations is an important task. Arnold and Feldman (1982), Cotton and
Tuttle (1986) and Sheridan (1992) indicate that safe working environment, sohd
organizational stmcture, impartial measurement of performance, reasonable formula
of calculating work remuneration, active enterprise cuhure and sound labour union
system may minimize labour tumover. Horn et al. (1992) further point out that
employees' self-cognition and self-affirmation to work will fully reflect an
enhancement of employees' job satisfaction and their demand for on-the-job training

56
on specific production technology that thus would lower employees' abmpt
resignations.
As described in the preceding paragraph, employees' job satisfaction basically reflects
self-cognition and self-description of their current job. Jung et al. (1986) point out
that the enhancement of employees' job satisfaction depends on the foUowing factors:
(1) employees' pay; (2) superiors' leadership; (3) harmonious relationship between
co-workers; (4) employees' opportunities of promotion; and (5) working environment.
For some employees, factors other than pay are far more important than the increase
of pay, sometimes, with those factors having correlations with employees' personal
preference. For example, some employees may consider a safe and comfortable
working environment more significant than plentiful pay; some, however, think
harmonious relationships between colleagues are more important than comfortable
working environment and plentiful pay.
This study supposes that for some trades (e.g., knowledge trade), intensive on-the-job
training and safe and comfortable working environments are particularly important to
the enhancement of employees' job satisfaction, since they enable employees to learn
new knowledge and skiUs that would enhance their opportunities for promotion and
earning higher pay. Furthermore, intensive on-the-job training makes employees
able to improve skills through discussions with others, thus enhancing a harmonious
relationship between co-workers as well as the coordination of team-based work.
Eventually, intensive on-the-job training and safe and comfortable working
environments can enhance employees' productivity, further increasing the
profitability of the organization (Humphrys and O'Brien, 1986). O'Reilly et al.
(1989) deem that managing group demography and social activities can increase

57
harmonious relationships between co-workers. In stmcturing employees' career
paths, firms can apply promotions to enhance employees' job satisfaction. It is
necessary for employees to perceive that such promotions are earned.
In a word, the operation of personnel control mechanisms not only can enhance
employees' job satisfaction but also lower the loss arising out of employees' tumover.
To lower the loss from employees' tumover, organizations can design one set of
strategic HCMPs with a close coordination of employees' on-the-job training with
working characteristics which is strict and fair in meting out rewards and punishments
and provides opportunities for promotion. The production teams work in perfect
harmony according to the enterprise culture and intemal business processes that shall
never be imitated by competitors.
Human resources are the basis for organizations to carry out long-term business
strategy, while the application of strategic HCMPs will enable an organization to
build competitiveness in the market and create beneficial and sustainable market
opportunities. Lee and Miller (1999) point out that the efficient application of
strategic HCMPs shall be a plus point to eam competitive advantages and implement
business strategy. As indicated in the preceding paragraph, an organization which
has specific human resources that competitors cannot imitate, a production team with
production technology and specialized knowledge, a management philosophy in
harmony with the enterprise culture, a communication channel of accounting
information without hindrance and a system for human resources management that is
strict and fair in meting out rewards and punishments and perfect in training men of
ability will inevitably acquire beneficial competitive market conditions from the
process of developing strategic HCMPs.

58
As pointed out by Wash and Seward (1990), the operation of personnel control
mechanisms includes the guidance of employees' production motive and training of
their productivity during the process of applying strategic HCMPs, while the former
can be achieved through an impartial measurement of performance and reasonable
working remuneration and the latter can be accomphshed through a rigorous training
plan. Consequently, impartial measurement of performance, reasonable working
remuneration and rigorous training plan are significant premises to bring personnel
control mechanisms into full play.
Amit and Schoemaker (1993) indicate that strategic factors contributing to the success
of an organization include pradent selection of talents and complete training of men
of abihty, development of employees' production technology and specialized
knowledge, a good use of employees' working experience and intelligent judgment,
encouragement of employees' incessant innovation, and mapping out and
implementation of long-term business strategy through excellent employees' real
knowledge and deep insight to create useful production environment, thus making
employees' goal of production activity consistent with the business strategy through
the plarming and coordination to create the most beneficial market opportunity
eventually.
As indicated above, induction for employee motivation may be futile if there is
incomplete or insufficient accounting information while neither senior executives of
the organization understand how to coUect accounting information related to impartial
performance measurement and calculation formula for reasonable working rewards
nor employees know how to provide senior executives with accounting information.
As Vroom (1964) points out that an effective induction for employee motivation wiU

59
be accomphshed by relying on conditions as foUows.
(a) there exists a certain causation between employees' efforts and increase of
promotion opportunity and earning higher rewards;
(b) there are certain causations between the reasonable working rewards and
impartial performance appraisal; and
(c) employees' performance appraisal and calculation of working rewards are
considered to be impartial and effective by most of the employees.
Kerr (1975) further indicates that some methods of induction for employee motivation
are direct with the effects of induction observable instantly, while some of them are
indirect (one method of unconscious influence) with the induction effects being
gradually observed over a long time.
Consequently, a mere use of direct induction methods will not necessarily bring the
induction effects into full play. Moreover, individual employee's contributions are
not easily described objectively in direct measurement though each employee is
entitled to share the team glory and production results of the production team.
However, Pritchard et al. (1988) agree that there are direct causations between
effectively leading the production motivation of production team and impartially
measuring the production team's overall performance and stimulating individual
employee's production motivation and enhancing their productivity. For those
organizations applying strategic HCMPs actively, both effectively leading the
production motivation of the production team and impartially measuring the
production team's overall performance create considerable competitive interest for
them.

60
Encouragmg employees to actively participate in drawing up the business strategy
aims at enhancing employees' recognition of the corporate culture and further
enabling the whole staff to participate in administering the organization. Wagner
(1994) points out that the deeper employees' participation in the institution of
organization's business strategies, the higher satisfaction they show in their work
leading to lower employees' resignation rates. This phenomenon indicates that an
enhancement of employees' recognition of the corporate cuhure generates strong
interest in participating in the corporation's efforts to map out the business strategy
and would help lower employee tumover
Deming (1989: 27-36) also shares similar views. For example, senior executives of
an organization collect accounting information related to storage time, moving time,
waiting time and inspection time when the organization wishes to identify activities
that increase product cost but not product values through the activity-based costing
(ABC) system and have those activities eliminated, while employees at the basic level
offer such accounting information to senior executives. Should there be
asymmetrical information between the employees at the basic level and senior
executives, encouraging those employees to actively participate in the strategic
apphcation of ABC would assist senior executives in ehminating non-value-added
costs.
Eisenhardt (1989) further indicates, for the organization applying HCMPs actively,
that its senior executives wiU be the best decision makers if they first establish a
consensus with employees who have their own accountmg information in the process
of making decisions and then obtain related and useful accounting information from
the management. Consequently, the operating team consisting of elites of the
61
organization will consider other real knowledge and deep insights other than those of
the operating team to institute prompt and useful business strategies.
Ouchi (1980) argues that when there exists circumstances of asymmetrical
information between employees at the basic level and senior executives, roles played
by the operating team or production team in the organizational stmcture as well as the
flexibihty of role actively apphed will be intensified. This study argues that an
organizational stmcture with flexibility can alleviate threats from employees' abmpt
resignations since the stmcture does not demand one to do whatever he/she is told to
do but asks employees to establish a circumspect accounting information net, thus
enabling employees to communicate and cooperate mutually with information
circulation.
The corporate culture of an organization indicates that employees have the same
values towards the operation, investment and financial activities of the organization,
have the same faith towards business tenets and philosophy of the organization, and
abide by the same moral norms (Schein, 1985). Strong corporate culture means that
the same values, philosophy and belief and moral norms accepted or recognized
popularly by employees. Hence, strong corporate culture can alleviate threats
arising out of employees' abrapt resignations since it would be difficult for employees
who have already been famiharized with the corporate culture of the original
organization to transfer to another organization by accommodating themselves to a
different enterprise culture. Employees will show their loyalty naturally when the
corporate cuhure has permeated throughout the corporation.
Arthur (1994) points out that when there exists the asymmetrical information between

62
employees at the basic level and senior executives, a strong corporate culture can help
the organization solve issues concerning asymmetrical information. Ouchi (1980)
also indicates that under circumstances of asymmetrical information, a strong
enterprise culture can substitute for some control systems with unobvious functions.
This study argues that when an organization has a strong corporate culture, personnel
control mechanisms can assist the orgaruzation in solving two issues concerning
employees' abmpt resignation and asymmetrical accounting information. In a word,
when firms with organic stractures and a strong corporate culture adopt shared
govemance, we expect them to be able to create more sustainable competitive
advantages from the strategic HCMPs.
2.3.1.3 Difficulties of empirical analysis
The corporation applying strategic HCMPs requires a management team consisting of
members who are rich in working experiences and professional knowledge to
implement business strategies and achieve the operating goals. The development of
strategic HCMPs includes pmdently recraiting exceUent managerial staff, training
professional and skillful personnel, staging periodical seminars so as to review the
degree of progress and outcome for each task, establishing impartial and reasonable
performance measurement systems to confirm the proper position assigned to proper
employees. The deployment of strategic HCMPs includes setting up smooth and
swift complaint systems for employees' positive expression of their opinions over the
existing management control system as well as providing a vent for them to express
their dissatisfaction, encouraging employees to actively participate in the management
team, focusing on employees' promotion, and adjusting the rate of pay and practising
reward-punishment system according to periodical performance evaluation report,
hi a word, through a positive moderation of the personnel control mechanisms, what

63
strategic HCMPs will bring the fiinction into full play are: bring everyone's ability
into full play; make the best use of everything; and have the goods rapidly distributed
among the consumers.
After actively applying strategic HCMPs, the corporation hopes to develop,
communicate and implement its business strategies through BSC as weU as to help
promote the efficiency in intemal business process and, further, improve the existing
customer relationship so as to improve the financial performance. To achieve those
objectives, three issues are worthy of bringing up for further discussion.
First, in the hght of long-term business strategies and operating goals, the corporation
would actively develop strategic HCMPs to bring a significant improvement for the
financial performance. An active development of strategic HCMPs and an
improvement of financial performance may occur or exist concurrently. For
example, corporations having good financial performance in the past may present a
greater economic capability to bring up lucrative financial conditions to attract
excellent employees than those having poor financial performance in the past, while
the former will be more capable of implementing intensive employee training. In a
word, firms having good financial performance in the past may be more competent to
take measures to actively develop strategic HCMPs than those having poor financial
performance in the past. This would result in greater financial performance.
In view of the effect of development of strategic HCMPs on the corporation's
financial performance, the practical influence of strategic HCMPs practised by firms
with good financial performance in the past seems to have an inchnation to be
overestimated while those with poor financial performance may be underestimated.

64
Of course, firms with poor financial performance in the past may start developing
strategic HCMPs actively to improve the future financial performance. Strategic
HCMPs, however, cannot show concrete resuhs in a short-term span. Such issues
may frequently occur to biotech corporations or computer software firms actively
engaging in R&D, since results of R&D for those firms may show only after
long-term efforts (Widener, 2000).
The second issue concerns the collection of data via a survey questionnaire.
Selection or response bias may influence results because survey respondents generally
self-select into samples. The most common type of selection bias occurs when the
probability of responding to a survey questionnaire is related to the presence of
strategic HCMPs. Survey respondents sometimes refuse to answer those questions
in the light of keeping the business secrets for their corporation. According to
Dillman (2000), the statistical correction of selection bias has hardly ever been
attempted in prior empirical work.
Finally, in order to identify the value of executing strategic HCMPs, the organization
needs to set up an intemal stmcture that is capable of completely bringing strategic
HCMPs into full play. In the process of implementing strategic HCMPs, the intemal
structure must have a controlling (i.e., a pursuit of stability for the intemal business
process) and exploring (i.e., an engagement in the irmovation of the products) impact
on the organization while encountering perilous changes arising out of impact from
unstable environments.
hi other words, the intemal stmcture of the organization executing strategic HCMPs is
hable for a fulfillment of the two missions: standardize intemal business process

65
across an organization to ensure the reliabihty of employee capability (the control
dimension of personnel control mechanisms) and keep the organization approachable
and flexible to creative process improvements (the communication-coordination
dimension of personnel control mechanisms). Standardization of intemal business
processes and flexibility to respond to inventive process improvements help the
organization implementing strategic HCMPs secure the stabihty of employee
capability and an incessant irmovation for the intemal business process.
Under these circumstances, the intemal stmcture of the organization executing
strategic HCMPs must seek a balance between the requishes for control of intemal
business process and flexibility required to respond and become accustomed quickly
to the changing environment. Any act excessively to focus on (or neglect
intentionally) the requisites for control of intemal business process (or flexibility
required to respond to new ideas) will eventually lessen the firm's capability to
overcome the perilous adversity (Douglas and Judge, 2001).
The present study aims at examining the moderated effect of personnel control
mechanisms on HCMPs, and the corresponding change in employee capability.
Considering intemal stmcture of the organization implementing HCMPs, therefore, is
indispensable when evaluating the implementation of HCMPs.
2.3.1.4 The first testable hypothesis
There has been intensive research into the impact of HCMPs on organizational
productivity. Cutcher-Gershenfeld (1991) found that the adoption of transformational
labour relations practices (e.g., emphasizing cooperation and dispute resolution) by
firms would have lower costs, less scrap, higher productivity and a greater return to

66
dhect labour hours than those firms using traditional labour relations practices. Katz
et al. (1985) demonstrated that product quahty and direct labour efficiency increase as
a result of highly effective industrial relations systems (e.g., systems with fewer
grievances and disciplinary actions and lower absenteeism). Bartel (1994) and
Holzer (1987), among others, have highhghted that an increase of productivity growth
arises out of extensive recraiting efforts and the adoption of training programs.
Links between incentive compensation systems and productivity are found
consistently as well.
According to Bass and Avolio (1993), the following several issues are often taken by
the leader of a company as a basis to confirm the significance of his/her subordinates'
status in the company.
(l)Subordinates' responsibility in the success and failure of execution of duties.
(2)Leader's expectation from subordinates' effects prior to execution of duties.
(3)Subordinates' level of accomplishment for execution of the duties assigned.
(4)The highest rewards subordinates can gain by executing the duties assigned by
upper hierarchy.
The present study produces inference, as follows, by integrating views by
Cutcher-Gershenfeld (1991), Bass and Avoho (1993), Arthur (1994), PiUai et al.
(1999) and Douglas and Judge (2001).
The relationship between the leader and his/her subordinates of a company is based
on the phenomenon of mutual benefit and reciprocity as mentioned below: the
reasonable and highest rewards offered to subordinates by the leader in exchange for
their best working effects.

67
Under such a premise, there exists a positive and active mutual benefit between the
leader and his/her subordinates, hi a word, the higher the subordinates' working
effects, the greater benefit for the company that would result in a higher rewards
given to subordinates. Consequently, a subordinate's personal goal in his/her career
tums out to be working hard to pursue a perfect working achievement. That is
exactly what a Chinese proverb says, "Generous rewards rouse one to heroism".
In this study, the first dimension included in personnel control mechanisms aims at
expressing the relationship of mutual benefit and reciprocity between the leader and
subordinates for such a company. In a word, "a personnel control mechanism that
gives supervision, takes material temptation as a base, and approves and gives
rewards according to working achievement" (Cutcher-Gershenfeld, 1991: 244-246)
comes as the underlying spirit of the control factor of personnel control mechanisms.
PiUai et al. (1999) argued that the leader of an excellent company will keep on
encouraging his/her subordinates to promote the working effects to an "over-the-top"
status by all incentives. The present study brings inferences as follows by
integrating views of Bass and Avoho (1993), Arthur (1994) and Douglas and Judge
(2001). The leader of a company incessantly creates a close attachment of "mutual
tmst between the leader and subordinates". Relying on a basis of mutual trast, the
leader will try his/her best to persuade those subordinates to put aside personal
interests and place corporate benefits in the centre. Under such a premise, a
consensus of "pulling together to tide over difficulties" is estabhshed between the
leader and subordinates who give their trast to the upper hierarchy's leadership and
rale. Consequently, the leader wiU develop a smooth communication charmel with
his/her subordinates and conduct frequent communication but wiU often gives simple

directions that his/her subordinates are capable of understanding tacitly to carry out
the leader's intentions.
Furthermore, subordinates would frequently present their opinions and views aiming
directly at the drawbacks in the company's operations together with constractive
advice for reformation, thanks to the mutual trast estabhshed between them and the
leader. On a basis of mutual trast, subordinates gain full authorization. Eventually,
it tums out to be an opportunity for both the leader and subordinates who keep on
reviewing and examining, leaming and growing to intensify and improve their
personal ability. A company can create its business dominions by establishing the
fraternity of "blood is thicker than water", as a Chinese proverb says, between the
leader and subordinates and practising an enterprise cuhure "standing together
through thick and thin".
In this study, the second dimension included in the personnel control mechanisms
mainly expresses the mutual trast and understanding as well as the group spirit of
"pulhng together to tide over difficulties" established between the leader and
subordinates. A moderating factor which is expected to improve and intensify the
relationship between strategic HCMPs and employee capability has been created by a
combination of the communication-coordination factor of personnel control
mechanisms with the control factor of persormel control mechanisms mentioned
above.
Personnel control mechanisms moderating strategic HCMPs involve managing
employee satisfaction, creating firm-specific routines, adopting group incentives and
performance-based compensation, employing shared govemance and include organic
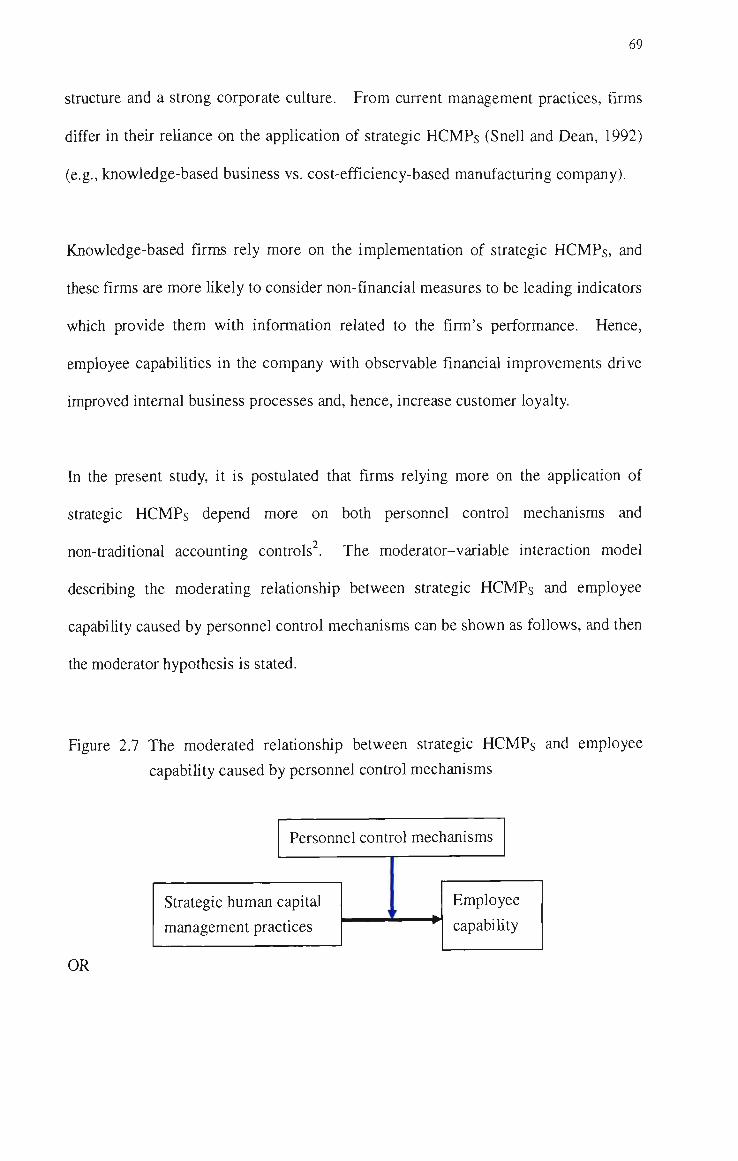
69
stmcture and a strong corporate culture. From current management practices, firms
differ in their rehance on the apphcation of strategic HCMPs (Snell and Dean, 1992)
(e.g., knowledge-based business vs. cost-efficiency-based manufacturing company).
Knowledge-based firms rely more on the implementation of strategic HCMPs, and
these firms are more Hkely to consider non-financial measures to be leading indicators
which provide them with information related to the firm's performance. Hence,
employee capabihties in the company with observable financial improvements drive
improved intemal business processes and, hence, increase customer loyalty.
In the present study, it is postulated that firms relying more on the application of
strategic HCMPs depend more on both personnel control mechanisms and
non-traditional accounting controls^. The moderator-variable interaction model
describing the moderating relationship between strategic HCMPs and employee
capabiHty caused by personnel control mechanisms can be shown as follows, and then
the moderator hypothesis is stated.
Figure 2.7 The moderated relationship between strategic HCMPs and employee
capabiHty caused by personnel control mechanisms
Persormel control mechanisms
Strategic human capital
management prac :tices 1 t
Employee
capabiH ty
OR
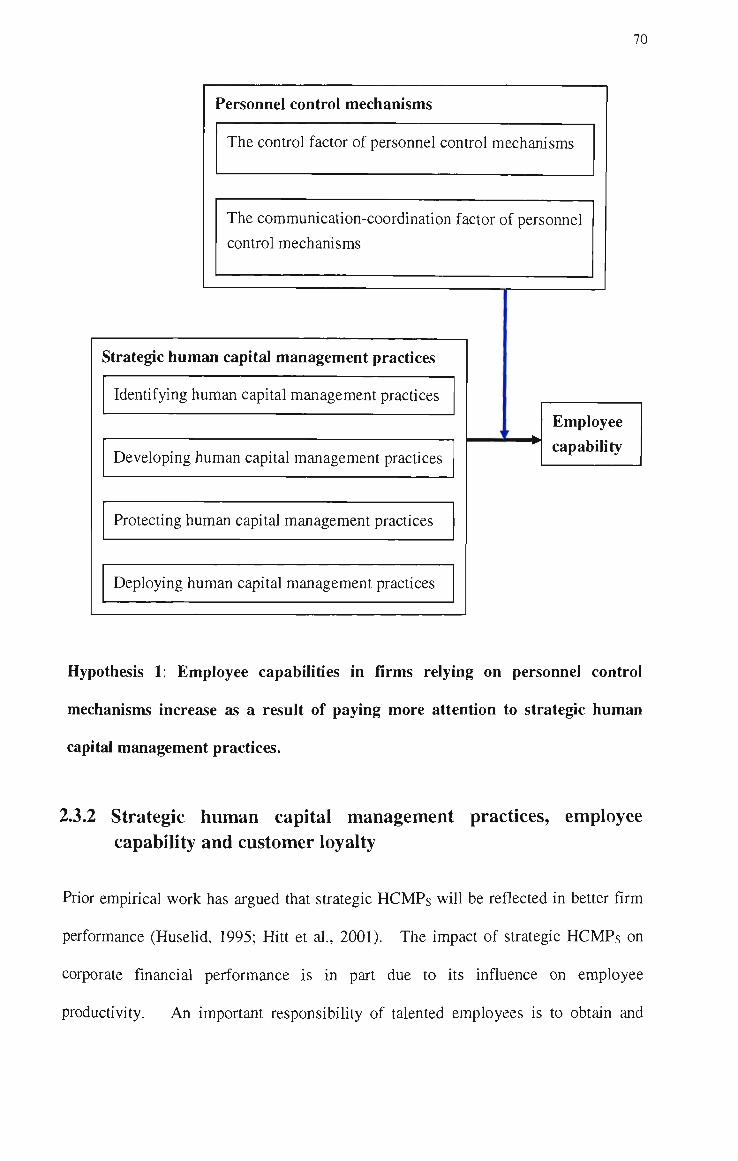
70
Personnel control mechanisms
The control factor of personnel control mechaiusms
The communication-coordination factor of persormel
control mechanisms
Strategic human capital management practices
Identifying human capital management practices
Developing human capital management practices
Protecting human capital management practices
Deploying human capital management practices
Employee capability
Hypothesis 1: Employee capabilities in firms relying on personnel control
mechanisms increase as a result of paying more attention to strategic human
capital management practices.
2.3.2 Strategic human capital management practices, employee capability and customer loyalty
Prior empirical work has argued that strategic HCMPs will be reflected in better firm
performance (Husehd, 1995; Hitt et al., 2001). The impact of stt-ategic HCMPs on
corporate financial performance is in part due to its influence on employee
productivity. An important responsibihty of talented employees is to obtain and

71
maintain customers. Talented employees build relationships with current and
potential customers and, over time, develop social caphal through thek
client-networks. This suggests that employees with inteUectual abihty, articulatory
knowledge, and social contacts bring the most HCMPs to their firms. These HCMPs,
in tum, should produce the highest-quality services to customers and thereby
contribute to firm performance.
Building excellent relationships with current and potential customers through social
capital has three antecedents: perceived quality; perceived value; and the expectations
of clients (Fomell and Wemerfelt, 1987; Jones and Sasser, 1995; FomeU et al., 1996).
"Perceived quality refers to the served market's evaluation of recent consumption
experience, which is expected to have a direct effect on overall customer satisfaction."
(Fomell et al., 1996: 11-15) To operationahze the perceived quality constract, the
present study draws on the marketing literature to delineate two components of
consumption experience: (a) "the degree to which the firm's offering is customized to
meet heterogeneous customer needs"; and (b) "the degree to which the firm's offering
is reliable, standardized and free from deficiencies" (Fomell and Wemerfelt, 1987:
341-342; FomeU et al., 1996: 12-13; Foster and Gupta, 1999: 9-11).
The second antecedent of building excellent relationships with current and potential
customers is perceived value (FomeU et al., 1996). Perceived value refers to the
perceived level of product quality relative to the price paid. In the present study, the
purpose of incorporating the perceived value dimension is to increase the
comparabihty of the results of exploiting strategic HCMPs across firms. It is
72
expected that there is a positive association between the increase in perceived value
and customer loyalty.
The third antecedent of building exceUent relationships with current and potential
customers is the expectations of clients (Fomell et al., 1996). Customer expectations
not only represent the served market's prior consumption experience with the firm's
offering, but also involve a forecast of the firm's ability to deliver quality in the future
(Fomell and Wemerfeh, 1987). In such a case, the customer expectations constract
captures all previous quality experiences and information. Additionally, the
expectations of clients forecast a firm's ability to satisfy its market in future periods
(Fomell et al., 1996). This suggests that there is a positive association between the
expectations of clients and customer loyalty and that diversified firms with good
reputations can gain a sustainable competitive advantage as the reputations are used by
current and potential customers to select firms from which to purchase new services
(Jones and Sasser, 1995; Foster and Gupta, 1999).
Following Hirschman's (1970) exit-voice theory, dissatisfied customers have the
option of going to a competitor or voicing their complaints in an attempt to receive
satisfaction. An increase in overall customer satisfaction should decrease the
incidence of customer complaints, which, in tum, should increase customer loyalty
(Jones and Sasser, 1995; Fomell et al., 1996).
There are two types of customer loyalty: trae long-term loyalty and false loyalty
(Jones and Sasser, 1995). A variety of factors can generate false loyalty: government
regulations that hmit competition; high switching costs such as the cost of changing
hosphals in the middle of treatment; proprietary technology that hmits alternatives;
73
and strong loyahy-promotion programs such as frequent-flier plans (Jones and Sasser,
1995). As Reichheld and Sasser (1990) stated, providing customers with outstanding
value may be a reliable way to achieve sustained customer satisfaction and loyalty.
Additionally, when the relationship between the efficacy of a firm's customer service
and complaint-handling systems of the firm is positive, the imphcation is that the firm
is successful in turning complaining customers into loyal customers (Fomell and
Wemerfeh, 1987; Reichheld and Sasser, 1990). In this study, the value of trae
customer loyalty will be used as a driver for the firm's profitability.
2.3.2.1 Limitations of the prior empirical work
The first limitation of prior empirical work is its widespread conceptual spothght on a
single HCMP and the measurement problems inherent in broadening the focal point to
a system of strategic HCMPs. A focus on an individual practice presents both
theoretical and methodological dilemmas (Arthur, 1994). Firms applying strategic
HCMPs in one area are more likely to use it in other areas as well. Hence, to the
extent that any single example reflects a firm's propensity to invest in strategic
HCMPs, any estimates of the firm-level impact of the particular application of
strategic HCMPs will be upwardly biased. This suggests that attempts to estimate
the impact of a firm's overaU function of strategic HCMPs, as the aggregation of
individual estimates may overstate their contribution to organizational performance.
The second limitation of prior empirical work is the lack of a hnk between customer
satisfaction and loyalty when describing the causahty between employee capability
and customer satisfaction. For management practhioners, different customer
satisfaction levels reflect different issues and, therefore, require different corporate
strategies (Kaplan and Norton, 2001a, b). The levels of satisfaction among targeted

74
customers are a good indicator of the level of quality of the products or services that
they are receiving.
However, the way to move up the level of customer satisfaction from neutral to
satisfied chents or from satisfied to completely satisfied chents is not just a matter of
doing a better job of delivering the same value or experience that the company is
currently conveying. Hence, even though the results of a customer satisfaction
survey are an important indicator of the health of an organization, relying solely on
them can be fatal. Customer satisfaction surveys cannot supply the breadth and
depth of information about customers needed to guide the company's strategy and
product-irmovation process. For this reason, companies must pay more attention to
customer loyalty by utilizing a variety of methods to listen to existing, potential and
former customers.
In short, although a growing empirical literature focuses on the impact of HCMPs on
corporate performance, prior work has been limited in terms of the range of practices
evaluated, the dependent variables and the industry context (e.g., Barney, 1991; Coff,
1997). For example, a discovery that systems of exploiting HCMPs influence
employee productivity does not necessarily mean that these practices have an effect on
corporate profits; and the finding that systems of HCMPs influence organizational
profitability begs the essential issue of the processes through which they have an effect
on financial performance of an organization.
2.3.2.2 The second testable hypothesis
In order to serve customers, as stated earlier, investing in employee capabilities
involves the following activities: comprehensive employee recraitment and selection
75
procedures; incentive compensation and performance measurement systems; extensive
employee participation and training; information systems to support decision making;
motivating and ahgning goals of employees with corporate goals; and empowering
employees to use their knowledge and skills to the benefit of the organization. In the
present study, these activities are hypothesized to improve employee retention and
productivity which, in tum, increase employee capabihties through improving the
knowledge, skiUs and abilities of a firm's current and potential employees, increasing
their motivation, reducing shirking, and enhancing retention of talented employees.
Additionally, the development of employee capability to create valuable ideas for
improving the firm's intemal process and generating significant value to customers
shah be ensured by the retention of productive employees. Hence, skilled and
motivated employees will be a precondition for improving relationships with current
and potential customers and achieving corporate goals. As Sama et al. (1994) state
alignment of goals might be linked to employee capability and customer service
through performance evaluation ,
The HCMPs of an organization should be related to two dimensions of its performance:
first, superior HCMPs increase employees' discretionary effort; and second, reducing
employee tumover and increasing productivity, which, in tum, enhances corporate
financial performance through highlighting customer satisfaction arising out of
investments in superior HCMPs- As stated in the preceding, investing in employee
training and motivating employees lead to an increase in employee job satisfaction
(Heskett et al, 1994). A prior participation in required on-the-job training courses
and work-based development activhy is correlated with overaU job satisfaction (Birdi
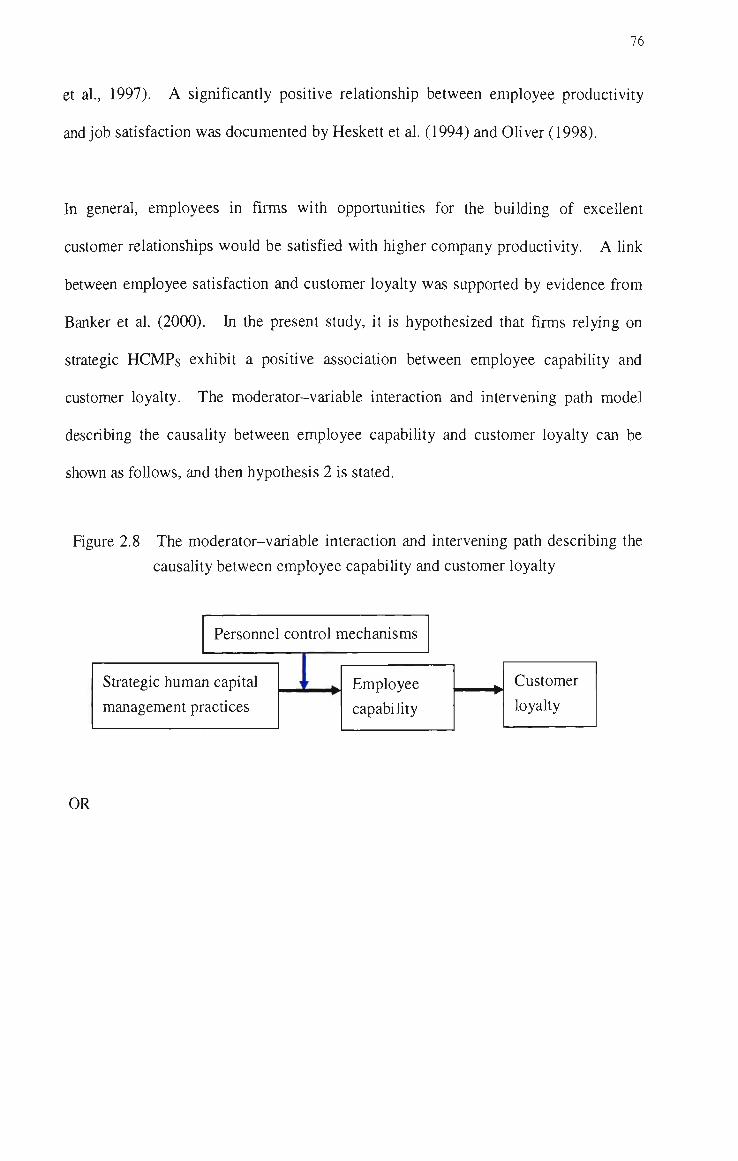
76
et al., 1997). A significantiy positive relationship between employee productivity
and job satisfaction was documented by Heskett et al. (1994) and Ohver (1998).
In general, employees in firms with opportunities for the building of excellent
customer relationships would be satisfied with higher company productivity. A Hnk
between employee satisfaction and customer loyalty was supported by evidence from
Banker et al. (2000). In the present study, it is hypothesized that firms relying on
strategic HCMPs exhibit a positive association between employee capabiHty and
customer loyalty. The moderator-variable interaction and intervening path model
describing the causality between employee capabiHty and customer loyalty can be
shown as foUows, and then hypothesis 2 is stated.
Figure 2.8 The moderator-variable interaction and intervening path describing the
causality between employee capabiHty and customer loyalty
Persormel control mechanisms
Strategic human capital
management pr actices
1 ' Employee
capabiHty
Customer
loyalty
OR
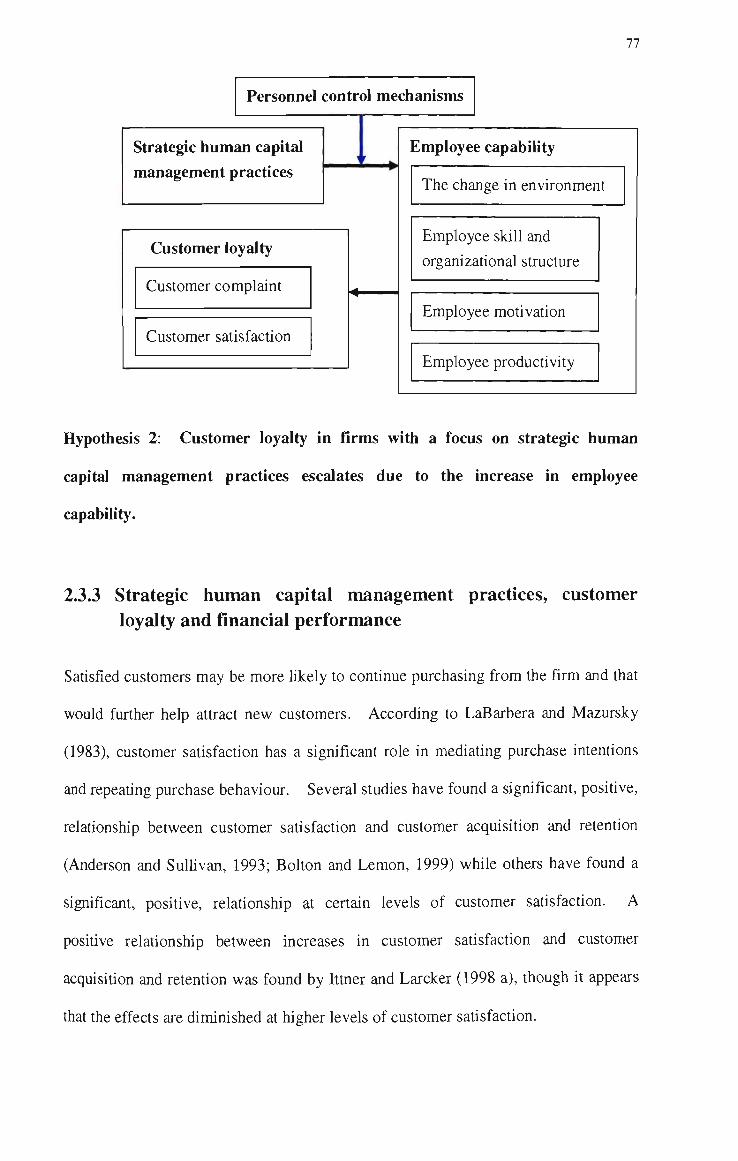
77
Personnel control mechanisms
Strategic human capital management practices
Customer loyalty
Customer complaint
Customer satisfaction
Employee capability
The change in environment
Employee skill and
organizational stmcture
Employee motivation
Employee productivity
Hypothesis 2: Customer loyalty in firms with a focus on strategic human
capital management practices escalates due to the increase in employee
capability.
2.3.3 Strategic human capital management practices, customer loyalty and financial performance
Satisfied customers may be more Hkely to continue purchasing from the firm and that
would further help attract new customers. According to LaBarbera and Mazursky
(1983), customer satisfaction has a significant role in mediating purchase intentions
and repeating purchase behaviour. Several studies have found a significant, positive,
relationship between customer satisfaction and customer acquisition and retention
(Anderson and SulHvan, 1993; Bolton and Lemon, 1999) while others have found a
significant, positive, relationship at certain levels of customer satisfaction. A
positive relationship between increases in customer satisfaction and customer
acquisition and retention was found by Ittner and Larcker (1998 a), though it appears
that the effects are diminished at higher levels of customer satisfaction.

78
Customer satisfaction has been empirically linked with customer profitabihty, market
share and firm performance. According to Fomell (1995), the association between
customer satisfaction and market share is not positive, and sometimes negative, in
cross-sectional analysis. Evidence by Foster and Gupta (1999) indicated that
indiscriminate customer service leads to serving some customers unprofitably.
However, many other studies document a positive relationship between customer
satisfaction and firm performance (e.g., Boracki and Burke, 1999). Ittner and
Larcker (1996) found that there exists a positive correlation between perceived
service quality and financial measures. Boracki and Burke (1999) also showed that
customer service is predictive of financial performance.
For managers and investors, a firm's past and current performance as well as its future
financial health can be measured by a customer satisfaction index (e.g., ACSI).
According to Anderson et al. (1997), higher customer satisfaction increases loyahy,
reduces price elasticity, insulates current market share from competitors, lowers
transaction costs, reduces failure costs and the costs of attracting new customers and
helps to build a firm's reputation in the market. As such, a leading indicator is
provided by a customer satisfaction index for the firm's future financial heahh.
Moreover, a customer satisfaction index has implications for managers to formulate
competitive strategy, while it can be useful in analysing the strengths and weaknesses
of the firm or its competitors. In addition, it provides a measure of the effectiveness
with which a firm is defending current customers; firms with declirung overaU
customer satisfaction are particularly vulnerable and provide expansion opportunities
for more competent organizations.
79
For customers, on the other hand, a customer satisfaction index provides buyers with
information not found in ad hoc methodologies employed in product ratings by
popular magazines and commercial market research (Anderson et al., 1997). For
example, very poor service or products are not the only source of high customer
dissatisfaction. Often, the company has attracted the wrong customers or has an
inadequate process for turning around the right customers when they have a bad
experience. Having the wrong customers is the resuh of a flawed process for
obtaining customers (Jones and Sasser, 1995). The retention of difficult-to-serve
and chronicaUy unhappy customers imposes some costs. For example, general
management costs, incurred owing to making an expensive long-term marketing
strategy and leveraging human capital. Furthermore, such customers impair the
morale of front-line employees by overwork and disparage the company and detract
from performance by continuaUy utilizing a disproportionate amount of the
company's resources.
Customer satisfaction information can be a critical barometer to show how well a
company is serving its customers. According to conventional wisdom (Jones and
Sasser, 1995), the hnk between customer satisfaction and customer loyalty in the
market is a simple, linear relationship: as satisfaction goes up, so does loyalty.
However, Anderson et al. (1997) found that the relationship is neither hnear nor
simple. In intensively competitive markets, they discovered a great difference
between the loyalty of merely satisfied and completely satisfied customers. As it is
not hmited to markets for manufactured products, this phenomenon also occurs in
services. According to Jones and Sasser (1995: 94-95), "customer loyahy is the
feehng of attachment to or affection for a company's people, products or services".
These feehngs manifest themselves in many forms of customer behaviour.
80
According to Anderson et al. (1997), the measurement of customer loyalty involves
the following dimensions: (a) intent to purchase; (b) primary behaviour; (c) secondary
behaviour.
In the customer relationship, intent to purchase can be measured at any time while it
actuaUy is a strong indicator of future behaviour (Anderson et al., 1997). Although
this measure will generally overstate the probability of repurchase, the degree of
exaggeration is fairly consistent (Bolton and Lemon, 1999). This suggests that
customer future intentions can be predicted accurately.
Primary behaviour is the second dimension of the measurement of customer loyalty.
The following five categories can measure customers' actual repurchasing behaviour:
recency; frequency; amount; retention; and longevity (Anderson et al., 1997).
The third determinant of customer loyalty is secondary behaviour. Customer
referrals, endorsements, and spreading the word are important forms of customer
behaviour for a company (Anderson et al., 1997). In most product and service
categories, one of the most important factors in acquiring new customers is word of
mouth.
2.3.3.1 Limitations of the prior empirical work
The conceptual focus on a single dimension of strategic HCMPs and the measurement
problems inherent in broadening the focus to a system of such a practice are the
hmitations of prior empirical work (e.g., Arthur, 1994; Coff, 1997). ft is more hkely
for firms applying strategic HCMPs in one area to exercise them in other areas as well.
Primarily because of Porter's best-selhng books (Porter, 1985), for example, some

81
western companies beheve that it is not effective to pursue the two different business
strategies of cost leadership and product differentiation simultaneously. However,
many Japanese companies including Toyota, Nissan, Matsushita and Sony are seen as
both cost leaders and product differentiators, while those companies are all cost
conscious companies but, at the same time, they are pursuing differentiation strategies
of products. From the perspective of Porter's framework, this is a poor strategy
that potentially leads to inconsistent decisions.
From current management accounting practices, however, no company can
successfuUy be a major player in the market without cost competitiveness (Kaplan
and Norton, 1996c). In addition, today's consumers buy products not just because
they are bargains as they might carefully examine functions, appearance, usabihty and
many other factors prior to making decision to buy. Lowering costs by trimming
functions is unlikely to fool consumers. In view of this reason, to the extent that any
single example reflects a firm's propensity to invest in strategic HCMPs, any
estimates of the firm-level impact of the particular practice will be upwardly biased
(Arthur, 1994).
This probable bias presents a limitation for a line of research that attempts to estimate
the firm-level impact of the function of a firm's entire strategic human capital on the
firm's performance, as the sum of these individual estimates may overstate their
contribution to the financial performance of an organization. This suggests that
companies applying strategic HCMPs should focus on the alignment of progressive
management practices with the firms' competitive strategy.

82
2.3.3.2 The third testable hypothesis
As stated earlier, employee capabilities drive intemal process improvements of an
organization via activity-based costing (ABC) system as a tool for employees to
enhance relationships with customers and increase sales revenue growth.
According to Ohver (1998), there is an association between employee satisfaction and
firm performance. ABC focuses attention on activities and resources that are under
the control of several employees. Several researchers have suggested that ABC
implementation failures may result from failure to consider a simultaneous redesign
of incentive stractures that require coordinated efforts (Anderson and Young, 1999).
The connection between ABC and incentive stractures may be illuminated by recent
developments, such as team-based production, process-reengineering and cell
manufacturing. These practices are consistent with a redistribution of decision rights
and an increase in decentrahzed, individual decision-making throughout the
organization. For example, cell members can decide among themselves the order of
production, the assignment of tasks and the timing of production by relying on
team-based cell manufacturing which, in tum, can significantly affect firm efficiency
and profitability.
In the present study, it is hypothesized that intemal process improvement of an
organization is motivated by employee capabilities of firms relying more on the use of
strategic HCMPs, that is related to providing higher customer value and enhancing
observable financial performance. The moderator-variable interaction and
intervening path model describing the causalities among employee capabihty,
customer loyalty and financial performance of the organization implementing
strategic HCMPs can be shown as foUows, and then hypothesis 3 is stated.
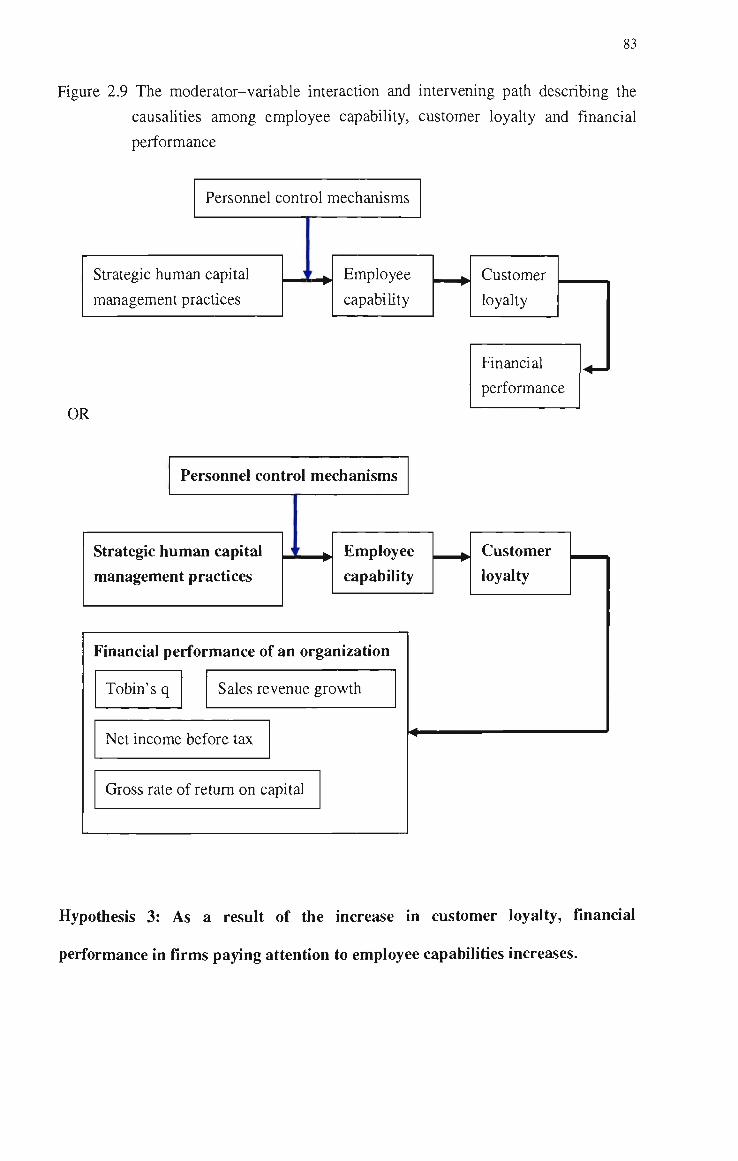
83
Figure 2.9 The moderator-variable interaction and intervening path describing the
causaHties among employee capability, customer loyalty and financial
performance
Persormel control mechanisms
Strategic human capital
management practices
OR
Employee
capabihty
Customer
loyalty
Financial
performance
Personnel control mechanisms
Strategic human capital management practices
Employee capability
Financial performance of an organization
Tobin's q Sales revenue growth
Net income before tax
Gross rate of return on capital
Customer
loyalty
Hypothesis 3: As a result of the increase in customer loyalty, financial
performance in firms paying attention to employee capabilities increases.
84
2.3.4 The strategic use of human capital management practices and
financial performance
Links between individual HCMP and corporate financial performance have been
explored by a number of authors. According to Terpstra and Rozell (1993), for
example, there exists a significant and positive hnk between the extent of recraiting,
selection test validation and the use of formal selection procedures and corporate
profits. RusseU et al. (1985) demonstrated a link between the adoption of employee
training programs and financial performance of an organization. Linking
performance appraisals and compensation has also been consistently connected with
increased firm profitabihty (Borman, 1991; Gerhart and MiUcovich, 1992).
Corporate performance can be enhanced by the way in which firms use strategic
HCMPs in the development and implementation of their strategies. By effectively
applying strategic HCMPs, firms can achieve economies of scope from diversification.
In particular, knowledge-based resources in professional service firms, e.g., law firms
and audit firms, are often applied directly to serve clients (Johnson, 1996). Firms are
allowed to add value to incoming factors of production by relying on intangible
firm-specific resources. As stated earlier, firms' outcomes may be affected by the
attributes of human capital, e.g., education, experience, and skills, and, in particular,
the characteristics of top managers.
Firm-specific resources, e.g., HCMPs, are often embedded in individual skiUs and
collaborative working relationships within the firm (Szulanski, 1996). These
resources, however, must be integrated and managed to create competitive advantages.
For example, the human capital embodied in the partners is a professional service
firm's most important resource. Partners' experiences build often tacit but valuable
85
firm-specific knowledge, while such tach knowledge is always unique and difficuh to
imitate. Partners' knowledge of current markets and chents can be leveraged to offer
new services. In such a case, the new bundle of services may aUow the creative use
of strategic HCMPs. This has a higher probability of creating sustainable
competitive advantages than articulable knowledge without the use of strategic
HCMPs (Lane and Lubatkin, 1998; Hitt et al., 2001).
The use of strategic HCMPs may also help firms capture the benefits of information
asymmetries for customers (Snell, 1992). Employees with prestigious credentials
contribute to a firm's positive reputation. Because of the information asymmetries
experienced by chents, a positive reputation can help professional service firms build
a competitive advantage. Potential customers use proxies to predict the potential
quality of a firm's services that they are likely to receive, since the actual quality
cannot be known until the services are rendered. Besides, clients may consume new
services on the basis of trast and satisfaction with prior services provided by the firm
when they have strong positive relationships with the firm's employees, e.g., partners
of law firms or audit firms.
Snell and Dean (1992) further highlight the fact that an organization can provide
valuable services to its chents through continuous investments in valuable tacit
knowledge, e.g., intellectual capabilities and social capital. Such valuable services
attract premium prices as well as more customers. In addhion, Hht et al. (2001)
found that leveraging human capital has a positive effect on organizational
performance, but the interaction between leverage and human capital exhibits no
effect on firm performance.

86
In general, leveraging human capital creates efficiencies and helps build tacit
knowledge in an organization, but it also imposes some costs. For example,
monitoring is increased to ensure quality outcomes. Incurred by assigning tasks,
coordinating activities and evaluating employees, general management costs increase
with leveraging human capital. Besides, professional hubris sometimes prevents
effective monitoring and leveraging human capital. Also, it may be difficult to
leverage certain types of human capital, such as specific social relationships. This
relationship suggests important implications for managers. Although exploiting
and applying human capital and leveraging it generally create positive effects on
organizational performance, managers must recognize that they have costs as well and
ehher reduce those costs or ensure that the value gained from the use of strategic
HCMPs more than offsets the costs incurred.
The purpose of using strategic HCMPs is to help minimize performance problems of
an organization (Spicer and Ballew, 1983; SneU, 1992). Strategic HCMPs not only
seek to find employees with knowledge, skills, abilities, values and motives that are
valuable, rare and inimitable, but also minimize opportunistic behaviour.
Supporting decision-making, motivating the alignment of goals of employees with
corporate goals and empowering employees to use their knowledge and skills to the
benefit of the organization are the resuh of the investment in strategic HCMPs.
These activities are supposed to increase job satisfaction, which, in tum, increases
employee productivity (Barney, 1991). Hence, the development of firm profitabihty
may be ensured through the retention of productive employees.

87
2.3.4.1 Limitations of the prior empirical work
As stated earher, non-financial performance measures such as job satisfaction,
employee retention, product quality, customer complaint, customer loyahy and market
share are now used by many firms to evaluate, motivate, compensate and reward
managerial performance. So far, however, there have been few studies on the
association between non-financial performance indicators and financial performance
of an organization, and the evidence provided by prior empirical work has been mixed
(e.g., Ittner and Larcker, 1998a; Behn and Riley, 1999).
Moreover, even though there have been calls for greater emphasis on non-financial
measures in intemal performance measurement systems associated with the format of
the BSC while many firms have implemented such systems, there is no evidence on
the impact of including non-financial measures in performance appraisal and
incentive compensation. In addition, despite an increasing use of non-financial
measures in managerial compensation, there is little evidence of the performance
impact of including non-financial measures in incentive compensation plans in prior
empirical work (e.g.. Banker et al., 2000). Besides, none of the survey investigations
in prior empirical studies report the explicit use of non-financial measures in
managerial compensation (e.g.. Stivers et al, 1998).
Strategic HCMPs of an organization should be related to two dimensions of its fit:
first, intemal fit among dimensions of strategic HCMPs could be expected to take the
form of complementarity; and second, extemal fit between a firm's competitive
strategy and its management system of human resources. AddhionaUy, if a firm's
competitive strategy and its organizational stmcture have been aligned, based on an
extemal performance criterion, fit has been achieved. In spite of prior empirical

work (e.g., Coff, 1997) arguing that improved intemal and extemal fit of strategic
HCMPs wiU augment financial performance of an organization, the relevant research
has not specified the functional form that intemal or extemal fit can be expected to
take. For example, the relationship between a firm's competitive strategy and its
performance could co-vary with the type of environment in which it operates.
2.3.4.2 The fourth testable hypothesis
As stated earlier, employee training has been empirically linked to a number of
measures of the BSC. A positive association between skiU development, training
and employee retention has been documented by researchers (Whitaker, 1999; Wah,
1998). Employee training has also been linked to innovation, process improvements
and customer service quality (Hurley and Huh, 1998; Lynch and Black, 1998). In
addition, employee training has been empirically connected to post-sale service
quahty (Lewis and Gabrielsen, 1998). Certainly, chent acceptance of new services
can be attributed to a talented employee's experience and social capital developed
over time (Kaplan and Norton, 2001a, b). Hht et al. (2001) states that strategic
HCMPs can be useful in implementing service diversification, while employees'
social capital and experiential knowledge can be helpful in performing geographic
diversification. The relationships with clients can be advantageous to entering new
geographic markets. Firms can obtain new clients in the new market through their
employees' relationships with existing clients.
hi the present study, it is hypothesized that productive employees of firms relying
more on strategic HCMPs may increase the magnitude of innovative activity, the level
of customer service and, hence, the degree of financial performance. The
moderator-variable interaction and intervening path model describing the direct
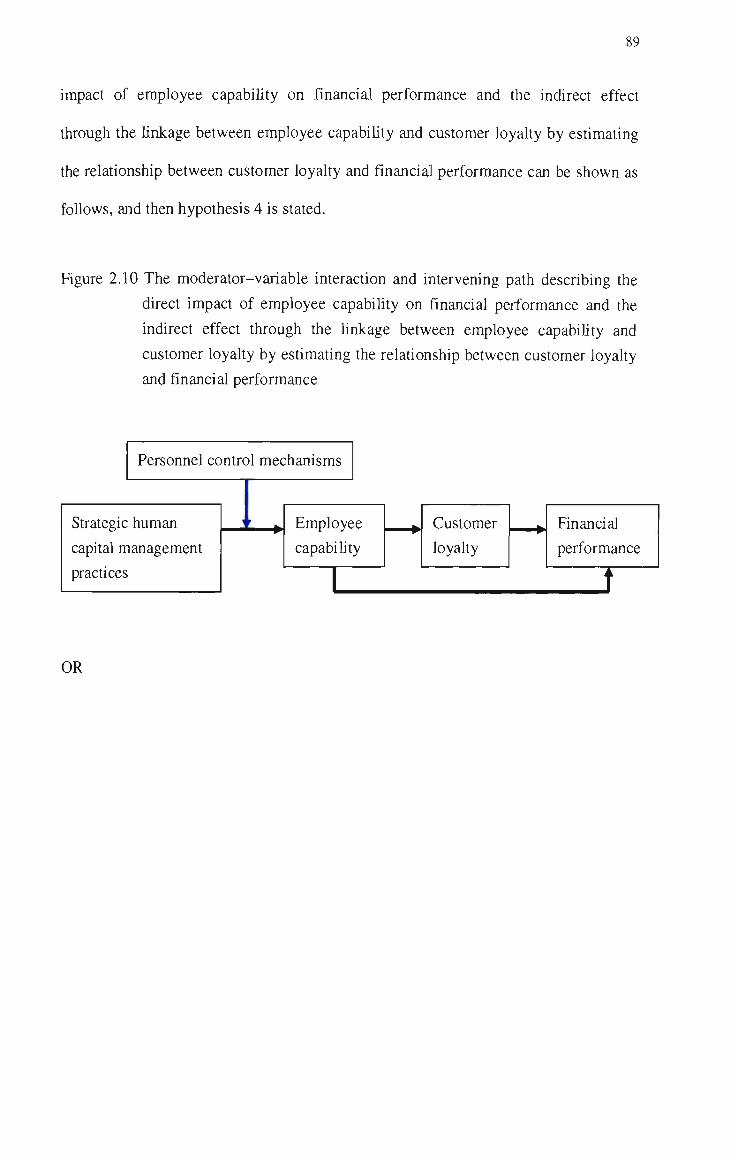
89
impact of employee capabiHty on financial performance and the indirect effect
through the Hnkage between employee capabihty and customer loyalty by estimating
the relationship between customer loyalty and financial performance can be shown as
foUows, and then hypothesis 4 is stated.
Figure 2.10 The moderator-variable interaction and intervening path describing the
direct impact of employee capabihty on financial performance and the
indirect effect through the linkage between employee capabiHty and
customer loyahy by estimating the relationship between customer loyalty
and financial performance
Personnel control mechanisms
Strategic human
capital management
practices
1 ' ^ Employee
capabiHty
1
Customer
loyalty
Financial
performance
t
OR

90
Personnel control mechanisms
The control factor of personnel control mecharusms
The communication-coordination factor of personnel control mechanisms
Strategic human capital management practices
Identifying human capital
management practices
Developing human capital
management practices
Protecting human capital
management practices
Deploying human capital
management practices
Employee capability
The change in
environment
Employee skill
and organizational
stmcture
Employee
motivation
Employee
productivity
Customer loyalty
Customer complaint Customer satisfaction
Financial performance of an organization
Tobin's q"* Gross rate of retum on capital
Sales revenue growth Net income before tax

91
Hypothesis 4: Financial performance in firms focusing on strategic human
capital management practices increases as a result of the increase in employee
capability.
Notes
/. As to measures of financial performance, investments in HCMPs are regarded as
period expenses on profit-and-loss statement (Johnson, 1992) according to
traditional views.
2. Personnel control is expected to bring an effect to managerial performance of the
organization in a highly uncertain setting (Abemethy and Brownell, 1997).
3. The associations between empowerment and employee productivity were shown by
Koberg et al. (1999) by studying a sample set of hospital employees. Hanline and
Ferrell (1996) provided the linkage between empowerment and customer service
quality.
4. When the model was developed, Tobin's Q was included as a potential
measurement because of its popularity in the literature. However, during the
data-gathering process it was discovered that the measurement is not used by the
respondents.

92
Chapter 3 Research design
3.1 Introduction
After having developed a set of causal relationships with interrelated dependent
dimensions regarding the components of strategic human capital management
practices (HCMPs) and the combination of financial and non-financial performance
measurement associated with the format of the balanced seorecard (BSC), the path
diagram portrayed in this chapter, including the dimensions measuring each constract,
provides the basis for specification of the stractural equations and the proposed
correlation between exogenous constracts, and between stractural equations.
The methodology used in the present study is composed of surveys, field interviews
(in-depth visits) and statistical methods. Detection of variable relationships is used
to produce descriptive and explanatory knowledge of an existing reality. These
types of knowledge are evaluated in terms of intemal and extemal validity, reliabihty
and accuracy.
This chapter comprises eight sections with: section 1 concerning the conceptual
framework and justification for survey-based research method; section 2, definition of
variables and measuring methods; section 3, a description of measuring tools and the
selection of subjects; section 4, an introduction of analytic methods for data used in
this study; section 5, validation of the factor analysis for items stracture of the
questionnaire; section 6, the reliability analysis for dimensions of four
muhi-dimensional constracts; section 7, the discriminative validhy analysis for
dimensions of the questionnaire; and section 8, research hmitations of the present
study.

93
3.2 Framework of the research and justification for survey-based research method
3.2.1 The conceptual framework of the research
This research mainly explores how strategic HCMPs motivate employee capabiHty
and improve customer loyahy which could promote the company's financial
performance in the manufacturing industry (e.g., electronics, computer, constraction)
and the service industry (e.g., insurance, foodservice, tour) in a competitive working
environment. The second aim is to examine the issue of whether a personnel control
mechanism has a moderating effect on the relationship between strategic HCMPs and
development of employee capabihty. The path diagram of the conceptual framework
can be illustrated as follows:
Figure 3.1 The path diagram of the conceptual framework
Strategic human capital management practices
UDEN DEVE PROT
1 '
Employee capability
TCIE ESAOS
' '
Customer loyalty
CC c :s
EM
DEPL
Personnel centre
CONT
EP
Company's
Tobin's q
>1 mechanis
COMM
ms
1
financial [
SRG
)eri
'
^ormanc
NIBT
;e
GRROC
Note: you will find the definition of each dimension of aU multi-dimensional
constmcts mentioned above in Appendix 5.

94
As noted in Chapter 2, four testable hypotheses were inferred by means of theoretical
development of the conceptual framework. They are summarized briefly as foUows.
Hypothesis 1: Employee capabihties in firms relying on personnel control
mechanisms increase as a resuh of paying more attention to strategic human capital
management practices.
Hypothesis 2: Customer loyalty in firms with a focus on strategic human capital
management practices escalates on account of the increase in employee capabihty.
Hypothesis 3: As a result of the increase in customer loyalty, financial performance in
firms paying attention to employee capabilities increases.
Hypothesis 4: Financial performance in firms focusing on strategic human capital
management practices increases in consequence of the increase in employee
capability.
According to the above-mentioned path diagram of the conceptual framework, in the
present study a series of stractural equations, described in Appendix 4, is developed to
constitute the stractural equation model wherein dimensions are assigned to each
constract. The stractural equation model provides this study with a means of giving
meaning to the constracts as well as specifying the correspondence of dimensions to
constracts. The dimensions measured by observable indicators thus reflect the
constracts described in later sections and in the foUowing chapters.

95
3.2.2 Justification for survey-based research method
Yin (1984) suggests that question types "how" and "why" are more appropriate to the
case study methodology while "who", "what" and "to what extent" ones are
appropriate to surveys. Furthermore, survey-based methods are the preferred
research tool when the investigator has little control over behavioral events and when
the focus is on a contemporary phenomenon within some real-hfe context. The
nature of the research questions mentioned in this study, for example, what have been
the outcomes from applying strategic HCMPs, are appropriate to the survey-based
study. A survey can be readily designed for the question type "what". Similarly,
the survey-based research method is hkely to find support from question types "who"
and "where" or their derivatives. For example, one of the research goals of the
present study is to describe the articulation of the links between non-financial
measures of performance such as employee motivation and customer complaint and
financial ones such as sales revenue growth, net income before tax, and gross rate of
retum on capital. Additionally, the present study makes investigation into issues
concerning "who" has participated in applying strategic HCMPs-
The survey-based research method is the most efficient way to discover information
of that type. Correspondingly, the present study aims at exploring "what" the
outcomes of strategic HCMPs have been. Depending on the type of management
practices, this sort of question can be answered by doing a survey or examining the
accounting data. Finally, consider such questions as follows. "How many"
customers did strategic HCMPs serve? "What" kinds of financial performance were
received? Both of these would be more readily answered through a survey-based
research design.

96
The apphcation of strategic HCMPs and the integration of financial measures of
performance with non-financial ones on the basis of BSC are viewed as playing an
active role intertwined amongst those competing firms in the market place. The
survey-based research design used in the present study does not manipulate any of the
variables of interest while data relating to all variables are collected simultaneously.
For example, in this study the researcher is neither able to make some customers
committed to purchasing and others less committed nor is he capable of observing the
effects on customer loyalty, hi addition, some variables, such as employee
motivation, are not capable of manipulation. In this study, the tailored design of
survey-based research method focuses on the incentive design that creates respondent
trast and incentives by bringing the awareness of increased compensations and
reduced costs of being a respondent into existence^ (Dillman, 2000). High intemal
rehability (i.e., Cronbach's alpha) and inter-constract correlation will be two key
points.
3.3 DeHnition of variables and measuring methods
3.3.1 Strategic human capital management practice
3.3.1.1 Operational definition
Performance differences across firms can be attributed to the variance in the firms'
resources and capabilities (Grant, 1991; Coff, 1997; Hitt et al., 2001). Firm
resources were defined as "stocks of available factors that are owned or controUed by
the firm" (Amit and Schoemaker, 1993: 35). Barney (1991: 101) suggested that
"firm resources include all assets, capabihties, organizational processes, firm
attributes, information, knowledge, etc. controlled by a firm that enable the firm to
conceive of and implement strategies". Firm resources can provide the basis for
firms' competitive advantages by using a wide range of managerial practices.

97
SneU and Dean (1992) also argued that firm resources form the basis of firm strategies
and are critical in the implementation of those strategies. The resource-based view
of organizational strategy argued that firms take hold of and have control over unique
strategic resources. These unique physical, human or organizational resources
provide the firm with the basis for sustained competitive advantage (Barney, 1991).
On the other hand, firm capabilities were defined as "powers available for deploying
firm resources" (Amit and Schoemaker, 1993: 35). In this study, firm capabilities
are based on identifying, developing, protecting, and deploying human capital
management practices through complex interactions among firm resources and
competitive strategies.
Managerial practices concerning human capital are frequently underatilized because
the uncertainty about the economic, industry, regulatory, social and technological
environments (Amit and Schoemaker, 1993; Abemethy and Brownell, 1997),
compethors' behaviour (Widener, 2000), and customers' preferences (Tichy et al,
1982). Husehd (1995: 637) found that "human resource management practices
influence employee skills and motivation through the acquisition and development of
a firm's human caphal". Therefore, complex interactions among compethors,
customers, suppliers, regulators, and stakeholders determine the development and
deployment of strategic human capital management practices.
Earher studies (e.g., Barney, 1991; Amit and Schoemaker, 1993) identify six
dimensions to be measured to ensure constract validity of strategic human caphal
management practices (i.e., value, rareness, inimitability, uncertainty, complexity, and
competitiveness). In this study, four dimensions are identified (i.e., identification,
development, protection, and deployment). Even though in the present study the

98
variable factors of each dimension have been based on the review of prior empirical
works, part of them have evolved through a synthesis by this researcher. In addition,
since the present study has a large number of variable factors relative to the size of the
sample, and the underlying stracture of several measures is not clearly established,
exploratory factor analysis (EFA) is conducted to discover valid variable factors for
each dimension and further reveal that the above-mentioned four dimensions which
must be constracted as separate latent independent variables do load the constract,
strategic human capital management practices.
3.3.1.2 Measuring methods
Human resources must be a source of competitive advantage and a valuable one in
order for a firm to use HCMPs strategically. Strategic HCMPs must be rare because
if the resource is abundant firms will not be able to sustain their competitive
advantage. Further, strategic HCMPs must be valuable to enable a firm to conceive
of or implement strategies that consequently improve its efficiency and effectiveness
(Bamey, 1991). As noted above, the first dimension of strategic HCMPs focuses on
identifying strategic human resources, ft is measured by using a set of questions
related to the firm's behefs with respect to the importance of strategic human
resources and on whether strategic human resources are a key to achieve competitive
advantage (e.g., Q18, Q19, Q22, Q27, Q30 and Q35 described in Appendix 1).
To develop strategic human resources is the second dimension of strategic HCMPs.
This dimension consists of resource specifichy and the diffuseness of strategic human
resources. Resource specificity is associated with strategic human resources on the
grounds that competitive advantage will be short-lived if competitors can easily
mimic or reproduce the resource (Grant, 1991; Amit and Schoemaker, 1993). Next,

99
it would be difficult for competitors to repeat the effort provided by the strategic
HCMPs because there is little clarity surrounding the effort. As these strategic
factors of HCMPs are associated with costs of information asymmetry and
opportunism (Coff, 1997; Widener, 2000), the diffuseness of the strategic human
resources determines the base over which the design and implementation costs of the
management control system are spread. Under the ch-cumstances, the second
dimension of strategic HCMPs is measured by applying a set of questions related to
one issue about "how common the human capital is among competitors" (e.g., Q20,
Q21, Q23, Q24, Q28, Q29 and Q42 described in Appendix 1).
To protect strategic human resources is the third dimension of strategic HCMPs.
Whether HCMPs help the firm to be more efficient and effective depends on the
specifichy of strategic human resource (Bamey, 1991; Amit and Schoemaker, 1993).
The specificity of strategic human resource is based on whether the employees' duties
are repetitious and tasks are standardized and how difficult it is to monitor and
evaluate employees' effort (Coff, 1997). Impartial measurement of performance,
reasonable working remuneration, a rigorous training plan and an even chance for
employee's promotion are significant premises to bring HCMPs into full play.
Questions related to whether strategic human resources help the firm to be more
profitable can measure the third dimension of strategic HCMPs (e.g., Q25, Q26, Q34,
Q36, Q37, Q38, Q39, Q40 and Q44 described in Appendix 1).
The spread of knowledge and skills throughout the firm, a behef that aU employees
contribute to the firm's success, and all employees know how their jobs relate to the
firm's goals take shape the source for sustained competitive advantage of an
organization (Bamey, 1991). Strategic factors of HCMPs such as job eruichment
100
interventions, formal information sharing, labour-management participation, reahstic
job previews and grievance procedures have effects on the level of employee
capabihty (Amit and Schoemaker, 1993; Coff, 1997), aU of which, in tum, form the
basis for sustained competitive advantage of an organization. As was mentioned
above, to deploy strategic human resource comes last as the fourth dimension of
strategic HCMPs. It is measured by an application of a set of questions related to the
behef that all employees contribute to the firm's achievement and all employees know
how their jobs relate to the firm's objective (e.g., Q31, Q32, Q33, Q41 and Q43
described in Appendix 1).
Regarding the four dimensions of strategic HCMPs, some questions in Appendix 1 are
based on the review of prior empirical works and some are evolved through a
self-revision by this researcher AU the sources regarding variable factors are
described in Table 3.1.

101
Table 3.1 The source of variable factors of four dimensions of strategic HCMPs
Variable factors
Q18-a, b, d and g; Q19-b, d, e and f; Q22-a and c
Q18-C and e; Q19-c; Q30; Q31-b and c; Q33-C and e
Q18-f;Q28-c;Q43-a
Q19-a; Q20; Q21; Q22-b; Q43-e
Q23; Q27; Q28-a and b; Q29; Q31-a and d
Q24; Q25; Q26; Q33-a
Q33-b, d; Q34; Q35; Q37; Q38; Q 40; Q41
Q43-b and c; Q44-a, b, d, e, f, h, i, j and k
Q32-a, b, c, d and e; Q36; Q39; Q42; Q43-d and f
Q44-C, g and 1
Sources
Tichy et al. (1982)
Bamey (1991)
Amit and Schoemaker (1993)
Grant (1991)
This research
Coff (1997)
This research
This research
SneU and Dean (1992)
Bamey (1991)
3.3.2 Personnel control mechanisms
3.3.2.1 Operational definition
Snell (1992) suggested that human resource management control intending to help
prevent performance problems regulates the antecedent conditions of firm
performance, i.e., employees' knowledge, skills, abihties, values and motives.
However, the implementation of a rehable and effective human resource management
control needs to involve finding individuals with specific characteristics (e.g., values),
thus minimizing opportunistic behaviour (e.g., shirking) and, in tum, reducing

102
transaction costs arising from opportunism. This study views the combination of
human resource management control with intemal corporate strategy communication
as a situational moderator variable that helps explain the relationship between
strategic human capital management practices and employee capabilities. This study
does not refute the behavioural perspective of human resource theory. It extends
SneU (1992) in two ways. First, whereas Snell (1992) examined the intervening
relationship between organizational strategy and human resource management control
caused by administrative information, this study examines the moderating
relationships between strategic human capital management practices and employee
capabilities caused by human resource management control and intemal corporate
strategy communication. Second, this study simultaneously examines how human
resource management control and intemal corporate strategy communication intensify
strategic human capital management practices, whereas Snell (1992) focused on
observing human resource management control and studying how human resource
management practices depend on the characteristics of organizational strategy and
admirustrative information.
In order to link the balanced seorecard to human resource management, this study
assumes that non-financial facets of human resource management, such as the design
of chaUenging work, job enrichment interventions, realistic employment reviews,
formal information sharing, grievance procedures and labor-management participation
programs. These each have their effect on the effectiveness of strategic human
capital management practices, through the exercise of a personnel control mechanism,
hi this study, a personnel control mechanism is a catch-aU variable, which intensifies
the effects of all other contextual variables in the relationships between strategic
human capital management practices and employee capabilities.
103
Kaplan and Norton (1996) found that the mechanism for bringing management
control and strategy communication into full play is important for orgaruzations using
human capital management practices because the connection between human resource
management control and intemal corporate strategy communication will make
employees' motivation conform to organizational strategy. Snell (1992) argued that
human resource management control is used to judge if employees' technology and
knowledge are in conformity with the organizational requirement as well as if
employees' potential is required to be developed further. This study supposes that
the mechanisms for bringing human resource management control and intemal
corporate strategy communication into full play intend to lower the threats from
employees' abrapt resignations through pradently selecting and trairung talents,
therefore keeping these disgrantled people from leaving. However, it is noted that
when the appraisal of employees' performance is partial and inefficient,
communication regarding strategy is an important complement to human resource
management control (Bass and Avoho, 1993; PiUai et al, 1999). For personnel
control mechanisms, bringing human resource management control and intemal
corporate strategy communication into full play thereby accelerating human capital
management practices is an important task. Hom, Caranikas-Walker, Prassia, &
Griffeth (1992) found that safe working environment, solid organizational stracture,
impartial measurement of financial performance, reasonable remuneration and active
enterprise culture may minimize employees' abrapt resignation. This study
supposes that employees' self-cognition and self-affirmation accelerate job
satisfaction and employees' demand for on-the-job training. According to the
findings of Jung, Dalessio, & Johnson (1986), the enhancement of job satisfaction
depends on the following five factors: (1) employees' pay; (2) superiors' leadership;
(3) harmonious relationship between co-workers; (4) employees' opportunities of

104
promotion; and finaUy (5) working environment. This study also purports that
intensive on-the-job training is particularly important to the enhancement of job
satisfaction. Since intensive on-the-job training enhances the relationship between
co-workers as well as the coordination of team-based work, the link between human
resource management control and intemal corporate strategy communication is
important to note. In other words, the operation of personnel control mechanisms
not only increases employee's job satisfaction, but reduces the loss arising out of an
employee's abrapt resignation as well. To increase employee's job satisfaction and
lessen the cost resulting from employee's unexpected resignations, the organization
pays attention to a close coordination of employee's on-the-job training with working
characteristics, and focuses on an even opportunity for employee's promotion which
is strict and fair as regards rewards and punishments.
A senior executive of one of the sample firms (GISG) gave the following comments
on the subject of personnel control mechanisms:
"Neither senior executives will consider their employees at the basic level to be
decayed woods nor those employees will deem themselves to be incompetent.
In one corporation, the relationship between senior executives and employees
at the basic level is equivalent to one between a pregnant woman and her unborn
baby that no one mother would expect her newborn baby to be an unsightly or
a retarded child. Similarly, no one senior executive hopes his/her subordinates
are dummies or men of uselessness. A pregnant woman communicates with her
unborn child through the umbilical cord to transmit a kindred passion between
them. A senior executive and his/her employees communicate with each other through
reliable language, physical response and tmstworthy expression to express

105
their opinions and views and ameliorate their disagreement."
According to the comments on the subject of personnel control mechanisms
mentioned above, in adverse circumstances, both executives and employees would
strive to seek solutions to the problems and fight for the survival of the corporation.
Senior executives, or employees at the basic level, would treat themselves as
important and indispensable family members at their "home". Under circumstances
of mutual respect, both executives and employees have self-esteem in their "family"
and work hard and cooperate with each other to set up valuable business strategies
through good communication and exchange of professional knowledge. Under a
given goal to fulfill, every member of the strivers makes an effort for the future
sustainable development of this "family". Under an objective, accurate, impartial
and reasonable criterion of performance measurement, every member's efforts eam
considerable and poshive affirmation, while each one of them would positively
recognize his/her own efforts and pay respect to others' results. Under such
circumstances, no one will harbor intentions to be idle and lazy, no one will hope to
profit by other people's toil, and further, no one would give defamatory statements
suggesting that other people's resuhs are false. AU of these are key points brought
up by personnel control mechanisms.
3.3.2.2 Measuring methods
The control factor of personnel control mechanisms is based on an exchange process
in which the superior offers rewards in retum for the subordinates' effort and
performance (Pillai et al , 1999). In this study, the measurement of the control factor
is conducted by applying a set of questions related to contingent reward (the
subordinate and the superior have unconditional fortifying relations).

106
management-by-exception (the superior gets involved only when things go wrong),
and laissez-faire (the control factor of the personnel control mechanism is absent)
(Bass and Avoho, 1993) (e.g., Q45, Q46, Q47, Q48, Q49, Q50, Q52 and Q53
described in Appendix 1).
Based on the communication-coordination factor of the persormel control
mechanisms, the superior inspires subordinates to perform beyond expectations by
triggering their higher-order needs, cultivating an atmosphere of trast, and tempting
them to go beyond their self-interest for the sake of the goal the organization seeks to
achieve (PiUai et al , 1999). In this study, a set of questions related to inspirational
motivation (the subordinate provided with symbols and emotional appeals which are
directed at goal achievement), intellectual stimulation (the subordinate encouraged to
question his / her own way of doing things or to break with the past), and
individualized consideration (assignments delegated to the subordinate to provide
leaming opportunities) are set to measure the communication-coordination factor
(Bass and Avolio, 1993) (e.g., Q51, Q54, Q55, Q56 and Q57 described in Appendix
1).
Regarding the two dimensions of personnel control mechanisms, some questions in
Appendix 1 are based on the review of prior empirical works and some are evolved
through a self-compiled constract by this researcher AU the sources regarding
variable factors are described in Table 3.2.
107
Table 3.2 The source of variable factors of two dimensions of personnel control
mechanisms
Variable factors
Q45; Q46; Q47; Q48; Q49; Q50; Q51; Q52
Q53-d; Q56
Q53-a, b, c, e, f, g, h, i, j and k; Q54
Q55-a, b, c, d and e; Q57
Sources
This research
Pillai, Schriesheim and
WiUiams (1999)
Bass and Avolio (1993)
Bass and Avolio (1993)
3.3.3 Employee capability
3.3.3.1 Operational definition
According to Katz et al (1985), highly effective employee capabilities are defined as
those with fewer grievances and disciplinary actions and lower absenteeism, increased
product quality and direct labor efficiency. In this study, the change in environment,
employee skiU and organizational stracture, employee motivation, and employee
productivhy are expected to have effects on employee capabihty.
Stability for intemal business processes and flexibility to inventive process
improvements help the organization ensure the reliability of employee capability and
keep the organization flexible to creative process (Guzzo, Jette, and KatzeU, 1985).
Husehd (1995: 637) suggested that "the effectiveness of skiUed employees wiU be
hmited if they are not motivated to perform." An effective induction for employee
motivation can be accomphshed by relying on certain causations between employees'

108
efforts and reasonable rewards (Amit & Schoemaker, 1993). Some methods of
measurement of employee motivation are direct with the effects of induction
observable instantly, while some of them are indirect with the induction effects being
gradually observed over a long time. Consequently, a mere use of direct induction
methods will not necessarily bring employee capabihty into fuU play. Moreover,
employees' contributions are not easily described objectively in direct methods,
although each employee is entitled to share in their teams' glory. Huselid (1995:
638) noted that "the contribution of a highly skilled and motivated workforce will be
hmited if jobs are stractured programmed." However, strategic human capital
management practices can influence financial performance of an organization through
provision of orgaruzational stractures that encourage participation among employees
(Tichy et al, 1982; Katz, Kochan, & Gobeille, 1983; Pillai et al., 1999).
Cutcher-Gershenfeld (1991) suggested that firms taking on the leadership type of
intemal strategy communication have lower costs, less scrap, higher productivity and
a greater retum to direct labor hours than those using control leadership. Finally, the
essential consequence of uncertainty limits the ability of organization to
pre-deternune and quantify desired resuhs of employee capabihty (Tichy, et al, 1982;
Amit & Schoemaker, 1993). This study argues that a better management stracture
based on manufacturing flexibility can alleviate threats from employees' abrapt
resignations. The reason is that the management infrastracture does not demand one
to do whatever he/she is told to do, however asks each employee to establish a their
own circumspect accounting information net, thus enabhng employees to
communicate and cooperate mutually with information circulation.
3.3.3.2 Measuring methods
Findings by Katz et al. (1983) indicate that qualhy of work hfe, quality circles, and

109
labor-management teams would increase employee productivity. According to
Guzzo, Jette and KatzeU's meta-analysis (1985), training programs, goal setting, and
socio-technical system design have significant and positive effects on employee
capability. Gerhart and Milkovich (1992) also point out the consistent hnks between
incentive compensation systems and employee productivity. Furthermore, Tichy et
al. (1982) find that the employee capability of an orgaruzation is likely to be affected
by the stabihty of the extemal environment concerning economic changes,
technological changes, product changes and the change in customer preferences. In
this study, the measurement of employee capability is conducted by applying a set of
questions related to the change in environment, employee skill and organizational
stracture, employee motivation and employee productivity (e.g., the change in
environment includes Q58, Q59, Q60, Q61 and Q62; employee skiU and
organizational stracture include Q63, Q64, Q65, Q66, Q67, Q68, Q69, Q70, Q72 and
Q73; employee motivation includes Q74, Q75, Q76, Q77 and Q78; employee
productivity includes Q71, Q79, Q80, Q81, Q82, Q83, Q84, Q85, Q86 and Q87. All
of them are described in Appendix 1).
Regarding the four dimensions of employee capability, some questions in Appendix 1
are based on the review of prior empirical works and some are evolved through a
self-revision by this researcher All the sources regarding variable factors are
described in Table 3.3.
no
Table 3.3 The source of variable factors of four dimensions of employee capability
Variable factors
Q58; Q60; Q61; Q62; Q66; Q68; Q69
Q59; Q63; Q64; Q65; Q70-a; Q71
Q70-C, d; Q72; Q73-a and e; Q76; Q77
Q67
Q78;Q80;Q81;Q85;Q87
Q70-b, e and f; Q73-b, c and d; Q74; Q75
Q79; Q82; Q83; Q84; Q86
Sources
This research
Tichy, Fombum and Devarma (1982)
This research
Guzzo, Jette, and Katzell (1985)
This research
Katz, Kochan and Gobeille (1983)
Katz, Kochan and Gobeille (1983)
3.3.4 Customer loyalty
3.3.4.1 Operational definition
In this study, customer loyalty is defined as the ratio by having frequency of
complaints divided by repurchase frequency. It is not easy to guess what customers
think in their minds, but is significant to try to draw their attention and to guide them,
either existing or potential ones, to visit your shop. Consumer's propenshy to
repurchase is subject to quahty perception, i.e., a belief of a price-quality relationship,
frequency of repurchase, and the degree to which the article hands over "consumption
enjoyment" (Batra and Sinha, 2000). In this study, customer satisfaction indicates
that a customer is quite wiUing to retum and pass positive comments to his / her
friends. In other words, (1) repurchase likelihood rating, (2) price tolerance
(increase) given repurchase, and (3) price tolerance (decrease) to induce repurchase

I l l
determine customer satisfaction (Jones and Sasser, 1995). The last two measures
will be constracted from two variable factors: the degree to which a store could raise
its price as a percentage before the customer's willingness to buy again (given that the
customer has indicated his / her likelihood to repurchase) and the degree to which a
store could lower the price as a percentage before the customer's reluctance to buy
again disappears (given that the customer has indicated his / her unwiUingness to
repurchase). On the other hand, customer complaints are determined by whether his
/ her complaints are formal (by writing or phoning to a store manager) or informal
(made to service personnel). Three variable factors, as follows, will help
operationahze the overall customer complaints: (i) an overall rating of dissatisfaction;
(ii) the degree to which performance falls short of expectations; and (iii) a rating of
performance relative to the customer's ideal goods or service (Batra and Sinha, 2000),
while each variable factor will represent a qualitatively different benchmark
customers use in making cumulative evaluation (Jones and Sasser, 1995).
A senior executive of one of the sample firms (NSLIG) gave the following comments
on the subject of customer loyalty:
"One Chinese proverb says, 'a woman's heart is just like a needle in the
bottom of the sea' which means that a man can hardly understand what
reveals in a woman's mind. That can be apphed to customers' mind,
they are imperceptible sometimes. To meet customers' requirement,
not only good quality but also lower price and even novel design are
demanded. It is not an easy job to guess what customers think in their
minds, but is significant to try to draw their attention and to guide them,
either old or new ones, to visit your shop for purchase. Cordial smile,

112
humor talks, clean appearance and spacious shop are marketing skills of
Sunday school tmth. We shall create one opportunity for our customers
who can express what they intend to say from the bottom of their hearts,
then followed by an introduction to customers about the advantages of
the products which are already ones worthy for purchase on the
market, making them feel: it's time to put into action, or you will regret for
not having purchased it. Besides, never deceive customers, while one
who feel deceived equals to ten or more customers deceived that the loss for
the company outweighs the gain. Any poor satisfaction from one customer
must allow him or her to have the products returned. It is indispensable to
make a phone call or write a thank note to those old customers who introduce
new ones for purchase. Accept customer's complaints toward the company
and make self-examination humbly, and further, express gratitude for their
precious opinions. A care, concern and respect will definitely result in
customers' frequent visit. Each shop manager must make a detailed record
about customers' frequency and cause of complaints as well as frequency and
amount of re-purchase regularly, and follow up the changes of sale revenue
growth based on the ratio by having frequency of complaints divided by
re-purchase frequency."
3.3.4.2 Measuring methods
The percentage growth of business with existing customers is used to measure
customer satisfaction. In addition, customer acquisition is measured by both the
number of new customers and the total sales to new customers. The statement of
Jones and Sasser (1995) indicates that the measures of customer satisfaction and
customer acquisition are not sufficient to achieve a high degree of customer loyalty.

113
Hence, customer loyalty, including customer satisfaction and customer complaint,
in this study, is measured by using a set of questions related to the degree of perceived
quality variation, the level of perceived consumption risk, perceived value for money,
and degree of customer knowledge in terms of customer complaint and customer
satisfaction (e.g., Q88, Q89, Q90, Q91 and Q92 described in Appendix 1).
Regarding the two dimensions of customer loyalty, some questions in Appendix 1 are
based on the review of prior empirical works and some are evolved through a
self-compiled constract by this researcher. All the sources regarding variable factors
are described in Table 3.4
Table 3.4 The source of variable factors of two dimensions of customer loyalty
Variable factors
Q88; Q92-a and b
Q89;Q90;Q91
Q92-C, d, e, f, g and h
Sources
Jones and Sasser (1995)
This research
Batra and Sinha (2000)
3.3.5 Company financial performance
3.3.5.1 Operational definition
Prior empirical work on the measurement of company financial performance is
extensive. Economic profits stand for the net cash flows that accrae to shareholders
and reflect the capital market's perception of both potential and unlikely profitabihty,
all of which are typified by capital market retums. Accounting profits differ from
economic profits in consequence of timing issues, adjustments for depreciation.

114
choice of accounting method, and measurement error (Hirschey and Wichem, 1984).
Moreover, accounting data are often the centre of attention for strategic HCMPs since
organizational management must allocate scarce resources. Therefore, measurement
of both economic profits (e.g., Tobin's q) and accounting profits (e.g., gross rate of
retum on capital, sales revenue growth and net income before tax) was to be
considered.
3.3.5.2 Measuring methods
In the present study, calculations taken from Hirschey and Wrchem (1984) and Hall
(1993) were intended to be used for the measurement of Tobin's q and gross rate of
retum on capital. First, the logarithm of Tobin's q was to be calculated by having the
market value of a firm being divided by the replacement cost of its assets. Second,
the calculation of gross rate of retum on capital was conducted by dividing the cash
flows by capital stock^. However, 259 out of the 265 store managers' responses
(97.74%) retrieved, significantiy point out that Tobin's q is not used to measure the
store's performance and value added by management. Typical comments on the
subject of financial performance when interviewing with senior executives of sample
firms were as foUows.
"How to attract customers' attention is an important concern for our
company. Customers' response to our products or services is a
valuable asset. The useful and valuable assessment of
store functioning is customer-based measurement of performance.
Hence, sale revenue growth from new customers and repurchasing
of old customers significantly indicate the increase in market share
and the opportunity of creating corporate performance. Tobin's q is

115
not popular in our company. This is because the market value of our
company and the replacement cost of corporate assets are affected by
several dynamics. Some are extemal issues. Taking Tobin's q as the
measurement of performance does not fully and completely reflect the
genuine execution of managing store business. Comparing with
Tobin's q, gross rate of retum on capital is a better measure of
accounting profits. General speaking, economic profits such as
Tobin's q is not the center of attention for implementing BSC and strategic
HCMPs because store managers must concern the opportunity cost
due to allocating resources of our company. Pioneering companies
must pay attention to the magnification of obtainable product tines
and submitting brand new products to our customers."
The views of store managers' mentioned earlier are, therefore, confirmed by typical
comments of senior executives of sample firms. Hence, the use of Tobin's q is left
out when measuring the performance of 265 stores.
Innovative sample firms such as CWTG, GISG and JKMIG usually lay emphasis on
the enlargement of existing product lines or offering brand new products and services.
According to Kaplan and Norton (1996c), the percentage of sales revenue from new
products and services introduced within a specified period is a common measure for
growth-stage businesses or irmovative companies. Sales revenue growth and the
increase in net income before tax imply enlarging product and service offerings,
acquiring new customers and expanding new markets, changing the product and
service mix toward higher-value-added offerings and re-pricing products and services.
Sales revenue growth (SRG) and net income before tax (NIBT) for targeted regions,

116
markets and customers are calculated as follows.
SRG= (the increase in annual actual store sales) -5- (actual store sales in the base year).
For example, SRG1999 = [(actual store sales, net of markdowns and other
discounts)i999 - (actual store sales, net of markdowns and other discounts)i998] -5-
(actual store sales, net of markdowns and other discounts)i995, 1995 is assumed to be
the base year.
NIBT is computed as annual actual store sales less store-related expenses. For
example, NIBT1999 = (actual store sales, net of markdowns and other discounts) 1999 -
(cost of goods sold -\- salaries and wages + occupancy costs -1- allocated overhead
COSts)i999.
3.3.6 Control variables
To provide unbiased estimates of the impact of strategic HCMPs on financial
performance of an organization, the selection of the control variables for each
constract is based on a careful review of the prior empirical work. These variables
include exogenous factors which are based on demographics, economic environment
and long-term organizational characteristics.
First, the effect of firm size was controlled through the dependent variable. Size of
an organization is the first control variable as large firms might be more likely to
implement a more complex govemance stracture including multiple, non-financial
performance measures (Tichy et al, 1982; Ittner et al., 1997). This study included
two variables to control for their potential effects on strategic human capital
management practices and employee capability. These were number of employees
and paid-up registered capital. Firms may add new services or enter new locations

117
through intemal development (e.g., hhing new employees, opening new offices) or by
extemal acquisition (e.g., acquiring another firm). Acquisitions provide much faster
expansion than intemal development, and the two modes of market entry may have
different effects on firm performance. Hitt et al. (2001; 20) found that "as firms
diversify into new geographic markets, their motives and outcomes may vary. One
variable that may affect the outcomes of such geographic market diversification is the
process of leveraging human capital". Furthermore, Tichy et al. (1982) argued that
large firms might be more likely to implement a more complex govemance stracture
including multiple, non-financial performance measures. Under the circumstances,
human resource management practices (HCMPs) can be especially lucrative and often
require high leveraging of human capital (high employee capability). Leveraging
human capital creates efficiencies in a firm, but it also imposes some costs. For
example, monitoring is increased to ensure quality outcomes. General management
costs, incurred owing to assigning tasks, coordinating activities, and evaluating
employees, also increase with leveraging human capital (Hitt et al, 2001). In the
present study, number of employees and paid-up registered capital were used to
account for the difference in organization size which is expected to have a positive
impact on strategic HCMPs, the process of leveraging human capital, and,
consequently, employee capability. These two measures were transformed using a
log transformation.
Second, the effect of the store heads' length of experience was controUed through the
dependent variable. Although applying human capital and leveraging human capital
generally have positive retums, store managers must ensure that the benefit gained
from the use of a firm's human capital more than offsets the costs. The job of store
manager differs from that of shop-floor employees, and new skills must be developed.

118
Hitt et a l (2001; 20) found that "store managers must build the skiUs needed to
develop and maintain effective relationships with chents." Store managers serve as
project and team leaders on specific cases and thus must develop managerial skills.
These include skiUs involving leadership, decision-making, allocation of resources,
relationships with subordinates, peers, superiors, and chents, resolving confhcts, and
processing information. Hitt et al. (2001; 15) argued that "although new store
managers are leaming these skiUs, they may be less effective team leaders than those
with more experiences." More experienced store managers likely contribute more
retums to the store than do new managers. Also, the more experience a store head
has, the more familiar he or she is with the characteristics of shop-floor employees,
making the flow of communication with employees smoother (Osbom and Hunt,
1975). Furthermore, the costs for new store managers may exceed the retums from
their capital. Therefore, the prestige of store managers, their tacit knowledge gained
through experience, and their social capital can be helpful in the implementation of
their firm's strategy (Osbom and Hunt, 1975). This study included the store heads'
length of experience to control for its potential effect on strategic HCMPs and
employee capabihty.
Third, the effect of strategic positioning of an organization was controUed through the
dependent variable. Hitt et al. (2001; 16) found that "strategic resources are the
basis for and facilitate the implementation of firm strategy." As mentioned earlier,
firms building strong competencies from their HCMPs can take advantage of strategic
opporturuties. Furthermore, taking advantage of these strategic opportunities helps
firms create value. Tichy et al. (1982) found that human capital is a vital resource for
the implementation of a firm's strategy. Nayyar (1993) argued that diversification
into new services and geographic regions of diversified service firms both offer

119
opportunities to achieve economies of scale and scope. Furthermore, firms seeking
to pursue a prospector strategy tend to use non-financial measures in CEO bonus
compensation, but not traditional financial controls (Ittner et al, 1997). This study,
therefore, included strategic positioning of an organization to control for its potential
effect on customer loyalty and firm performance.
Fourth, the effect of environmental uncertainty was controlled through the dependent
variable. The degree of environmental uncertainty comes last as the fourth control
variable. An important responsibility of store managers is obtaining and maintaining
clients. Store managers build relationships with current and potential clients and,
overtime, develop social capital through their chent networks (Nahapiet and Ghoshal,
1998). Hitt et al. (2001) suggested that one of the responsibilities of store managers
is to help develop the knowledge of shop-floor employees. For example, shop-floor
employees need to leam intemal routines, the idiosyncrasies of important clients, and
more. Firm performance is a function of many variables both from inside a flrm
(these include the intemal cost of capital and the costs of operations, facilities and
equipment, and other resources) and from outside the firm (such as competitiveness in
the industry and the health of the economy). According to Govindarajan (1984),
uncertainty conditions that are extemal to the organization can have impacts on the
financial performance of an organization. This study, therefore, included
environmental uncertainty to control for its potential effect on customer loyalty and
firm performance. The stabihty of the extemal environment regarding the legal,
political and regulatory constraints surrounding an organization, product changes
without expectation and unexpected change in customer preferences were reflected by
the degree of environmental uncertainty.

120
3.4 Measuring Tools
A questionnaire serves as a tool for measuring each dimension of aU
muhi-dimensional constracts used in this research, which is based on the conceptual
framework and the operational content of each dimension. Appropriate variable
factors were selected through reviewing prior empirical works and a synthesis, and
the revision of variable factors for each dimension took experts' and scholars'
opinions into consideration. Eventually, the first draft of the questionnaire was
finahzed after having its relevance discussed with supervising professors.
Consequently, the questionnaire is in conformity with the demand for content validity.
3.4.1 Pilot test
The first draft was used in a pilot test. Questionnaires including cover letters were
sent to sixty randomly selected teachers of Lu-Liow Junior High^ to develop an
understanding of the questions' acceptability, and ask for comments on clarity,
ambiguity and the appropriateness of wording and length. Sixty copies of the pilot
test questionnaires were issued, with 56 of them being retrieved from which 5 invalid
copies with incomplete answers were deleted, making a total of 51 valid copies.
Based on the results of the pilot test, several chimges were made to the final survey.
Those retrieved questionnaires were needed to conduct the reliability analysis
inunediately to comprehend the reliability coefficient for the intrinsic consistency of
each dimension. In addition to 17 items concerning "basic data", the pre-test
questiormaire contained another 75 items which were found with low reliability for
two constracts, "strategic human capital management practices" and "personnel
control mechanisms".
After calculating Cronbach's a coefficient using STATISTICA software, one

121
conclusion was that ill-defined meaning of the variable factors resulted in the low a
coefficient. Accordingly, variable factors (questions) 18, 48, 49, 50, 51, 52, 53, 54,
55, 56 and 57 of the dimension "developing human caphal management practices"
were revised to be more in conformity with the content of this dimension. Similarly,
variable factors (questions) 3, 4 and 6 of the dimension "the change in envhonment",
variable factors (questions) 7, 8, 9 and 11 of the dimension "employee skill and
organizational stracture", together with variable factors (questions) 19, 20, 22 and 23
of the dimension "employee productivity" were revised, leading those dimensions to
be more in conformity with the operational definition of the present study. Also, in
the dimensions of self-compiled constract of "personnel control mechanisms",
variable factors (questions) 1, 2, 3, 4, 6, 7, 8, 9 and 26 of the dimension "the control
factor of persormel control mechanisms" were revised to be more in conformity with
the content of this dimension.
3.4.2 Data collection
A revised questionnaire with a covering letter and a postage-paid, self-addressed
envelope was mailed to store-level heads. A guarantee was given that the firushed
results of the survey would not be connected to either a particular store or manager
whhin the sample firm. The resuhs will be used only in an aggregated form and
therefore the anonymity and confidentiality of each store manager are assured. It is
also hoped that aspects of the results wiU be pubhshed in aggregate in various
professional and academic joumals. The wordings of questionnaire items originated
or adapted for the present study appear in the Appendix 1.
This study analyzes cross-sectional data for 265 stores included in the five business
groups mentioned above in Taiwan and China, of which about 55% are simated in

122
metropolitan areas while the remainder are in non-metropolitan areas. Data on the
actual number of stores are not disclosed in order to protect the companies' identities.
In order to provide some control over orgaruzational size, only stores with more than
30 employees are included in this study. Only store heads are selected as they are
regarded as surrogates for work units. In most companies, only a single functional
head from each store is selected to ensure independence of observations. The names
of the functional heads were obtained by telephone calls to ensure that the
questiormaire would be answered only by the functional heads identified.
The present study uses a comprehensive survey that asks multiple questions about
each dimension of five multi-dimensional constracts in order to increase constract
validity. However, this situation will produce the potential risk of incurring a lower
response rate (i.e., a response rate is below the average of 20 %) (Young, 1996). A
sample of non-respondents was contacted by telephone to investigate reasons for
non-response. In this study, time delay affected dates of receipt of responses when
mailing retums from China to Taiwan (on an average the range of time delay is
between 7 and 15 days). Hence, t-tests for two independent samples were not
undertaken by testing early and late mailing retums because the recorded dates did not
reflect the required characteristics, i.e., late receipt did not necessarily indicate late
completion. Consequently, the recognition of 'non-response' as a limitation (20%)
of the findings is thought to be sufficient.
The data used in this study were collected from several different sources. Key
financial performance measures such as actual store sales revenue, markdowns and
other discounts, cost of goods sold, salaries and wages, occupancy costs, allocated
overhead costs and net income before tax were collected from corporate accounting

123
records and cross-checked with annual operating statements submitted by individual
sample firms. Shopper surveys, demographic data and store-level details on
employees, including productivity, were obtained from records maintained by the
human resources and research and development departments, hi addition, several
in-depth visits with store managers in store operations, finance and accounting and
human resources provided insights into the historical and cultural background of the
research sites that influence management controls and performance. Store-specific
annual data on employee productivity, employee satisfaction, employee tumover,
customer satisfaction, customer complaint, area demographics, financial performance
measures and other store-level details are available only for the most recent fiscal year
Several in-depth visits to senior executives of sample firms were also be conducted in
order to gain a better understanding of strategic HCMPs-
Demographic data (e.g., the average length of experience of the respondents in their
area of responsibility, the average number of employees in the area of responsibility,
etc.) were collected to indicate whether respondents are highly experienced and hold
highly responsible poshions. The formal questionnaire (still covering 92 variable
factors) was completed after being revised as mentioned above. Cronbach's a
coefficient of each dimension for the pilot test questiormaire are indicated in Table
3.5.

124
Table 3.5 Cronbach's a coefficient of each dimension of four muhi-dimensional
constracts (pilot test questionnaire)
Constmct
Strategic human capital
management practices
Personnel control
mechanisms
Employee capability
Customer loyalty
Dimension
IDEN
DEVE
PROT
DEPL
CONT
COMM
TCIE
ESAOS
EM
EP
CC
CS
The number of factors
14
14
19
10
12
14
6
7
6
6
4
4
Cronbach's a
0.664413
0.786783
0.532235
0.592452
0.704761
0.657676
0.725872
0.716806
0.602147
0.644035
0.481677
0.698522
Note: you will find the defirution of each dimension of four multi-dimensional
constracts mentioned above in Appendix 5.
The formal questionnaires were issued in mid-January 2002 through liaison persons
from each sampling unit while the retrieval was also completed by haison persons
designated by each unit in the end of Febraary of the same year. 368
questionnaires were issued, and 291 were retrieved from which 26 invalid copies
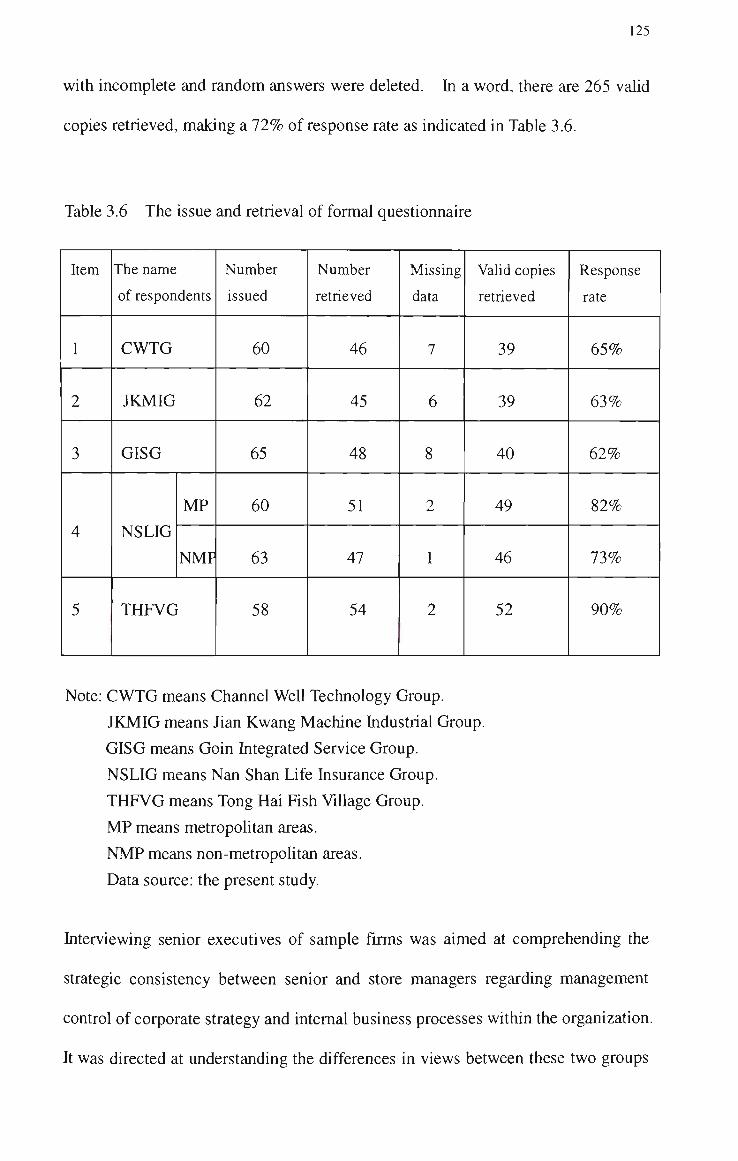
125
with incomplete and random answers were deleted. In a word, there are 265 vahd
copies retrieved, making a 72% of response rate as indicated in Table 3.6.
Table 3.6 The issue and retrieval of formal questionnaire
Item
1
2
3
4
5
The name
of respondents
CWTG
JKMIG
GISG
NSLIG
MP
NMF
THFVG
Number
issued
60
62
65
60
63
58
Number
retrieved
46
45
48
51
47
54
Missing
data
7
6
8
2
1
2
Valid copies
retrieved
39
39
40
49
46
52
Response
rate
65%
63%
62%
82%
73%
90%
Note: CWTG means Channel Well Technology Group.
JKMIG means Jian Kwang Machine Industrial Group.
GISG means Goin Integrated Service Group.
NSLIG means Nan Shan Life Insurance Group.
THFVG means Tong Hai Fish Village Group.
MP means metropolitan areas.
NMP means non-metropolitan areas.
Data source: the present study.
Interviewing senior executives of sample firms was aimed at comprehending the
strategic consistency between senior and store managers regarding management
control of corporate strategy and intemal business processes within the organization.
It was directed at understanding the differences in views between these two groups
126
of managers regarding strategy communication and the application of strategic
HCMPs.
Interviews with six senior executives who come from different sample firms were
carried out from mid-March 2002 to mid-April through questions designated by the
interviewer The majority of the interviewees held managerial positions. They
were employed an average 15 years; 4 males and 2 females. A total of 5
interviewees had complete and concrete information and only these were used in
the analysis. The first draft of transcripts was passed to interviewees by the
interviewer for confirmation. Any information or quotation used in the present
study was drawn from validated transcripts. The interview schedule is shown in
Table 3.7 and the interview questions are shown in Appendix 3.

127
Table 3.7 The interview schedule
Item
1
2
3
4
5
6
The name of
sample firms
CWTG
JKMIG
GISG
NSLIG
THFVG
NSLIG
The location of
of interviewing
Taipei
Taoyung
Kaohsuing
Taipei
Chunghwa
Taipei
The position
of interviewees
Vice general
manager
CEO
Accounting
manager
Marketing
manager
General
manager
Accounting
manager
The date of
interviewing
21 March
2002
24 March
2002
30 March
2002
7 April
2002
10 April
2002
14 April
2002
The length
of time
45minutes
32minutes
67minutes
37nunutes
30minutes
41 minutes
Source: the present study
The data provided by interviewing senior executives indicate that there is a great
deal of intrinsic consistency within the organizational stracture regarding the
formulation of business strategy and the development and deployment of strategic
HCMPs. However, senior executives of computer companies pay more attention
to the protection of strategic HCMPs, rather than the identification, but
interviewees coming from life insurance companies and traditional agriculture
manufacturing companies focus on the identification of strategic HCMPs. On the
128
Other hand, the majority of the interviewees expressed a strong agreement at
conducting BSC after carefully taking strategic HCMPs into account. In addition,
financial and non-financial performance measures are equally significant. In brief,
the views of senior executives regardmg the business strategy of their comparues
are somewhat different from that of store managers. The former pays attention to
long-term strategy formulation, but the latter focuses on the short-ran operating
benefits of business strategies.
3.5 Data Analysis Methods
With the path diagram of the conceptual framework completely specified, this
study tests the data for meeting the assumptions underlying stractural equation
modehng (SEM), selects the type of input matrix (e.g., covariance or correlation
matrix) to be used for model estimation, and estimates the stractural and
measurement models. When testing a series of causal relationships, covariance
matrix is the preferred input matrix type (Nunnally, 1978), however, correlations
are used for both practical and theoretical reasons. From a practical perspective,
correlations are more easily interpreted and diagnosis of the results is more direct.
From a theoretical perspective, the primary purpose of the present study is to
examine the pattern of relationships among constracts, for this purpose the
correlation matrix is an acceptable input matrix.
SEM to be used in this study includes an entire family of models known as
covariance stracture analysis, latent variable analysis, confirmatory factor analysis
and linear stractural relation analysis. When SEM incorporates latent variables
into the analysis, latent variables are approximated by observable or measurable
indicators. The observed indicators are gathered from respondents through
129
various data collection methods (e.g., surveys and interviews). This has both
practical and theoretical justification by improving statistical estimation, better
representing theoretical concepts and accounting for measurement error In
addition, SEM provides the measurement model, which specifies the rales of
cortespondence between marufest and latent variables. Relationships Unking each
constract with its antecedents are developed. In this study, SEM indicates the
relationship between latent variables while the measurement model, the relationship
between latent and observable variables. The LISREL model mentioned in
Chapter 3 and Appendix 4 consists of SEM and the measurement model. All
techniques of SEM are distinguished by two characteristics:
(1) estimation of multiple and interrelated dependence relationships (e.g.,
relationships between strategic HCMPs and employee capability moderated by
personnel control mecharusms, as well as relationships between employee
capability and financial performance of an organization intervened by
customer loyalty); and
(2) the ability to represent unobserved concepts in these relationships (e.g., the
design of challenging work, job enrichment interventions, realistic job
previews, advancement opportunhies and promotion, formal information
sharing, grievance procedures, labour-management participation programs,
and performance appraisal, employee job satisfaction, the store's overall
chmate for service friendliness, customers' degree of willingness to retum, and
customers' degree of willingness to pass positive comments to friends).
hi brief, SEM describes a series of separate, but inter-dependent, multiple
regression equations simultaneously by specifying the stracture model used by the
statistical program. The present study draws upon theory, experiences of prior
130
empirical work, and the research objectives to discover which independent
variables predict each dependent variable. Some dependent variables become
independent variables in subsequent relationships, giving rise to the interdependent
nature of the stractural model Moreover, many of the same variables affect each
of the dependent variables, but with differing effects.
As noted above, SEM used in this chapter contains a variety of causal relationships.
Two types of analysis performed in this study are confirmatory factor analysis
(CFA) and the estimation of a series of stractural equations. In the present study,
the CFA examines a multi-factor solution developed from Chapter 2. In other
words, CFA discussed in this chapter is concerned with exploring the patterns of
relationships among a number of variables. These patterns are represented by
factors (or principal components). As variables load highly on a factor, they
become descriptors of the underlying dimensions of constracts (NunnaUy, 1978).
The examination of the loadings of the variables on the factors helps to identify the
character of the underlying dimension. This study allows for a statistical test of
the goodness-of-fit for the proposed confirmatory factor solution in order to
validate each dimension for the measurement of specific constracts.
Using the foUowing data analysis procedures based on the research framework and
hypotheses and taking the relevance of analytic tools into account, all vahd
questionnaires retrieved were coded and then the data were analyzed to verify each
assumption of this research. Data analysis procedures used in the present study
were as follows.
1. Exploratory factor analysis
To validate variable factors for each dimension of four muhi-dimensional

131
constracts identified by this research, exploratory factor analysis (EFA) is
conducted after retrieving the questionnaires, followed by exploring the
rehability of variable factors for comprehending the intrinsic consistency among
factors for each dimension.
2. Confirmatory factor analysis
To specify models fitting the data reasonably well and further examine the
stability of model parameter estimates, composite reliability (CR),
goodness-of-fit index (GFI), adjusted goodness-of-fit index (AGFI) and root
mean square residual (RMR) are employed and convergent and discriminative
validhy are identified.
3. Hierarchic regression analysis and nested-model analysis
After examining the distribution of the data used in the present study by means
of frequency analysis and correlation matrix, and judging the general results of
this research by applying mean, standard deviation and correlation coefficient
between dimensions for each constract, the next step is to examine the degree of
influence on the outcome at the time of changing the independent variables as
well as the effect on the outcome with an addition of the mediators and control
variables. This research also explores the causal relationship between
constracts by applying hierarchic regression analysis. FinaUy, the present
study examines the intervening effects among dimensions of five
multi-dimensional constracts by conducting nested-model analysis.
3.6 Factor analysis
In the present study, the stracture and measurement models must be identified.
Identification is a relatively simple matter in CFA, and the diagnostic procedures of
the LISREL program are sufficient to detect identification problems (PiUai,
132
Schriesheim and WiUiams, 1999). The extemal and intemal quality of data in the
LISREL model are discussed in Appendix 4. The most common problem may
occur if multiple variable factors are hypothesized to be dimensions for two or three
constracts. The chance of occurrence is minimized by the use of theoretical
foundations for specification of the measurement model.
As noted earlier, the stractured components of each dimension can be validated by
means of EFA which further determine the effective factors used for the assessment
of the best-fitting model. Even though this research has constracted the variable
factors of each dimension based on the review of prior empirical work, part of
factors are evolved through a self-revision by this researcher In addition, since the
present study has a large number of factors relative to the size of the sample, and the
underlying stracture of several measures is not clearly estabhshed, EFA is employed
for the analysis of measurement model.
EFA employed in the research begins by examining the measurement of each
dimension of four multi-dimensional constracts separately, and variable factors for
each dimension that perform poorly were deleted from the scale in the sample by
utilizing principal component and principal axis factor extraction methods with
normalized varimax rotation. As noted by Pillai et al. (1999), the optimal number
of variable factors are determined by the following rales: all principal component
eigenvalues are greater than one and scree plots of the principal axis factors support
the number of variable factors extracted as being appropriate.
Cumulative % variance of 50 or more is considered indicative of acceptable results
for EFA (Joreskog and Sorbom, 1993). When EFA was completed, all the

133
remaining variable factors were used for the examination of the stabihty of model
parameter estimates. Table 3.8 to 3.11 demonstrate the analytical resuhs for EFA
of four muhi-dimensional constracts. The results manifest the variable factors of
each dimension being in conformity to the factor disposition of each dimension.
The variable factors for each dimension as a whole can explain what a dimension
represents.
Table 3.8 The analytic results for exploratory factor analysis of strategic human capital management practices
^^^-»,,^^^Dimensions
Variable factOTS"^^^^^
New technology
Patents
Knowledge of
customers
Experience of store
head
Knowledge of store
head
Understandable
sequence of rales
Repetitive
activities
Importance of
product cost
IDEN
0.848974
0.834287
0.758285
DEVE
0.761712
0.888596
0.899621
PROT
0.762274
0.692083
DEPL

134
Table 3.8 The analytic results for exploratory factor analysis of strategic human
capital management practices (continued)
\ . Dimensions
Variable \ v
factors \ v
Compethors
I am not involved
1 help to operate
1 am responsible
Managerial staffing
process
Extensive employee
selection process
Select the best person
IDEN DEVE PROT
0.746802
0.576145
0.702510
DEPL
0.756129
0.840329
0.874418
0.845263
Eigenvalue 3.65942 2.91605 2.18596 1.29970
% total Variance 24.39615 19.44030 14.57306 8.66469
Cumulative %
Variance 24.39615 43.83646 58.40951 67.07420
Note: You will find the definition of IDEN, DEVE, PROT and DEPL mentioned
above in Appendix 5.
New technology means how important is 'new technology' for sustaining your
organization's competitive advantage?
Patents means how important are 'patents' for sustaining your organization's

135
competitive advantage?
Knowledge of customers means how important is 'knowledge of customers'
for sustaining your organization's competitive advantage?
Experience of store head means how necessary is 'experience of store head'
for sustaining your organization's competitive advantage?
Knowledge of store head means how necessary is 'knowledge of store head'
for sustaining your organization's competitive advantage?
Understandable sequence of rales means to what extent is there an
understandable sequence of rales that can be followed by the managers
performing tasks in your organization?
Repetitive activities means to what extent would you say managerial
tasks in your work urut perform repetitive activities?
Importance of product cost means how important is 'product cost' for product
pricing in your organization?
Competitors mean how important is the 'competitors' for product pricing in
your organization?
I am not involved means strategic human capital management practices are
employed in my company, but I am not involved with it.
I help to operate means I help my company operate the system of strategic
human capital management practices.
I am responsible for the implementation means 1 am responsible for the
implementation of strategic human capital management practices.
Managerial staffing process means I feel good when I place the managerial
staffing process in my company.
Extensive employee selection process means it is important for my company
to consider an extensive employee selection process (e.g., use of tests,
interviews, etc.) for a managerial position once this position becomes open.
Select the best person means 1 believe that an important part of being a good
CEO is to select the best person for a managerial position in my company.
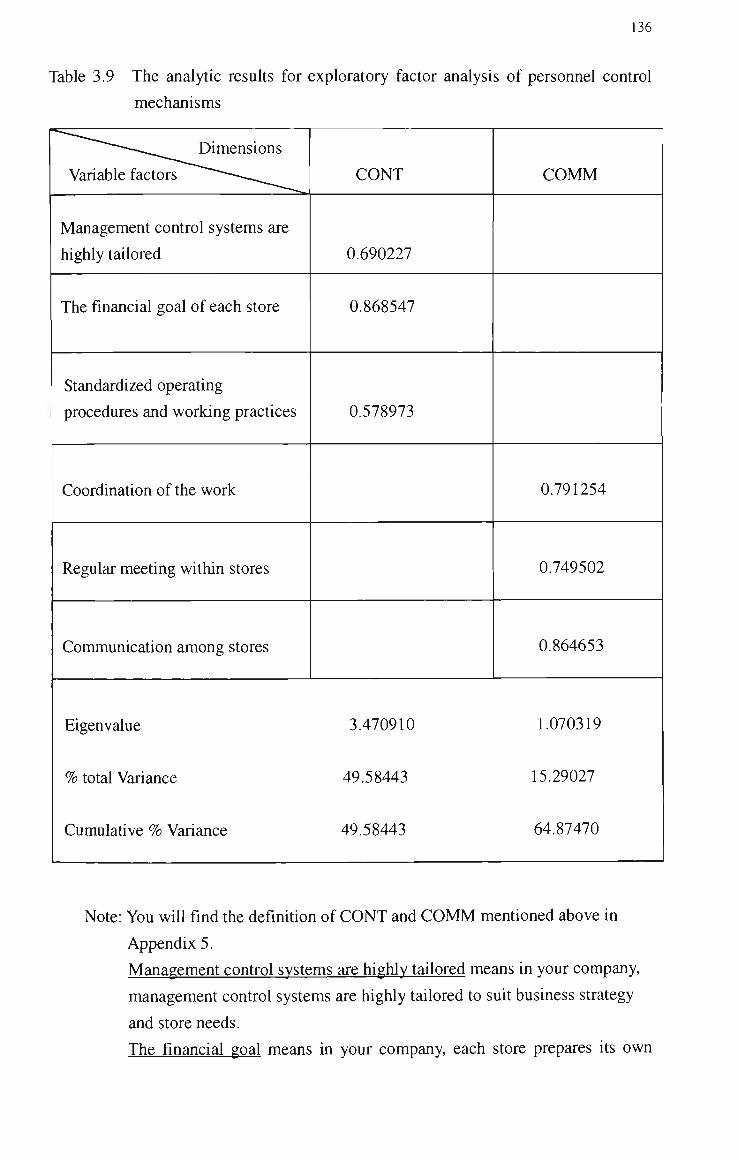
136
Table 3.9 The analytic results for exploratory factor analysis of personnel control
mechanisms
—-....>.., ^ ^ Dimensions
Variable factors ~~~—
Management control systems are
highly tailored
The financial goal of each store
Standardized operating
procedures and working practices
Coordination of the work
Regular meeting within stores
Communication among stores
CONT
0.690227
0.868547
0.578973
COMM
0.791254
0.749502
0.864653
Eigenvalue 3.470910 1.070319
% total Variance 49.58443 15.29027
Cumulative % Variance 49.58443 64.87470
Note: You will find the definition of CONT and COMM mentioned above in
Appendix 5.
Management control systems are highly tailored means in your company,
management control systems are highly tailored to suit business strategy
and store needs.
The financial goal means in your company, each store prepares its own

137
financial goals to be used to frame its budget.
Standardized operating procedures and working practices means in your
company, the work within each store is governed by the use of
standardized operating procedures and working practices.
Coordination of the work means how important is the coordination of the
work of different stores?
Regular meeting within stores means how important is the regular meeting
within stores to supply information to store head?
Communication among stores means how important is the regular meeting
among stores to share information and coordinate activities?
Table3.10 The analytic results for exploratory factor analysis of employee capability
^ "" -• ^^^ Dimensions
Variable ^^"^^^^^
factors ^^"^^^^^
Market activities of competitors
Extemal environment
Legal, political and regulatory
constraints
Complexity of production process
Flexibility of manufacturing and
service-providing facilities
Intensity of capital equipments
TCIE
0.821690
0.811698
0.816683
ESAOS
0.809646
0.857551
0.838664
EM EP
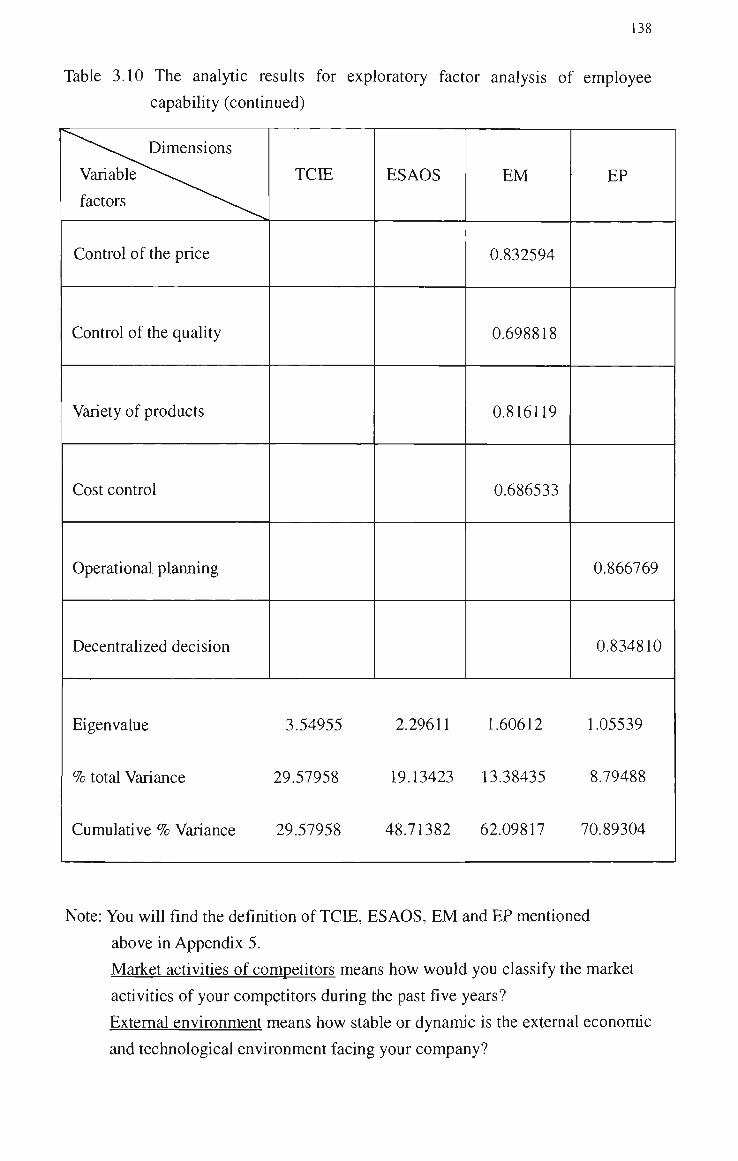
138
Table 3.10 The analytic resuhs for exploratory factor analysis of employee
capability (continued)
^ " . . ^ Dimensions
Variable ' -v.., ^ ^
factors ^^"^v^^^
Control of the price
Control of the quality
Variety of products
Cost control
Operational planning
Decentralized decision
TCIE ESAOS EM
0.832594
0.698818
0.816119
0.686533
EP
0.866769
0.834810
Eigenvalue 3.54955 2.29611 1.60612 1.05539
% total Variance 29.57958 19.13423 13.38435 8.79488
Cumulative % Variance 29.57958 48.71382 62.09817 70.89304
Note: You will find the definition of TCIE, ESAOS, EM and EP mentioned
above in Appendix 5.
Market activities of competitors means how would you classify the market
activities of your competitors during the past five years?
Extemal environment means how stable or dynamic is the extemal econonuc
and technological environment facing your company?

139
Legal political and regulatory constraints means during the past five years,
how have the legal, political and regulatory constraints surrounding your
firm changed?
Complexity of production process means how complex is the production
process in your company?
Flexibility of manufacturing or service-providing facihties means how
flexible are the manufacturing and service-providing facilities in your
company?
Intensity of capital equipments means in your company, how intensive are
the capital equipments used in the production process?
Control of the price means how important is the control of the price of
products to employee motivation?
Control of the quality means how important is the control of the quality of
products to employee motivation?
Variety of products means how important is the variety of products or
services to employee motivation?
Cost control means how important is budgeting to cost control in your
company?
Operational plaiming means how important is operational planning to
employee productivity in your company?
Decentralized decision means how important is decentralized decision to
employee productivity in your company?

140
Table 3.11 The analytic results for exploratory factor analysis of customer loyalty
" ^—^.^.^^^^ Dimensions
Variable factors """ ^—-~_ _ _ ^
Employee's perception
Sales clerks' friendliness
Customers' recommendation
Customers' propensity to repurchase
CC
0.847544
0.763167
CS
0.875205
0.853595
Eigenvalue 1.875 1.691
% total Variance 46.883 42.270
Cumulative %
Variance 46.883 89.153
Note: You will find the definition of CC and CS mentioned above in Appendix 5.
Employee's perception means how important is the following factor to the
reduction of customer complaint: an employee's perception of the store's
overall climate for service friendliness?
Sales clerks' friendliness means how important is the following factor to the
decrease of customer complaint: store head recognizes and appreciates sales
clerks' friendliness toward customers?
Customers' recommendation means how important is the following factor to
the increase in customer satisfaction: your customer will recommend your
store to his friend when he needs to buy a new product?

141
Customers' propensity to repurchase means how important is the following
factor to the increase in customer satisfaction: your customer will
recommend your store when he chats with his friends about your store's
products?
For each constract mentioned in this study, according to Joreskog and Sorbom (1993),
cumulative % variance of 50 or more is regarded as indicative of satisfactory results
for EFA. Based on the results of Table 3.8, 3.9, 3.10 and 3.11, cumulative %
variance of each constract fits the requirement of Joreskog and Sorbom (1993) (i.e.,
cumulative % variance of human capital management practices is 67.07%, cumulative
% variance of personnel control mechanisms is 64.87%, cumulative % variance of
employee capability is 70.89% and cumulative % variance of customer loyalty is
89.15%). The path diagram of the acceptable results for EFA is displayed in Figure
3.2. Each dimension of four multi-dimensional constracts involves the optimal
number of factors which is satisfactory for proceeding with the following analyses
shown in Chapter 3 and 4 (i.e., CFA, hierarchic regression analysis and
nested-model analysis).

142
Figure 3.2 The path diagram of the analytic results for exploratory factor
analysis
Strategic human capital management practices
IDEN DEVE PROT DEPL
Personnel control mechanisms
Employee capability
TCIE ESAOS EM
CONT COMM
EP
Company's financial performance
SRG NIBT GRROC
Note: You will find the definition of each dimension mentioned above in
Appendix 5.
IDEN includes 3 factors, new technology, patents and knowledge of
customers, shown in Table 3.8.
DEVE includes 3 factors, experience of store head, knowledge of store
head and understandable sequence of rales, shown in Table 3.8.
PROT includes 5 factors, repetitive activities, importance of product cost,
competitors, the store manager of sample firms is not involved in the
planning of strategic human capital management practices, and the store
manager of sample firms helps to operate the planning of strategic human
capital management practices, shown in Table 3.8.
DEPL includes 4 factors, the store manager of sample firms is responsible
for the planning of strategic human capital management practices,
managerial staffing process is important, extensive employee selection
process is necessary and selecting the best person is significant, shown in

143
Table 3.8.
CONT includes 3 factors, management control systems are highly tailored,
the financial goal of each store and standardized operating procedures and
working practices, shown in Table 3.9.
COMM includes 3 factors, coordination of the work, regular meeting
within stores and commurucation among stores, shown in Table 3.9.
TCIE includes 3 factors, market activities of competitors, extemal
environment and legal, political and regulatory constraints, shown in
Table 3.10.
ESAOS includes 3 factors, complexity of production process, flexibihty of
manufacturing and service-providing facilities and intensity of capital
equipment, shown in Table 3.10.
EM includes 4 factors, control of the price, control of the quality, variety
of products and cost control, shown in Table 3.10.
EP includes 2 factors, operational planning and decentralized decisions,
shown in Table 3.10.
CC includes 2 factors, employee's perception and sale clerks' friendliness,
shown in Table 3.11.
CS includes 2 factors, customers' recommendation and customers'
propensity to repurchase, shown in Table 3.11.
SRG means sales revenue growth.
NIBT means net income before tax.
GRROC means gross rate of retum on capital.
3.7 Reliability analysis
Confirmatory factor analysis (CFA) conducts statistical tests for hypothetical
equivalence of certain designated factor loading or hypothetical correlation among
factors. Generally, CFA is a kind of confirmatory test foUowing exploratory factor
analysis (EFA) (Joreskog and Sorbom, 1993).
Cronbach's a coefficient is currently the measure of rehabihty used most frequentiy
in the study of social science, and is a kind of rehabihty test to measure the "total" of
a set of synonymous or parallel measurements (Anderson and Gerbing, 1988). In

144
Other words, from responses to the questiormaire, variance of each score for each
question and variance for all total of questions can be calculated. If each question
measures the same dimension, variance of the total wiU be larger than the total of each
variance. As a matter of fact, variance of the sum for scores of two questions is
equivalent to the sum for variance of scores of two questions added with double
covariance. The ratio of sum for variance of each question to variance for the entire
set of questiormaire can be used to estimate the proportion of score variance provided
by these questions. This is the Cronbach's a coefficient used frequently as the
rehability index (Anderson and Gerbing, 1988). That is
N ^ SS.^ "^
a =•
N-1
1
S ^
\ /
Where Si indicates the variance of the ith question.
Sm indicates variance for sum of aU questions (i.e. variance for the entire set
of questiormaire),
N is the number of questions.
If each question measures the same dimension and all questions of each dimension are
reliable then a =l , i .e . ,
N-1
N
ESr
= 1
'm
Therefore, CFA used in this study aims directly at the whole factors given by the
integral (overall) dimensions as well as the relationship between each dimension so as
to inspect the validhy. CFA is a macro-inspection with its methods of inspection
having convergent validity and discriminant validity shown in Table 3-13.

145
Cronbach's a coefficient, however, which only aims directly at variable factors
given by individual (certain) dimension to conduct intemal consistency reliability, is a
micro-inspection. These are the reasons for deleting factors with poor consistency
shown in Table 3.12.
After conducting EFA, the next analytic step is to conduct the stractural equation
analysis of the theoretical and rival models. The stability and consistency of the
measuring tool are explored firstly by conducting reliability analysis on each
dimension, succeeded by an examination using the item-to-total method to delete
variable factors of each dimension with poor consistency (Joreskog and Sorbom,
1993). As noted by Nunnally (1978), a better result of the intrinsic consistency is
that a rehabihty coefficient is over 0.7, but no consistency if it is less than 0.35. The
less the number of variable factors the higher the reliability coefficient, and the higher
the coefficient, the better the intrinsic consistency. The optimal number of variable
factors, according to Anderson and Gerbing (1988), is between two and seven. Table
3.12 demonstrates the analytical results for the reliability analysis on each dimension.
In Table 3.12, each reliability coefficient is higher than 0.7 after deleting variable
factors with poor consistency. For example, referring to the first constract (strategic
HCMPs), the coefficient of the first dimension of this constract (PROT) can be
increased from 0.532253 to 0.761289 by deleting 14 items with poor rehability. The
coefficient of the second dimension (IDEN) can be increased from 0.664413 to
0.772248 by deleting 11 factors with poor reliability. The coefficient of the third
dimension (DEPL) can be increased from 0.592452 to 0.869792 by deleting 6 items
with poor reliabihty. However, the increase in the coefficient of the fourth
dimension (DEVE) is slight after deleting 11 factors with poor rehability.

146
Referring to the second constract (personnel control mechanisms), the coefficient of
the first dimension of this constract (CONT) increases slightly while deleting 9 items
with poor reliability. However, the increase in the coefficient of the second
dimension (COMM) is significant after deleting 11 factors with poor reliabihty (from
0.657676 to 0.788770).
Referring to the third constract (employee capabilities), both TCEE (the first
dimension) and ESAOS (the second dimension) increase slightly in their coefficients
after deleting items with poor reliability. However, the increases in the coefficients
of the last two dimensions (EM and EP) are significant (from 0.602147 to 0.783652
and from 0.644035 to 0.7617, respectively) after deleting 2 and 4 items with poor
rehabihty, respectively.
Referring to the fourth constract (customer loyalty), both CC (the first dimension) and
CS (the second dimension) increase greatly in their coefficients (from 0.481677 to
0.824188 and from 0.698522 to 0.9139, respectively) after deleting 2 items with poor
reliability individually. The resuhs after conducting reliabihty analysis on each
dimension and using the item-to-total method to identify rehable factors manifest no
factors can be further deleted due to poor reliabihty.
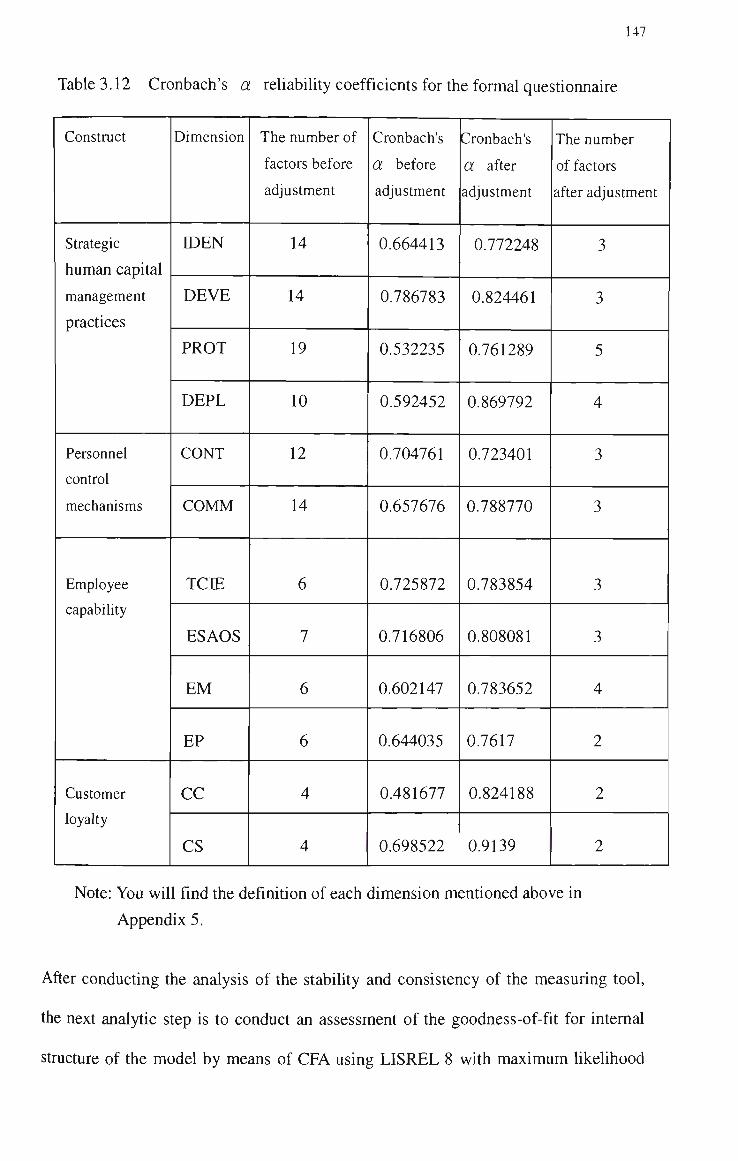
147
Table 3.12 Cronbach's a reliability coefficients for the formal questiormaire
Constmct
Strategic
human capital
management
practices
Personnel
control
mechanisms
Employee
capabiHty
Customer
loyalty
Dimension
IDEN
DEVE
PROT
DEPL
CONT
COMM
TCIE
ESAOS
EM
EP
CC
CS
The number of
factors before
adjustment
14
14
19
10
12
14
6
7
6
6
4
4
Cronbach's
a before
adjustment
0.664413
0.786783
0.532235
0.592452
0.704761
0.657676
0.725872
0.716806
0.602147
0.644035
0.481677
0.698522
Cronbach's
a after
adjustment
0.772248
0.824461
0.761289
0.869792
0.723401
0.788770
0.783854
0.808081
0.783652
0.7617
0.824188
0.9139
The number
of factors
after adjustment
3
3
5
4
3
3
3
3
4
2
2
2
Note: You will find the defirution of each dimension mentioned above in
Appendix 5.
After conducting the analysis of the stability and consistency of the measuring tool,
the next analytic step is to conduct an assessment of the goodness-of-fit for intemal
stracture of the model by means of CFA using LISREL 8 with maximum hkelihood
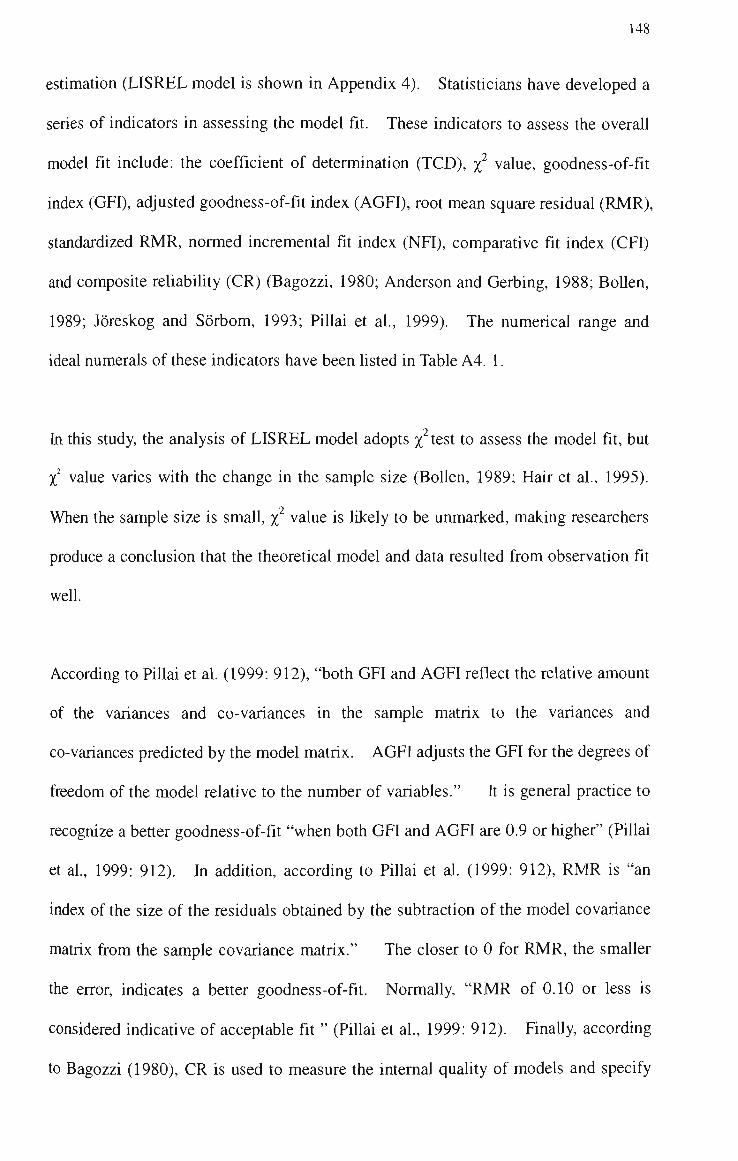
148
estimation (LISREL model is shown in Appendix 4). Statisticians have developed a
series of indicators in assessing the model fit. These indicators to assess the overall
model fit include: the coefficient of determination (TCD), -^ value, goodness-of-fit
index (GFI), adjusted goodness-of-fit index (AGFI), root mean square residual (RMR),
standardized RMR, normed incremental fit index (NFI), comparative fit index (CFI)
and composite rehability (CR) (Bagozzi, 1980; Anderson and Gerbing, 1988; BoUen,
1989; Joreskog and Sorbom, 1993; Pillai et al, 1999). The numerical range and
ideal numerals of these indicators have been listed in Table A4. 1.
In this study, the analysis of LISREL model adopts x test to assess the model fit, but
X value varies with the change in the sample size (BoUen, 1989; Hair et al, 1995).
When the sample size is small, % value is likely to be unmarked, making researchers
produce a conclusion that the theoretical model and data resulted from observation fit
well.
According to Pillai et al. (1999: 912), "both GFI and AGFI reflect the relative amount
of the variances and co-variances in the sample matrix to the variances and
CO-variances predicted by the model matrix. AGFI adjusts the GFI for the degrees of
freedom of the model relative to the number of variables." It is general practice to
recognize a better goodness-of-fit "when both GFI and AGFI are 0.9 or higher" (Pillai
et al., 1999: 912). hi addition, according to Pillai et al. (1999: 912), RMR is "an
index of the size of the residuals obtained by the subtraction of the model covariance
matrix from the sample covariance matrix." The closer to 0 for RMR, the smaUer
the error, indicates a better goodness-of-fit. NormaUy, "RMR of 0.10 or less is
considered indicative of acceptable fit " (PiUai et al, 1999: 912). Finally, according
to Bagozzi (1980), CR is used to measure the intemal quality of models and specify

149
how models fit the data reasonably well. It is general practice to recognize a better
goodness-of-fit when CR is 0.6 or higher (Bagozzi, 1980).
Table 3.13 demonstrates the analytical results for an assessment of the goodness-of-fit
for each dimension by using CFA. GFIs of other constracts are higher than 0.90
except for a poor GFI (0.88) of the constract, strategic human capital management
practices. AGFIs of other constracts are also higher than 0.90 except for poor AGFIs
of constracts, strategic human capital management practices (0.83) and personnel
control mechanisms (0.87). RMRs of all constracts are less than 0.10 (from 0.002 to
0.069). CRs of all dimensions of four multidimensional constracts are more than 0.6
(from 0.724 to 0.916). The resuhs shown in Table 3.13 feature a better
goodness-of-fit after conducting CFA. In other words, the theoretical model after
deleting factors with poor reliability seems to have an acceptable fit.
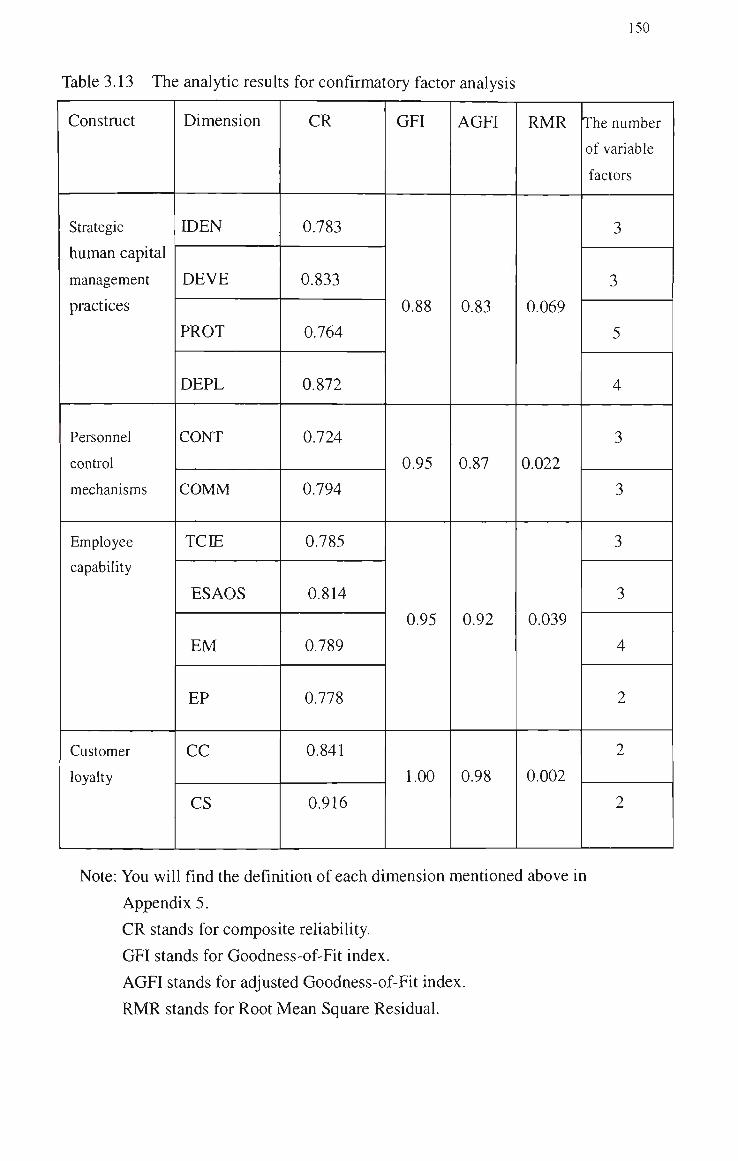
150
Table 3.13 The analytic results for confirmatory factor analysis
Constract
Strategic
human capital
management
practices
Personnel
control
mechanisms
Employee
capabihty
Customer
loyalty
Dimension
n)EN
DEVE
PROT
DEPL
CONT
COMM
TCEE
ESAOS
EM
EP
CC
CS
CR
0.783
0.833
0.764
0.872
0.724
0.794
0.785
0.814
0.789
0.778
0.841
0.916
GFI
0.88
0.95
0.95
1.00
AGFI
0.83
0.87
0.92
0.98
RMR
0.069
0.022
0.039
0.002
The number
of variable
factors
3
3
5
4
3
3
3
3
4
2
2
2
Note: You will find the definition of each dimension mentioned above in
Appendix 5.
CR stands for composite reliability.
GFI stands for Goodness-of-Fit index.
AGFI stands for adjusted Goodness-of-Fit index.
RMR stands for Root Mean Square Residual.

151
For each constmct mentioned in this study, according to Anderson and Gerbing (1988),
goodness-of-fit index (GFI) and adjusted goodness-of-fit index (AGFI) of 0.9 or
higher, and root mean square residual (RMR) of 0.10 or less, and composite reliability
index (CR) of 0.6 or higher are regarded as indicative of satisfactory resuhs for CFA.
Based on the results of Table 3.13, almost all indices fit the requirements of Anderson
and Gerbing (1988), and the optimal number of factors shown in Table 3.13 is
consistent with the one shown in Table 3.12. Therefore, the resuhs of CFA do not
conflict with those of EFA. The former provides a supplementary effect on the
analytic results of the latter Along this line of reasoning, the path diagram of the
acceptable results for CFA is displayed in the Figure 3.3. Each dimension of four
multi-dimensional constracts involves the optimal number of variable factors which is
satisfactory for proceeding the foUowing analyses shown in Chapter 4 (i.e.,
hierarchic regression analysis and nested-model analysis).

152
Figure 3.3 The path diagram of the analytic resuhs for confirmatory factor
analysis
Strategic human capital management practices
IDEN DEVE PROT DEPL
Personnel control mechanisms
CONT COMM
Employee capability
TCIE ESAOS EM EP
Customer loyalty
CC CS
Company's financial performance
SRG NIBT GRROC
Note: You will find the definition of each dimension mentioned above in
Appendix 5.
IDEN includes 3 factors, new technology, patents and knowledge of
customers, shown in Table 3.8, Table 3.12 and Table 3.13.
DEVE includes 3 factors, experience of store head, knowledge of store
head and understandable sequence of rales, shown in Table 3.8, Table 3.12
and Table 3.13.
PROT includes 5 factors, repetitive activities, importance of product cost,
competitors, the store manager of sample firms is not involved in the
planrung of strategic human capital management practices and the store
manager of sample firms helps to operate the plarming of strategic human
capital management practices, shown in Table 3.8, Table 3.12 and Table
3.13.
DEPL includes 4 factors, the store manager of sample firms is responsible
for the planning of strategic human capital management practices,

153
managerial staffing process is important, extensive employee selection
process is necessary and selecting the best person is significant, shown in
Table 3.8, Table 3.12 and Table 3.13.
CONT includes 3 factors, management control systems are highly tailored,
the financial goal of each store and standardized operating procedures and
working practices, shown in Table 3.9, Table 3.12 and Table 3.13.
COMM includes 3 factors, coordination of the work, regular meeting
within stores and communication among stores, shown in Table 3.9, Table
3.12 and Table 3.13.
TCIE includes 3 factors, market activities of competitors, extemal
environment and legal, political and regulatory constraints, shown in
Table 3.10, Table 3.12 and Table 3.13.
ESAOS includes 3 factors, complexity of production process, flexibihty of
manufacturing and service-providing facilities and intensity of capital
equipment, shown in Table 3.10, Table 3.12 and Table 3.13.
EM includes 4 factors, control of the price, control of the quality, variety
of products and cost control, shown in Table 3.10, Table 3.12 and Table
3.13.
EP includes 2 factors, operational planning and decentralized decisions,
shown in Table 3.10, Table 3.12 and Table 3.13.
CC includes 2 factors, employee's perception and sale clerks' friendliness,
shown in Table 3.11, Table 3.12 and Table 3.13.
CS includes 2 factors, customers' recommendation and customers'
propensity to repurchase, shown in Table 3.11, Table 3.12 and Table 3.13.
SRG means sales revenue growth.
NIBT means net income before tax.
GRROC means gross rate of retum on capital.
3.8 Validity analysis
Validity means ability to get the expected measurement or function of the measuring
tools. A valid measurement works to achieve the purpose of measurement to a vahd
degree. Constract validity means measuring the degree to which one measurement
can gauge an abstraction or pecuharity (Anderson and Gerbing, 1988). The
inspection of constract vahdity must be built on a specific rationale to guide each

154
basic hypothesis regardmg the potential pecuharity or behavioral performance
through the clarification of theory as well as to check if the measurement results are in
conformity to the contents of theoretical hypotheses through the empirical approaches,
and thus to test the convergent vahdity and discriminant vahdhy (Anderson and
Gerbing, 1988). The principle lies in the measurement of numbers of different
pecuharities done by numerous different approaches (e.g., self assessment and peer
assessment). The principles of judgment are as foUows.
(1) scores obtained from a measurement of the same peculiarities by the same
approaches shaU have the maximum correlation between them;
(2) scores obtained from a measurement of the same pecuharities by different
approaches shall have the correlation next to the maximum one between them;
(3) scores obtained from a measurement of the different peculiarities by the same
approaches shall have the lower correlation between them;
(4) scores obtained from a measurement of the different peculiarities by different
approaches shall have the lowest or meaningless correlation between them
(Anderson and Gerbing, 1988).
Based on these criteria, researchers are able to test for convergence and discrimination.
This study uses LISREL 8 to conduct convergent and discriminative validity for
examining the validity of the measuring dimensions used in the present research (all
the details are shown in Appendix 4). In the analysis of convergent validity, loading
and t-value of each dimension are used to judge the function of measuring tools.
From Table 3.14, t-value of load capacity for each dimension is over 2, reveahng a
considerable convergent validity of the measuring dimensions.

155
Table 3.14 The results of conducting convergent vahdity
Constract
Strategic
human capital
management
practices
Personnel
control
mechanisms
Employee
capability
Customer
loyalty
Dimension
IDEN
DEVE
PROT
DEPL
CONT
COMM
TCIE
ESAOS
EM
EP
CC
CS
Loading
0.71 -0.78
0.62-0.91
0.57 - 0.69
0.68-0.88
0.63 ~ 0.73
0.64 - 0.82
0.64 - 0.90
0.61 -0.91
0.66 - 0.75
0.69 - 0.90
0.74 - 0.95
0.88 - 0.96
T-value
9.66 - 9.78
10.03 -10.26
7.09 - 7.60
11.23-12.32
8.00- 8.20
9.69- 9.83
9.01 - 9.70
9.60- 9.69
9.39 - 9.67
7.20
10.59
16.39
Note: You will find the definition of each dimension mentioned above in
Appendix 5.
In the analysis of discriminative validity, yf difference test (Pillai et al, 1999) and
root mean square error of approximation (RMSEA) (Anderson and Gerbing , 1988)
are used to examine model fit and compare alternative models. According to PiUai
et al. (1999), "the ^ difference test examines the gain in predictive power in one

156
nested model over another in terms of the change in x given the change in the degree
of freedom of the model." However, the significance of a model's x statistic is not
used to assess its fit. Based upon the recommendation of Joreskog and Sorbom
(1993), between-model comparisons are conducted by means of the x difference test,
along with differences in the fit indices mentioned above and others. All of them are
further used for exanuning the nested-model analysis discussed in Chapter 4.
Table 3.15 demonstrates the results for the analysis of discrinunative validity on the
first constract of the present study, strategic human capital management practices.
Model (1-2) frees the relationship between IDEN and DEVE, model (1-3) frees the
relationship between IDEN and PROT, model (1-4) frees the relationship between
roEN and DEPL, model (2-3) frees the relationship between DEVE and PROT,
model (2-4) frees the relationship between DEVE and DEPL, model (3-4) frees the
relationship between PROT and DEPL. Referring to between-model comparisons,
the -i differences (57.71, 98.53, 53.36, 74.79, 90.43 and 75.59, respectively)
calculated on the basis of the theoretical model after deleting factors with poor
reliability are all significant (p < 0.01) given the changes in the degrees of freedom,
and the RMSEA differences show httle change (the RMSEA of the original model is
less than 0.1). Therefore, aU four dimensions (IDEN, DEVE, PROT and DEPL)
appreciably add to the predictive power of the constract, strategic human capital
management practices.

157
Table 3.15 Discriminative validity of strategic human capital management practices:
Model Goodness-of-Fit indicators for strategic human capital
management practices
Model
Original model
Model (1-2)
Model (1-3)
Model (1-4)
Model (2-3)
Model (2-4)
Model (3-4)
x' 264.07
321.78
362.60
317.43
338.86
354.50
339.66
df
84
85
85
85
85
85
85
X diff
—
57.71***
98.53***
53.36***
74.79***
90.43***
75.59***
dfdiff
—
P-value^
—
0.0000
0.0000
0.0000
0.0000
0.0000
0.0000
RMSEA
0.090
0.103
0.111
0.102
0.107
0.110
0.107
Note: 1. Original model is the adjusted theoretical model, deleting factors with poor
intemal consistency, which is related to strategic human capital
management practices including four dimensions [i.e., identifying strategic
human capital management practices (IDEN), developing strategic human
capital management practices (DEVE), protecting strategic human capital
management practices (PROT) and deploying strategic human capital
management practices (DEPL)].
2. Model (1-2) means freeing the relationship between IDEN and DEVE; Model
(1-3) means freeing the relationship between IDEN and PROT; Model (1-4)
means freeing the relationship between IDEN and DEPL; Model (2-3) means
freeing the relationship between DEVE and PROT ; Model (2-4) means freeing
the relationship between DEVE and DEPL; Model (3-4) means freeing
the relationship between PROT and DEPL.
3. X diff (the difference in X ^) is calculated on the basis of the original model;
dfdiff (the difference in df) is calculated on the basis of the original model.

158
4. ^P-value of X MI given dfdiff.
5.*P< 0.1 **P< 0.05 ***P< 0.01.
6. RMSEA: Root Mean Square Error of Approximation.
Table 3.16 demonstrates the results for the analysis of discriminative validity on the
second constract of the present study, personnel control mechanisms. Model (1-2)
frees the relationship between CONT and COMM. Referring to between-model
comparisons, the x difference (90.97) calculated on the basis of the theoretical model
after deleting factors with poor reliability is significant (p < 0.01) given the change in
the degree of freedom, and the RMSEA of model (1-2) becomes larger Therefore,
these two dimensions (CONT and COMM) appreciably add to the predictive power of
the constract, personnel control mechanisms.
Table 3.16 Discriminative validity of personnel control mechanisms: Model
Goodness-of-Fit indicators for persormel control mecharusms
Model
Original model
Model (1-2)
x' 41.91
132.88
df
8
9
X diff
—
90.97
dfdiff
—
1
P-value'
—
0.0000
RMSEA
0.127
0.228
Note: 1.Original model is the adjusted theoretical model, deleting factors with
poor intemal consistency, which is related to persormel control
mechanisms including two dimensions [i.e., the control factor of
personnel control mechanisms (CONT) and the
communication-coordination factor of personnel control mechanisms
(COMM)].
2. Model (1-2) means freeing the relationship between CONT and COMM.
3. X diff (the difference i n ^ ) is calculated on the basis of the original
model; dfdiff (the difference in df) is calculated on the basis of the original

159
model
4. ^P-value of X diff given dfdiff.
5.*P< 0.1 **P< 0.05 ***P< 0.01.
6. RMSEA: Root Mean Square Error of Approximation.
Table 3.17 demonstrates the results for the analysis of discriminative vahdity on the
third constract of the present study, employee capability. Model (1-2) frees the
relationship between TCIE and ESAOS, model (1-3) frees the relationship between
TCIE and EM, model (1-4) frees the relationship between TCIE and EP, model (2-3)
frees the relationship between ESAOS and EM, model (2-4) frees the relationship
between ESAOS and EP, model (3-4) frees the relationship between EM and EP.
Referring to between-model comparisons, the yf differences (46.20, 47.04, 67.54,
85.54, 85.30 and 59.17, respectively) calculated on the basis of the theoretical model
after deleting factors with poor reliability are all significant (p < 0.01) given the
changes in the degrees of freedom, and the RMSEA differences show little change
(the RMSEA of the original model is less than 0.1). Therefore, all four dimensions
(TCIE, ESAOS, EM and EP) appreciably add to the predictive power of the constract,
employee capability.

160
Table 3.17 Discriminative validity of employee capability: Model
Goodness-of-Fit indicators for employee capability
Model
Original model
Model (1-2)
Model (1-3)
Model (1-4)
Model (2-3)
Model (2-4)
Model (3-4)
x'
81.14
127.34
128.18
148.68
166.68
166.44
140.31
df
48
49
49
49
49
49
49
X diff
—
46.20***
47.04***
67.54***
85.54***
85.30***
59.17***
dfdiff
—
1
1
1
1
1
1
*P-value
0.0000
0.0000
0.0000
0.0000
0.0000
0.0000
RMSEA
0.051
0.078
0.078
0.088
0.095
0.095
0.084
Note: 1. Original model is the adjusted theoretical model, deleting factors with poor
intemal consistency, which is related to employee capability including four
dimensions [i.e., the change in environment (TCIE), employee skill and
organizational stracture (ESAOS), employee motivation (EM) and employee
productivity (EP)].
2. Model (1-2) means freeing the relationship between TCIE and ESAOS;
Model (1-3) means freeing the relationship between TCIE and EM; Model
(1-4) means freeing the relationship between TCIE and EP; Model (2-3)
means freeing the relationship between ESAOS and EM; Model (2-4) means
freeing the relationship between ESAOS and EP; Model (3-4) means freeing
the relationship between EM and EP.
3. X diff (the difference in X ) is calculated on the basis of the original model;
dfdiff (the difference in df) is calculated on the basis of the original model.
4.'P-value of X diff given dfdiff. 5. *P< 0.1 **P< 0.05 ***P< 0.01.
6. RMSEA: Root Mean Square Error of Approximation.

161
Table 3.18 demonstrates the resuhs for the analysis of discriminative vahdity on the
fourth constract of the present study, customer loyalty. Model (1-2) frees the
relationship between CC and CS. Referring to between-model comparisons, the y^
difference (336.38) calculated on the basis of the theoretical model after deleting
factors with poor reliability is significant (p < 0.01) given the change in the degree of
freedom, and the RMSEA of model (1-2) is much larger than that of original model.
Therefore, these two dimensions (CC and CS) appreciably add to the predictive power
of the constract, customer loyalty.
Table 3.18 Discriminative validity of customer loyahy: Model
Goodness-of-Fit indicators for customer loyahy
Model
Original model
Model (1-2)
x'
0.97
337.35
df
1
3
X diff
—
336.38***
dfdiff
—
2
^P-value
—
0.0000
RMSEA
0.000
0.650
Note:l. Original model is the adjusted theoretical model, deleting factors with poor
intemal consistency, which is related to customer loyahy including two
dimensions [i.e., customer complaint (CC) and customer satisfaction (CS)].
2. Model (1-2) means freeing the relationship between CC and CS .
3- X diff (the difference in X ) is calculated on the basis of the original model;
dfdiff (the difference in df) is calculated on the basis of the original model.
4. ^P-value of X diff given dfdiff.
5.*P< 0.1 **P< 0.05 ***P< 0.01.
6. RMSEA: Root Mean Square Error of Approximation.

162
3.9 Research limitations
In spite of seeking to meet the rigor required for the social science approach, the
process of this chapter is stiU hmited by the foUowing issues: limited resources,
response bias, the relevance of antecedent factors, Tobin's q and the objective of
survey-based research method. They are described as foUows.
(a) Limited to human power, financial resources and time, survey-based research is
conducted to those managers of marketing, production, financial affairs,
engineering, general management, and procurement or shop managers, derived
from a selection of the samples only covering 5 business groups and 265 stores.
(b) Part of answers may have a psychological response of defence or over-estimation
in the course of questionnaire, an inevitable and uncontrollable aspect of this
chapter
(c) For a discussion of the relevance of antecedent factors for employee capability in
general private enterprise organizations, the chapter takes four dimensions, i.e.,
the change in environment, employee skiU and organizational stracture, employee
motivation, and employee productivhy, rather than factors of organization focus
(e.g., enterprise and organization scale, industry type) and personal focus (e.g.,
personahty, resignation rate, and job demand) in order to avoid a too large
framework that would not focus on the exploration of the subjects.
(d) Tobin's q, in the present study, was intended to be used to measure the value added
by management originally and the logarithm of Tobin's q was anticipated to be
calculated by dividing the market value of a firm by the replacement cost of its

163
assets (Hirschey and Wichem, 1984; HaU, 1993). However, this measurement
was omitted to conform to the content of the constract "company financial
performance" by taking store managers' and senior executives' views into
account.
(e) While the limitations of the survey-based research method have received much
attention in the literature (e.g., response bias), the contributions that the
survey-based research method has made to management accounting thought have
now and then been treated with disdain. It is argued that the apparent revulsion
for certain research methods lies not in the intrinsic hmitations that a research
method possesses (and all research methods have limitations), but that
puzzlement exists among management accounting researchers because of the
failure to understand the objective of a particular research method. Suffice it
to say that "the case-based research method aims at developing or modifying a
theory and / or providing the researcher with a basis to develop new or improved
research questions whereas the objective of survey-based research method is to
make generalizations across the sample population" (Abemethy et al, 1999).
Notes
1. Tailored design, proposed by Dillman (2000), takes features of the survey situation
into account, and is a system of interconnected procedures for conducting
high-quality mail surveys with a greatly improved potential to obtain acceptable
response rates. According to Dillman (2000), "the elements of tailored design
include two pans. The first part is to make out each phase of the survey process
that may be concerning either the quality or quantity of response and to profile
each one in such a way that helps obtain the best possible responses. The second

164
one aims at systematizing the survey efforts so that the design intentions can be
achieved in full detail".
2. According to Hirschey and Wichem (1984) and Hall (1993), Tobin's q is a
measure of the value added by management. However, based on the views of
senior executives of sample firms in the interviews, as a result of being not as
greatly affected by depreciation or other non-cash transactions, gross rate of
retum on capital is a better measure of accounting profits than the traditional
retum on assets or retum on equity.
3. To pilot test the measures, 150 teachers in Lu-Liow Junior High were contacted by
telephone in order to find out whether their relatives were store managers who
were willing to participate in the study. A questionnaire was sent to 60 teachers
whose relatives were store managers and orally agreed to participate. Thus, I
asked 60 store managers in no way affiliated with the sample firms mentioned in
this study to fill out the survey and to comment on the appropriateness of its
wording and length and to evaluate different question orders.

165
Chapter 4 The analysis for the moderating and
intervening effects and research results
4.1 Introduction
The discovery of moderated relationships can come about intentionaUy or
coincidentally. When they occur deliberately, the researcher has usuaUy anticipated
the possibihty that a relationship may be moderated. On the other hand, the finding
of moderated relationships can arise unexpectedly when the researcher conducts a test
for an intervening variableV It is intended in this study to investigate whether the
moderated relationship between strategic human capital management practices
(HCMPs) and employee capability caused by personnel control mechanism can occur
by design. And how the moderated effect brings a consequence to the intervening
relationship between employee capability and financial performance of firms
implementing strategic HCMPs?
This chapter aims at applying appropriate statistical analysis to the data acquired from
a survey-based formal questionnaire, as noted in Chapter 3, for further analysis so as
to verify the moderating and intervening effects postulated in the hypotheses of the
present study. All results of statistical analysis are given in the foUowing seven
sections for further discussion.
Section 1 features the stractural analysis of sample data that focuses on an
understanding of the distribution of individual attributes of common method factors
by employing descriptive statistical analysis.
166
Section 2 centres on the correlation analysis between each dimension of four
constracts that looks for a thorough grasp of the mean, standard deviation and
cortelation coefficient of the dimensions of each constract as weU as conduct a
comprehensive judgment on the results.
Section 3 concerns the analysis of causal relationships between strategic HCMPs and
employee capabihty.
Section 4 refers to the analysis of the moderating effect for personnel control
mechanisms, aiming at an exploration into the moderating effect of personnel control
mechanisms on the relationship between strategic HCMPs and employee capability.
Section 5 brings out the prehminary analysis for the intervening effect involving the
causal relationships between employee capability and customer loyalty, the causal
relationships between customer loyalty and financial performance of the organization,
the causal relationships between employee capability and financial performance of the
organization, the causal relationships between the application of strategic HCMPs and
customer loyalty and the causal relationships between the application of strategic
HCMPs and financial performance of the orgaruzation.
Section 6 centres on the nested-model analysis for exploring the intervening effect,
not only focusing on a discussion on the intervening effect of employee capability but
also aiming at an exploration into the intervening effect of customer loyalty.
Section 7 highhghts the assessment and correction of theoretical models.

167
4.2 Structural analysis of sample data
According to field interviews (in-depth visits) in this study, each branch (store) of the
sample firms constitutes an individual profit centre with its own profit and loss
statement. The manager of each branch (store) has fuU decision-making authority on
its jurisdictional domain while they also give authority to subordinates as large as
possible, thus bringing the system of decentrahzation into the best effect. But the
head office retains domination by centrahzing issues concerning investment and
finance.
Branches (Stores) draw up budget reports annually and submit them to the head office
for examination. While those reports must be revised for any impropriety each
branch (store) acts upon those budgets being finalized. Those budgets, of course,
can be altered if within the total amount of the budget while the manager of each
branch (store) is able to regulate the amount within the budget. Generally, each
manager can increase or decrease 10% to each budgetary item but requires approval
by a senior executive one level higher if over 10%.
Each branch (store) of sample firms rehes on one team of highly-institutional
managerial control personnel who are in charge of observing the normahty of
production line for each department, particularly the financial aspects of the unit such
as indirect production expenses, inventory and accounts receivable, etc. In case of
any abnormahty, audit personnel of the company conduct an inspection. Managerial
control personnel such as store managers must fill out loss and profit figures for
which they are responsible on monthly statements, and then have the statements sent
to senior managers and CEOs-

168
At the time of implementing their duty, store managers would have the greatest
support from the board of directors while both board of directors and president
consider those managers to do indispensable tasks for the sake of a smooth execution
of the decentralized control system.
Inhiative of the company has been triggered ever since the exercise of the practices of
management control mentioned above that increase output and product quahty as well
as profit year by year and further reveals the practices to be successful. The
organized institution of each branch (or store) of sample firms not only improves
subordinates' initiative and activeness but also mitigates managers' working pressure.
This study takes the store heads in computer technology manufacturing, mechanical
manufacturing, life insurance, eating and drinking, tourism and wholesale of
constraction materials (such as sale of tile) industries as objects of research, and the
analysis of the basic data for the samples examined is given in the following tables.
From Table 4.1 to Table 4.4, the frequency column refers to the number of cases in
each demographic category. The valid percent column is the percentage adjusted for
any missing cases. In Table 4.1, sample data indicate that 160 males taking 60.4 %
and 105 females taking 39.6% were surveyed with ages centring on 25 - 35 (79
persons, taking 29.8 %), foUowed by 36 - 45 and 46 - 55 (74 persons, taking 27.9%
and 73 persons, taking 27.5% respectively).
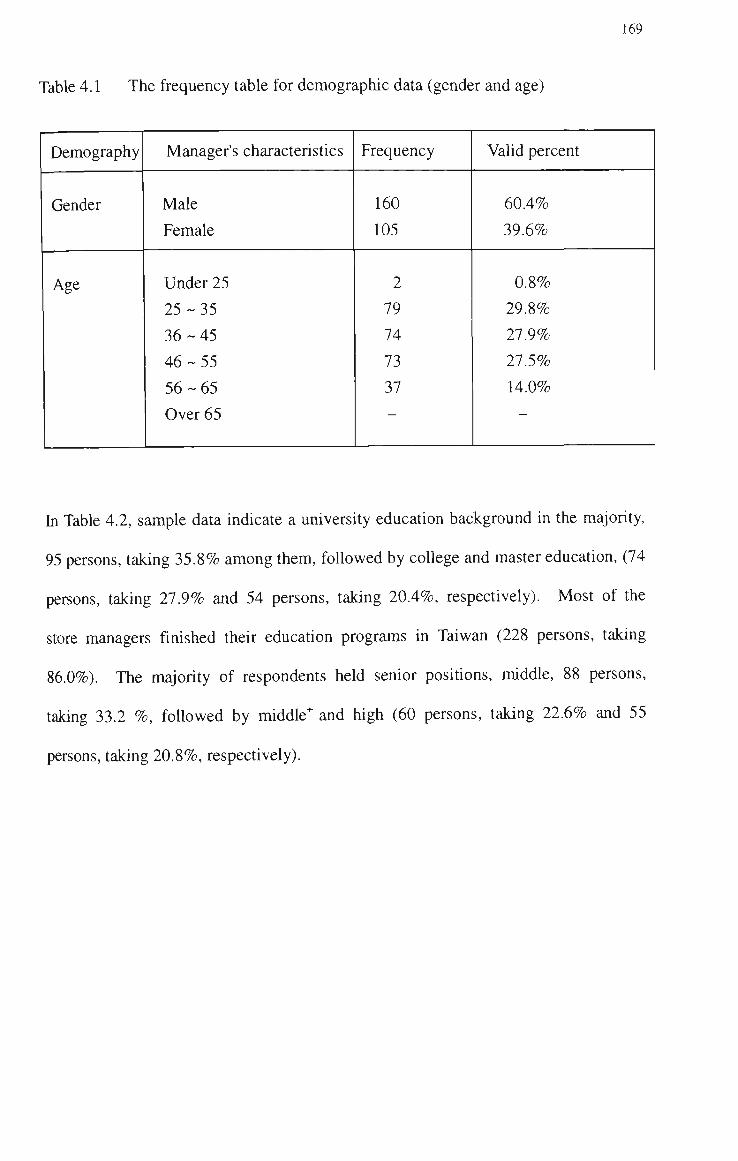
169
Table 4.1 The frequency table for demographic data (gender and age)
Demography Manager's characteristics Frequency Valid percent
Gender Male
Female
160
105
60.4%
39.6%
Age Under 25
2 5 - 3 5
3 6 - 4 5
4 6 - 5 5
5 6 - 6 5
Over 65
2
79
74
73
37
0.8%
29.8%
27.9%
27.5%
14.0%
In Table 4.2, sample data indicate a univershy education background in the majority,
95 persons, taking 35.8% among them, followed by college and master education, (74
persons, taking 27.9% and 54 persons, taking 20.4%, respectively). Most of the
store managers finished their education programs in Taiwan (228 persons, taking
86.0%). The majority of respondents held senior positions, middle, 88 persons,
taking 33.2 %, followed by middle^ and high (60 persons, taking 22.6% and 55
persons, taking 20.8%, respectively).

170
Table 4.2 The frequency table for demographic data (education and poshion)
Demography
The highest
level of
education
achieved
The country
for achieving
the highest
level of
education
The hierarchy
the manager
is
Manager's characteristics
Senior middle school
College
University
Master
Ph.D.
Taiwan
USA
UK
Australia
Other
Middle
Middle^
High
Middle^
Low^+
Low"
Low
Frequency
34
74
95
54
8
228
17
12
4
4
88
60
55
48
10
3
1
Valid percent
12.8%
27.9%
35.8%
20.4%
3.0%
86.0%
6.4%
4.5%
1.5%
1.5%
33.2%
22.6%
20.8%
18.1%
3.8%
1.1%
0.4%
In Table 4.3, sample data indicate an average 15 years of work experience in current
position ranging from 11 to 20 years in majority (73 persons, taking 27.5 %) with
marketing background being dominant, 100 persons, taking 37.7% among them,
followed by general administration (74 persons, taking 27.9 %). Most store
managers did not receive foreign training (188 persons, taking 70.9 %). hi this study,
work experience in curtent position is expected to have an influence on employee
productivity.

171
Table 4.3 The frequency table for demographic data (background, years of work experience in curtent position and foreign training)
Demography
Background
Years of work
experience in
current
position
Foreign
training
Manager's characteristics
Marketing (Sales)
Production
Accounting
Finance
Engineering
General administration
Purchasing
Other
Less than 3
3 - 5
6 - 1 0
11 - 2 0
More than 20
Yes
No
Frequency
100
22
9
22
12
74
3
23
30
71
70
73
21
77
188
Valid percent
37.7%
8.3%
3.4%
8.3%
4.5%
27.9%
1.1%
8.7%
11.3%
26.8%
26.4%
27.5%
7.9%
29.1%
70.9%
Table 4.4 also provides the data on the number of employees and five categories are
employed. There are 120 stores (taking 45.3% of valid percent among those
surveyed) with more than 60 employees, followed by another 69 (taking 26.0%) with
less than 15 employees. In addition, sample data in Table 4.4 indicate that there are
186 stores (taking 70.2% of valid percent among those surveyed) with paid-up
registered capital of more than NT$ 100,000,000.00, foUowed by another 21 (taking
7.9%) having paid-up registered caphal of NT$ 20,010,000.00 - $50,000,000.00l
With regard to regular improvement programs there are 256 stores building their
relationships with customers and suppliers that take a vahd percent of 96.9% and 246
are characterized by comprehensive training taking 93.2%. In respect of sales

172
revenue, there are 106 stores (taking 40.8% of vahd percent) enjoying more than
NT$100,000,000.00 in 2001, followed by another 37 (taking 14.2%) havmg the sales
revenue of NT$5,010,000.00-10,000,000.00l
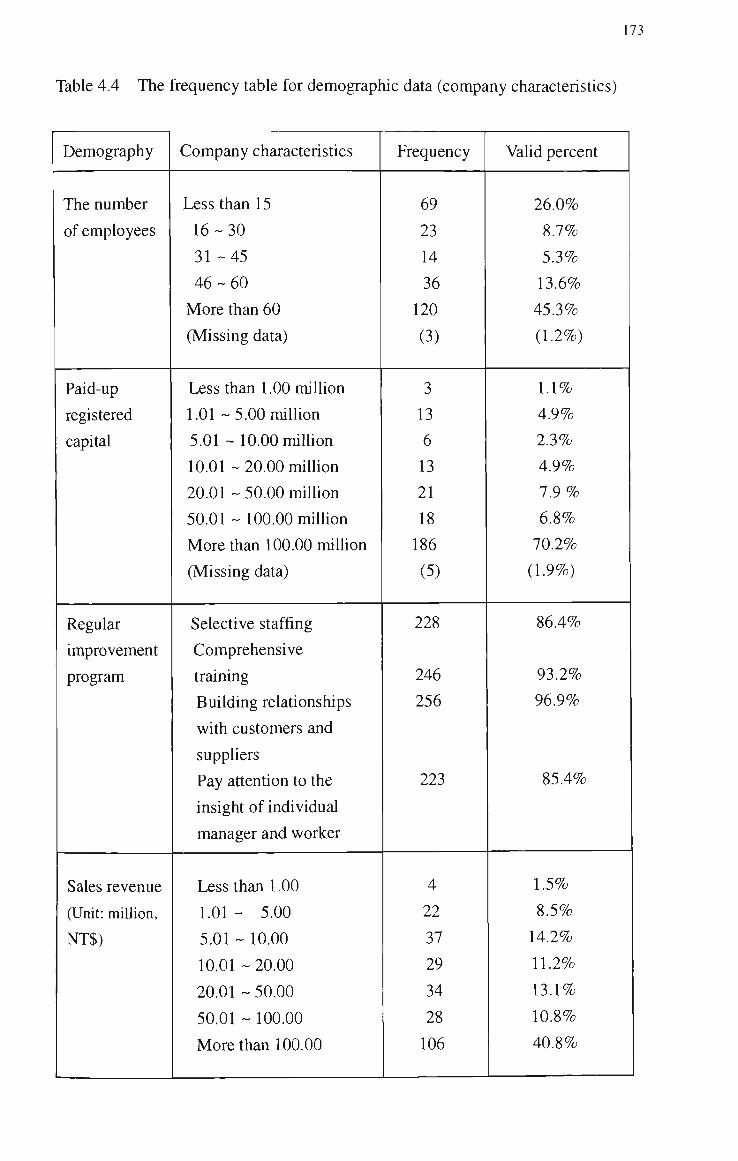
173
Table 4.4 The frequency table for demographic data (company characteristics)
Demography
The number
of employees
Paid-up
registered
capital
Regular
improvement
program
Sales revenue
(Unit: million,
NT$)
Company characteristics
Less than 15
1 6 - 3 0
31 - 4 5
4 6 - 6 0
More than 60
(Missing data)
Less than 1.00 million
1.01 -5.00 million
5.01 - 10.00 million
10.01 - 20.00 million
20.01 - 50.00 miUion
50.01 - 100.00 million
More than 100.00 miUion
(Missing data)
Selective staffing
Comprehensive
training
Building relationships
with customers and
suppliers
Pay attention to the
insight of individual
manager and worker
Less than 1.00
1.01 - 5.00
5.01 - 10.00
10.01 - 20.00
20.01 - 50.00
50.01 - 100.00
More than 100.00
Frequency
69
23
14
36
120
(3)
3
13
6
13
21
18
186
(5)
228
246
256
223
4
22
37
29
34
28
106
Valid percent
26.0%
8.7%
5.3%
13.6%
45.3%
(1.2%)
1.1%
4.9%
2.3%
4.9%
7.9%
6.8%
70.2%
(1.9%)
86.4%
93.2%
96.9%
85.4%
1.5%
8.5%
14.2%
11.2%
13.1%
10.8%
40.8%

174
4.3 The correlation analysis between each dimension of four constructs
According to field interviews (in-depth visits) with seruor executives of THFVQ one
of the sample firms in this study, one of the important experiences contributing to a
success of THFVG's fast food service focuses on the tactics of 'speed is a soldier's
asset', i.e., high efficiency on work. The comments on the subject of strategic
HCMPs were as follows.
" The stores of THFVG adopt the practice of "self-service" featuring putting
all foods inside lower box and paper cup that is convenient for customers to
take; clerks behind the counter are in charge of two or more tasks concurrently
while customers will feel expedient at all times as just one queue is required
to get the desired foods. To save customers' time, no public telephone or
jukebox is set inside the store. Revolving rate of dining tables is thus
greatiy enhanced as people seldom loiter in the store and occupy seats.
'Swiftness' has turned out to be THFVG's operating master-stroke while speed
is dominant here just to make swiftness stand out."
The foUowing statement comes from GISG's (one of the sample firms in this study)
2000 President's Letter
"Opportunity that is precious in such an intensively competitive society
would be hardly to get back in case of being missed while its
existence is time-limited and shall never wait on the spot forever.
Some opportunities are transient as time flies. Consequently,
an immediate catch and a prompt action are indispensable that aUow
175
neither delay nor hesitancy."
According to the letter mentioned above, h is important that taking existing products
and services to new customers and markets as weU as findmg new apphcations for
existing products are desirable routes for GISG for growing sales revenue.
A review of CWTG's (one of sample firms in this study) 2000 President's Letter
indicates:
" Strategic human capital management practices are related to technological
advances. The CWTG employees' intelligence, creativity and passion for
excellence have made CWTG the market leader that it is today."
In CWTQ store managers must work with clerks to transfer managerial knowledge.
Leaming complex forms of managerial knowledge and improving clerks' intelligence,
creativity and passion for excellence require face-to-face interactions between store
managers and clerks. In CWTQ store managers and clerks are usually assigned to
teams that work on major projects for clients and store managers' knowledge and
capabilities are leveraged and clerks gain store-specific knowledge. Leveraging
human capital management practices of store managers helps create value for stores.
The stractural equation related to the techtucal question mentioned above can be
described as follows. This study dealt with this problem by means of LISREL
model mentioned in Chapter 4 and Appendix 4. According to Hitt et al. (2001),
leverage was defined as the total number of clerks in a firm divided by the total
number of store managers. This measurement indicates the average number of
clerks assigned to each store manager It represents the stracture of the primary
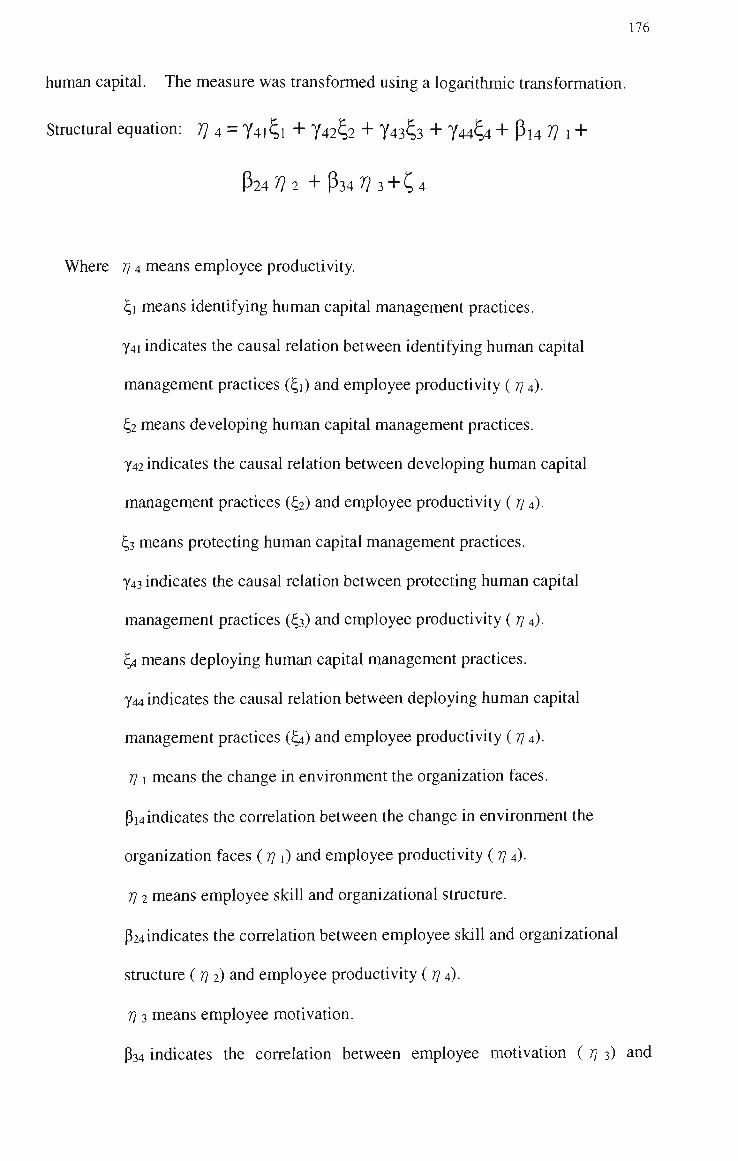
176
human capital. The measure was transformed using a logarithmic transformation.
Stractural equation: T] 4 = 741^1 + 742^2 + Y43^3 + 7 4 4 ^ + Pl4 ^ 1 +
h^Vl + p 3 4 7?3 + C4
Where r} 4 means employee productivity.
i i means identifying human capital management practices.
741 indicates the causal relation between identifying human capital
management practices (^1) and employee productivity ( rj 4).
^2 means developing human capital management practices.
742 indicates the causal relation between developing human capital
management practices (^2) and employee productivity (7? 4)-
^3 means protecting human capital management practices.
743 indicates the causal relation between protecting human capital
management practices (( 3) and employee productivity (rj 4)-
^ means deploying human capital management practices.
744 indicates the causal relation between deploying human capital
management practices (^) and employee productivity (77 4).
rj 1 means the change in environment the orgaruzation faces.
Pi4 indicates the correlation between the change in environment the
organization faces (7] 1) and employee productivity ( n 4).
n 2 means employee skill and organizational stracture.
1324 indicates the correlation between employee skiU and organizational
stracture (77 2) and employee productivity (7? 4)-
7} 3 means employee motivation.
P34 indicates the correlation between employee motivation ( 7? 3) and

177
employee productivity (77 4).
C, 4 indicates the residual error of the stractural equation mentioned above.
One purpose of this chapter is to discover how strategic HCMPs influence the
financial performance of the organization, and how personnel control mechanisms
moderate the relationship between strategic HCMPs and employee capabihty. The
descriptive statistics of the dimensions used in the hypothesis tests are shown in Table
4.5. The coUinearity diagnostics, including the variance inflation factors , all
indicate that multi-coUinearity is not a problem. Table 4.5 contains the means,
standard deviations, and maximum and minimum values of each dimension of four
muhi-dimensional constracts used in the present study along with their correlations.
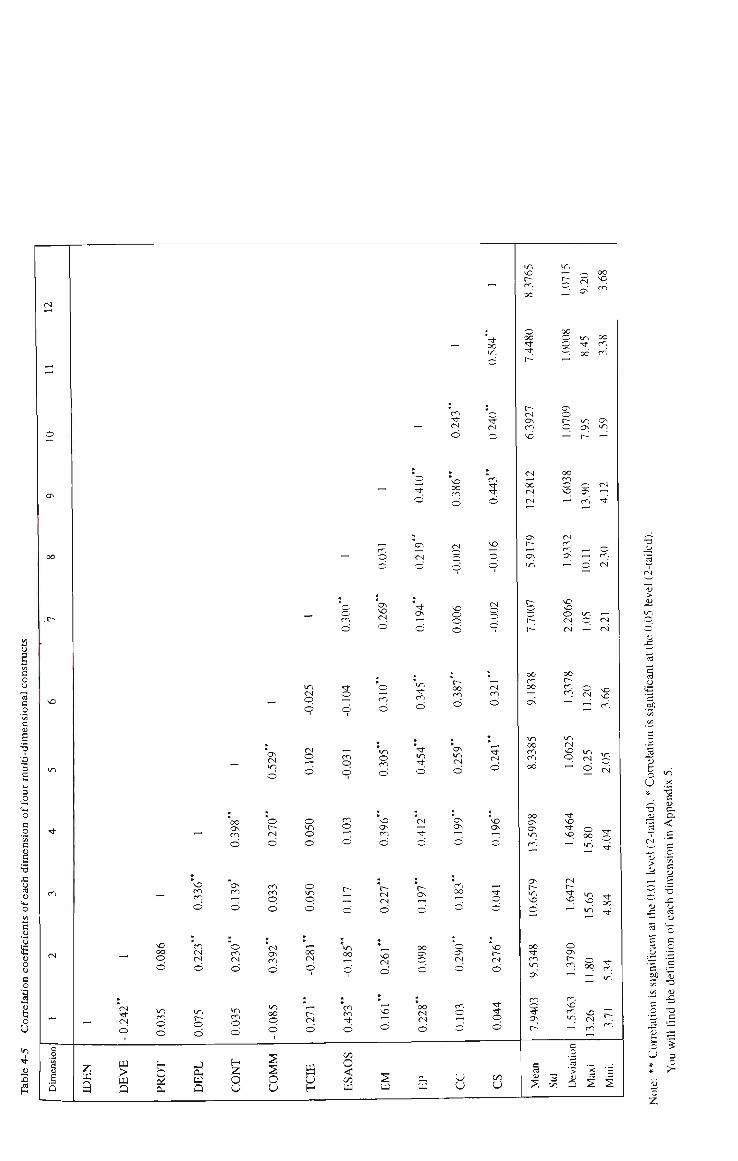
c o u
-a p
c
e '•B
3
3
T3
!E u o o c o
1 o
u 4
(2
o
VO 0 0 m O
<s o
194
o
006
o
i n <S
o o
0 0 O N
O
CTv
o
§ o
031
o
o O
en o
o
ON
454
o
259
o
5 ON ON
033
o
050
o
227
o
197
o
VO 0 0
o o
en CS ( N
o
o m <N
O
» cn o
.242
o 1
^ w o
>/-l m O o
O OS cu
W-)
o o
w u
o d
00
o
oo
^
O
OO ON
o o
o ON (N
—
H Z O u
8
m
-* o
C/3
O < an W
NO
' ' o
s LL!
oo CNJ
d
a,
ND
d
NO O N
^ ^
00
NC r -
00
oo ON O N
ON
r-
t n o «* 0 \
f n
t ^ CM ON m NO
ON
^ r— O
—
i n ON
r-
ON 1/)
—
443
o
0 0 CS <N
603
— N
o CS
—N r n • *
ON
ON t n
O
r-t^
CN)
r", ON
. — 1
ND ND O CS CS
_ .- ^
m, o
^
o cf. ( N
^ CS CN
S 2
vel
(2
(U
o o
oo cn 00 I — '
oo r-cn f<~i NO
NC
CS
o
338
oo
.062
"-•
CN
O
NO 5 q
— vri
( N
NO v o
IT)
NO r~ <N o
00 l i en «~)
o ON
t~- •~1 0C3 en
NO CS
2 u
u
Cl.
<
o "> r:
ca
f :
! u
c
yy r/)
C
« Q
u * *
i : o - 1 tu
"c
c o ' c
-o fl»
•B T3
'-?
TZH
:S 3
^

179
Table 4.5 shows the mean, standard deviation, maximum, minimum and Pearson
correlation coefficients of each dimension of four multi-dimensional constracts used
in the present study For computer technology manufacturing, mechanical
manufacturing, life insurance, eating and drinking, tourism, and wholesale of
constraction materials industries, the mean for the dimension IDEN is lower than the
mid-point, revealing a not-so-high level of IDEN but stiU with this phenomenon
existing. In addition, the mean for the dimension ESAOS never scores higher than
the mid-point, but is in close proximity to the nud-point, reveahng a not-so-high level
of ESAOS but still with this dimension present.
Next, DEPL scores the highest point, with a mean in 13.5998 as well as a standard
deviation in 1.6464, in the constract of strategic human capital management practices
(HCMPs). This means that the most important basis of strategic HCMPs originates
from the dimension of DEPL. In addition, COMM scores the highest point, with the
mean in 9.1838 and a standard deviation in 1.3378, in the constract of personnel
control mechanisms, showing the communication-coordination factor of personnel
control mechanisms is more important than the control factor Moreover, EM scores
the highest point, with a mean in 12.2812 as well as a standard deviation in 1.6038, in
the constract of employee capabihty. This means that the major source of employee
capability comes from the dimension of EM. Finally, in the constract of customer
loyahy, CS scores higher than CC. The former has a mean in 8.3765 and a standard
deviation of 1.0715. This means that the primary emergence of customer loyahy
resuhs from the dimension of CS (see Appendix 6).
In addition, correlations between each dimension of four multi-dimensional constracts
are as follows.

180
l.The correlation of strategic HCMPs and employee capability
ft is evident from Table 4.5 that two dimensions of strategic HCMPs present
significant correlations with each dimension of employee capability in addition to
the insignificant correlations of DEVE and EP, PROT and TCIE, PROT and ESAOS,
DEPL and TCIE, DEPL and ESAOS, showing that identifying and developing
strategic HCMPs have significant effects on employee capabihty.
2. The correlation of personnel control mechanisms and employee capability
As we leam from Table 4.5 each dimension of personnel control mecharusms
presents positive and significant correlations with two dimensions of employee
capabihty such as EM and EP, displaying that both the control factor and the
communication-coordination factor of personnel control mechanisms have
significant effects on employee motivation and productivity.
3. The correlation of strategic human capital management practices and customer
loyahy
It can be learned from Table 4.5 that each dimension of strategic human capital
management practices presents a marked positive correlation with each dimension
of customer loyalty besides IDEN and CC, IDEN and CS, as well as PROT and CS.
4. The correlation of employee capabihty and customer loyalty
ft is evident from Table 4.5 that two dimensions of employee capabihty have
significantly positive correlation with each dimension of customer loyalty besides
TCIE and ESAOS thus revealing overaU that each dimension of strategic human
capital management practices results in considerable increases in EM and EP
besides DEVE and EP, and consequently have a significant effect on CC and CS
besides TCIE and ESAOS. It is perceived that causal relationships among

181
dimensions of these three constracts (i.e., strategic human capital management
practices, employee capability and customer loyalty) are close.
In cortelation analysis, though a comprehensive judgment can be conducted on the
relation between each dimension of the four constracts mentioned in this study, results
of hypothetical inference in this research are stiU required to be further examined by
other statistical methods. Accordingly, the present study employs hierarchic
regression analysis and the LISREL model to help verify the causal relations between
dimensions of the four multi-dimensional constracts.
4.4 The causal relationship between strategic human capital management practices and employee capability
The literature review mentioned in Chapter 2 and the correlation analysis noted in the
preceding section show marked correlations between each dimension in this study.
For a further understanding of the causal relationship between strategic HCMPs and
employee capability, regression analysis is applied in this section. Findings from the
regression analysis, as stated in Table 4.6, indicate that all four dimensions of strategic
HCMPs have evident interpretative capabihty on each dimension of employee
capability such as the change in environment, employee skill and organizational
stracture, employee motivation and employee productivity while R are 0.782, 0.590,
0.914 and 0.520, respectively, as specified in Table 4.6.

182
Table 4.6 The causal relationship between strategic human capital management
practice and employee capabihty
x. dependent x^riable
independem\ variable \^
IDEN
DEVE
PROT
DEPL
R2
F
TCIE
yS
0.839
.
t
11.940*
.
0.782
60.841***
ESAOS
/3
.
0.704
.
t
7.308*
0.590
24.467***
EM
/3
0.161
-0.189
0.966
t
2.136*
-4.280*
19.374*
0.914
180.153***
EP
/3
0.477
0.289
t
2.681*
2.454*
0.520
18.387***
Note: *p<0.05 **p<0.01 ***p<0.001 Insignificant /3 coefficient is indicated by a dot. You wiU find the definition of each variable mentioned above in Appendix 5.
The regression analysis, as specified in Table 4.7, shows that strategic human capital
management practices have marked effects on the dimensions of employee capabihty.
The causal relation for each dimension of employee capabihty is as foUows.
1. UDEN has a marked positive effect on TCIE, ESAOS, EM and EP (/3are 0.168,
0.377, 0.143 and 0.189, respectively; p values are less than 0.01, 0.001, 0.05 and
0.01, respectively), thus revealing overaU that there is a strong causal relationship
between identifying human capital management practices and employee capabihty
2. DEVE has a marked effect on TCIE and EM (/3 are -0.185 and 0.279,
respectively; p values are less than 0.01 and 0.001, respectively), thus indicating
that developing human capital management practices has marked effects on
employee motivation and the change in environment.
3. DEPL has evident positive effects on ESAOS, EM and EP (/3 are 0.197, 0.254 and

183
0.302, respectively; p values are less than 0.01, 0.001 and 0.001, respectively),
thus showing that deploying human caphal management practices has noticeable
effects on employee skiU and organizational stracture, employee motivation and
employee productivity.
4. Dummy variable, strate, produces distinct positive effects on TCIE and ESAOS
(/3 are 0.185 and 0.175, respectively; all p values are less than 0.01), thus revealing
overall that initiating the idea of strategic human capital management practices has
obvious effects on employee skill and organizational stracture as well as the
change in environment.
5. Dummy variable, product, has marked negative effects on TCIE, ESAOS, EM and
EP (/3are -0.182, -0.152, -0.129, -0.190 and -0.120, respectively; p values are
less than 0.01, 0.01, 0.05, 0.01 and 0.05, respectively), thus indicating that new
products marketed by the industry during the past five years have had negative
impacts on each dimension of employee capability.
6. Dummy variable, percent, has evident positive effects on TCIE and ESAOS (/3 are
0.263, 0.160 and 0.228, respectively; p values are less than 0.001, 0.01 and 0.001,
respectively), thus showing that comprehensive training procedures have
perceptible effects on employee skill and organizational stracture and the change
in environment.
7. Dummy variable, expense, produces clear positive effects on ESAOS (/3 are
0.176, 0.130, 0.140 and 0.124, respectively; p values are less than 0.01, 0.05, 0.05
and 0.05, respectively), thus indicating that money spent on comprehensive

184
training has discernible effects on employee skill and organizational stracture.
8. Dummy variable, cost, has evident negative effects on TCIE and ESAOS (^ are
-0.140 and -0.139, respectively; all p values are less than 0.05), thus making
known overall that not viewing comprehensive training programs as an investment
has obvious negative effects on employee skill and orgaruzational stracture as well
as the change in environment.
9. Dununy variable, planrung, has marked negative effects on TCIE (/3are -0.487,
-0.455, -0.611 and -0.410, respectively; p values are less than 0.001, 0.01, 0.01 and
0.01, respectively), thus showing that setting the type of armual budget for the life
of the corporate plan of strategic human capital management practices has
recognizable negative effects on the change in environment.
10. Dummy variable, time, has evident effects on ESAOS and EM (ySare -0.170 and
0.219, respectively; p values are less than 0.01 and 0.001, respectively), thus
showing that time spent on leaming firm-specific knowledge of products and
customers for a newly hired manager with experience in the industry has an
obvious positive effect on employee motivation but negative impact on employee
skiU and organizational stracture.
11. Dununy variable, imple, has marked negative effects on ESAOS and EP (/Sare
-0.176, -0.163 and -0.209, respectively; p values are less than 0.01, 0.01 and 0.001,
respectively), thus indicating that meagre implementation of strategic human
capital management practices has obvious negative effects on employee
productivhy and employee skill and organizational stracture.

185
12. Dummy variable, duties, produces a distinct negative effect on EP (/3is -0.152; p
value is less than 0.01), thus showing that repetitious managerial duties have
evident unhelpful effects on employee productivhy.
There is a great deal of intrinsic consistency within the organizational stracture
regarding the formulation of business strategy and human resource management
control and intemal strategy conununication.
(1) On talents' cuhivation, many store managers in CWTG and JKMIG (two of
sample firms in this study) just stress clerks' on-the-job training and new clerks'
pre-vocational training but neglect making clerks on their proper positions.
Mentoring and helping clerks leam tacit knowledge require an effective balance
in the process of leveraging human capital management practices. Too many
clerks working on projects with too few store managers may not provide the
face-to-face interactions needed to transfer tacit knowledge. On the other
hand, clients want to be sure that experienced knowledgeable store managers are
fuUy involved in their work.
Inappropriateness on management control of human capital management
practices will damage clerks' potential. ft is efficient for leveraging human
capital to use specialized complementary assets. Relationships with specific
clients can represent a specialized complementary asset (Hitt et al., 2001). In
this study, leveraging human capital involves integrating the relationship with a
client and the specialized human capital.
Stractural equations related to the technical question mentioned above can be

186
described as foUows. This study deah whh this problem by means of LISREL
model mentioned in Chapter 4 and Appendix 4.
Stractural equation 1:
?? 2 = Y21^1 + 722^2 + 723^3 + T24?4 + Pl2 ?? I + P32 ^ 3 + P42 ?7 4
+ C2
Where 7? 2 means employee skiU and organizational stracture.
^1 means identifying human capital management practices.
721 indicates the causal relation between identifying human capital
management practices (^1) and employee skill and organizational
stracture (ij 2).
t,2 means developing human capital management practices.
722 indicates the causal relation between developing human capital
management practices (^2) and employee skill and organizational
stracture (rj 2)-
^3 means protecting human capital management practices.
723 indicates the causal relation between protecting human capital
management practices (^3) and employee skiU and organizational
stracture (7? 2).
^ means deploying human capital management practices.
724 indicates the causal relation between deploying human capital
management practices (^) and employee skill and organizational
stracture (7? 2)-
7j 1 means the change in environment the orgaruzation faces.
187
Pi2indicates the correlation between the change m environment the
organization faces { rj \) and employee skill and organizational
stracture (rji).
7j 3 means employee motivation.
(332 indicates the correlation between employee skiU and
organizational stracture (7? 2) and employee motivation (77 3).
Tj 4 means employee productivity.
p42 indicates the correlation between employee skill and
organizational stracture (7/2) and employee productivity (7? 4).
^ 2 indicates the residual error of stractural equation 1 mentioned
above.
Stractural equation 2:
57 6 = 761^1 + 762^2 + 763^3 + 764^4 + (3l6 7? 1 + (326 7? 2 + P36 ^ 3
+ P46^4+P56^5+C6
Where 7? 6 means customer satisfaction.
^1 means identifying human capital management practices.
761 indicates the causal relation between identifying human capital
management practices (^1) and customer satisfaction (rj e).
^2 means developing human capital management practices.
762 indicates the causal relation between developing human capital
management practices (^2) and customer satisfaction (rj ^).
^3 means protecting human capital management practices.
763 indicates the causal relation between protecting human capital

management practices ( 3) and customer satisfaction (77 6)-
^ means deploying human capital management practices.
764 indicates the causal relation between deploying human capital
management practices (^) and customer satisfaction (ij e).
Tj 1 means the change in environment the organization faces.
pi6indicates the correlation between the change in environment the
organization faces (TJ \) and customer satisfaction (rj e)-
Tj 2 means employee skill cmd organizational stracture.
p26 indicates the correlation between employee skill and
organizational stracture ( rj 2) and customer satisfaction (7? 6)-
ri 3 means employee motivation.
36 indicates the correlation between employee motivation (7/3) and
customer satisfaction (77 6).
Tj 4 means employee productivity.
p46indicates the correlation between employee productivhy (rjA)
and customer satisfaction (7? 6)-
Tj 5 means customer complaint.
p56 indicates the cortelation between customer complaint (7? 5) and
customer satisfaction (7? 6)-
^ 6 indicates the residual ertor of stractural equation 2 mentioned
above.
(2) hi JKMIG (one of sample firms in this study), diversification into new
geographic regions provides the opportunhy to leam about new chents,
new service markets, and potential new resources. The movement
into new services and geographic markets can create economies of

189
scope. Furthermore, firms can achieve economies of scope from
service diversification by effectively using intemal resources,
particularly human caphal. hi JKMIQ to achieve economies of
scope often requires effective coordination across service areas and an
ability to configure the resources in ways that help meet chents' needs.
Thus, store managers with significant experience may be needed to
provide the critical managerial skills necessary to manage human
resources and achieve the economies of scope.
Hitt et al. (2001: 17) suggested that "operating in multiple service and
geographic markets simultaneously provides the opportunity for
multipoint competition, whereby a fhm is able to take actions against
competitors in multiple markets." In other words, using existing
human capital to move into new geographic markets may present
special opportunities to gain a competitive advantage. For example, a
firm may exploit existing client relationships with current store
managers to move into a new geographic market. Thus, human
capital can be used to facilitate the development and implementation of
both service and geographic diversification.
This study measured service diversification using a Herfindahl index
(Hitt et al , 2001). In other words, the service diversification
Herfindahl index was calculated by working out the sum of squares of
the proportion of total store managers in the five largest practice areas
of each sample firm. As this value is inversely related to service
diversification (high values indicate lower diversification), the value of

190
the variable was subtracted from 1. A similar Herfindahl index was
used to measure geographic market diversification. This mdex was
calculated for the proportion of store managers in the four largest
branch locations (in separate cities). Stractural equations related to
the technical question mentioned above can be described as foUows.
This study deah with this problem by means of LISREL model
mentioned in Chapter 4 and Appendix 4.
Structure equation 1:
V 5 = 751^1 + 752^2 + 753^3 + 754^4 + Pl5 7? 1 + P25 7? 2 + P35 ^ 3
+ P 4 5 ^ 4 + P 6 5 ^ 6 + C 5
Where rj 5 means customer complaint.
1 means identifying human capital management practices.
751 indicates the causal relation between identifying human capital
management practices (^1) and customer complaint (7/5).
h,2 means developing human capital management practices.
752 indicates the causal relation between developing human capital
management practices (1 2) and customer complaint (7? 5).
^3 means protecting human capital management practices.
753 indicates the causal relation between protecting human capital
management practices (^3) and customer complaint (rj 5).
t^ means deploying human capital management practices.
754 indicates the causal relation between deploying human capital
management practices (^) and customer complaint (rj 5)-

191
Tj 1 means the change in environment the organization faces.
Pi 5 indicates the correlation between the change in environment the
organization faces (771) and customer complaint (77 5).
Tj 2 means employee skill and organizational stracture.
P25 indicates the correlation between employee skiU and organizational
stracture (jj 2) and customer complaint (ij 5).
Tj 3 means employee motivation.
P35 indicates the correlation between employee motivation ( 7? 3) and
customer complaint (7? 5).
7} 4 means employee productivity.
P45 indicates the correlation between employee productivity ( 77 4) and
customer complaint (77 5).
Tj 6 means customer satisfaction.
P65 indicates the correlation between customer complaint ( 7? 5) and
customer satisfaction (rj e)-
^ 5 indicates the residual error of stractural equation 1 mentioned above.
Stracture equation 2:
^ 6 = 761^1 + 762^2 + 763^3 + 764^4 + P16 ?7 1 + P26 ?? 2 + P36 ^ 3
+ p46 7?4+p56^5+C6
Where TJ e means customer satisfaction.
1 means identifying human capital management practices.
761 indicates the causal relation between identifying human caphal
management practices ( 1) and customer satisfaction (77 6)-

192
^2 means developing human capital management practices.
762 indicates the causal relation between developing human caphal
management practices (^2) and customer satisfaction (TJ e)-
^3 means protecting human caphal management practices.
763 indicates the causal relation between protecting human capital
management practices (^3) and customer satisfaction (77 e)-
^ means deploying human capital management practices.
764 indicates the causal relation between deploying human capital
management practices (^) and customer satisfaction (TJ e)-
Tj 1 means the change in environment the organization faces.
P16 indicates the correlation between the change in environment the
organization faces (771) and customer satisfaction (77 6)-
77 2 means employee skill and organizational stracture.
P26 indicates the correlation between employee skill and organizational
stracture (77 2) and customer satisfaction (TJ e)-
Tj 3 means employee motivation.
P36 indicates the correlation between employee motivation (77 3) and
customer satisfaction (77 e)-
77 4 means employee productivity.
p46 indicates the correlation between employee productivity (77 4) and
customer satisfaction (77 e)-
?7 5 means customer complaint.
P56 indicates the correlation between customer complaint ( Tj 5) and
customer satisfaction (77 6)-
(, 6 indicates the residual error of stractural equation 2 mentioned above.

193
Stracture equation 3:
V 1 = 771^1 + 772^2 + 773^3 + 774^4 + Pl7 ^ 1 + P27 ^ 2 + P37 7/ 3
+ P47 7 y 4 + P 5 7 ^ 5 + P 6 7 ^ 6 + C 7
Where 77 7 means company's financial performance.
t,i means identifying human caphal management practices.
771 indicates the causal relation between identifying human capital
management practices (^1) and company's financial performance (77 7).
^2 means developing human capital management practices.
772 indicates the causal relation between developing human caphal
management practices (^2) and company's financial performance (77 7).
^3 means protecting human capital management practices.
773 indicates the causal relation between protecting human capital
management practices (^3) and company's financial performance (77 7).
^ means deploying human capital management practices.
774 indicates the causal relation between deploying human capital
management practices (^) and company's financial performance (7? 7).
771 means the change in environment the orgaruzation faces.
Pi7 indicates the correlation between the change in environment the
organization faces (TJ i) and company's financial performance (77 7).
77 2 means employee skill and organizational stracture.
P27 indicates the correlation between employee skill and orgaruzational
stracture (77 2) and company's financial performance (Tj 1).
Tj 3 means employee motivation.
P37 indicates the correlation between employee motivation (77 3) and
company's financial performance (7? 7)-
194
77 4 means employee productivity.
p47 indicates the correlation between employee productivhy (77 4) and
company's financial performance (77 7).
77 5 means customer complaint.
p57 indicates the correlation between customer complaint (775) and
company's financial performance (77 7).
77 6 means customer satisfaction.
P67 indicates the correlation between customer satisfaction (77 e) and
company's financial performance (77 7).
C, 7 indicates the residual error of stractural equation 3 mentioned
above.
As noted earlier. Hypothesis 1 indicates that employee capabilities in firms relying on
personnel control mechanisms increase as a result of paying more attention to
strategic human capital management practices. It includes the following two parts.
(1) the intervening relationship between strategic human capital management
practices and employee capability (Figure 4.1); and
(2) the moderating effect of personnel control mechanisms on the relationship
between strategic human capital management practices and employee capabihty.

195
Figure 4.1 The intervening relationship between strategic human capital management
practices and employee capability
Strategic human capital
management practices Employee
capability
h is evident from the discussion above that part (1) of hypothesis 1 gains adequate
support.
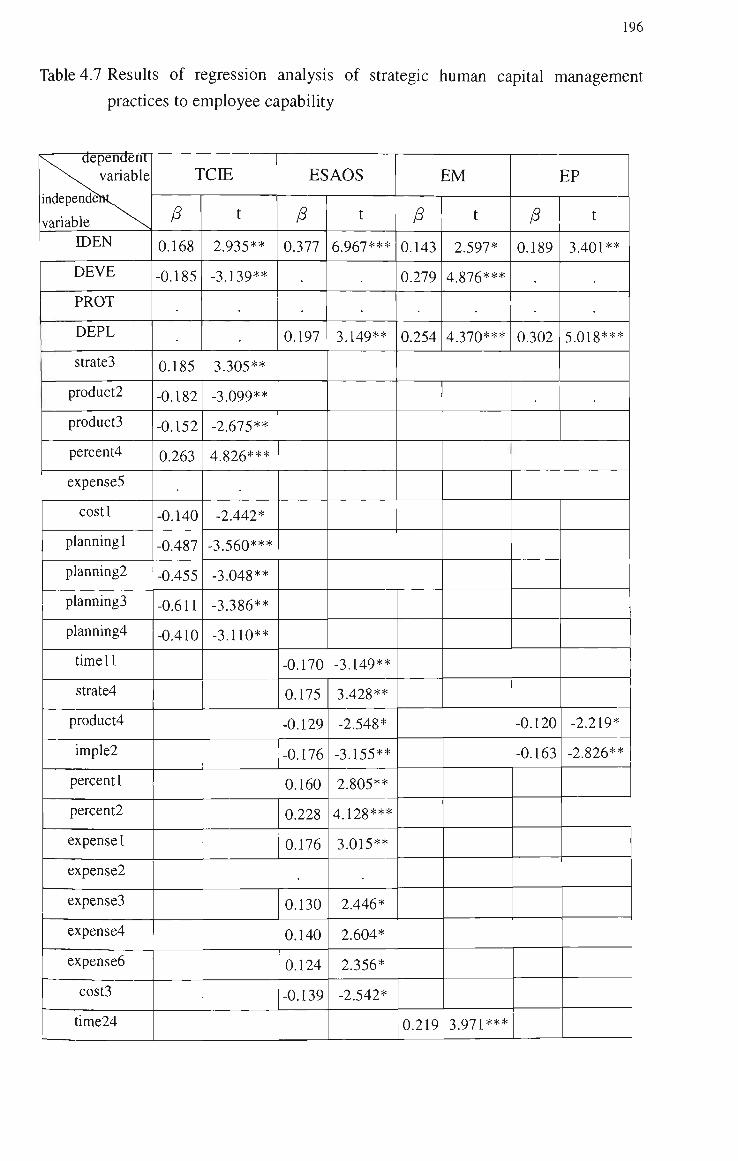
196
Table 4.7 Resuhs of regression analysis of strategic human capital management practices to employee capability
N^ dependent ^ \ variable
indepen(feht
variable ^^ IDEN
DEVE
PROT
DEPL
strateB
product2
products
percent4
expenses
costl
planning 1
planningl
planningS
planning4
time 11
strate4
product4
imple2
percent 1
percent2
expense1
expense2
expenses
expense4
expense6
costs
time24
TCIE
/S
0.168
-0.185
0.185
-0.182
-0.152
0.263
-0.140
-0.487
-0.455
-0.611
-0.410
t
2.9S5**
-S.139**
S.305**
-3.099**
-2.675**
4.826***
-2.442*
-S.560***
-S.048**
-3.S86**
-S.llO**
ESAOS
/3
0.377
0.197
-0.170
0.175
-0.129
-0.176
0.160
0.228
0.176
0.130
0.140
0.124
-0.1S9
t
6.967***
3.149**
-3.149**
S.428**
-2.548*
-S.155**
2.805**
4.128***
3.015**
2.446*
2.604*
2.356*
-2.542*
EM
/3
0.143
0.279
0.254
0.219
t
2.597*
4.876***
4.370***
S 971***
EP
/3
0.189
.
0.S02
-0.120
-0.163
t
3.401**
5.018***
-2.219*
-2.826**

197
Table 4.7 Results of regression analysis of strategic human capital management
practices to employee capability (continued)
^vdependent X^ariable
independent N. variable \ ^
strate2
product 1
duties
imple3
F
R^
TCIE
^ t
8.079***
0.319
ESAOS
/3 t
10.633***
0.413
EM
/5
.
-0.190
t
-3.473**
15.930***
0.307
EP
^
-0.152
-0.209
t
-2.797**
-3.731***
12.695***
0.312
*P<0.05
**P<0.01
***P<0.001 Insignificant /3 coefficient is indicated by a dot. You wiU find the definition of each dimension of employee capability and strategic HCMPs mentioned above (TCIE, ESAOS, EM, EP, IDEN, DEVE, PROT and DEPL) in Appendix 5. strate (dummy variable): Who initiates the idea of strategic human caphal
management practices?(strate2: accounting / financial managers, strate3: production
managers, strate4: customer service managers)
product (dummy variable): How many kinds of products have been marketed during
the past five years by your industry? (product 1: less than one, product2: one to five,
product3: six to ten, product4: eleven to fifteen)
percent (dummy variable): What percentage of employees has received training last
year?
(percentl: less than 1%, percent2: 1% ~ 10%, percent4: 21% ~ 30%)
expense (dummy variable): How much money is spent on training program in your
unit? (expensel: less than 1,000, expense2: 1,001-2,000, expense3: 2,001-3,000,
expense4: 3,001-4,000 expense5: 4,001-5,000, expenseb: 5,001-6,000, unit: NT$)
cost (dummy variable): Employee training is viewed as a cost or as an investment?
(costl: viewed as a cost, cost3: neither a cost nor an investment)
planning (dununy variable): Annual budget fits with the deployment of strategic
human capital management practices (planning 1: agree). The development of
strategic human capital management practices went according to corporate business
strategy (planning 2: agree). The deployment of strategic human capital
management practices went according to corporate plan last year (planning 3: agree).
The protection of strategic human capital management practices went according to

198
corporate business strategy last year (planning 4: agree).
time (dummy variable): How much time will it take for a newly hired store manager
to leam firm-specific tasks necessary to be as effective as present store managers?
(timet 1: less than one month) How much time is required for a newly hired
manager with experience to become familiar with firm-specific knowledge of your
products and customers? (time24: three to four months)
imple (dummy variable):How successful the implementation of strategic human
capital management practices is? (imple2: poor, imple3: average)
duties (dununy variable): Are managerial duties in your organization repetitious?(yes:l)
4.5 The analysis for the moderating effect of personnel control mechanisms
To verify moderated relationships between strategic human capital management
practices (HCMPs) and employee capability caused by personnel control mechanisms,
hierarchic regression analysis including the following steps is adopted in this section to
observe the moderating effect to each dimension of employee capability. Findings
from the hierarchic regression analysis are shown in Table 4.8 and 4.9.
Step 1 (Model 1), taking individual attributes as the control variables;
Step 2 (Model 2), adding the predicted variables of strategic HCMPs;
Step 3 (Model 3), further adding the interactive values of personnel control mechanisms
and strategic HCMPs, as well as calculating the partial F testing value (Model 3 vs.
Model 2).

199
Table 4.8 Hierarchic regression analysis for exploring the relationship between
strategic human capital management practices and employee capability
moderated by the control factor of personnel control mechanisms
\ . dependent x^riable
independeiibv variable \ ^
Stepl (Model 1):
Common method
factor
age
edl
ed2
rank
ba
train
employ
capital
owner2
or 1
or 2
formul
formu2
formu3
impro2
impro3
impro4
com
R2
Step2 (Model 2):
Predictors
CONT
IDEN
DEVE
PROT
DEPL
R2
AR2
TCIE
/3
0.208
.
0.195
0.235
0.277
0.215
t
2.142*
2.089*
3.008*
3.730*
2.086*
.
.
.
0.363
,
0.435
0.490
2.731*
3.130*
0.904
0.541***
ESAOS
/S
-0.372
-0.438
0.588
.
t
-3.158*
-3.914*
.
2.415*
0.396
1.211
,
5.043*
0.830
0.434***
EM
/5
0.087
0.136
0.144
t
2.113*
3.481*
2.656*
0.314
-0.203
-0.213
0.931
-2.208*
-2.546*
11.292*
0.959
0.645***
EP
/5
0.087
t
2.310*
0.324
1.157
-0.283
13.958*
-3.674*
0.950
0.626***
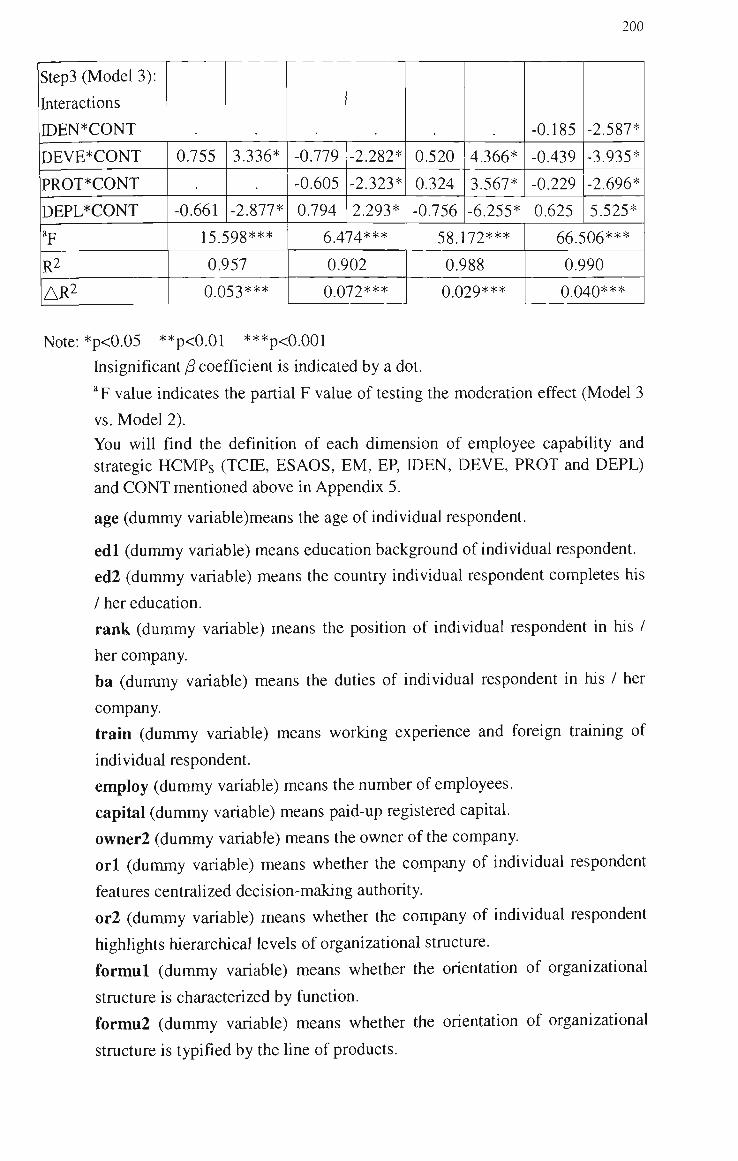
200
Step3 (Model 3):
Interactions
IDEN*CONT
DEVE*CONT
PROT*CONT
DEPL*CONT
ap
R2
A R 2
0.755
-0.661
3.336*
-2.877*
15.598***
0.957
0.053***
-0.779
-0.605
0.794
-2.282*
-2.323*
2.293* 5.474***
0.902
0.072***
0.520
0.324
-0.756
4.366*
3.567*
-6.255*
58.172***
0.988
0.029***
-0.185
-0.439
-0.229
0.625
-2.587*
-3.935*
-2.696*
5.525*
66.506***
0.990
0.040***
Note: *p<0.05 **p<0.01 ***p<0.001
Insignificant /3 coefficient is indicated by a dot.
^F value indicates the partial F value of testing the moderation effect (Model 3
vs. Model 2). You will find the definition of each dimension of employee capabihty and strategic HCMPs (TCIE, ESAOS, EM, EP, IDEN, DEVE, PROT and DEPL) and CONT mentioned above in Appendix 5.
age (dummy variable)means the age of individual respondent.
edl (dummy variable) means education background of individual respondent.
ed2 (dummy variable) means the country individual respondent completes his
/ her education.
rank (dummy variable) means the position of individual respondent in his /
her company.
ba (dummy vsuiable) means the duties of individual respondent in his / her
company.
train (dummy variable) means working experience and foreign training of
individual respondent.
employ (dummy variable) means the number of employees.
capital (dummy variable) means paid-up registered capital.
owner2 (dummy variable) means the owner of the company.
orl (dummy variable) means whether the company of individual respondent
features centralized decision-making authority.
or2 (dummy variable) means whether the company of individual respondent
highlights hierarchical levels of organizational stracture.
formul (dummy variable) means whether the orientation of organizational
stracture is characterized by function.
formu2 (dununy variable) means whether the orientation of organizational
stracture is typified by the line of products.
201
formu3 (dummy variable) means whether the orientation of organizational
stracture is underhned by geographical areas.
impro2 (dummy variable) means whether regular improvement programs
draw attention to comprehensive training of employees.
impro3 (dummy variable) means whether regular improvement programs
underscore the edifice of the relationships with customers and supphers.
impro4 (dummy variable) means whether regular improvement programs pay
attention to the suggestion of store managers.
com (dummy variable) means the percentage of sales revenue coming from
three largest competitors in the industry.
Findings from the hierarchic regression analysis are as foUows.
1. The results of the hierarchic regression analysis for the relationships between
strategic HCMPs and employee capabihty moderated by the control factor of
personnel control mechanisms are shown in Table 4.8. Of the four dimensions of
strategic HCMPs, PROT and DEPL contribute significantly in explaining TCBE.
PROT maintains a significant (positive) relation with ESAOS in the regression
equation after the common method variance is partialled out. DEVE, PROT and
DEPL contribute significantly in explaining EM. DEPL maintains a significant
(negative) relation with EP in the regression equation.
2. Table 4.8 shows that the interaction of DEVE and CONT has marked effects on each
dimension of employee capability ( /3 are 0.755, -0.779, 0.520 and -0.439,
respectively; all p values are less than 0.05). The interaction of DEPL and CONT
has marked effects on each dimension of employee capability (/3are -0.661, 0.794,
-0.756 and 0.625, respectively; all p values are less than 0.05).
The preceding regression analysis resuhs reveal that DEVE, PROT and DEPL have
distinguished effects on dimensions (TCIE, ESAOS, EM and EP) of employee

202
capabihty (Table 4.6). However, DEPL brings evident effects to TCIE, EM and EP
of employee capability by observing the Model 2 (/S= 0.490, 0.931 and -0.283,
respectively; all p values are less than 0.05), and a buffer effect is produced (/3 =
-0.661, 0.794, -0.756 and 0.625, respectively; aU p values are less than 0.05) by
adding the moderating variable of personnel control mechanisms. This reveals that
the causal relationship between developing HCMPs and employee motivation is
strongly moderated by the control factor of personnel control mechanisms, and that
the causal relationship between deploying HCMPs and employee productivhy is
strongly moderated by the control factor of personnel control mechanisms.
However, the direction of the moderating effect caused by the control factor of
personnel control mechanisms on the causal relationship between deploying HCMPs
and employee motivation reverses the original order The moderated relationship
between deploying HCMPs and the change in environment also reverses the direction.
3. The interaction of IDEN and CONT has an evident negative effect on EP (^is
-0.185; p value is less than 0.05). The preceding regression analysis results reveal
that IDEN has distinct positive effects on each dimension of employee capability
(Table 4.7). However, DEVE brings insignificant effects to dimensions of employee
capabUity by observing the Model 2 (/S= -0.018, 0.182, 0.170 and 0.028, respectively;
all p values are larger than 0.05), and a buffer effect is produced (/3 = -0.185; p values
is less than 0.05) by adding the moderating variable of personnel control mecharusms.
This reveals that the causal relationship between developing HCMPs and employee
productivhy is moderated by the contiol factor of personnel control mecharusms, but
the moderation effect reverses the original order.
203
4. The interaction of PROT and CONT has marked effects on ESAOS, EM and EP (/5 =
-0.605, 0.324 and -0.229, respectively; aU p values are less than 0.05). The preceding
regression analysis resuhs reveal that PROT does not have significant effects on each
dimension of employee capability (Table 4.7). However, PROT brings evident
effects to TCIE, ESAOS and EM of employee capabihty by observing the Model 2
(/3= 0.435, 1.211 and -0.213, respectively; aU p values are less than 0.05), and a
buffer effect is produced on ESAOS, EM and EP (/3= -0.605, 0.324 and -0.229,
respectively; aU p values are less than 0.05) by adding the moderating variable of
personnel control mechanisms. This reveals that the relationship between protecting
HCMPs and employee motivation is strongly moderated by the control factor of
personnel control mecharusms.
But the direction of the moderating effect caused by the control factor of personnel
control mechanisms on the relationship between protecting HCMPs and employee
skiU and organizational stracture reverses the original order In addhion, the
moderating relationship between protecting HCMPs and the change in environment
becomes weak and insignificant. Finally, the causal relationship between protecting
HCMPs and employee productivity is strongly moderated by the control factor of
personnel control mechanisms unexpectedly.
5. Findings from the hierarchic regression analysis indicate that aU dimensions of
strategic HCMPs have evident interpretative capabihty on each dimension of
employee capability such as the change in environment, employee skill and
organizational stracture, employee motivation and employee productivhy while R are
0.904, 0.830, 0.959 and 0.950, respectively, as shown in Table 4.8. The mcrements
of R are 0.053, 0.072, 0.029 and 0.040, respectively, when taking the interactions of
204
UDEN and CONT DEVE and CONT PROT and CONT as well as DEPL and CONT
into account, hi each instance, the test statistic (F) for R^ is significant. The
associated F-tests displayed in Table 4.8 also indicate that significant additional
variance is explained with respect to each dhnension of employee capabihty. In
other words, the third step (Model 3) in the hierarchic regression analysis reveals that
the interactions, overaU, explain additional variances.
6. h is evident from Table 4.8 that dununy variable, ba, has a positive effect on EP (/5 is
0.087; p value is less than 0.05), thus reveahng that there is a causal relationship
between the duties of individual respondents in his / her company and employee
productivity. Next, dummy variable, or2, has an evident positive effect on TCIE (/3
is 0.195; p value is less than 0.05), thus showing that there is a causal relationship
between organizational stracture highhghting hierarchical levels and the change in
environment surrounding the organization.
In addition, dummy variable, formul, has evident effects on TCEE, ESAOS and EM
(/5are 0.235, -0.372 and 0.087, respectively; aU p values are less than 0.05), thus
reveahng that there is a causal relationship between the orientation of orgaruzational
stracture drawing attention to function and the change in environment surrounding the
organization, employee skill and organizational stracture, and employee motivation.
Dummy variable, formu2, has effects on TCIE, ESAOS and EM as well (^are 0.277,
-0.438 and 0.136, respectively; all p values are less than 0.05), thus showing that there
is a strong causal relationship between the orientation of orgaruzational stracture
underscoring the line of products and the change in environment surrounding the
organization, employee skill and organizational stracture, and employee motivation.
205
Dummy variable, formu3, has evident positive effects on TCIE and EM too (yS are
0.215 and 0.144, respectively; all p values are less than 0.05), thus reveahng that there
is a causal relationship between the orientation of orgaruzational stracture giving
emphasis to geographical areas and the change in environment the orgaruzation faces
as well as employee motivation.
FinaUy, dummy variable, impro3, has an evident positive effect on ESAOS (/3 are
0.588; p values is less than 0.05), thus showing that there is a strong causal
relationship between regular improvement programs underscoring the relationships
with customers plus suppliers and employee skill plus organizational stracture.
As regards the negative relationship between DEPL and EP shown in Table 4.8, one
senior executive of CWTG made the following comments.
"The deployment of human capital management practices is one key factor
if human resources can be effectively apphed. Several important issues
shah be taken into account: first, store managers must actuahy
implement the management of human resources according to long-term
business strategy of our company; second, a selection of proper talents must
meet the current requirement of human resources in our company; third, the
operating process and management control of our company must reach a result
of 'No talent is to be wasted, land should be fully utihzed, the utihty of things
should be exhausted, and to have the goods rapidly distributed among the
customers'. On talents' cultivation, many store managers just stress
employees' on-the-job training and new employees' pre-vocational
training but neglect one significant issue, i.e., make employees on
206
their proper positions. Under such circumstances, many employees with
brilliance and talents are assigned inappropriate positions that result in a
waste of human resources and lower employees' capability. Inappropriateness
on management of human resources (e.g., too much or not enough) wiU cause
counter effect that would damage employees' potential."
With regard to the deployment of HCMPs, therefore, not only is the company's
operating performance harmed but also the intemal unity may be destroyed if some
inappropriate employees are recraited, just as a Chinese proverb says, 'One grain of
rat's excrement destroys one pot of congee'. In consequence, for one company
implementing decentralized management and vesting delegation of authority level by
level, store managers must be pradent in the deployment of HCMPs.
As regards the relationship between PROT and EM shown in Table 4.8, one senior
executive of JKMIG made the following comments.
"For one company engaging in diversified operation such as JKMIG, a pursuit
of honor for the whole teamwork is far more important than that of one individual
whhe customers' requirements are diversified and changeable. Ten person's
unity of purpose is a formidable force, and what the power accumulated will
surpass their individual's solitary action as the former forms multiphed function,
but not for the latter. If every store manager let things drift when considering the
management of human resources to be senior executives' responsibihty, the whole power
of the company will be dispersed, employees' morale will be disintegrated and function
of human capital management practices cannot be brought into full play that would make
the market competitors take advantage of an opportunity to apportion the market

207
share of our company."
According to the conunents mentioned above, therefore, store managers should
encourage employees at the basic level at the proper moment, rather than daily
appraise, and lift their morale.
Table 4.9 Hierarchic regression analysis for exploring the relationship between strategic human capital management practices and employee capability moderated by the communication-coordination factor of personnel control mechanisms
\ v dependent
xvariable
independent \ .
variable \ ^
Stepl (Model 1):
Common method
factor
age
edl
ed2
rank
ba
train
employ
capital
owner2
or 1
or 2
formul
formu2
formu3
impro2
impro3
impro4
com
TCIE
^
0.293
0.400
0.403
,
0.253
0.301
t
2.859*
3.008*
,
3.358*
,
,
2.526*
2.191*
ESAOS
/3
.
-0.307
-0.475
-0.282
-0.413
-0.318
-0.325
t
-2.775*
-3.315*
-2.096*
-3.196*
-2.614*
-3.009*
EM
/3
0.176
0.178
0.152
0.144
t
2.439*
2.623*
2.481*
2.636*
EP
/3 t

208
R2
Step2 (Model 2):
Predictors
COMM
IDEN
DEVE
PROT
DEPL
R2
A R 2
Step3 (Model 3):
Interactions
n)EN*COMM
DEVE*COMM
PROT*COMM
DEPL*COMM ap
R2
A R 2
0.363
.
.
0.352
0.784
.
.
2.005*
4.394*
0.913
0.550***
.
.
10.232***
0.936
0.023***
0.396
.
,
1.177
-0.722
»
6.216*
-3.751*
0.888
0.492***
-1.039 -2.033*
8.707***
0.925
0.037***
0.314
.
0.270
-0.389
1.329
,
2.099*
-4.075*
13.691*
0.971
0.657***
-0.281
.
-2.570*
.
36.254***
0.981
0.010***
0.324
0.760
0.436***
•
2.842**
0.802
0.042**
Note: *p<0.05 **p<0.01 ***p<0.001 Insignificant /5 coefficient is indicated by a dot.
* F value indicates the partial F value of testing the moderation effect (Model 3
vs. Model 2). You will find the definition of each dimension of employee capabihty and strategic HCMPs (TCIE, ESAOS, EM, EP, IDEN, DEVE, PROT and DEPL) and COMM mentioned above in Appendix 5. age (dummy variable) means the age of individual respondent.
edl (dummy variable) means education background of individual respondent.
ed2 (dummy variable) means the country individual respondent completes his
/ her education.
rank (dummy variable) means the position of individual respondent in his /
her company.
ba (dummy variable) means the duties of individual respondent in his / her
company.
train (dununy variable) means working experience and foreign training of
individual respondent.
employ (dummy variable) means the number of employees.

209
capital (dummy variable) means paid-up registered capital.
owner2 (dummy variable) means the owner of the company.
orl (dummy variable) means whether the company of individual respondent
features centralized decision-making authority.
or2 (dununy variable) means whether the company of individual respondent
highlights hierarchical levels of organizational stracture.
formul (dummy variable) means whether the orientation of organizational
stracture is characterized by function.
formu2 (dummy variable) means whether the orientation of organizational
stracture is typified by the line of products.
formu3 (dummy variable) means whether the orientation of organizational
stracture is underlined by geographical areas.
impro2 (dummy variable) means whether regular improvement programs
draw attention to comprehensive trairung of employees.
impro3 (dummy variable) means whether regular improvement programs
underscore the edifice of the relationships with customers and suppliers.
impro4 (dummy variable) means whether regular improvement programs pay
attention to the suggestion of store managers.
com (dummy variable) means the percentage of sales revenue coming from
three largest competitors in the industry.
Findings from the hierarchic regression analysis shown in Table 4.9 are as follows.
1. Of the four dimensions of strategic HCMPs, PROT and DEPL contribute significantly
in explaining TCEE and ESAOS. They also maintain a significant relation with EM
in the regression equation after the common method variance is partialled out.
DEVE contributes significantly in explairung EM as weU.
2. hispection of the beta's of the interaction shows that DEVE moderated by COMM
has a marked negative effect on ESAOS (/3 = -1.039; p value is less than 0.05). The
interaction of PROT and COMM has an evident negative effect on EP (/3 = -0.281; p
value is less than 0.05). It is clear from the regression analysis results in the
previous section that DEVE and PROT do not bring marked effects to ESAOS and
EP respectively (Table 4.7). It is also apparent from Model 2 that DEVE does not

210
bring marked effects to ESAOS and PROT has an insignificant positive effect on EP
(^is 0.352; p value is larger than 0.05), and a buffer effect is produced (/3 =-1.039
and -0.281 respectively; all p values are less than 0.05) by addmg the moderating
variable of personnel control mechanisms.
Thus, the causal relationship between developing human capital management
practices strategically and employee skiU and organizational stracture is strongly
moderated by the conununication-coordination factor of personnel control
mechanisms. In addition, the moderated relationship between protecting human
capital management practices strategically and employee motivation is strongly
caused by the communication-coordination factor of personnel control mechanisms,
but the moderation effect reverses the original order
3. The resuhs of regression analysis in the preceding section show that DEVE or DEPL
have marked positive effects on EM (Table 4.7), while h is clear from Model 2 that
the positive effect DEVE or DEPL brings to EM (/3= 0.270 and 1.329 respectively;
all p values are less than 0.05). However, there are no buffer effects (/3 = 0.111 and
0.190 respectively; all p value are larger than 0.05) are created by adding the
moderating variable of personnel control mechanisms. Thus, the causal relationship
between DEVE (or DEPL) and EM is not strongly moderated by the
communication-coordination factor of personnel control mechanisms.
4. Findings from the hierarchic regression analysis indicate that all dimensions of
stiategic HCMPs have evident interpretative capabihty on each dimension of
employee capability such as the change in environment, employee skill and
organizational stracture, employee motivation and employee productivhy while R^ are

211
0.913, 0.888, 0.971 and 0.760, respectively, as specified in Table 4-9. The
increments of R^ are 0.023, 0.037, 0.010 and 0.042, respectively, when taking the
interactions of DDEN and COMM, DEVE and COMM, PROT and COMM as weU as
DEPL and COMM into account, as shown in Table 4.9. In each mstance, the test
statistic (F) for R^ is significant. The associated F-tests displayed in Table 4.9 also
indicate that significant additional variance is explained with respect to each
dimension of employee capabihty. In other words, the third step (Model 3) in the
hierarchic regression analysis reveals that the interactions, overall, explain additional
variance.
As regards communication-coordination mechanisms shown in Table 4.9, one senior
executive of THFVG made the foUowing comments.
"Estabhshing smooth communication-coordination channels in our company lies in
expecting employees' more expression of their working experience and
their opinions toward the management and management of our company that
can be served as reference for each system renovation. A company will be
tum into an organization without enterprise culture and interaction
among employees as well as one with impediment of human resources, while
employees reject to express their ideas and opinions. Communication among
employees, communication between senior executives and shop (store) managers
or communication between shop (store) managers aim at helping a smooth process
of management control in our company. Poor communication will bring
incongmity among employees that would affect performance of the whole
teamwork, of its effect never be inferior to the loss due to unmarketable products.
Generally speaking, horizontal communication (such as communication among

212
employees, communication between shop (store) managers) is easier than vertical
(such as communication between senior executives and shop (store) managers,
communication between shop (store) managers and employees at the basic level).
In addition, employees who will come close to customers while conducting
communication-coordination shall play a guiding role since they may understand
customers' preference better than those senior executives do. In consequence, a
respect for profession and working experience is one important factor for a smooth
communication-coordination.''
As noted earlier, Hypothesis 1 indicates that employee capabilities in firms relying on
personnel control mechanisms increase as a result of paying more attention to
strategic human capital management practices. It includes the following two parts:
(1) the intervening relationship between strategic human capital management
practices and employee capability; and
(2) the moderating effect of personnel control mechanisms on the relationship
between strategic human caphal management practices and employee capability
(Figure 4.2).

213
Figure 4.2 The moderating effect of personnel control mechanisms on the
relationship between strategic human capital management practices
and employee capabihty
Personnel control mechanisms
Strategic human capital
management practices . . . "
Employee
capabihty
Accordingly, it can be concluded from the discussion and the comments above that
part (2) of hypothesis 1 in this research gains support.
4.5.1 Additional interpretative analyses for the moderating effect of personnel
control mechanisms
To determine the exact nature of the moderated effects identified in Table 4.8 and 4.9,
additional interpretative analyses using standard graphical techniques have been
conducted. The charts for TCIE, ESAOS, EM and EP with moderated effect are
presented below.

214
High
EP
Low
.Strong CONT
Weak CONT
Low IDEN High
Figure 4.3 The moderated relationship between identifying human capital
management practices (IDEN) and employee productivity (EP) caused
by the control factor of personnel control mechanisms (CONT)
h is evident from Figure 4.3 that strong CONT is associated with a negative
relationship between IDEN and EP, while weak CONT is associated with a positive or
almost no relationship between the two variables.
TCIE
Low
Strong CONT
Weak CONT
Low DEVE High
Figure 4.4 The moderated relationship between developing human capital
management practices (DEVE) and the change in environment (TCIE)
caused by the control factor of personnel control mechanisms (CONT)

215
It is not hard to find from Figure 4.4 that the causal relationship between DEVE and
TCIE moderated by strong CONT is evidently superior to that of weak CONT, thus
reveahng that the interaction of DEVE and strong CONT has a marked positive effect
on TCIE. In other words, organizations operating with relatively strong CONT
exhibit a stronger relationship between DEVE and TCIE and that organizations with
relatively weak CONT do not demonstrate a significant relationship between the two
variables.
High
ESAOS
Low
CONT
Weak CONT
Low DEVE High
Figure 4.5 The moderated relationship between developing human capital
management practices (DEVE) and employee skill and organizational
stracture (ESAOS) caused by the control factor of personnel control
mechanisms (CONT)
h is evident from Figure 4.5 that strong CONT is associated with a negative
relationship between DEVE and ESAOS, while weak CONT is associated with a
positive or almost no relationship between the two variables.

216
High
EM
Low
Strong CONT
Weak CONT
Low DEVE High
Figure 4.6 The moderated relationship between developing human capital
management practices (DEVE) and employee motivation (EM) caused
by the control factor of personnel control mechanisms (CONT)
It is not hard to find from Figure 4.6 that the causal relationship between DEVE and
EM moderated by strong CONT is evidently superior to that of weak CONT, thus
reveahng that the interaction of DEVE and strong CONT has a marked positive effect
on EM. In other words, strong CONT is associated with a strong positive
relationship between DEVE and EM, while weak CONT is associated with a weak
positive relationship between the two variables.

217
High
EP
Low
.Strong CONT
Weak CONT
Low DEVE High
Figure 4.7 The moderated relationship between developing human capital
management practices (DEVE) and employee productivity (EP)
caused by the control factor of personnel control mechanisms (CONT)
It is evident from Figure 4.7 that strong CONT is associated with a negative
relationship between DEVE and EP, while weak CONT is associated with a positive
relationship between the two variables.
High
ESAOS
Low
Weak CONT
Strong CONT
Low PROT High
Figure 4.8 The moderated relationship between protecting human capital
management practices (PROT) and employee skill and organizational
stracture (ESAOS) caused by the control factor of personnel control
mechanisms (CONT)

218
It is obvious from Figure 4.8 that CONT weakens the relationship between PROT and
ESAOS. Strong CONT is associated with a weak negative relationship between
PROT and ESAOS, while weak CONT is associated with a strong positive
relationship between the two variables.
High
EM
Low
Strong CONT
Weak CONT
Low PROT High
Figure 4.9 The moderated relationship between protecting human capital
management practices (PROT) and employee motivation (EM)
caused by the control factor of personnel control mechanisms
(CONT)
It is not hard to find from Figure 4.9 that the causal relationship between PROT and
EM moderated by strong CONT is evidently superior to that of weak CONT, thus
reveahng that the interaction of PROT and strong CONT has a marked positive effect
on EM. In other words, strong CONT is associated with a strong positive
relationship between PROT and EM, while weak CONT is associated with a weak
positive relationship between the two variables.
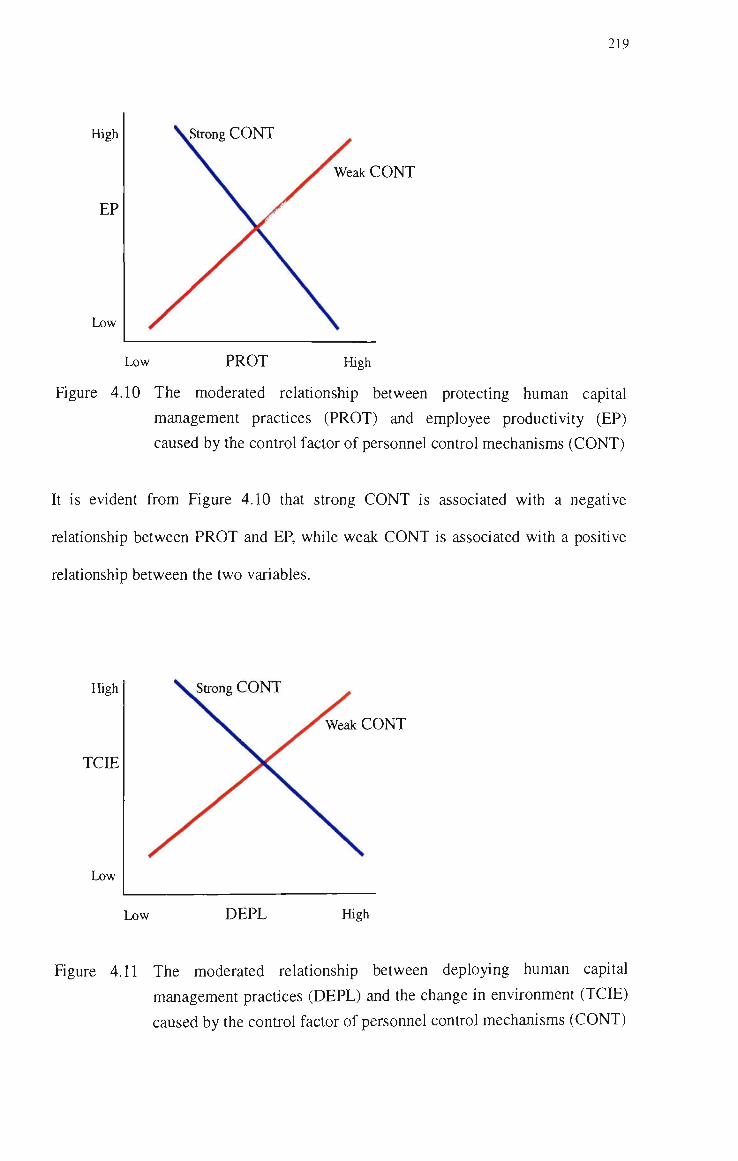
219
High
EP
Low
Weak CONT
Low PROT High
Figure 4.10 The moderated relationship between protecting human capital
management practices (PROT) and employee productivity (EP)
caused by the control factor of personnel control mechanisms (CONT)
It is evident from Figure 4.10 that strong CONT is associated with a negative
relationship between PROT and EP, while weak CONT is associated with a positive
relationship between the two variables.
High
TCIE
Low
Strong CONT
Weak CONT
Low DEPL High
Figure 4.11 The moderated relationship between deploying human capital
management practices (DEPL) and the change in envhonment (TCIE)
caused by the control factor of personnel control mechanisms (CONT)

220
h is evident from Figure 4.11 that strong CONT is associated with a negative
relationship between DEPL and TCIE, while weak CONT is associated with a
positive relationship between the two variables.
High
ESAOS
Low
Strong CONT
Weak CONT
Low DEPL High
Figure 4.12 The moderated relationship between deploying human capital
management practices (DEPL) and employee skill and organizational
stracture (ESAOS) caused by the control factor of personnel control
mechanisms (CONT)
It is not hard to find from Figure 4.12 that the causal relationship between DEPL and
ESAOS moderated by strong CONT is evidently superior to that of weak CONT, thus
reveahng that the interaction of DEPL and strong CONT has a marked positive effect
on ESAOS. In other words, strong CONT is associated with a strong positive
relationship between DEPL and ESAOS, while weak CONT is associated with a weak
positive relationship between the two variables.

221
High
EM
Low
Weak CONT
Strong CONT
Low DEPL High
Figure 4.13 The moderated relationship between deploying human capital
management practices (DEPL) and employee motivation (EM) caused
by the control factor of personnel control mechanisms (CONT)
It is obvious from Figure 4.13 that CONT weakens the relationship between DEPL
and EM. Strong CONT is associated with a weak negative relationship between
DEPL and EM, while weak CONT is associated with a strong positive relationship
between the two variables.
High
EP
Low
Strong CONT
Weak CONT
Low DEPL High
Figure 4.14 The moderated relationship between deploying human capital
management practices (DEPL) and employee productivity (EP)
caused by the control factor of personnel conu-ol mechanisms
(CONT)

222
It is evident from Figure 4.14 that the causal relationship between DEPL and EP
moderated by strong CONT is evidently superior to that of weak CONT, thus
reveahng that the interaction of DEPL and strong CONT has a marked positive effect
on EP hi other words, strong CONT is associated with a strong positive relationship
between DEPL and EP, while weak CONT is associated with a weak positive
relationship between the two variables.
High
ESAOS
Low
.Strong COMM
Weak COMM
Low DEVE High
Figure 4.15 The moderated relationship between developing human capital
management practices (DEVE) and employee skill and organizational
structure (ESAOS) caused by the communication-coordination factor
of personnel control mechanisms (COMM)
It is not hard to find from Figure 4.15 that the causal relationship between DEVE and
ESAOS moderated by strong COMM is evidently superior to that of weak COMM,
thus revealing that the interaction of DEVE and strong COMM has a marked negative
effect on ESAOS. In other words, strong COMM is associated with a strong
negative relationship between DEVE and ESAOS, while weak COMM is associated
with a weak negative relationship between the two variables.
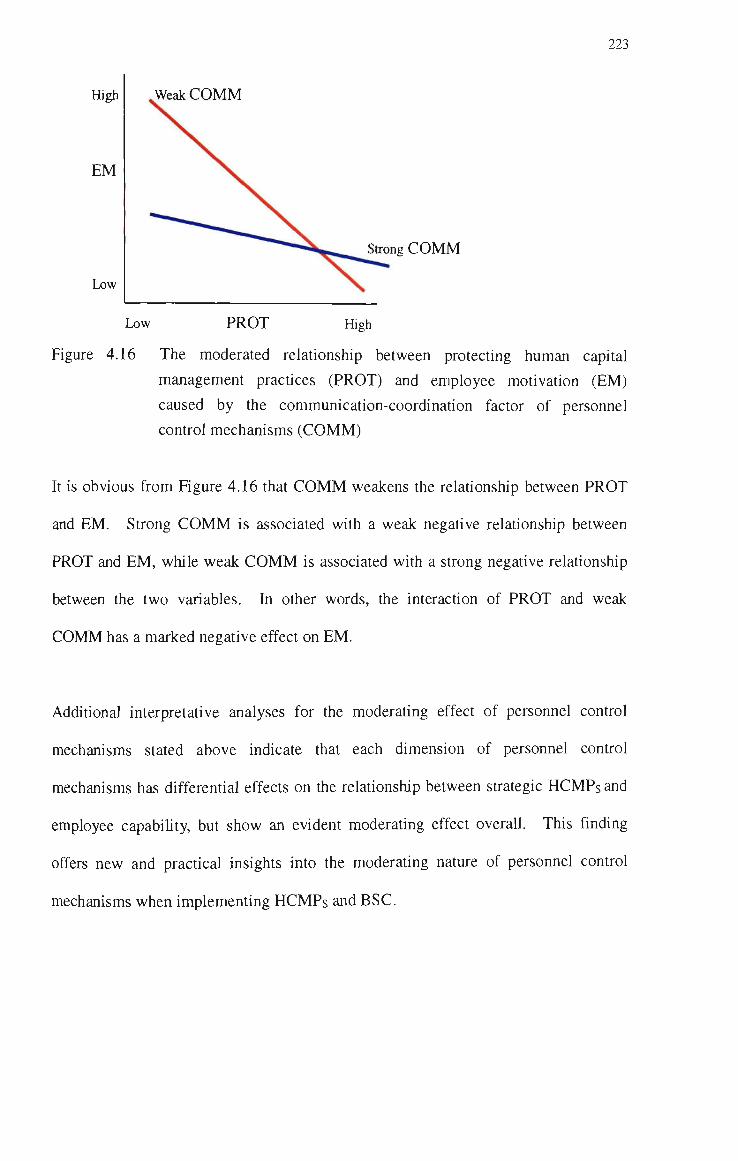
223
High
EM
Low
.Weak COMM
Strong COMM
Low PROT High
Figure 4.16 The moderated relationship between protecting human capital
management practices (PROT) and employee motivation (EM)
caused by the communication-coordination factor of personnel
control mechanisms (COMM)
It is obvious from Figure 4.16 that COMM weakens the relationship between PROT
and EM. Strong COMM is associated with a weak negative relationship between
PROT and EM, while weak COMM is associated with a strong negative relationship
between the two variables. In other words, the interaction of PROT and weak
COMM has a marked negative effect on EM.
Additional interpretative analyses for the moderating effect of personnel control
mechanisms stated above indicate that each dimension of personnel control
mechanisms has differential effects on the relationship between strategic HCMPs and
employee capabihty, but show an evident moderating effect overall. This finding
offers new and practical insights into the moderating nature of personnel control
mechanisms when implementing HCMPs and BSC.

224
4.6 The regression analysis for exploring the intervening effect
Is the relationship between strategic HCMPs and customer loyahy affected by an
intervening variable? Taking inferences arising from the literature review as a base,
one postulate in this study is that customer loyalty in firms drawing attention to
strategic HCMPs increases as a result of the increase in employee capability.
4.6.1 The causal relationship between employee capabiHty and customer loyalty
The regression analysis resuhs indicate that all dimensions of employee capability
have evident interpretative capability on each dimension of customer loyalty such as
customer complaint and customer satisfaction while R are 0.238 and 0.252,
respectively, as specified in Table 4.10. The causal relation for each dimension is as
follows.
1. The changes in environment have a marked negative effect on customer complaint
and customer satisfaction (/3= -0.148, -0.164, respectively; p values are less than
0.05 and 0.01, respectively).
2. Employee motivation has an evident positive effect on customer complaint and
customer satisfaction (/3 = 0.352, 0.399, respectively; all p values are less than
0.001).
3. Employee productivity has a marked poshive effect on customer complaint (p =
0.132; p value is less than 0.05).
As noted earlier, Hypothesis 2 indicates that customer loyahy in firms with a focus on
stiategic human capital management practices escalates on account of the increase in
employee capabihty. Therefore, Hypothesis 2, from Table 4.10 and the discussion
above, is partly supported.

225
Table 4.10 Resuhs of regression analysis of employee capabihty to customer loyalty
\ . dependent
indepen<J|^^ variable \ ^
TCIE
ESAOS
EM
EP
service6
apprai 14
apprai 24
avelirl4
griev 5
incenti 3
service 3
service 6
incenti 5
F
R^
CC
/3
-0.148
0.352
0.132
0.169
0.209
-0.254
-0.120
t
-2.371*
5.511***
2.087*
2.796**
2.023*
-2.477*
-2.057*
7.820***
0.238
CS
/3
-0.164
0.399
0.116
0.145
t
-2.715**
6.352***
•
2.128*
2.484*
12.308***
0.252
Note: *P<0.05 **P<0.01 ***P<0.001 Insignificant /3 coefficient is indicated by a dot. You will find the definition of each dimension of employee capabihty and customer loyalty mentioned above (TCIE, ESAOS, EM, EP, CC and CS) in Appendix 5. service (dummy variable): How many kinds of products were produced by your
company last year? (service3: 21-30, service6: 51-60) apprai (dummy variable): What proportion of the workforce receives formal
performance appraisals? (apprai 14: 46%-55%) What is the proportion of the workforce using performance appraisals to determine
the subordinate's compensation? (apprai 24: 46%~55%) avehr (dummy variable): What is the number of training hours received by a typical
employee over the last 12 months? (avehr 14: 46-55)

226
griev (dummy variable): What is the proportion of the workforce having access
to a formal grievance procedure and (or) complaint resolution system?
(griev 5: 56%-65%)
incenti (dummy variable): What is the proportion of the workforce having access to
company incentive plans, profit-sharing plans, and (or) gain-sharing plans? (incenti 3:
36%~45%, incenti5: 56%~65%)
4.6.2 The causal relationship between customer loyalty and financial performance of an organization
The postulation of a causal relationship between employee capability and customer
loyahy in the previous section has some support while the inference arising from the
literature review suggests that customer loyalty will cause changes in the company's
financial performance. The regression analysis shows that customer loyalty has
interpretative capability on financial performance of an organization while R^is 0.141
as indicated in Table 4.11. The causal relationship for each dimension is described
as follows.
1.Customer complaint has an effect on financial performance of an organization (/3 =
0.163; p value is less than 0.05). However, customer satisfaction does not have
evident effects on company's financial performance.
2.Dummy variable, complain, has a negative effect on company's financial
performance (j3 = -0.219; p value is less than 0.01).
3.Dummy variable, satisfa2, has a positive effect on financial performance of an
organization ( ^ = 0.124; p value is less than 0.05).
4.Dummy variable, recom2, has a negative effect on company's financial performance
(/3= -0.174; p value is less than 0.05).
5.Dummy variable, loyal 1, has a negative effect on financial performance of an
organization (/3 = -0.229; p value is less than 0.05).

227
As noted earlier. Hypothesis 3 indicates that as a resuh of the hicrease in customer
loyalty, financial performance in firms paying attention to employee capabihties
increases. Therefore, Hypothesis 3, from Table 4.11 and the discussion above, is
partly supported.

228
Table 4.11 Resuhs of regression analysis of customer loyalty to financial performance of an organization
^ * v>. ^ dependent variable
independent variable ^ v..., ^
CC
CS
complain
satisfal
satisfa2
recoml
recom2
loyal 1
loyal2
loyal3
loyal4
PERFORM
P
0.163
-0.219
0.124
-0.174
-0.229
•
t
2.555*
-3.389**
2.039*
-2.417*
-2.389*
F 3.779***
R2 0.141
Note: *P<0.05 **P<0.01 ***P<0.001 Insignificant yS coefficient is indicated by a dot. You wiU find the definition of CC or CS in Appendix 5.
PERFORM: company financial performance.
complain (dummy variable): An important part of your task is to ensure
comphance with customer complaints.
satisfa 1 (dummy variable): To what extent would you lUce your organization

229
to develop customer loyalty? The degree to which your store could raise the
price of products as a percentage before the customer would choose not to buy
from your store again (given that the customer has indicated that he or she is
likely to repurchase).
satisfa 2 (dununy variable): To what extent would you hke your organization
to develop customer loyalty? The degree to which your store could lower the
price of products as a percentage before the customer would choose to buy
from your store again (given that the customer has indicated he or she is
unlUcely to repurchase).
recom (dummy variable): Have you ever recommended your company as a
place to purchase to your friend? (Yes: 1; No: 2) (recom 23: very frequent)
loyal 1 (dummy variable): Does your store ask your customers to evaluate sales clerks' service friendliness? loyal 2 (dummy variable): Did your customer just purchase one kind of product from your store? loyal 3 (dummy variable): If your customer need to buy a new product, he wouldn't come to your store again. loyal 4 (dununy variable): If your customer need to buy a new product, he would visit your store again.
4.6.3 The causal relationship between employee capability and financial
performance of an organization
The postulation of a causal relationship between customer loyalty and financial
performance of an orgaruzation in the previous section is partly supported. However,
the inference arising from the literature review suggests that employee capability will
cause changes in the company's financial performance. The regression analysis
shows that employee capability has evident interpretative capability on financial
performance of an organization while R^is 0.319 as indicated in Table 4.12. The
causal relationship for each dimension is described as foUows.
1. Employee skill and organizational stracture (ESAOS) have an evident effect on
financial performance of an organization (/3 = 0.147; p value is less than 0.05).

230
2.Employee productivhy (EP) has a poshive effect on company's financial
performance (yS = 0.141; p value is less than 0.05).
3. Dummy variable, budget, has evident negative effects on financial performance of
an organization (/3 = -0.217, -0.168, respectively; aU p values are less than 0.01).
4. Dummy variable, qual, has evident negative effects on company's financial
performance (/3= -0.161, -0.144, respectively; p values are less than 0.01, 0.05,
respectively).
5. Dummy variable, incenti, has a positive effect on company's financial performance
(/3 = 0.251; p values is less than 0.001).
As noted earlier, Hypothesis 3 indicates that as a result of the increase in customer
loyahy, financial performance in firms paying attention to employee capabilities
increases. Therefore, Hypothesis 3, from Table 4.12 and the discussion above, is
partly supported.
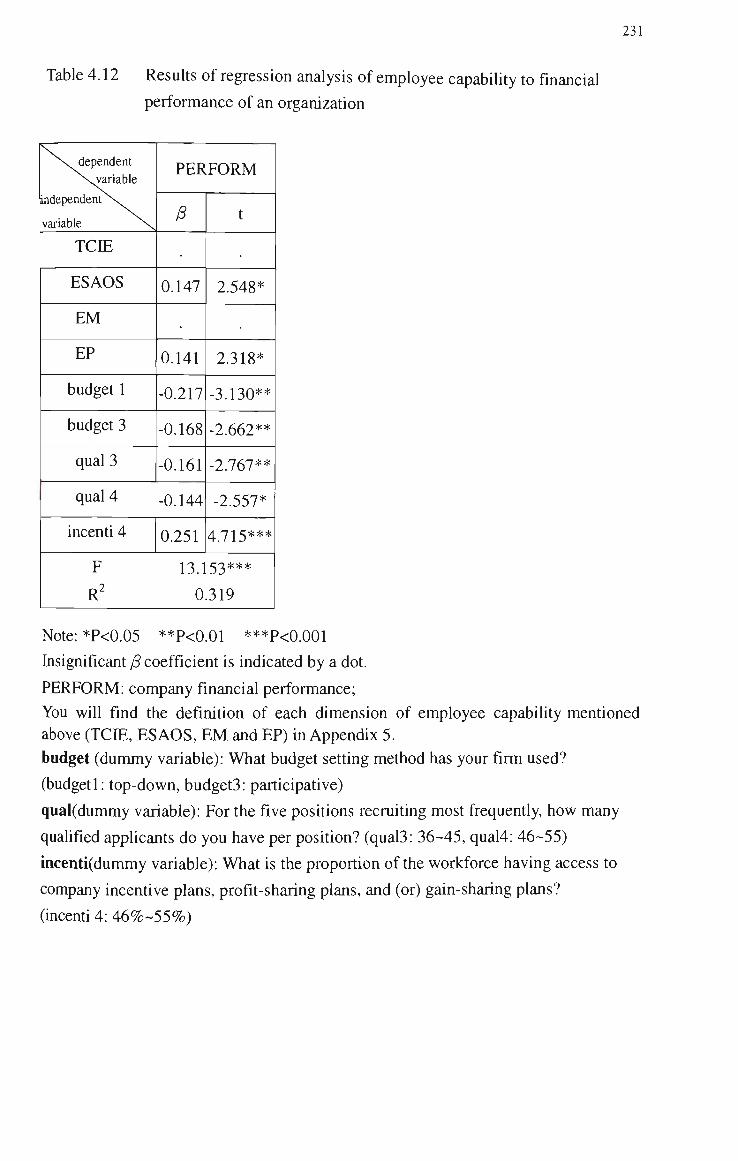
231
Table 4.12 Results of regression analysis of employee capability to financial performance of an organization
\,^ dependent \variable
independentX.
variable N.
TCIE
ESAOS
EM
EP
budget 1
budget 3
qual 3
qual 4
incenti 4
PERFORM
^
0.147
0.141
-0.217
-0.168
-0.161
-0.144
0.251
t
2.548*
2.318*
-3.130**
-2.662**
-2.767**
-2.557*
4.715***
F 13.153***
R 0.319
Note: *P<0.05 **P<0.01 ***P<0.001 Insignificant /5 coefficient is indicated by a dot.
PERFORM: company financial performance; You will find the definition of each dimension of employee capability mentioned above (TCIE, ESAOS, EM and EP) in Appendix 5. budget (dummy variable): What budget setting method has your firm used?
(budgetl: top-down, budget3: participative)
qual(dummy variable): For the five positions recraiting most frequently, how many
quahfied applicants do you have per position? (qual3: 36-45, qual4: 46-55)
incenti(dummy variable): WTiat is the proportion of the workforce having access to
company incentive plans, profit-sharing plans, and (or) gain-sharing plans?
(incenti 4: 46%-55%)

232
4.6.4 The causal relationship between strategic human capital management practices and customer loyalty
The postulation of a causal relationship between employee capabihty and financial
performance of an organization in the previous section has some support. However,
the inference arising from the literature review is that strategic HCMPs wiU affect
customer loyahy. The regression analysis shows that strategic HCMPs have evident
interpretative capability on each dimension of customer loyalty while R^are 0.257 and
0.152, respectively, as indicated in Table 4.13. The causal relationship for each
dimension is described as foUows.
1. Identifying HCMPs (IDEN) has a positive effect on customer complaint (CC) (/3 =
0.166; p value is less than 0.01).
2. Developing HCMPs (DEVE) has positive effects on customer complaint (CC) and
customer satisfaction (CM) (/3= 0.402, 0.244, respectively; all p values are less
than 0.001).
3. Dummy variable, product, has a positive effect on customer complaint (CC) (^ =
0.159; p value is less than 0.05).
4. Dummy variable, percent, has a negative effect on customer complaint (CC) (/3 =
-0.134; p value is less than 0.05).
5. Dummy variable, timet, has a positive effect on customer complaint (CC) (/3 =
0.183; p values is less than 0.05).
As noted earlier, Hypothesis 2 indicates that customer loyalty in firms whh a focus on
strategic human capital management practices escalates on account of the increase in
employee capability. Therefore, Hypothesis 2, from Table 4.13 and the discussion
above, is supported.
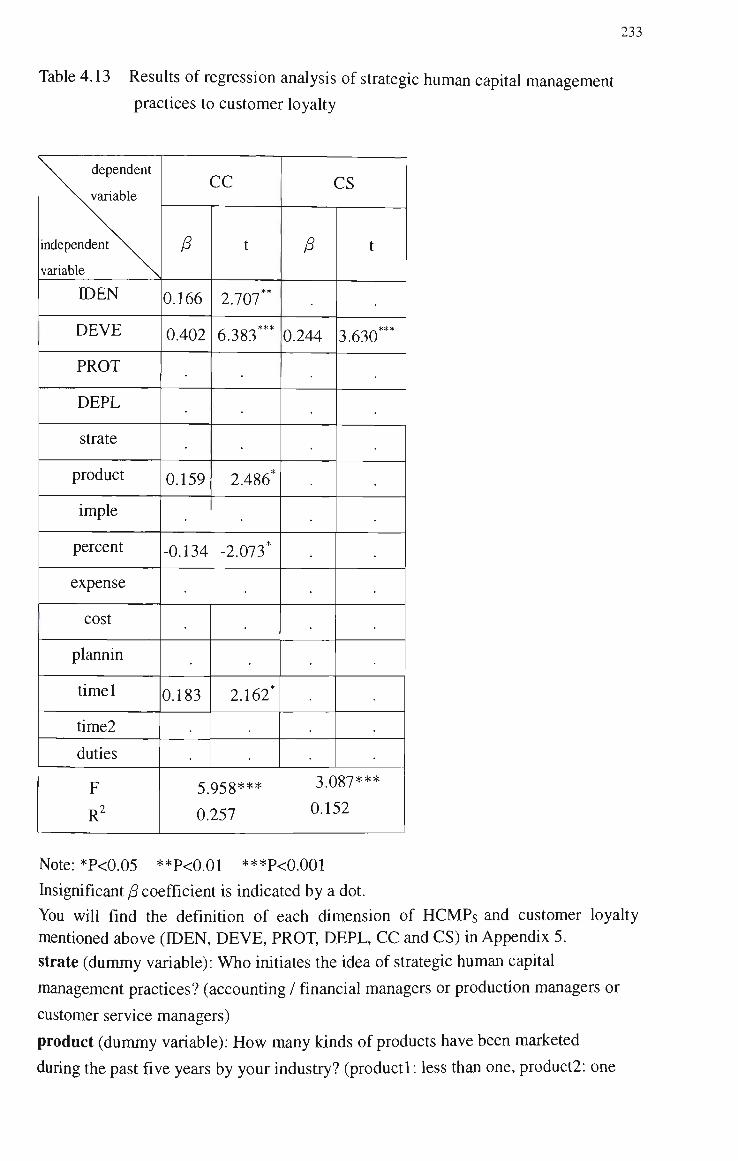
233
Table 4.13 Resuhs of regression analysis of strategic human capital management practices to customer loyalty
\ ^ dependent
\ . variable
independent \ ^
variable \
IDEN
DEVE
PROT
DEPL
strate
product
imple
percent
expense
cost
plarmin
timet
time2
duties
F
R'
CC
/5
0.166
0.402
•
0.159
-0.134
0.183
t
2.707**
6.383***
2.486*
-2.073*
2.162*
.
CS
^
•
0.244
t
3.630***
•
5 958*** 3.087***
0.257 0-152
Note: *P<0.05 **P<0.01 ***P<0.00I hisignificant ^ coefficient is indicated by a dot. You will find the definition of each dimension of HCMPs and customer loyahy mentioned above (IDEN, DEVE, PROT, DEPL, CC and CS) in Appendix 5. strate (dummy variable): Who initiates the idea of strategic human caphal
management practices? (accounting / financial managers or production managers or
customer service managers)
product (dummy variable): How many kinds of products have been marketed
during the past five years by your industry? (product 1: less than one, product2: one

234
to five, product3: six to ten, product4: eleven to fifteen)
imple (dummy variable): How successful the implementation of strategic human
capital management practices is? (imple2: poor, imple3: average)
percent (dummy variable): What percentage of employees have received training last
year? (percentl: less than 1%, percent2: 1% ~ 10%, percent4: 21% - 30%)
expense (dummy variable): How much money is spent on training program in your
unit? (expensel: less than 1,000, expense2: 1,001-2,000, expense3: 2,001-3,000,
expense4: 3,001-4,000, expense5: 4,001-5,000, expense6: 5,001-6,000, umt: NT$)
cost (dummy variable): Employee train is viewed as a cost or as an investment?
(costl: viewed as a cost, cost3: neither a cost nor an investment)
planning (dummy variable): Annual budget fits with the deployment of strategic
human capital management practices (plarming 1: agree). The development of
strategic human capital management practices went according to corporate business
strategy (planning 2: agree). The deployment of strategic human capital
management practices went according to corporate plan last year (planning 3: agree).
The protection of strategic human capital management practices went according to
corporate business strategy last year (plarming 4: agree).
time (dummy variable): How much time will it take for a newly hired store
manager to leam firm-specific tasks necessary to be as effective as present store
managers? (timet 1: less than one month) How much time is required for a newly
hired manager with experience to become familiar with firm-specific knowledge of
your products and customers? (time24: three to four months)
duties (dummy variable): Are managerial duties in your organization
repetitious?(yes:l)
4.6.5 The causal relationship between strategic human capital management
practices and fmancial performance of an organization
The postulation of a causal relationship between strategic HCMPs and customer
loyalty in the previous section has some support. However, the inference arising
from the literature review is that strategic HCMPs wiU affect the financial
performance of an organization. The regression analysis shows that strategic
HCMPs have evident interpretative capabihty on financial performance of an
organization while R^is 0.144 as indicated on Table 4.14. The causal relationship

235
for each dimension is described as follows.
1. Developing HCMPs (DEVE) has a negative effect on financial performance of an
organization (^ - -^.119; p value is less than 0.01).
2. Deploying HCMPs (DEPL) has a positive effect on financial performance of an
organization (/3 = 0.159; p value is less than 0.05).
3. Dummy variable, imple, has a positive effect on financial performance of an
organization (/3 = 0.148; p value is less than 0.05).
4. Dummy variable, expense, has a negative effect on financial performance of an
organization (^= -0.189; p value is less than 0.01).
As noted earlier. Hypothesis 4 indicates that financial performance in firms focusing
on strategic human capital management practices increases in consequence of the
increase in employee capability. Therefore, Hypothesis 4, from Table 4.14 and the
discussion above, is partly supported.

236
Table 4.14 Resuhs of regression analysis of strategic human caphal management
practices to financial performance of an organization
^""-"•v^dependent variable
independent variable"""- , ^
IDEN
DEVE
PROT
DEPL
strate
product
imple
percent
expense
cost
plarmin
timel
time2
duties
PERFORM
P
-0.229
0.159
0.148
-0.189
•
•
t
-3.391**
2.164
2.072*
-2.691**
F 2.896
R 0.144

237
Note: *P<0.05 **P<0.01 ***P<0.001
hisignificant ^ coefficient is indicated by a dot.
PERFORM means company's financial performance.
You will find the definition of each dimension of HCMPs mentioned above
(IDEN, DEVE, PROT and DEPL) in Appendix 5.
strate (dununy variable): Who initiates the idea of strategic human capital
management practices? (accounting / financial managers or production
managers or customer service managers)
product (dummy variable): How many kinds of products have been
marketed during the past five years by your industry? (product 1: less than
one, product2: one to five, product3: six to ten, product4: eleven to fifteen)
imple (dummy variable):How successful the implementation of strategic
human capital management practices is? (imple2: poor, imple3: average)
percent (dummy variable): What percentage of employees have received
training last year? (percentl: less than 1%, percent2: 1% - 10%, percent4:
21%-30%)
expense (dununy variable): How much money is spent on training program
in your umt? (expensel: less than 1,000, expense2: 1,001-2,000, expense3:
2,001-3,000, expense4: 3,001-4,000, expense5: 4,001-5,000, expense6:
5,001-6,000, umt: NT$)
cost (dummy variable): Employee train is viewed as a cost or as an
investment? (costl: viewed as a cost, cost3: neither a cost nor an investment)
planning (dummy variable): Annual budget fits with the deployment of
strategic human capital management practices (planning 1: agree). The
development of strategic human capital management practices went
according to corporate business strategy (planning 2: agree). The
deployment of strategic human capital management practices went
according to corporate plan last year (planiung 3: agree). The protection of
strategic human capital management practices went according to corporate
business strategy last year (planning 4: agree).
time (dummy variable): How much time will it take for a newly hired store
manager to leam firm-specific tasks necessary to be as effective as present
store manager? (timel 1: less than one month) How much time is requned
for a newly hired manager with experience to become famihar with
firm-specific knowledge of your products and customers? (time 24: three to
four months)
duties (dummy variable): Are managerial duties in your organization
repetitious? (yes: 1)

238
4.7 The nested-model analysis for exploring the intervening effect
The regression analysis in the previous sections shows that the interaction of
developing / protecting human capital management practices (HCMPs) and the
control factor of personnel control mechanisms has an evident effect on employee
motivation, which, in tum, brings that effect to each dimension of customer loyalty.
One dimension of customer loyalty, customer complaint, has a marked effect on a
company's financial performance. Furthermore, the interaction of protecting
HCMPs and the communication-coordination factor of personnel control mechanisms
has a clear effect on employee motivation, which, in tum, has a marked effect on
customer loyalty. In addition, the interaction of deploying HCMPs and the control
factor of personnel control mechanisms has an evident effect on employee
productivhy, which, in tum, has a marked effect on a company's financial
performance. Therefore, the nested-model analysis of the LISREL model is applied
(all the details of LISREL model are explained in Appendix 4) to study the
intervening effect of employee capabihty on strategic HCMPs, customer loyalty and
fmancial performance of an orgaruzation.
hi order to consider path parsimony, the comparative methods of nested-model
analysis (Bentler and Bonett, 1980) of LISREL model (Hair et al., 1995) shown in
Appendix 4 are apphed here to assess the optimum goodness-of-fit model (e.g., the
Null Model, the Direct Model, the Completely Mediated Model, and the PartiaUy
Mediated Model) as well as to study the direct, indirect and overall effects between
each constract mentioned in this study.
There are four models proposed for the nested-model analysis. Between-model
comparisons and the fit indices mentioned are kept for special purposes of conducting

239
the decision-tree analysis (Anderson & Gerbing, 1988), along with the examination of
the adjusted (i.e., deleting factors whh poor intemal consistency) theoretical model
and nested alternative models.
Model 1 is the Null Model which features the model with non-existence of the paths
of relationship between each dimension.
Model 2, the Direct Model which indicates the existence of a paths model with
marked effects for the strategic HCMPs on customer loyahy and on company's
financial performance as well as for the employee capability on customer loyalty and
for customer loyahy on company's financial performance.
Model 3, the Completely Mediated Model, marks the existence of a paths model with
evident effect for the strategic HCMPs on employee capability, which, in tum, on
customer loyalty, and consequently on company's financial performance.
Model 4, the PartiaUy Mediated Model which means the existence of a paths model
with marked effects for the strategic HCMPs on employee capability, on customer
loyalty and on company's financial performance as well as for the employee
capability on customer loyalty and on company's financial performance as well as for
customer loyalty on company's financial performance (Model 1, 2, 3 and 4 are
portrayed in Appendix 6). The results of the nested-model analysis are specified in
Table 4.15.

240
Table 4.15 Comparative analysis of the nested-model for the intervening effects
Model
Model l(NuU
Model)
Model2(Direct
Model)
Model3(Comple
tely Mediated
Model)
Mode4
(Partially
Mediated
Model)
x
429.28
223.44
109.95
9.04
df
49
27
23
7
2 Xdiff
•
205.84***
319.33***
420.24***
dfdiff
•
22
26
42
GFI
0.77
0.87
0.93
0.99
AGFI
0.69
0.67
0.80
0.94
NFI
0.25
0.57
0.80
0.98
CFI
0.26
0.58
0.82
1.00
RMR
0.43
0.34
0.26
0.041
Standardized
RMR
0.17
0.13
0.085
0.020
Note •- 1. Inter-model comparative base is Model 1 (Null Model).
2. *p<0.05 **P<0.01 ***P<0.001
3. GFI : Goodness of Fit Index
AGFI : Adjusted Goodness of Fit hidex
NFI : Normed Fit Index
CFI '. Comparative Fit Index
RMR • Root Mean Square Residual
The resuhs of comparative analysis for the nested model in Table 4.15 reveal that all
testing of the differences of x as model 2, 3 and 4 to model 1 are distinct. The
values of goodness of fit such as GFI, AGFI, NFI, CFI, RMR and standardized RMR
of model 3 and 4 are better than those of model 2 (GFI, AGFI, NFI and CFI are fairiy
acceptable being at, or above, the 0.80 level) (MulaUc et al., 1989). This shows that
not only the direct effect existed as the strategic HCMPs on customer loyahy and
company's financial performance but also employee capabihty on customer loyahy
and customer loyalty on company's financial performance. Moreover, the testing of

241
the difference of ^ resulting from model 3 and 4 reveals a marked difference existed
(Xdiff = 100.91, dfdiff = 16; p value is less than 0.001). Consequently, there exists a
partial intervening effect as each dimension of strategic HCMPs on each dimension of
employee capabihty and customer loyalty and company's financial performance as
well as each dimension of employee capabihty on each dimension of customer loyahy
and company's financial performance as well as each dimension of customer loyalty
on financial performance of an organization.
As noted earher, Hypothesis 2 indicates that customer loyalty in firms with a focus on
strategic human capital management practices escalates on account of the increase in
employee capabihty. Hypothesis 3 indicates that as a result of the increase in
customer loyalty, financial performance in firms paying attention to employee
capabilities increases. Hypothesis 4 indicates that financial performance in firms
focusing on strategic human capital management practices increases in consequence
of the increase in employee capability. They can be shown by the foUowing figure.
Figure 4.17 The direct intervening effect of employee capabihty on financial
performance and indirect intervening effect of strategic human capital
management practices on financial performance
Strategic human
capital management
practices
Employee
capability
1
Customer loyalty
Financial
performance
t
Accordingly, it can be concluded from Table 4.15 and the discussion above that
Hypotheses 2, 3 and 4 are supported.

242
4.8 The assessment and correction of the theoretical model
Analytic resuhs in the preceding sections reveal that no marked relationship existed
between all dimensions of all constracts in this study. According to Bentler and
Bonett (1980), the comparative methods of nested-model analysis of LISREL model
(all the details of LISREL model are explained in Appendix 4) are apphed in this
section to assess the optimum goodness-of-fit model as weU as to study the dhrect,
indirect and overaU effects between each constract.
Each hypothetical model for the comparative methods of nested-model analysis used
in this section is as foUows.
From intervening effect analysis in the preceding section, it has been found that the
PartiaUy Mediated Model is superior to the Null, Direct and Completely Mediated
Models in the effect of goodness-of-fit. Therefore, the Partially Mediated Model
served as inter-model comparative base, namely. Model A, i.e., the existence for the
paths of marked effect as the strategic HCMPs on employee capability, on customer
loyalty and on company's financial performance as well as employee capability on
customer loyalty and on company's financial performance as well as customer loyalty
on company's financial performance (as in Figure 4.18).
Though findings from the analytic resuhs in the previous section show that paths of
the marked relationship each dimension revealed in the regression analysis has been
listed into Model A and the effect of goodness of fit is ideal. However, analytic
results of Pearson cortelation in section 4.3 (as in Table 4.5) reveal that a causal path
relationship could exist among dimensions of each constract, and, therefore, the
subsequent hypothetical model has added paths, unexplored originaUy in the

243
preceding section for assessment and comparison.
Model B is formed by adding the relationship between the change in envnonment
(TCIE) and employee skill and organizational stractiire (ESAOS) in Model A, and the
difference in jf (x diff) resulting from comparing B and A models is 0 (Table 4.16) tiiat
shows Model B is not superior to Model A.
Model C is formed by adding the relationship between the change in environment
(TCIE) and employee motivation (EM) in Model B, and the difference in -^ {yfm)
resulting from comparing C and B models is 0 (Table 4.16) that indicates Model C is
not better than Model B.
Model D is formed by adding the relationship between the change in environment
(TCIE) and employee productivity (EP) in Model C, and the difference in x (X diff)
resulting from comparing D and C models is 0 (Table 4.16) that shows Model D is not
superior to Model C.
Model E is formed by adding the relationship between employee skill and
organizational stracture (ESAOS) and employee productivhy (EP) in Model D, and
the difference in -^ (x diff) resulting from comparing E and D models is 0 (Table 4.16)
that reveals Model E is not better than Model D.
Model F is formed by adding the relationship between employee motivation (EM) and
employee productivhy (EP) in Model E, and the difference in idm) resulting from
comparing F and E models is 0 (Table 4.16) that shows Model F is not superior to
Model E.

244
Model G is formed by adding the relationship between customer complaint (CC) and
customer satisfaction (CS) in Model F, and the difference in y^ (x diff) resuhing from
comparing G and F models is 1.29 (p = 0.2561) (Table 4.16) that demonstrates Model
G is insignificantly better than Model F.
Table 4.16 Comparative analysis of the nested-model for theoretical models
Model
A
B
C
D
E
F
G
i
9.04
9.04
9.04
9.04
9.04
9.04
7.75
df
7
16
15
14
13
12
11
X diff
•
0
0
0
0
0
1.29
dfdiff
9
1
1
1
1
1
GFI
0.99
0.99
0.99
0.99
0.99
0.99
0.99
AGFI
0.94
0.97
0.97
0.97
0.97
0.97
0.97
NFI
0.98
0.98
0.98
0.98
0.98
0.98
0.99
CFI
1.00
1.00
1.00
1.00
1.00
1.00
1.00
RMR
0.041
0.041
0.041
0.041
0.041
0.041
0.040
Standardized
RMR
0.020
0.020
0.020
0.020
0.020
0.020
0.018
Note '• 1. Inter-model comparative base is Model A.
2. GFI : Goodness of Fit Index
AGFI : Adjusted Goodness of Fit Index
NFI •• Normed Fit Index
CFI : Comparative Fit Index
RMR : Root Mean Square Residual
Table 4.16 shows the resuhs of the nested-model comparative analysis and h is
evident that the values of goodness of fit from A to G are not increasing markedly.
Taking GFI and RMR as examples, the models exanuned are more reasonable when

245
GFI > 0.90 and RMR < 0.05 (Bentler and Bonett, 1980). Consequently, the
goodness of fit index for GFI, AGFI, NFI, CFI, RMR and standardized RMR in Table
4.16 reveals that Model G is superior in the index for NFI, RMR and standardized
RMR. From Model A to G, the comparison of the difference in yf {yfm) between
each model shows Model G is superior to other ones; that proves Model G to be a
better one (as indicated in Figure 4.19).
Based on the principle of path parsimony, therefore, Model G is the better path model
by deleting non-significant paths such as identifying HCMPs (IDEN) and the change
in environment (TCIE), developing HCMPs (DEVE) and TCIE, DEVE and employee
motivation (EM), DEVE and employee productivity (EP), protecting HCMPs (PROT)
and EM, deploying HCMPs (DEPL) and EP, DEVE and customer complaint (CC),
DEVE and customer satisfaction (CS), PROT and CS, DEVE and company's
financial performance (PERFORM), DEPL and PERFORM, TCIE and CC, EM and
CC, TCIE and CS, EP and CS, TCIE and PERFORM, EM and PERFORM together
with the path of CS and PERFORM in Model G
The goodness-of-fit index for GFI, AGFI, NFI, CFI, RMR and standardized RMR in
Model G after the deletion of the paths mentioned above is 0.99, 0.98, 0.98, 1.00, 0.05
and 0.024, respectively. None of them violate the views of Bentler and Bonett
(1980). However, there is no significant difference between before and after the
deletion of non-significant paths in Model G due to the x value to be increment effect
(X value before the deletion is 7.75, x value after the deletion is 11.50, the difference
in i is 3.75, the difference in df is 18, p > 0.01).
hi Figure 4.18 and 4.19, each dimension of HCMPs, employee capabihty and

246
customer loyahy mentioned below (i.e., IDEN, DEVE, PROT, DEPL, TCIE, ESAOS,
EM, EP, CC and CS) is defined in Appendix 5. hi addition, PERFORM means
company's financial performance.
As noted above, the nested-model analysis of LISREL is used for exploring the
intervening effect of employee capability on the dimensions of strategic human
capital management practices, customer loyahy and financial performance of an
organization, hi the nested-model analysis, there are four models brought up while
model 1 is Null Model which highlights the model with a non-existence of the relation
paths between each dimension; model 2, the Direct Model which indicates the
existence of paths model with marked effects of strategic human capital management
practices on customer loyalty and on company's financial performance as well as of
employee capabihty on customer loyalty as well as of customer loyalty on company's
financial performance; model 3, the Completely Mediated Model, marks the existence
of paths model with the evident effects of strategic human capital management
practices on employee capability which in tum on customer loyalty, and consequently
on company's financial performance; and model 4, the Partially Mediated Model
which means the existence of paths model with marked effects of strategic human
capital management practices on employee capability, on customer loyalty and on
company financial performance as well as of employee capability on customer loyalty
and on company financial performance as well as of customer loyalty on company
financial performance. The paths models of the direct model, the completely
mediated model and the partiaUy mediated model are portrayed in Appendix 6.
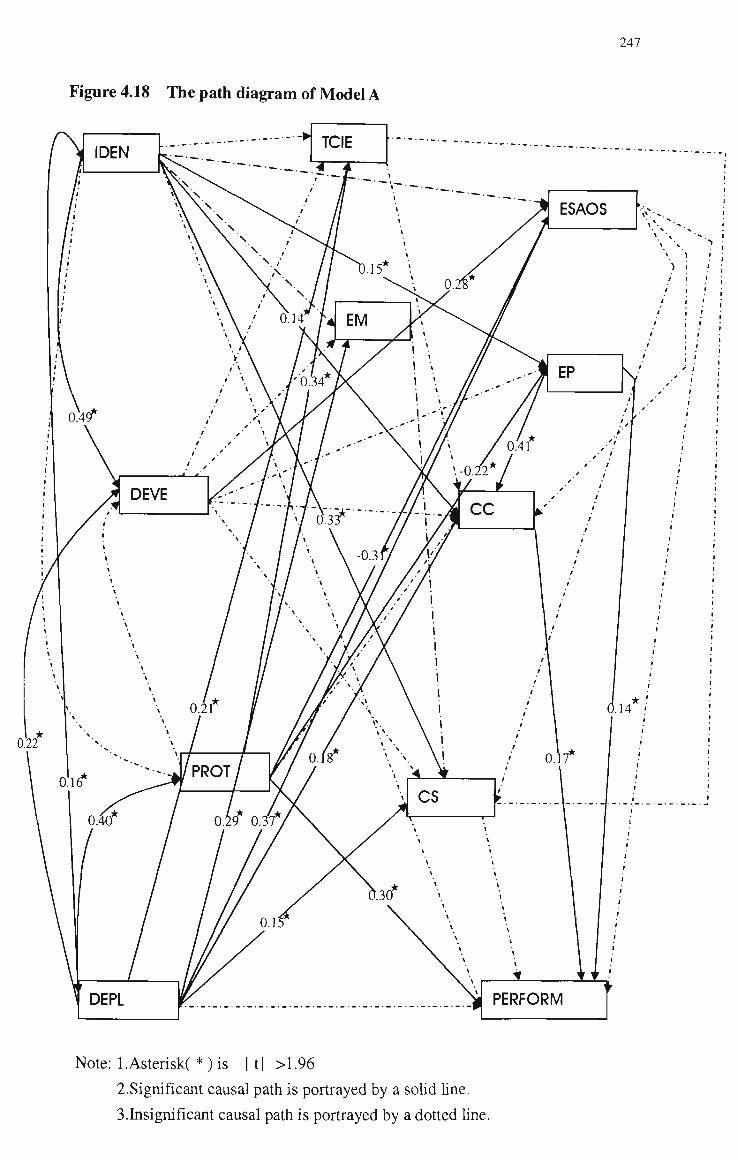
247
Figure 4.18 The path diagram of Model A
Note: l.Asterisk( * ) is | t| >1.96
2.Significant causal path is portrayed by a sohd hne.
3.Insignificant causal path is portrayed by a dotted hne.

248
Figure 4-19 The path diagram of Model G
Note: l.Asterisk( * ) is | t | >1.96
2.Significant causal path is portrayed by a sohd hne.
3.Insignificant causal path is portrayed by a dotted hne.

249
The path coefficients and t values of Model G are applied to examme the direct,
indirect and overall effects of each dimension, and the resuhs are indicated in Table
4.17.
For direct effect, the Table reveals that identifying human capital management
practices has marked positive effects on developing human capital management
practices, deploying human caphal management practices, employee productivity,
customer complaint and customer satisfaction. The Table also shows that
developing human capital management practices has created distinguished effects on
deploying human capital management practices and employee skill and organizational
stracture. It appears that protecting human capital management practices results in
the increase in deploying human capital management practices, causing further
increase in developing human capital management practices. Moreover, protecting
human capital management practices has a marked effect on the extemal environment
the organization faces, further causing deploying human capital management practices.
In addition, protecting human capital management practices has marked effects on
employee skill and orgaruzational stracture, employee productivity and company's
financial performance, further causing developing and deploying human capital
management practices. Finally, deploying human capital management practices has
created distinguished effects on employee motivation, customer complaint and
customer satisfaction and, thereby, corporate performance. However, protecting
human capital management practices brings a marked negative effect to employee
productivity, causing further decrease in company's financial performance.
For the exploration into the indirect effects, Table 4.17 also shows that identifying,
developing and protecting human caphal management practices have created indirect
250
effects on the change in environment the organization faces, employee skiU and
organizational stracture and employee motivation, further affecting each dhnension of
customer loyalty. However, some of them influence employee productivity. On the
other hand, deploying human caphal management practices has an evident negative
indkect effect on employee productivity but the latter does not have any effect on
either dimension of customer loyahy Moreover, deploying human caphal
management practices has not created indirect effects on employee motivation.
For total effects, every dimension in the strategic HCMPs has created evident effects
on each dimension of employee capabihty except that developing human capital
management practices has no effect on employee productivity. Every dimension in
the strategic HCMPs also creates evident effects on financial performance of firms
implementing HCMPs. hi addition, each dimension of employee capabihty has a
marked positive effect on every dimension in customer loyalty except that employee
productivity has no effect on each dimension of customer loyalty. Finally, customer
complaint has both direct and indirect effects on corporate performance. Customer
satisfaction also has a marked positive effect on company's financial performance. It
reveals that each dimension of customer loyalty has created evident effects on
financial performance of the organization.
As noted earlier. Hypothesis 2 indicates that customer loyahy in firms with a focus on
strategic human capital management practices escalates on account of the increase in
employee capability. Hypothesis 3 points out that as a resuh of the increase in
customer loyalty, financial performance in firms paying attention to employee
capabilities increases. Hypothesis 4 specifies that financial performance in firms
focusing on strategic human caphal management practices increases in consequence
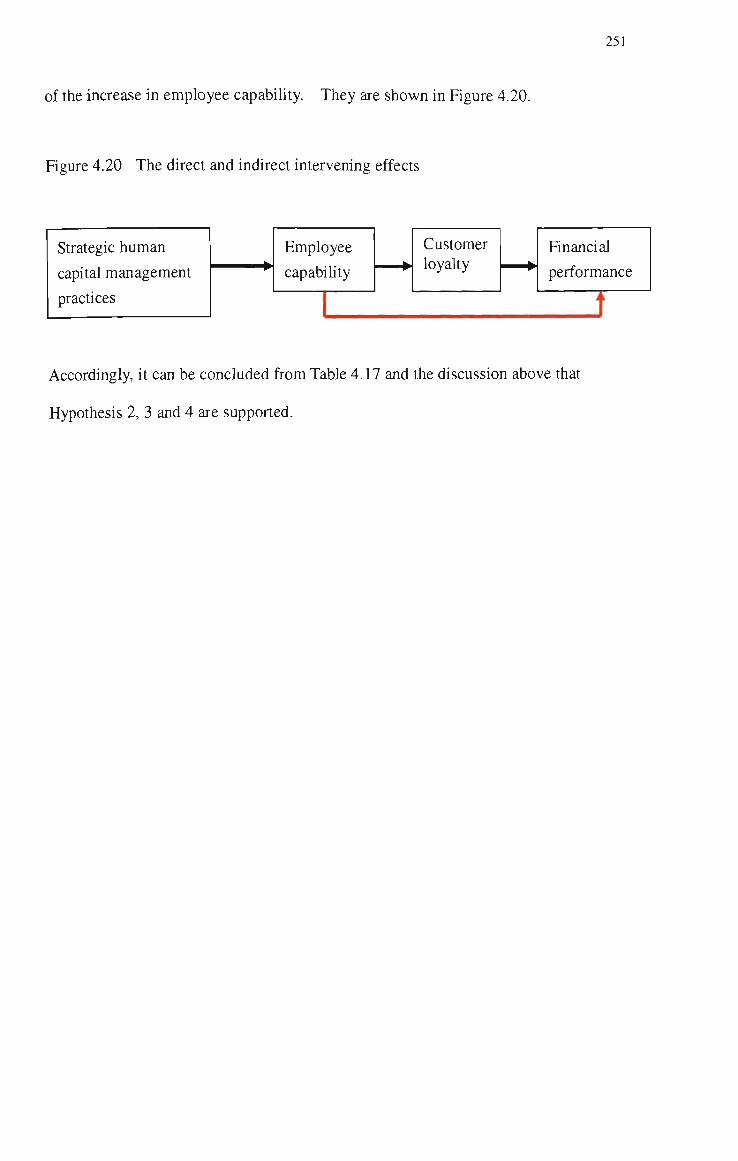
251
of the increase in employee capabihty. They are shown in Figure 4.20.
Figure 4.20 The direct and indirect intervening effects
Strategic human
capital management
practices
Employee
capabihty
1
Customer loyahy
Financial
performance
t
Accordingly, it can be concluded from Table 4.17 and the discussion above that
Hypothesis 2, 3 and 4 are supported.

? Results of synthetic analysis for strategic human capital management practices, employee capability, customer loyalty and performance
Dimension
DEVE
PROT
DEPL
TCIE
ESAOS
EM
EP
CC
CS
PERFORM
DEVE
PROT
DEPL
TCIE
ESAOS
EM
EP
CC
CS
PERFORM
DEVE
PROT
DEPL
TCIE
ESAOS
EM
EP
CC
CS
PERFORM
IDEN
PC
0.49
~
0.16
-
~
~
0.15
0.14
0.32
-
-
-
~
0.03
0.20
0.05
~
0.03
0.02
0.003
0.49
~
0.16
0.03
0.20
0.05
0.15
0.17
0.34
0.003
t
7.07
~
2.53
-
--
-
2.50
2.48
5.60
-
--
-
~
8.93
49.81
12.52
-
7.16
6.10
1.00
7.07
-
2.53
8.93
49,81
12.52
2.50
9.64
11.7
1.00
DEVE
PC
-
~
0.22
~
0.28
-
-
-
~
-
-
~
-
0.05
0.08
0.06
-
0.04
0.03
0.04
-
~
0.22
0.05
0.36
0.06
-
0.04
0.03
0.04
t
~
-
3.40
-
4.73
-
-
-
-
-
-
~
~
12.00
22.00
16.83
-
9.62
8.19
24.44
-
-
3.40
12.00
26.73
16.83
-
9.62
8.19
24.44
PROT
pc
-
-
0.40
0.34
-0.31
-
-0.22
-
-
0.30
-
-
-
0.08
0.15
0.12
-
0.07
0.06
0.04
-
-
0.40
0.42
-0.16
0.12
-0.22
0.07
0.06
0.34
t
~
~
5.96
5.76
-5.58
~
-3.68
~
~
5.02
-
-
~
21.04
38.56
29.50
-
16.87
14.36
50,64
-
-
5.96
26.80
32.98
29.50
-3.68
16.87
14.36
55.66
DEPL
pc
0.22
0.40
-
0.21
0.37
0.29
-
0.18
0.15
~
~
~
-
0.14
-0.06
-
-0.09
-
-
0.15
0.22
0.40
-
0.35
0.31
0.29
-0.09
0.18
0.15
0.15 1
t
3.40
5.96
-
3.53
6.47
4.95
~
2.83
2.41
-
-
-
~
34.33
-17.17
-
-21.93
~
-
37.11
3.40
5.96
~
37.86
-10.70
4.95
-21.93
2.83
2.41
37.11
company's financial
TCIE
pc
-
0.34
0.21
-
-
-
-
-
~
-
0,05
0.08
0.14
-
-0.03
0,06
-0.07
0.04
0.03
0.14
0.05
0.42
0.35
--
-0.03
0.06
-0.07
0.04
0.03
0.14
t
-
5.76
3.53
-
-
--
-
--
-
-
12.00
21.04
34.33
-
-9.30
17.47
-21.20
9.99
8.51
204.84
12.00
26.80
37.86
-
-9.30
17.47
-21.20
9.99
8.51
204.84

Results of synthetic analysis for strategic human capital management practices, employee capabiUty, customer loyalty and company's financial performance (continued)
Dimension
DEVE
PROT
DEPL
TCIE
ESAOS
EM
EP
CC
CS
PERFORM
DEVE
PROT
DEPL
TCIE
ESAOS
EM
EP
CC
CS
PERFORM
DEVE
PROT
DEPL
TCIE
ESAOS
EM
EP
CC
CS
JPERFORM
ESAOS
pc
0.28
-0.31
0.37
-
-
-
-
-
-
-
0.08
0.15
-0.06
-0.03
-
0.11
0.07
0.07
0.06
-0.05
0.36
-0.16
0.31
-0.03
~
0.11
0.07
0.07
0.06
-0.05
t
4.73
-5.58
6.47
~
~
~
-
-
~
-
22.00
38.56
-17.17
-9.30
~
32.03
20.53
18.31
15.59
230.32
26.73
32.98
-10.70
-9.30
~
32.03
20.53
18.31
15.59
230.32
EM
pc
~
-
0.29
~
-
~
~
-
~
-
0.06
0.12
~
0.06
0.11
~
-
0.05
0.04
0.05
0.06
0.12
0.29
0.06
0.11
-
~
0.05
0.04
0.05
t
-
-
4.95
-
-
-
-
-
-
~
16.83
29.50
-
17.47
32.03
-
~
14.01
11.93
183.68
16.83
29.50
4.95
17.47
32.03
~
~
14.01
11.93
183.68
EP
pc
~
-0.22
~
~
~
-
-
-
~
-0.14
~
~
-0.09
-0.07
0.07
-
-
~
-
-0.07
-
-0.22
-0.09
-0.07
0.07
-
-
~
-
-0.21
t
~
-3.68
-
-
-
-
-
~
-
-2.12
--
-
-21.93
-21.20
20.53
-
-
-
-
-18.47
-
-3.68
-21.93
-21.20
20,53
-
-
-
-
-20.59
CC
pc
~
~
0.18
~
~
-
~
-
-
0.17
0.04
0.07
~
0.04
0.07
0.05
~
-
0.03
0.02
0.04
0.07
0.18
0.04
0.07
0.05
~
~
0.03
0.19
t
-
-
2.83
-
-
-
-
-
-
2.54
9.62
16.87
-
9.99
18.30
14.01
-
-
6.82
84.67
9.62
16.87
2.83
9.99
18.31
14.01
~
-
6.82
87.21
CS
pc
-
-
0.15
-
-
-
~
-
~
0.03
0.06
~
0.03
0.06
0.04
-
0.03
-
0.02
0.03
0.06
0.15
0.03
0.06
0.04
-
0.03
~
0.02
t
-
-
2.41
~
-
-
-
~
-
8.19
14.36
-
8.51
15.59
11.93
-
6.82
-
89.43
8.19
14.36
2.41
8.51
15.59
11.93
-
6.82
-
89.43

25-)
Results of synthetic analysis for strategic human capital management practices, employee capability, customer loyalty and company's financial
performance (continued)
Dimension
)EVE
ROT )EPL
CIE iSAOS
!M iP :c :s 'ERFORM
)EVE
'ROT
)EPL
rciE iSAOS
M I? X :s 'ERFORM
DEVE
'ROT
)EPL
rciE iSAOS
iM
iP
X :s 'ERFORM
PERFORM
pc
~
0.30 ~
~
—
~
-0.14
0.17 —
—
0.04
0.04
0.15
0.14
-0.05
0.05
-0.07
0.02
0.02 —
0.04
0,34
0.15
0.14
-0.05
0.05
-0.21
0.19
0.02 —
t
—
5.02 —
—
—
—
-2.12
2.54 —
—
284.26
50.64
37.11
204.84
230.32
413,84
-18.47
216.26
201.49 —
284.26
55.66
37.11
204.84
230.32
413.84
-20.59
218.80
201.49 ~
iisignificant/3 coefficient is indicated by a dash,
-means path coefficient.
E means direct effect,
means indirect effect,
i means total effect.
will find the definition of each dimension of HCMPs, employee capability and customer loyalty mentioned above (i.e., IDEN, DEVE, PROT, DEPL,
'E, ESAOS, EM, EP CC and CS) in Appendix 5.
iRFORM means company's financial performance.

255
Notes
1. An intervening variable is one that is both a product of the latent independent
variable and a cause of the latent dependent variable (Bryman and Cramer,
1997).
2. Concerning the ownership of sample firms used in this study, there are 138
Taiwan-owned stores that take a valid percent of 52.1% while another 124
intemational owners taking 46.8% comes next In organizational stmcture,
120 stores featuring several hierarchical levels of organizational structure
significantly have a valid percent of 45.3%, followed by another 94 stores
highlighting dependence on regulations or standards of job that take 35.5%.
Concerning the orientation of organizational stmcture, there are 180 stores
characterized by function having a valid percent of 68.2% and 169 are
characterized by geographical areas that takes 64.5%.
3. In the same fiscal year (2001), there are 69 stores (taking 26.4% of valid percent)
with more than 20% of sales revenue coming from new product while 61 (taking
23.4%) have 16%-20% of sales revenue coming from new product
4. Specification tests for multi-collinearity include the review of the tolerance and
variance infiation factor for each coefficient. Specification tests for
heteroscedasticity include the review of plots of the residuals and the White test
(White, 1980).
256
Chapter 5 Conclusions and Implications
5.1 Introduction
There are numerous types of corporate strategies aiming at creating enterprise value
(e.g., promote the total qualhy management, establish circumspect marketing channel
and develop strategic human resources). This study examines several strategic
factors of human caphal management practices (HCMPs) that help explain variations
in structural antecedents of enterprise value. As noted in the preceding chapters,
HCMPs view employees' behaviour from a standpoint of human nature, not only
emphasizing their performance of results but also asking those seiuor executives to
build interactive relationships with employees and give positive encouragement in the
process of working. In attempting to create those interactive relationships, strategic
factors of HCMPs make the most appropriate identification, development, protection
and deployment for all HCMPs in an organization.
The balanced seorecard (BSC) which originated in the early 1990s is a management
tool used by Norton and Kaplan (1992, 1996a, 1996b, 1996c, 2001a and 2001b) to
link enterprise vision and operating strategy with an action plan. The BSC has
promoted management team's operating philosophy and enterprise vision for future
development hierarchically to all employees, making them understand the practical
need for the company's future trend that further enables employees' goals and efforts
to be consistent with these of the company.
For the BSC of an enterprise, what revelations can the implementation of the HCMPs
bring? The HCMPs of an enterprise has long been defined as a role of
administrative standby, e.g., attendance and absence, distribution of pay, annual
257
performance appraisal and educational training, etc., that makes it difficuh for
HCMPs to highhght their economic value, h was not until quite recently that Tichy
et al. (1982) and SneU (1992) brought forward the roles of HCMPs such as
reformation promoter, strategy partner and administrative expert that a close
relationship between HCMPs and corporate strategy has been delineated. Strategic
practices of HCMPs are reflexes of strategy planning while the protection and
deployment of strategic HCMPs are viewed as the company's asset, both of which can
help the enterprise vision to be realized.
The apphcation of the HCMPs to BSC is to focus on the development on the strength
of improving employee capabihty that further helps to enhance enterprise growth.
The flow process of HCMPs (i.e., selection, employment, training and retention of
talents), therefore, is used to reveal how strategic HCMPs play the role of "scoring".
In an era rife with the knowledge economy and the Internet, strategic HCMPs have an
inescapable duty to play a more positive role, i.e., increase enterprise value. The
actual example for enterprise value frequently applied and measured is the role played
when enterprises face merger and acquisition (M&A) and most examples of M&A in
recent years feature the fact that book values of those acquired are far lower than the
acquired market values, with the differentiation coming from the "intellectual capital",
i.e., the part of strategic HCMPs^
Earher research on HCMPs and BSC has produced little and partly contradictory
evidence about the role of moderator variables in explaining the relationship between
non-financial information and financial performance. Moreover, httle prior research
has thus far been done to provide empirical evidence either supporting or refuting
simultaneous links among non-financial metrics and their intervening effects on

258
corporate performance of firms taking HCMPs and BSC into consideration. This is
particularly true with respect to the use of personnel control mechanisms that has been
shown to be an important moderator in justifying the relationship between strategic
HCMPs and employee capabihty.
The present study indicates that an effective implementation of strategic HCMPs is
regarded as a pre-requisite step to practise BSC successfully. Employee capabihty,
customer loyahy and fmancial performance of firms implementing strategic HCMPs
are imbued with the same spirit with each being related. Just think: it shall be
actually a castle in the air that one enterprise with a high market share and continuous
business growth still can sustain a long-term operation while its employee capability
has kept on falling, quahty of products has long been criticized by consumers, and the
whole batch of products has always been suffering from being returned.
Consequently, the present study advocates: while evaluating the performance for an
enterprise practising strategic HCMPs and BSC, one issue that should be explored is
how the relationship between strategic HCMPs and employee capability is moderated
by personnel control mechanisms, and how the moderated effect brings an influence
to the intervening relationship between employee capability and corporate
performance caused by customer loyalty.
The main purpose of this study is to develop and empiricaUy test a model hnking
non-financial information with financial performance by integrating several sources
of literature concerning HCMPs and BSC and using a survey-based research method.
Drawing on previous research, the present study argues that the moderating effect of
personnel control mechanisms on the relationship between strategic HCMPs and
employee capabihty influences corporate performance indirectly through the hnkage

259
between employee capabihty and customer loyalty. This study also argues that the
aforementioned effect is related to the intervening relationship between strategic
HCMPs and customer loyalty, and between employee capabihty and corporate
performance.
In the selection of samples, an application of strategic HCMPs has a significance to
enterprises implementing Total Quality Management (TQM) (Ohver and Davies,
1990) and Just-in-Time (JIT) inventory control (Klein, 1991); hence, corporations
implementing TQM and JIT currently are the main objects of this study. Using a
sample of 265 Taiwan and China managers from various stores, the moderator
hypothesis is tested. Two dimensions of personnel control mechanisms are paired
with four strategy factors (e.g., identification, development, protection and
deployment) of HCMPs and four outcome variables of employee capability,
generating 32 possible moderating effects.
The interactions of each strategy factor of HCMPs and every moderator overall
explain additional variance in the criteria. There is much evidence that the
moderating relationships between strategy factors of HCMPs and each dimension of
employee capability are mostly caused by the first moderator (i.e., structural control)
of personnel control mechanisms. The moderating effects found in the second
moderator (i.e., dialogue communication) of personnel control mechanisms are few
and of modest strength. In 14 out of the 32 possible interactions (43.75%),
significant moderated effects are found (Table 4-8 and 4-9). The evidence has
shown some support of the moderator hypothesis postulated.

260
In the case of the relationship between the identification of strategic HCMPs and
employee productivity, the development of strategic HCMPs and each dimension of
employee capabihty (e.g., the change in environment the organization faces,
employee skill and organizational structure, employee motivation and employee
productivhy), the protection of strategic HCMPs and three dimensions of employee
capability (e.g., employee skill and organizational structure, employee motivation and
employee productivity), the deployment of strategic HCMPs and each dimension of
employee capability, a high rehance on the moderators of personnel control
mechanisms is associated with a stronger relationship between strategic factors of
HCMPs and outcome variables of employee capabihty, a low need for the moderators
of personnel control mechanisms with a weaker relationship, offering some support
for the moderator hypothesis proposed in the present study.
As noted earlier, the present study also examines the intervening association between
non-financial information and financial performance in high-tech manufacturing
companies using advanced manufacturing technology and JIT inventory control and
service firms implementing TQM. The results of the nested-model analysis reveal
that the partially mediated model is superior to the others (i.e., nuU model, direct
model and completely mediated model), h is evident, from the partiahy mediated
model, that the causal relationship between employee capability and corporate
performance not only stemmed from the direct impact of employee capability on
corporate performance but also developed from the indirect effect through the linkage
between employee capability and customer loyalty. Hypotheses concerning the
intervening effects have been supported. In the following figure, significant
moderator and intervening variable are indicated in bold type.

261
Figure 5.1 Significant moderator and intervening variable in the moderating and
intervening effects
Personnel control mechanisms
Structural
control
Strategic human capital management
practices
Identifying strategic human
capital management practices
Developing strategic human
capital management practices
Protecting strategic human capital
management practices
Deploying strategic human
capital management practices
Employee capability
The change in
environment
Employee skill
and organizational
structure
Employee
motivation
Employee
productivity
_3 Customer loyalty
Customer complaint Customer satisfaction
Financial performance of an organization
Gross rate of return on capital
Sales revenue growth Net income before tax

262
Comparing Figure 2.10 with Figure 5.1 indicates that the relafionship between
strategic HCMPs and employee capabihty is moderated by the control factor of
personnel control mechanisms. Figure 5.1 also points out that the relationship
between employee capability and corporate performance is affected by an intervening
variable, customer complaint, and the development and deployment of strategic
HCMPs act as a leading indicator of corporate performance.
5.2 Implications for theory development
Several important findings emerge from this research. First, using structural
equation modelling to test a theoretical model, evidence was found for the moderating
relationship between strategic HCMPs and employee capability caused by personnel
control mechanisms. The moderating effect is related to the competitive advantage
of firms implementing strategic HCMPs, and employee capability brings an effect to
the intervening relationship between strategic HCMPs and customer loyalty. The
evidence reveals strong empirical support for the moderating positive relationship
between the development of strategic HCMPs and employee motivation, between the
protection of strategic HCMPs and employee motivation, between the deployment of
strategic HCMPs and employee productivhy, and between the deployment of strategic
HCMPs and employee skill and organizational structure.
This study, therefore, contributes to the swiftly growing human resource management
literature in that it is the first study to cortoborate the moderating positive relationship
between the implementation of strategic HCMPs and employee capabihty.
263
Second, this research demonstrates that one important factor of HCMP success is the
degree to which the whole HCMP philosophy has been put into practice. Firms
providing employees access to information about their work processes are capable of
implementing strategic HCMPs for competitive advantage. This finding adds force
to Kaplan and Norton's (1996 a, b and c) arguments that firms implementing BSC
need a leaming environment in which to work effectively since employees are
expected to share information about intemal business processes of their organization
for continuous improvement.
Third, the evidence also reveals that stmctural control and dialogue communication
pertaining to personnel control mechanisms are mutually reinforcing. The findings
in the high-tech manufacturing companies implementing TQM and JIT inventory
control provide some evidence that HCMPs-adopting firms have experienced the
synergistic effects of combining structural control and dialogue communication on the
moderating relationship between strategic HCMPs and employee capability.
However, the conclusions must be tentative about the moderating effect of personnel
control mechanisms on strategic HCMPs because no significant moderating positive
relationship between the identification of strategic HCMPs and employee capability
was found. This resuh may have been caused by cuhural heterogeneity (Taiwan vs.
China) and the identification of strategic HCMPs may entail a shghtly different set of
operational indicators across cultures.
Fourth, the analysis of structural equation modehng in this study confirms a
significant intervening effect of employee capabihty on corporate performance
through the hnkage between employee capabihty and customer loyalty. The main
contribution to theory development is in extending the hne of inquiry regarding the

264
association between employee capabihties and financial performance in firms
considering the implementation of strategic HCMPs. Another contribution is the use
of a formal study of the principles underiying the design of performance measurement
systems by providing evidence on both dkect and indirect (via employee capabihty
and customer loyalty) impacts of employee capability on financial performance.
These findings support the view that the implementation of strategic HCMPs will be
positively associated with the reliance on some dimensions of personnel control
mechanisms, and there is, indeed, a significant impact of non-financial accounting
information on financial performance.
Fifth, resuhs from the nested-model analysis (Table 4.15) indicate that the partiaUy
mediated model provides a comprehensive explanation of the structural relationships
among each dimension of the four multi-dimensional constructs. This is indicated
by the model's fit indices. In Table 4.15, the inclusion of the relationship between
employee capability and corporate finance substantially improves the model's fit
indices. The addition of the relationship between strategic HCMPs and customer
loyahy also significantly makes better the model's fit indices.
Using a directive rule suggested by Anderson and Gerbing (1988), the partially
mediated model is found to be the most preferred one (for the reasons stated earher).
hi this model, the moderating relationship between strategic HCMPs and employee
capabihty appears consistent with research by Tichy et al. (1982). The intervening
relationship between employee capabihty and corporate performance influenced by
the aforesaid moderating effect is consistent with research by Kaplan and Norton
(1996a, 1996b and 1996c). They suggested that corporate performance was likely to
be a consequence of a great improvement in employee capability through the hnkage

265
between employee capabihty and customer loyahy, and a number of hnprovements in
employee capability often resuh from effective human resource management. The
present study maintains the aforesaid structiires, but there are some addhions of the
moderating effect of personnel control mechanisms on strategic factors of HCMPs.
This clearly provides evidence for the resource-based interpretation of the BSC
theory.
Sixth, Pillai et al. (1999) argue that the data used in structural equation modelhng are
cross-sectional and based upon subordinate perceptions, the direction of causahty
among latent variables may be oversimplified if only one model is evaluated.
Ahhough the present study takes up data from store managers in different geographic
regions of Taiwan and China, it is evident that the strategy of testing multiple
structural equation models based on a reasonable review and synthesis of the literature
is definitely essential for the sensible use of the aforementioned line of attack.
5.3 Implications for practising managers
The present study has significant imphcations for practising managers.
• Four strategic practices of HCMPs appear to function as an integrated system.
• The development and deployment of strategic HCMPs represent the indispensable
facets of employee capability.
• The protection of strategic HCMPs is beneficial to employee motivation.
• A balance between dimensions of personnel control mechanisms is useful for the
implementation of strategic HCMPs.
• The management methods of human resources and advanced production and
marketing techniques should supplement each other.
266
• For those enterprises taking BSC into consideration, strategy causation and the
attainment of leading indicators driving lagging ones have no hraitation of
organization scale and features of industry.
• hi the process of an introduction of the BSC, h is necessary for senior executives to
eliminate the different degrees of cognition among employees caused by
insufficient communication.
• A pointless replication of other enterprises' BSC will never bring the advantages of
the BSC into full play.
• h is necessary to pay attention to employees' rewards and punishments through a
connection of the implementing results of the BSC with the application of strategic
HCMPs.
First, the findings about strategic HCMPs suggest the four strategic practices
moderated by personnel control mechanisms — identification, development,
protection and deployment — appear to function as an integrated system. This
encourages firms implementing TQM and JIT inventory control to invest the
resources to put into practice comprehensive HCMPs and to invest in specific types of
knowledge to improve efficiency of intemal business processes, not just certain
dimensions of strategic HCMPs.
Second, the instruments used in the present study are available for practising
managers to measure their own manufacturing companies or service firms for all the
constructs examined. If managers want to elicit performance beyond the call of duty
among their employees, they should work at improving the development and
deployment of strategic HCMPs moderated by personnel control mechanisms. The
two strategic factors of HCMPs represent the indispensable facets of employee
267
capabihty and determine the quality of the products or the services the manufacturing
company or the service firm is able to provide to hs customers, through their effects
on employee motivation and employee productivity.
Third, the negative relationships between the development and protection of strategic
HCMPs and employee motivation were strongly reversed by the fu-st moderator (i.e.,
structural control) of personnel control mechanisms, ft is evident that store
managers of firms implementing strategic HCMPs will normaUy be advised to be
supportive and develop and protect their strategic HCMPs as much as possible.
Fourth, the evidence from the present study provides tentative support for the
argument that firms taking TQM and JIT inventory control into consideration must
balance structural control with dialogue communication in order to develop strategic
HCMPs efficiently and then to deploy strategic HCMPs effectively. It seems that an
organization implementing TQM and JIT inventory control needs to have personnel
control mechanisms that enable strategic HCMPs to function very well while taking
new ways to generate customer value into consideration.
Fifth, changes in human resources management by the organization have close
causations with production and marketing. Should the^ jnanagement methods of
human resources and advanced production and mad^eting techniques not supplement
each other, competitive advantages for the orgarniation disappear graduaUy.
Sixth, regardless of company size and characteristics of industry (as described in
Table 4.4), for those enterprises with unclear
about a hierarchical deduction from clarifying vision, mapping out strategy and
vision and strategy, the BSC is particular

268
selecting key measuring indicators to carry out action plan. The entire
implementation process can enable senior executives' intensive dialogues and confirm
the enterprise vision and the development of business strategy through the process of
mutual communication and opinion integration. On the other hand, aiming at those
enterprises which have implemented the BSC, it may probably be that estabhshed
vision, business strategy and measuring indicators will be refined due to changes in
intemal and extemal condhions when implementing the BSC.
Seventh, employees will generate a state of mind of resistance due to insecurity when
confronting grave change and reformation. The introduction of the BSC, in general,
will definitely be a reformation of management control systems for enterprises.
Hence, it is an inescapable responsibility for senior executives to make clear and
definite announcements to all employees, making them understand the direction of
future development for enterprise and behavioral performance considered to be
important by the enterprise and further guiding their efforts to eliminate the different
degrees of cognition among employees caused by insufficient communication.
On the other hand, it is indispensable for all employees to fully comprehend what
their roles are in the process of an introduction of the BSC, the reasons the company
to introduce the BSC and employees' goal of efforts requested by the company.
Only through good communication can employees understand the company's future
operating direction and then generate a sense of trust and, eventuaUy, can the driving
force of implementing the BSC be generated. Consequently, in the process of an
introduction of the BSC, the company should never neglect employees' feehngs but
offer sufficient information appropriately, persuading them to support the company's
measures and conmut their efforts for the development of the company strategy.

269
Eighth, never simply imitate the BSC developed by other companies while only
through connection of theory of the BSC with enterprises' concrete and practical
conditions can the efficacy of the BSC be brought into full play As different
companies have different backgrounds, visions and missions, strategy goals of the
enterprise's BSC and hs measuring indicators are different, even the same strategy
goals may require different indicators for measurement, hi a word, each enterprise
shaU develop the BSC with hs own characteristics. An aimless imitation of other
enterprises' BSC will never bring the advantages of the BSC into fuU play but would
affect the accurate evaluation to enterprises' operating performance.
Ninth, even though every employee in the company is different in their own duty, the
introduction of the BSC will enable everyone to understand the enterprise's strategy
goals that would benefit work as a team, and further help to hft personal working
ability and efficiency. To bring the effect of the BSC into full play, the
implementation of the BSC in major departments is necessary so as to make the
attention for each department focus on each individual's working performance. Thus,
it is indispensable to pay attention to employees' rewards and punishments through a
connection of the implementing results of the BSC with the application of strategic
HCMPs so as to achieve a better effect.
5.4 Limitations
Despite the encouraging implications mentioned above, several limitations of the
present study should be noted.
• The potential for specification error resuhing from the oversight of relevant
dimensions.
• The possibility of measurement error developing from lengthy questionnake items.

270
• The generahzation of the findings is hmited by no-response bias.
• The generahty of the evidence is restricted by the selected samples^.
• Practical complexity appears in any statistical test of a BSC.
• Dialogue communication should be carefully used.
Fhst, the functioning of strategic HCMPs is carried out through a set of practices
providing for strategic factors of HCMPs. Competitive advantage of fums
implementing strategic HCMPs is based not on individual management practice, but
on a series of practices that combine to support strategic factors of HCMPs. There
may be the potential for specification error resulting from the oversight of relevant
dimensions. The use of a theory-based model in the present study nunimizes such
an error; however, it cannot be entirely mled out.
Second, the questionnaire includes 92 items making it very lengthy. This may have
given rise to measurement error, particularly for the constructs of strategic HCMPs
and employee capability.
Third, the most unfavourable shortcoming of using postal surveys is to bring in
non-response bias where non-respondents may hold views that are meaningfully
different from those of respondents, thereby limiting the generalization of the findings
of this study. Moreover, survey data suffer from the common disadvantages of
self-directed behaviour information, such as imprecision from poor memory.
Fourth, the sample of the present study was hmited to manufacturing companies and
service firms in China and Taiwan, and particularly to organizations implementing
TQM and JIT inventory control. The findings of this study are therefore limited to

271
these populations only.
Fifth, Malina and Seho (2000) argue that practical intricacies that wiU occur in any
statistical test of a BSC comprise desired effects that may be brought about by other,
related factors, being ascribed to the BSC. Thus, there is a need, in this study, to
create better instmments for the constmct of customer loyahy, such as more
customer-level variables, including demographics, the uncertainty the consumer feels
about the product ingredients and manufacturing quality they wiU experience on
consumption, and the factor mitigating customer's willingness to pass positive or
negative comments to friends, ft may also be possible to create better instmments
for the constmct of employee capabihty, such as variables conceming the relationship
between store manager's inspirational skiUs and employee satisfaction, and store
manager's support and work stress of the employee.
Sixth, Pillai et al. (1999) argue that inadequate preparation of dialogue
conununication is a momentous source of poor corporate performance and that the
aptitude to communicate organizational knowledge and strategy in an effective
manner may be a root of competitive advantage. The second moderator (i.e.,
dialogue communication) of personnel control mechanisms should be more carefully
used, since, when moderated too much, it may bring strongly unhelpful impacts to
employee skill and organizational stmcture and employee motivation,
5.5 Further research
Various limitations mentioned above suggest avenues for future research.
First, as more and more successful organizations implementing strategic HCMPs
attempt to link everything to the constmcts of the BSC, h nught be useful to examine

272
the various antecedents of ehciting performance beyond the call of duty among
employees. For instance, the impact of strategic factors of HCMPs on managers'
subjective evaluations of subordinates, and more objective indicators of performance
needs investigation. Specifically, managerial performance appraisal depends on a
detailed knowledge about outcomes associated with managerial actions or knowledge
about cause-effect relationships.
Govindarajan (1984) argues that the uncertainty of task environment refers to
unpredictability in the actions of the employees, customers, suppliers, competitors and
regulatory groups. The essential consequence of uncertainty is to limit the ability of
organization to pre-determine and quantify desired targets. Based on this line of
research and the findings of the present study, it would be worthwhile to examine
whether an increase in eliciting performance beyond the call of duty includes the
assessment of the interrelationship between stmctural control (initial stages of
personnel control mechanisms) and dialogue communication (later stages of
personnel control mechanisms) and the differential relationships they obtain with the
measurements of corporate performance.
Second, in the situation of the present tendency of dismissal in Taiwan and China,
companies implementing strategic HCMPs are more and more tmsting in the
exceptional exertions of fewer and fewer employees. Tichy et al. (1982) argue that
managers who govem companies with much experience in managing diversity may
have to balance the requirement in reducing recmhment with coordinating and
communicating a concem for human resource management of the organization.
Thus, h might be useful to examine the various antecedents of the protection and

273
deployment of strategic HCMPs and assess the empirical interrelationships among
strategic factors of HCMPs in the context of layoffs.
Third, corporate performance is a function of variables both from inside an
organization (e.g., employee capabihty, plant and equipment, and other resources for
increasing economies of scope) and from outside the organization (e.g.,
compethiveness in the market place, the fluctuation of the macro-economy and other
factors having an effect on economies of scale). The sample employed in this study
consists of only five large manufacturing companies and service firms. The resuhs
cannot be generalized beyond large professional service firms and intemational
companies tmsting in advanced manufacturing technology without further research.
The effects of strategic factors of HCMPs, in particular, and the consequence of
important econonuc resources, in general, needs to be examined further in other
countries to test the generalizability of this study's results.
Fourth, the functioning of the development, protection and deployment of strategic
HCMPs simultaneously could allow firms implementing BSC to serve their customers
in helpful and exclusive ways that are difficult to mimic. These firms may, for
example, be able to develop special services in particular geographic regions by
deploying uniquely valuable knowledge and skills and managing them effectively.
Thus, it might be useful to examine a human resource-competitive strategy
contingency fit, especiaUy research on economic resources and compethive strategies
for increasing economies of scope and having an effect on economies of scale.
Whether firms with relatively complex stmctures and much experience in
implementing BSC may benefit from the new way of developing strategic factors of

274
HCMPs, particularly if these firms do not have strong human caphal, needs to be
examined further.
Fifth, this study reveals that strategic HCMPs have performance imphcations. ft also
shows that early investments in strategic HCMPs (e.g., strategic identification of
HCMPs) may not create sufficient revenues to make up for the costs (i.e., the cost of
monitoring for ensuring quality outcomes and the cost of general management for
assigning tasks, coordinating activities and evaluating employees). Hitt et al. (2001)
argue that time is required to develop managerial skiUs, to build social capital and to
manage the firm's other human capital, ft might be helpful to examine when
investments in strategic HCMPs (ie., creating valuable tach knowledge and building
intellectual employee capability) begin to reap substantial benefits, and when these
investments become less costly. It seems that the design of management accounting
systems should provide accounting information for all organizational levels in order
to stimulate the design of monitoring and leveraging human capital. However,
information required is generally non-accounting in nature and controls are not
effectively captured in financial reports. For example, professional hubris
sometimes tums away effective monitoring and leveraging of human capital (Hitt et
al., 2001). In this study no attention was paid to the complexities of a multi-faceted
management accounting system with the information functionality mentioned above.
Future research might involve studies investigating the relationship between applying
and leveraging of strategic HCMPs-
Sixth, h is difficult to explain, conceptuaUy, why this study finds the moderating
relationship between strategic HCMPs and employee capability caused by stmctural
control (and not dialogue communication) to be significant. Perhaps employees

275
regard stmctural control as instmmental in acquiring rewards and appreciation from
the manager, although inspkational motivation and inteUectual stimulation are more
likely to be the result of dialogue conununication. Obviously, this unanticipated
consequence in the present study draws attention to the need to test the moderated
effects of personnel control mechanisms on strategic HCMPs in other settings,
perhaps taking up a longitudinal design.
Notes
1. Generally, senior executives of those acquiring enterprises will emphasize business
strategy, production line, brand name, channel and accounting assets at the very
inception of acquisition. Those usually neglected come as the advantages of core
competency, intellectual capital, enterprise culture and human resources, and it is
necessary for those enterprises intending to conduct acquisitions to evaluate the
explicit part (business strategy, production line) as well as the tacit part (core
competency, intellectual capital, enterprise culture and human resources).
General speaking, the relationship between acquiring and acquired enterprises
should be a supplemental one, while the role of HCMPs lies in playing a role of
"scoring" so as to create enterprise value and profit at the time of merger and
acquisition (Hitt et al, 1990).
2. Some of the selected samples in this study come from Mainland China upon
conducting interview with top managers, both in China and Taiwan, with the results
indicating that:
(i)Disadvantageous factors for China in economic development are limited
intemational market, restriction of domestic resources, difficulty in reform of
organizational system and issues of financial bad debts.
276
(iijThough a country with a big market, the domestic trade in China has turned out to
be regional with serious trading barriers between each province that lead to a quite
difficuh business promotion. For example, though not in infringement of
regulations of WTO, there are high tax payments for many important products
which are sold trans-regionally that would not really enable Taiwanese
businessmen to share the market Consequently, small regional businesses such
as convenience stores, supermarket and chain stores are most easily successful in
Mainland China.
(iii)Taiwanese products are neither recognized as domestic ones nor as foreign ones,
while Taiwanese businessmen can hardly take a good control of channels and have
been squeezed out by the local and foreign enterprises. The urgent matter right
now is finding a position on the life cycle of products to develop their own brands
and channels.
(iv)Should the domestic resources in Taiwan not be sufficient to support large-scale
enterprises (e.g., electronic corporations with annual operating revenue over one
hundred billion dollars) for further development, those enterprises with their head
office established in Taiwan may carry out intemational division of work and
resources allocation by recognizing Mainland China and Taiwan as the same core
market.

277
Appendix 1: Invitation letter, the item structure of the questionnaire (English version) and variable factors for each dimension of four multi-dimensional constructs after deleting items with poor inconsistency
o Invitation letter
Dear Participants,
I am working towards a Doctor of Philosophy degree. The research project being
undertaken seeks to assess the relevance of the adoption of the balanced seorecard
(BSC) and the implementation of human capital management practices (HCMPs) by
Taiwanese and China companies through the theoretical models of organizational
management and strategic control. To ensure the vahdity of results a reply to the
attached questionnaire would be greatly appreciated.
You are invited to participate in this project. While your cooperation in completing
the questionnaire is valued, your participation is voluntary. The results will be used
only in an aggregated form and therefore your anonymity and the confidentiality of
your responses are assured. The completed questionnaire will be securely stored and
available only to the supervisors and myself. The only people to have access to the
codes are my supervisors and myself
The resuhs will be contained in the thesis which will be available at the Victoria
University of Technology library. It is also hoped that aspects of the resuhs will be
pubhshed in aggregate in various professional and academic joumals.
Your participation would be appreciated and I look forward to receiving your
completed questionnaire by the end of ( ). Should you have any queries
regarding the project or questionnaire, please feel free to contact me on (04)
26326833 or e-mail: ccving2001 @vahoo.com.tw or my senior supervisor. Professor
Robert Clift on e-mail: [email protected]. Your reply can be retumed to my
collection base in 14 Ln 127 Yung-Tung St., Lung-Chin, Taichung, Taiwan in the
prepaid envelope supplied.

278
Thank you in anticipation of your cooperation.
Yours faithfully.
Chun-Che Chen

279
The item structure of the questionnaire (English version)
hi recent years, the balanced seorecard (BSC) has been implemented in organizations
that recognize that managers need more than traditional financial measures to mn
their businesses well. The BSC hnks individual efforts and accomphshments to
business unh objectives and serves a strategic feedback system.
Many firms have recentiy been emphasizing the use of non-financial measures, such
as employee capability, product quality and customer loyalty, as an integral part of
their management control system. In addition, many firms have begun to question
the appropriateness of traditional financial measures and controls, and intend to
redesign their management control system to include more non-financial measures
and controls.
In today's "information-age" or "new economy", a firm's primary strategic resource
is often knowledge. However, fmancial statements do not adequately capture human
capital. Therefore, how firms that exercise strategic human capital management
practices design their management control system is very important.
The foUowing items stmcture of a questiormaire studies the hnks between strategic
human caphal management practices, employee capability, customer loyalty and
company financial performance. Thus, this study will provide useful information
about these links and wiU be published in professional and academic joumals. Your
responses will be treated as strictly CONFIDENTIAL and no information gained from
this survey wiU be identified with any particular person or organization; therefore, do

280
not identify yourself or your organization on this questionnake (unless you desire to
receive a copy of our results, in which case you should provide your maihng address
in the space provided on the last page of this questionnaire). Please note we have
written these questions to be applicable to many types of business and industry and
we know the language used may not exactiy apply to your situation. Nevertheless,
please answer the questions as best you can. If you are certain that your response
would be nusleading, please leave the specific question unanswered. We begin with
demographic questions about pergonal and business conditions, and then, strategic
human capital management practices, employee capability, customer loyalty and
company financial performance.
Thank you very much.
Section 1: Demography
1. What is your gender?
a) Male b) Female
2. To which of the following age group do you belong?
a) Under 25
c) 36-45
b) 25-35
d) 46-55 [
e) 56-65 f) Over 65
281
3. Please indicate the highest level of education achieved
a) Senior middle school
c) University
e) Ph. D.
b) College
d) Master
4. Where did you achieve the highest level of education?
a) Taiwan
c) UK
e) Other
b)USA
d) Australia
Please specify the country
5. hi your company hierarchy your rank is (circle a number in the scale):
Low level
1 2 3 n Middle level
4 5
D
High level
6 7 : n 6. Your background is in (indicate one or more items)
I I Marketing (Sales), [ ^ Production, | j Accounting,
I I Finance, [_j Engineering | | General Administration,
I I Purchasing, | | Other (please mention it)
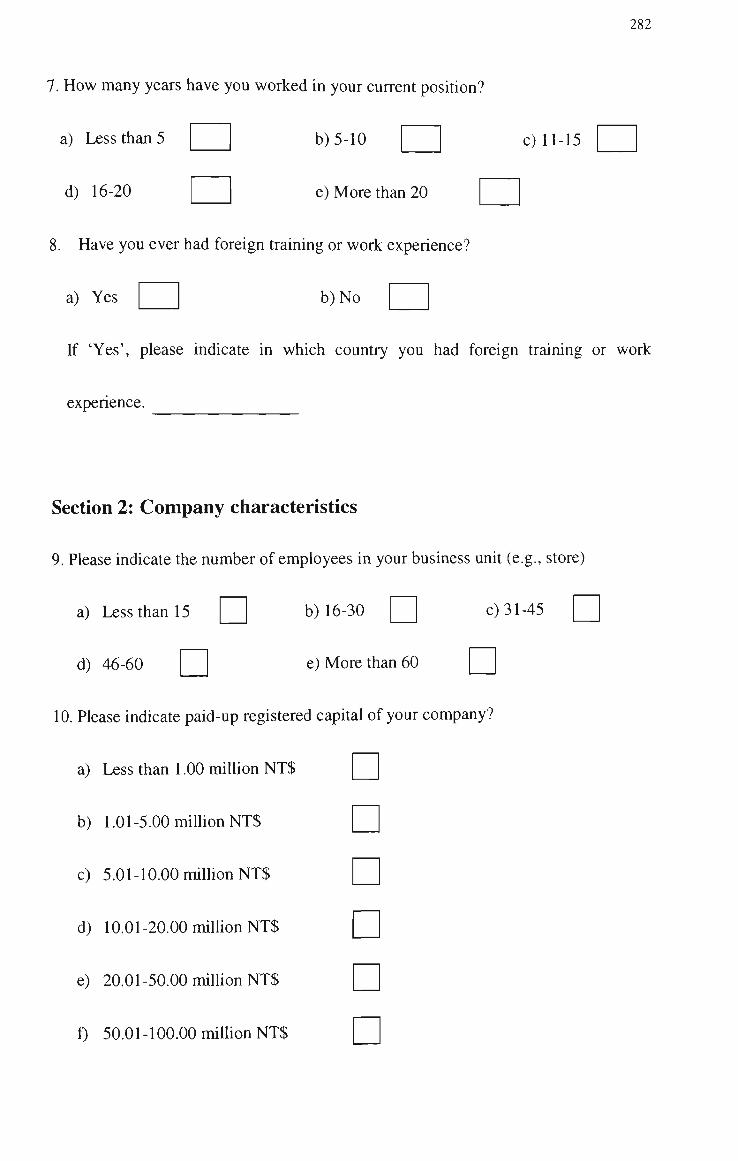
282
7. How many years have you worked in your current position?
a) Less than 5
d) 16-20
b)5-10 c) 11-15
e) More than 20
8. Have you ever had foreign training or work experience?
a) Yes b)No
If 'Yes', please indicate in which country you had foreign training or work
expenence.
Section 2: Company characteristics
9. Please indicate the number of employees in your business unit (e.g., store)
a) Less than 15 Q b) 16-30 Q c) 31-45 Q
d) 46-60 Q e) More than 60 Q
10. Please indicate paid-up registered capital of your company?
a) Less than 1.00 nuUion NT$
b) 1.01-5.00 million NT$
c) 5.01-10.00 million NTS
d) 10.01-20.00 million NT$
e) 20.01-50.00 million NT$
f) 50.01-100.00 million NT$
n
n

283
g) Mote than 100.00 million NT$ [ ^
11. Is your company a wholly Taiwan-owned company?
or
Is your company closely held by a group of intemational owners?
a) Taiwan-owned company Yes No | j
b) Intemational owners hold your company Yes No
12. Please describe the organizational stmcture of your company by circling the number linked to the descriptor.
Not at all
a) Centralized
decision
making authority
b) Several
hierarchical levels
of organizational
stmcture
(Vertical
differentiation)
c) Dependence on
regulations or
standards of job
d) Other
(Please put in
details)
1
1
1
1
Shghtly
2
2
2
2
Moderately
3
3
3
3
Significantly
4
4
4
4
Extremely
5
5
5
5

13. Please indicate how your organizational stmcttire is organized.
284
a) By function
b) By products or line of products
c) By geographical areas
d) By strategic business unhs (SBU)
e) Other (Please specify)
Yes
D D D n
No
D D D D
14 .Please indicate whether your company has an improvement program for
competitive advantage or not
a) Selective staffing
b) Comprehensive training
c) Building relationships with customers
and suppliers
d) Pay attention to the insight
of individual managers and workers
Yes No
15. Please indicate the sales revenue (in Taiwan money, million) of your store in the
last financial year
a) Less than 1.00 b) 1.01-5.00 c) 5.01-10.00
d) 10.01-20.00 e) 20.01-50.00 1)50.01-100.00
g) More than 100.00

285
16. Please indicate the percentage of sales revenue of your store which comes from new products or services (Please make an estimate)
a) Less than 5% [ ^ b)6%-10% [ ^ c ) l l % - 1 5 % | ^
d) 16%-20% Q e) More than 20 %
17. Please indicate the percentage of sales revenue of your three largest principal competitors' in your industry in the past year which come from new products and services (Please make an estimate)
a) Less than 15 % [ ^ b) 16 % -25 % | ^ c) 26 % - 35 % | ^
d)36%-45% Q e) More than 45 % [ ^
Section 3: strategic human capital management practices
According to Bamey (1991), strategic human capital management practices comprise
extensive recmitment and selective staffing, comprehensive training procedures, the
experience of talented employees, the relationships with customers and suppliers, and
insight of individual managers and workers in a firm. In other words, strategic
human capital management practices is to identify, to develop, to protect and to
deploy strategic human capital for recognizing and rewarding employee merit, and

286
providing the firm with a sustainable competitive advantage and, thereby, a superior
retum on strategic human capital management practices.
18. How important is each of the foUowing for sustaining your organization's competitive advantage?
Not at all
a)"StateoftheArt"
facilities
b) Geographical
dispersion of
sites
c) "New" technology
d) Patents
e) Strategic human
capital
f) Knowledge of
customers
g) Fixed assets
1
1
1
1
1
1
1
h) Other (Please specify)
Shghtly
2
2
2
2
2
2
2
Moderately
3
3
3
3
3
3
3
Significantly
4
4
4
4
4
4
4
Extremely
5
5
5
5
5
5
5

287
19. Please indicate the extent of your agreement or disagreement with the
following statements.
Strongly
disagree
a)It would be easy
for an experienced
manager to come
into your organization
and work efficiently
without any additional
firm-specific training 1
b)Employees are key
resources to achieving
and sustaining competitive
advantage of your company 1
c)Human capital is one kind
of strategic resources 1
d)Employees are the most
important elements in your
Somewhat A httle Very CriticaUy
disagree disagree agree agree
strategic plan
e)Every employee knows
what his or her job is and
how it contributes to
corporate goals
f) All employees contribute
to achieving the firm's
competitive advantage
1
1
1

288
20 How much time would h take for a newly hired store manager to leam the
firm-specific tasks necessary to be as effective as the current manager?
a) Less than one month b) One to two months
c) Two to three months d) Three to four months
e) Four to five months f) More than five months
21. How much time is required for a newly hired manager with experience in the
industry to become adequately familiar whh firm-specific knowledge of your
products and customers?
a) Less than one month b) One to two months
c) Two to three months d) Three to four months
e) Four to five months f) More than five months
22. How necessary is each of the following for sustaining your organization's
success ?
a) Skills
b) Experience
c) Knowledge
Not at all
1
1
1
A littie
2
2
2
Medium
3
3
3
Very
4
4
4
Critically
5
5
5

289
23. To what extent is there an understandable sequence of mles that can be followed
by the managers performing tasks in your organization?
Very hard A little hard A little easy Very easy Critical easy
24. Is the knowledge base held by your managers primarily specific to your
organization?
NotataU A little Medium Very Critically
25. Are managerial duties in your organization repetitious?
a) Yes b)No
26. To what extent would you say managerial tasks in your work unit perform
repetitive activities?
NotataU A little Medium Very Critically

290
27. If your firm has ever operated strategic human capital management practices,
who inhiated the idea of strategic use of human capital?
a) Top management
b) Accounting / Financial managers
c) Production managers
d) Customer service managers
e) Administrative managers
f) Other (Please specify)
28. Please indicate the level of importance of each of the following factors in
product pricing by circling the number linked to the descriptor
Not
important
a)Product
cost 1
b)Customers 1
c)Competitors 1
d)Other (Please specify)
A little
important
2
2
2
Medium
important
3
3
3
Very
important
4
4
4
Critically
important
5
5
5

291
29. How many new products and / or services have been marketed during the past
five years by your industry?
a) Less than one \__\ b) One to five [ ^ c) Six to ten | |
d) Eleven to fifteen | _ J e) Sixteen to twenty [^ f) More than twenty [ ^
30. Please rate the success of implementation of strategic human capital
management practices for your company?
a)Very poor |__| b) Poor \_\ c) Average
d)Good \_j e) Very good [ ^
31. Using the following five-point scale, select the descriptor which best describes
the impacts of strategic human capital management practices on the balanced
seorecard by circhng the number linked to the descriptor.
a) I am so busy with
producing routine
reports that I have
little time for direct
involvement in
decision-making
b) For the use of strategic
human capita
management practices,
my role is to present
relevant information to
decision-makers.
Strongly
disagree
1
1
Somewhat
disagree
2
2
Alittie
disagree
3
3
Very
agree
4
4
Critically
agree
5
5

292
Strongly
disagree
c)For strategic decisions
(The impact is over
two or more years), it
is not my role to
recommend appropriate
courses of actions.
d)For operating decisions
(The impact is within
one year), it is not my role
to challenge the plans
and actions of operating
executives.
5
5
Somewhat
disagree
4
4
A httle
disagree
3
3
Very
agree
2
2
CriticaUy
agree
1
1
32. Please indicate the level of importance of each of the following statements that
most closely describes your experience of strategic human capital management
practices.
a)Strategic human
capital management
practices are not
operated in my
company.
b) Strategic human
capital management
practices are operated
in my company, but I
am not involved with it
Not
important
1
. 1
A little
important
2
2
Medium
important
3
3
Very
important
4
4
Critically
important
5
5

293
Not
important
c) Strategic human
capital management
practices are operated
in my company, and I
help to operate the
system. 1
d)I initiated the
introduction of strategic
human capital
management practices. 1
e)I am responsible for the
implementation of
strategic human capital
management practices. 1
A litde
important
2
2
2
Medium
important
3
3
3
Very
important
4
4
4
CriticaUy
important
5
5
5
33. Please describe the extent to which you agree or disagree with each statement of
providing the operating techniques of strategic human capital management
practices by circling the number linked to the descriptor.
a)I feel good when I
place the managerial
staffing process in my
company
Strongly
disagree
1
Somewhat
disagree
2
A little
disagree
3
Very
agree
4
Critically
agree
5
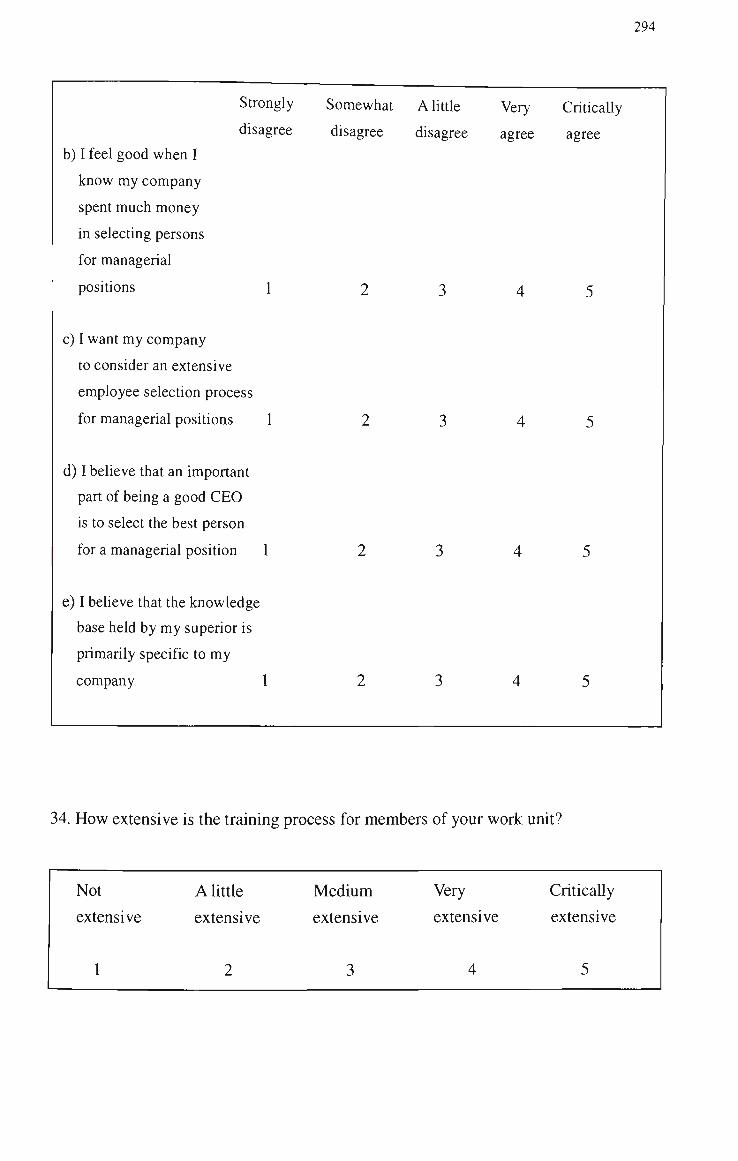
294
Strongly
disagree
b) I feel good when I
know my company
spent much money
in selecting persons
for managerial
positions 1
c) I want my company
to consider an extensive
employee selection process
for managerial positions 1
d) I believe that an important
part of being a good CEO
is to select the best person
for a managerial position 1
e) I believe that the knowledge
base held by my superior is
primarily specific to my
company 1
Somewhat
disagree
2
2
2
2
A httie
disagree
3
3
3
3
Very
agree
4
4
4
4
CriticaUy
agree
5
5
5
5
34. How extensive is the training process for members of your work unit?
Not
extensive
1
A little
extensive
2
Medium
extensive
3
Very
extensive
4
CriticaUy
extensive
5
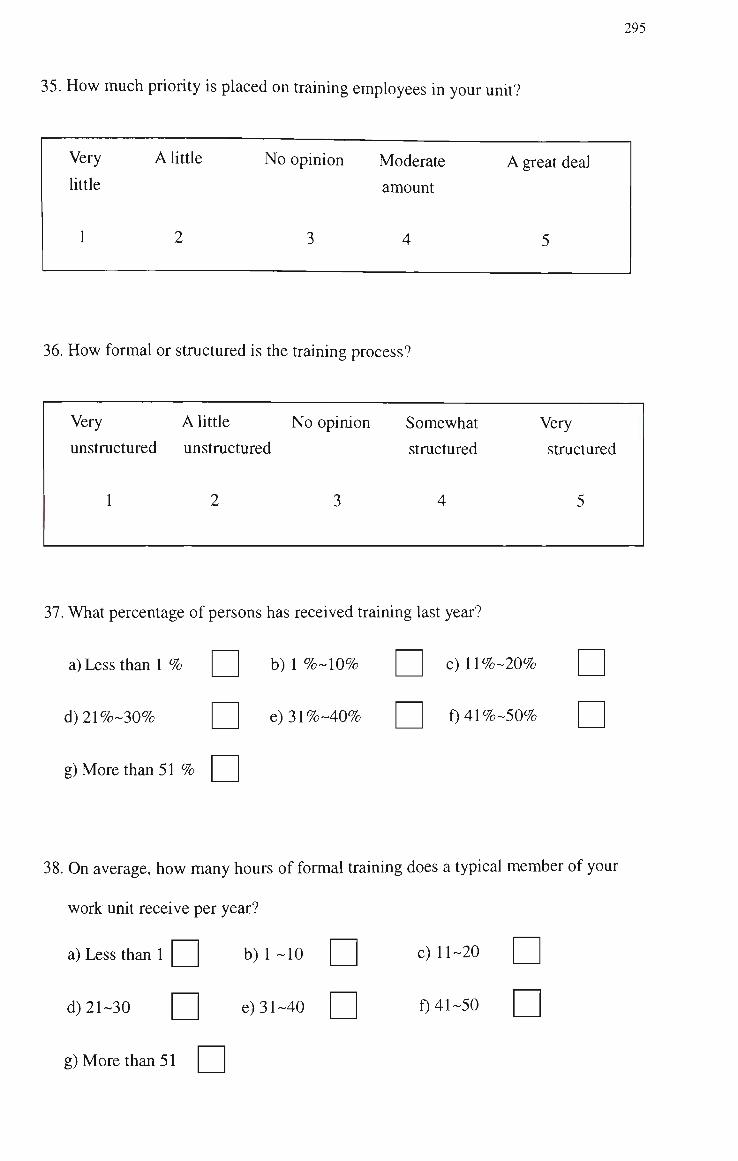
295
35. How much priority is placed on training employees in your unh?
Very Alittie No opinion Moderate A great deal little amount
36. How formal or stmctured is the training process?
Very
unstmctured
1
A little
unstmctured
2
No opiruon
3
Somewhat
stmctured
4
Very
stmctured
5
37. What percentage of persons has received training last year?
a) Less than 1% Q b) 1 %~10% Q c)ll%~20% | |
d)21%~30% Q e)31%~40% | ^ f)41%~50% | |
g) More than 51 % | ^
38. On average, how many hours of formal training does a typical member of your
work unit receive per year?
a) Less than 1 Q b) 1 -10 Q c) 11-20 Q
d) 21-30 Q e) 31-40 Q 041-50
g) More than 51 | |

296
39. How many different kinds of training programs are available for members of your
work unit to attend?
a) Less than 3 Q b) 3-5 [J c) 6-10 Q
d) 11-15 Q e) 16-20 [21 f)21~25 Q
g) More than 25 [ [ ]
40. How much money is spent on training individuals in your work unit (measured in
Taiwan doUars, thousand)?
a) Less than 1,000 Q b)l,001-2,000 [ [ ] c) 2,001-3,000 | |
d) 3,001-4,000 [ [ ] e) 4,001-5,000 Q 1)5,001-6,000 [ [ ]
g) More than 6,000 [ [ ]
41. Do you feel training is viewed as a cost or as an investment?
a) Viewed as a cost | | b) Viewed as an investment
c) Neither a cost nor an investment d) No opinion
42.The plan of strategic human capital management practices can take many forms,
depending on the particular needs of an organization. In your company,
preparation of corporate plans and annual budgets are according to the following
pattem (Please select one):

297
a) The corporate plan of strategic human capital
management practices provides the framework
for the annual budget. The plan is prepared first
and aimual budgets for the life of the plan fit
with the plan.
b) Annual budget is set on the basis of current
year's needs of strategic human capital management
practices. The corporate plan of strategic human
capital management practices is adjusted to fit
with current annual budget.
c)The corporate plan of strategic human capital management practices is modified on the basis of last year's plan and fits with current needs, and annual budget is set to fit with the modified corporate plan.
d) The annual budget and the corporate plan
of strategic human capital management practices
are decided simultaneously.
e)The corporate plan of strategic human capital
management practices is not a working document
and is not referred to annual budget during the process
of the preparation of the budget.
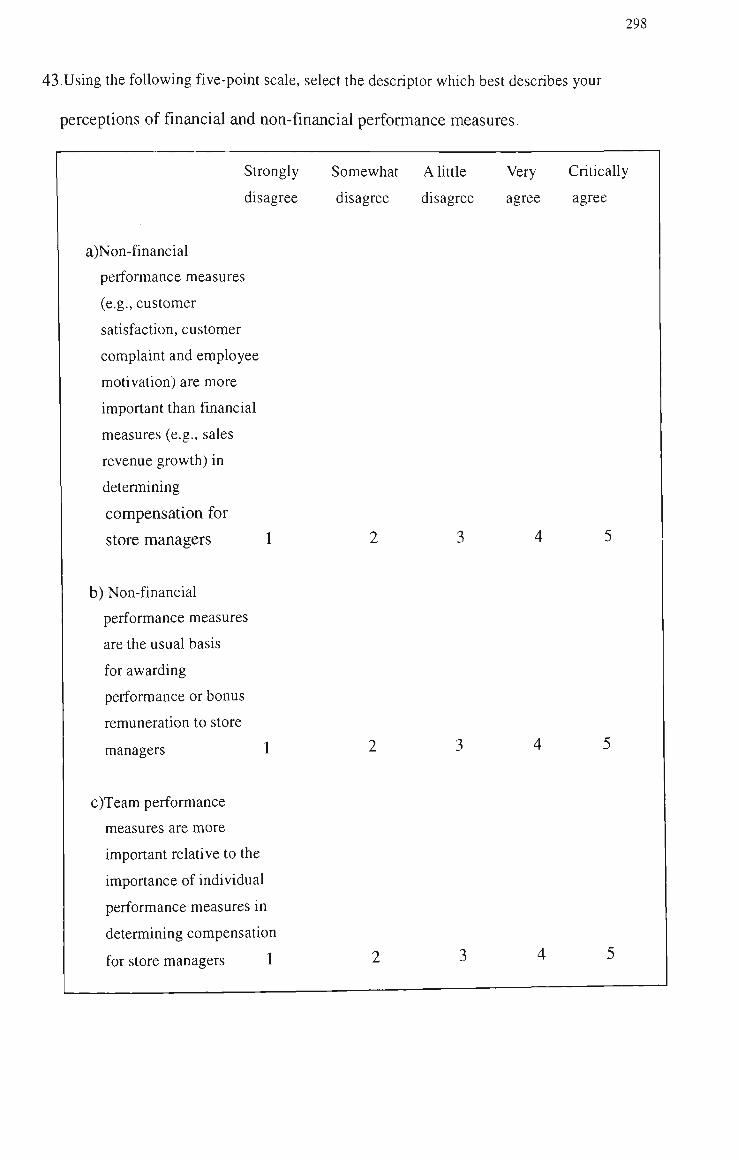
298
43.Using the foUowing five-point scale, select the descriptor which best describes your
perceptions of financial and non-financial performance measures.
Strongly Somewhat A httle Very Critically
disagree disagree disagree agree agree
a)Non-financial
performance measures
(e.g., customer
satisfaction, customer
complaint and employee
motivation) are more
important than financial
measures (e.g., sales
revenue growth) in
determining
compensation for
store managers 1
b) Non-financial
performance measures
are the usual basis
for awarding
performance or bonus
remuneration to store
managers 1
c)Team performance
measures are more
important relative to the
importance of individual
performance measures in
determining compensation
for store managers 1

299
Strongly Somewhat A httle Very CriticaUy
disagree disagree disagree agree agree
d)Employee related
measures (e.g.,
employee tumover,
job satisfaction) are
important in determining
store managers'
compensation 1
e)It would be easy
for an experienced store
manager to come into
your company and work
efficiently without any
additional firm-specific
training 1
f)In your company, human
capital is a strategic
resource and employees
are key to achieving and
sustaining firm's
competitive advantage 1
L
44. To what extent are each of the following measures used to evaluate managers'
performance? Please circle the appropriate number.
a)Sales revenue
growth
Never
1
Rarely
2
Sometimes
3
Regularly
4
Very frequently
5
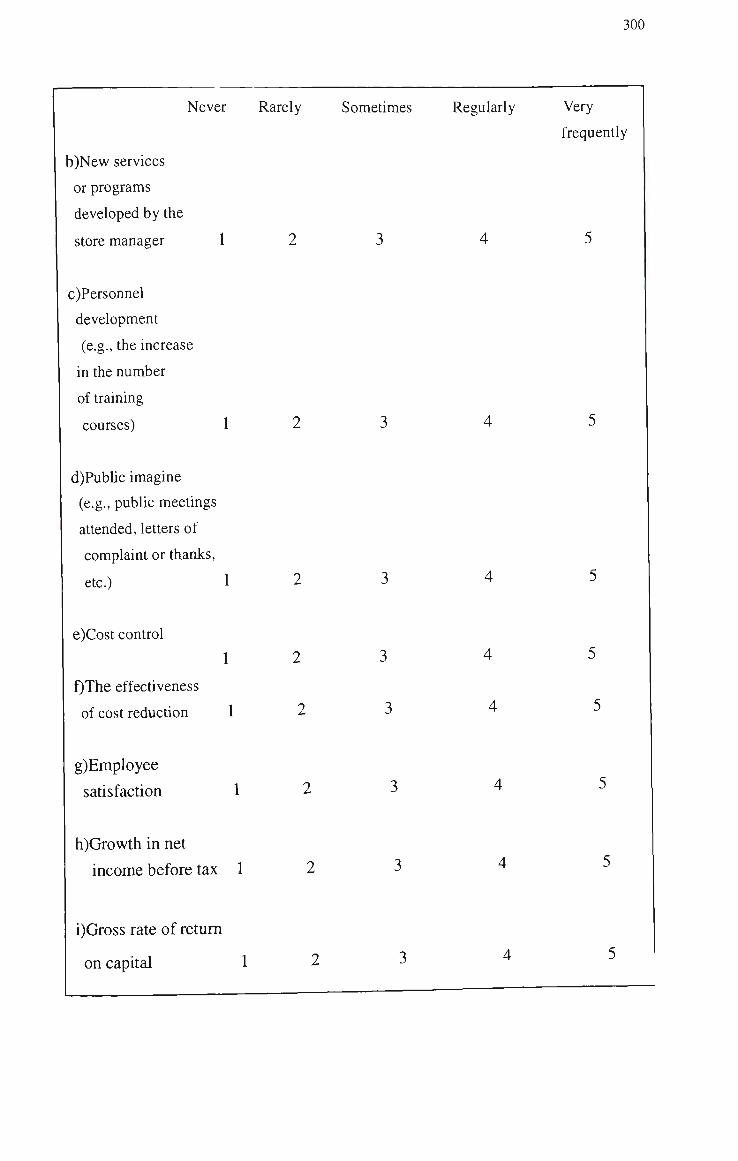
300
Never Rarely Sometimes Regularly Very
frequentiy
b)New services
or programs
developed by the
store manager 1
c)Personnel
development
(e.g., the increase
in the number
of training
courses) 1
d)Public imagine
(e.g., public meetings
attended, letters of
complaint or thanks,
etc.) 1
e)Cost control
1
f)The effectiveness
of cost reduction 1
g)Employee
satisfaction 1
h)Growth in net
income before tax 1
i)Gross rate of retum
on capital 1
2
2
2
2
2
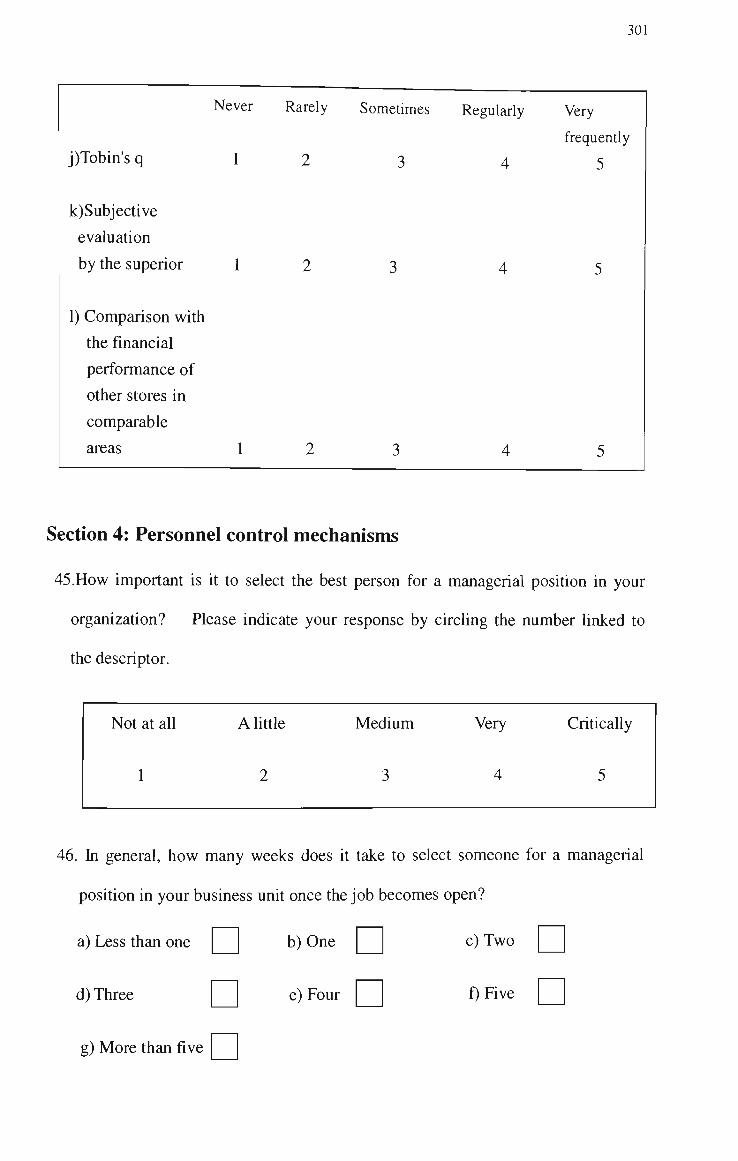
301
j)Tobin's q
k)Subjective
evaluation
by the superior
1) Comparison with
the financial
performance of
other stores in
comparable
areas
Never
1
1
1
Rarely So
2
2
2
frequently
3 4 5
Section 4: Personnel control mechanisms
45.How important is it to select the best person for a managerial position in your
organization? Please indicate your response by circling the number linked to
the descriptor.
Not at all A littie Medium Very Critically
46. In general, how many weeks does it take to select someone for a managerial
position in your business unit once the job becomes open?
a) Less than one | | b) One | | c) Two | |
d) Three [ [ ] e) Four [ [ ] f) Five Q
g) More than five |

302
47. How many people are involved in the selection of staff in your organization?
a) Less than two [ J b)Two \ ^ c) Three \~~\
d) Four [ [ ] e)Five [ [ ] f) Six Q
g) More than six people
48. How much money is generally spent in selecting people for a managerial
position?
a) Very little [ [ ] b) A little [ [ ] c) No opinion \ ^
d) Moderate j ] e) A great deal | j
49. How many applicants are screened for each person hired for a managerial
position?
a) Less than 10 people Q b) 11 -20 people [^ c) 21 -30 people | |
d) 31-40 people Q e) 41-50 people | | f) 51-60 people Q
g) More than 60 people | |
50. How important is the staffing process for your business unit?
a) Very little [ [ ] b) A little Q c) No opinion | _ J
d) Moderate \~2 e) A great deal | |

303
51. How important is the non-financial dimension of strategic human capital
management practices (e.g., job enrichment mterventions, formal information
sharing, labour-management participation, realistic job previews, grievance
procedures) in your organization?
NotataU Alittie Medium Very CriticaUy
52.H0W important is the fmancial dimension of strategic human capital
management practices (e.g., incentive compensation, advancement opportunity,
performance appraisal, valued relationship with specific co-workers) in your
organization?
Not at all A little Medium Very Critically
53. Please indicate the extent of your agreement or disagreement with each of the
following statement for your company by circling the appropriate number
a)Control reports
received by
senior managers
are highly
summarized
Strongly
disagree
1
Somewhat
disagree
2
A httie
disagree
3
Very
agree
4
Critically
agree
5
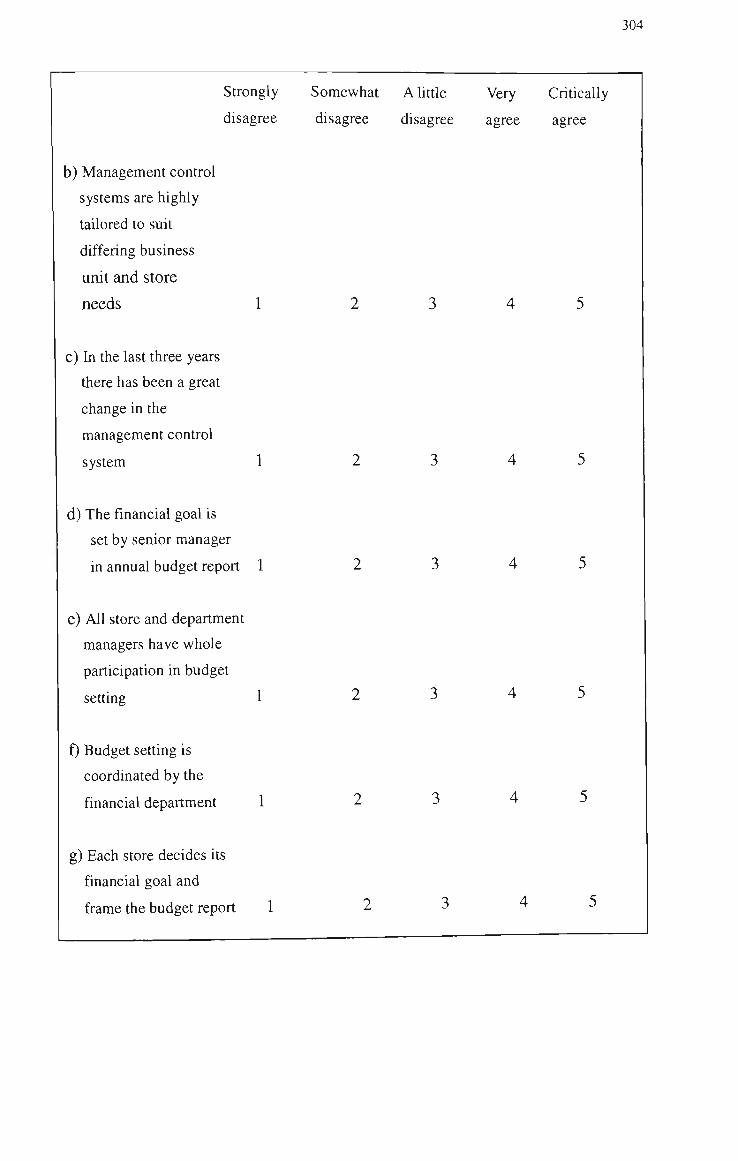
304
Strongly Somewhat A httie
disagree disagree disagree
Very Critically
agree agree
b) Management control
systems are highly
tailored to suit
differing business
unit and store
needs
c) In the last three years
there has been a great
change in the
management control
system 1
d) The financial goal is
set by senior manager
in annual budget report 1
e) All store and department
managers have whole
participation in budget
setting 1
f) Budget setting is
coordinated by the
financial department 1
g) Each store decides its
financial goal and
frame the budget report 1
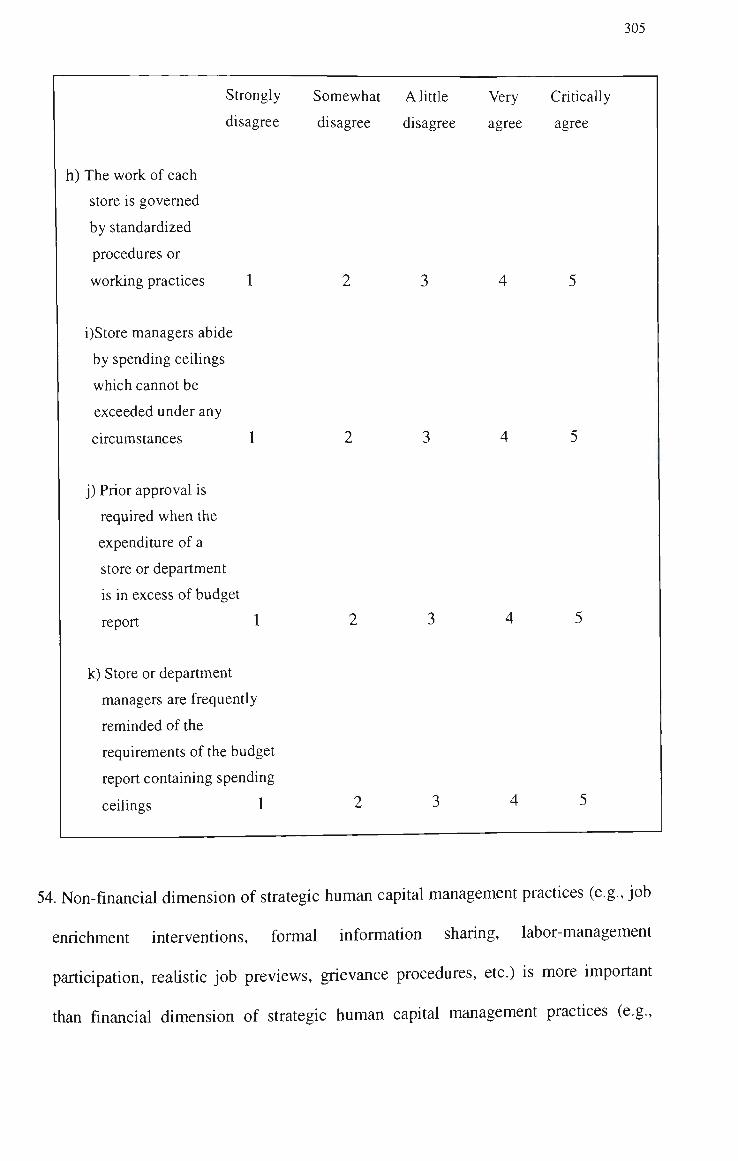
305
Strongly Somewhat A httle Very CriticaUy
disagree disagree disagree agree agree
h) The work of each
store is govemed
by standardized
procedures or
working practices 1
i)Store managers abide
by spending ceilings
which cannot be
exceeded under any
circumstances 1
j) Prior approval is
required when the
expenditure of a
store or department
is in excess of budget
report 1
k) Store or department
managers are frequentiy
reminded of the
requirements of the budget
report containing spending
ceilings 1
54. Non-financial dimension of strategic human capital management practices (e.g., job
enrichment interventions, formal information sharing, labor-management
participation, reahstic job previews, grievance procedures, etc.) is more important
than fmancial dimension of strategic human capital management practices (e.g..

306
incentive compensation, advancement opportunhy, performance appraisal, valued
relationship with specific co-workers, etc.) in your organization?
Not at aU A little No opinion More Much more
55. How important is each of the following activities for managing your store or
department? Please circle the appropriate number
Not at all A little Medium Very CriticaUy
a)Informal
communications
among the subordinates
(e.g., inter-personal
contacts) for
providing information
to the superior 1
b) Formal
communications
(e.g., memos, policy
statements, manuals, etc.)
for providing information
to the superior 1
c) Coordination of working
practices among stores
or departments 1

307
NotataU Alittie Medium Very Critically
d) Regular meetings
within stores for
supplying information
to managers 1
e) Regular meetings
among stores or
departments for
supplying information
and coordinating
activities
56. Please choose the statement which best describes the management philosophy of
your store. It is likely that there will be elements of each description which fit
with your store, but please choose the one which is most appropriate for your store,
and enter your choice below.
TYPE A n is most concerned about efficiency (minimizing cost) in
management. Stability is preferred, with few innovations unless innovations
result in cost reduction, hi other words, type A is primarily concerned with cost
efficiency in the provision of existing products and seeks out cost efficient
practices.
TYPE B ft actively seeks out new opportunities and challenges and looks for
new ways of working practices. Continual innovation and experimentation are
preferted. hi other words, type B tries to find the chance of innovations and ask

308
for being involved in pilot programs to test new products. Cost efficiency is not
the vital concem, ahhough h remains important.
TYPE C It consciously and systeraaticaUy looks for leaming how compethors
perform their functions. There is a desire to know what new processes and
products are being developed, but new ideas are not tried out until they are proven.
In addition, once innovation activities have been estabhshed by competitors, they
are quickly taken on. Cost efficiency for existing products is of prime concem.
TYPE D It appreciates stability but introduces the modification when extemal
environments require. Knowledge of new ideas and practices is not actively
sought out but may be acquired through informal communication with other stores.
Changes occur largely in response to extemal events.
YOUR STORE:
(Please tick one)
A B C D
Do you have any comments on the management philosophy of your store?
57. Every store places hs own emphasis on different management items, depending on
the specific circumstances of the store. For each of the foUowing statements,
please indicate the extent of your agreement with the statement as describing the
situation in your store by circling the appropriate number.
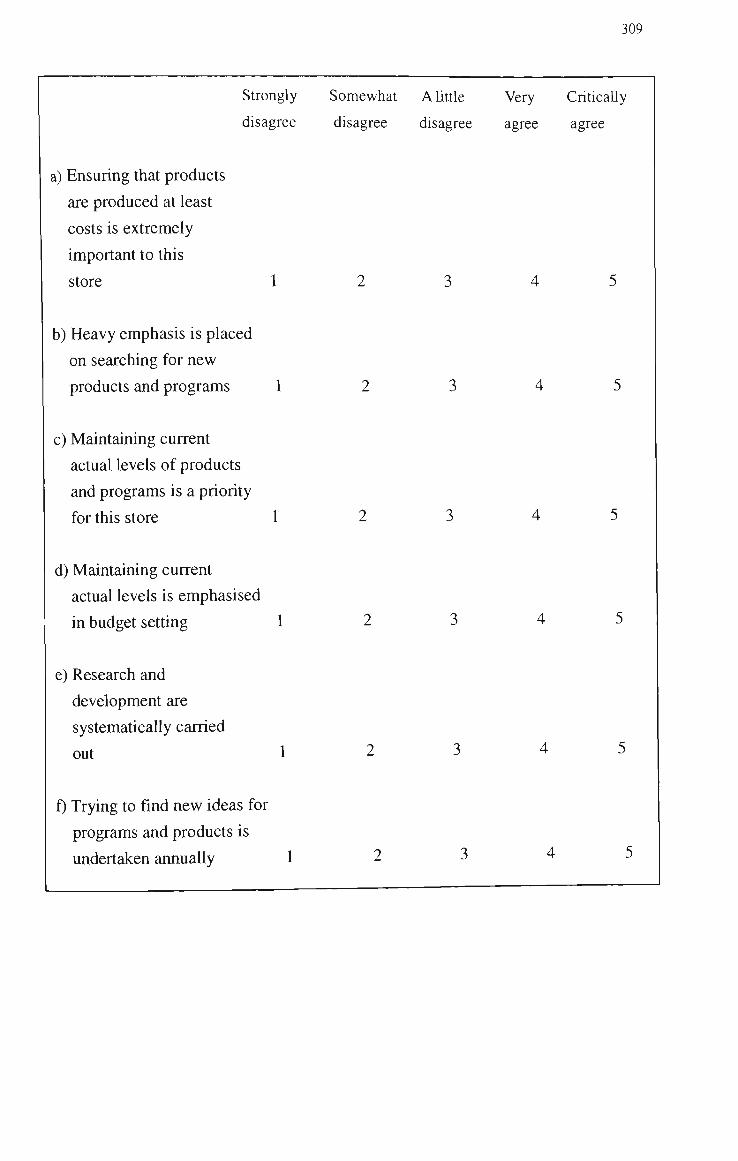
309
Strongly Somewhat A httie
disagree disagree disagree
Very CriticaUy
agree agree
a) Ensuring that products
are produced at least
costs is extremely
important to this
store 1
b) Heavy emphasis is placed
on searching for new
products and programs 1
c) Maintaining current
actual levels of products
and programs is a priority
for this store 1
d) Maintaining current
actual levels is emphasised
in budget setting 1
e) Research and
development are
systematically carried
out 1
f) Trying to find new ideas for
programs and products is
undertaken annually 1

310
Section 5: Employee capability
Use the foUowing five-point scale and select the descriptor which best describes the
change of your environment by circling the number hnked to the descriptor.
58. How would you classify the market activhies of your compethors during the
past five years?
Very stable A little stable No opinion Somewhat dynamic Very dynamic
59. How stable or dynamic is the extemal economic and technological environment
facing your company?
Very stable A little stable No opinion Somewhat dynamic Very dynamic
60. During the past five years, the preferences of your customers have become easier
or harder to predict?
Very easy A little easy No Abhhard Very hard
to predict to predict opinion to predict to predict
1

311
61. How often do new scientific discoveries emerge in your industry?
Seldom Occasionally No Quite Extremely
opinion often often
62.During the past five years, how have the legal, political, and regulatory
constraints surrounding your firm changed?
Very
stable
1
A little
stable
2
No
opinion
3
Somewhat
dynamic
4
Very
dynamic
5
63. How intense is each of the following activities in your industry: (i) Bidding for
raw materials, (ii) Price competition for products, (iii) Competition for
employees?
Not
ataU
1
A little
intense
2
No
opinion
3
Abh
intense
4
Very
intense
5
Select the descriptor which best describes each attribute of your environment by using
the following five-point scale and circling the number hnked to the descriptor.

312
None Slight Moderate Significant Extreme
64.Variation in
technical
complexity
for producing
the products in
your company 1
65. Complexity of
the production
process in your
company 1
66. Diversity in
products of your
company 1
67 .Flexibility of
manufacturing
facility in your
company 1
68. Intensity of
capital equipments
in your company 1
69. Variation in
competitors in
your industry 1

313
70. How important do you perceive each of the following product / service
characteristics offered by your store to be?
Not at all
a) Price
b) Quality
c) Cost
d) Variety of
products /
services
e) Rehability
f) Delivery
performance
g) Other
(Please specify)
1
1
1
1
1
1
1
A little
2
2
2
2
2
2
2
Medium
3
3
3
3
3
3
3
Very
4
4
4
4
4
4
4
Critically
5
5
5
5
5
5
5
71. How many kinds of products (or services) were produced (or provided) by your
company last year?
a) Less than 10 Q b ) l l - 2 0
d) 31-40 [^ e)41-50
c) 21-30 [^
f)51-60 Q
h) More than 60

314
72. Which budget setting method has your firm used?
a) Top-down | | b) Bottom-up [_j c) Participative | _ J
d) Other (Please specify)
73. Please indicate the level of importance of the budget to each of the foUowing
functions by circling the number linked to the descriptor.
Not at all
a)Cost
control 1
b) Performance
evaluation 1
c) Reward 1
d) Operational
planning 1
e) Decentralized
decisions 1
f) Other 1
(Please specify)
A little
2
2
2
2
2
2
Medium
3
3
3
3
3
3
Very
4
4
4
4
4
4
Critically
5
5
5
5
5
5

315
74.What proportion of the workforce receives formal performance appraisals?
a) Under 25%
c) 36%- 45%
e) 56%-65%
b) 25%-35%
d) 46%-55%
f) Over 65%
75.What is the proportion of the workforce whose performance appraisals are used to
determine their compensation?
a) Under 25%
c) 36%- 45%
e) 56%-65%
b) 25%-35%
d) 46%-55%
f) Over 65%
76. Which of the foUowing promotion decision mles do your company use most
often?
a) Merit or performance rating alone
b) Seniority only if merit is equal
c) Seniority when meeting a minimum merit requirement
d) Seniority alone
(Item is reverse-coded)

316
77. For the five poshions that your firm hires most frequently, how many quahfied
apphcants apply for each position (on average)?
a) Under 25
c) 36- 45
e) 56-65
b) 25-35
d) 46 -55
f) Over 65
78. For the five positions that your firm hires most frequently, what is the intensity of
their recmiting efforts (e.g., selection ratio, on average)?
a) Under 25%
c) 36%- 45%
e) 56%-65%
b) 25%-35%
d) 46% -55%
f) Over 65%
79. What is the proportion of the workforce who is included in a formal information-
sharing program (e.g., a newsletter)?
a) Under 25%
c) 36%- 45%
e) 56%-65%)
b) 25%-35%
d) 46% -55%
f) Over 65%

317
80. What is the proportion of the workforce whose job has been subjected to a formal
task analysis?
a) Under 25%
c) 36%- 45%
e) 56%-65%
b) 25%-35%
d) 46% -55%
f) Over 65%
81. What proportion of non-entry level jobs have been filled with in recent two years?
a) Under 25%
c) 36%- 45%
e) 56%-65%
b) 25%-35%
d) 46%-55%
f) Over 65%
82. What proportion of the workforce is conducted an attitude survey on a regular
basis?
a) Under 25%
c) 36%- 45% [_
e) 56%-65%
b) 25%-35%
d) 46% -55%
f) Over 65%
318
83. What is the proportion of the workforce who participates m Qualhy of Work Life
(QWL) programs, Qualhy Circles (QC), and / or labor-management participation
teams?
a) Under 25%
c) 36%- 45%
e) 56%-65%
b) 25%-35%
d) 46% -55%
f) Over 65%
84. What is the proportion of the workforce who has access to company incentive
plans, profit-sharing plans, and / or gain-sharing plans?
a) Under 25%
c) 36%- 45%
e) 56%-65%
b) 25%-35%
d) 46% -55%
f) Over 65%
85. What is the average number of hours of training received by a typical employee
over the last 12 months?
a) Under 25
c) 36- 45
e) 56-65
b) 25-35
d) 46 -55
f) Over 65
319
86. What is the proportion of the workforce who has access to a formal grievance
procedure and / or complaint resolution system?
a) Under 25%
c) 36%- 45%
e) 56%-65%
b) 25%-35%
d) 46% -55%
f) Over 65%
87. What proportion of the workforce is administered an employment test prior to
hiring?
a) Under 25%
c) 36%- 45%
e) 56%-65%
b) 25%-35%
d) 46% -55%
f) Over 65%
Section 6: Customer loyalty
Please select the descriptor which best describes each attribute of your customer value
by using the foUowing five-point scale and circling the number linked to the
descriptor.
88. An important part of
my task is to ensure
comphance with
customer
complaints
Strongly
disagree
1
Somewhat
disagree
2
A little
disagree
3
Very
agree
4
Critically
agree
5

320
89. To what extent would you lUce your customers to develop customer satisfaction?
The degree to which your store could raise the price of products as a percentage
before the customer's wilhngness to buy again next time (given that the customer
has indicated his / her hkehhood to repurchase).
a) Less than 5 % Q b) 6 % - 10 % [ ^ c)ll % -15 % | |
d) 16%-20% [ ^ e) More than 20 % Q
90. To what extent would you like your customers to develop customer satisfaction?
The degree to which your store could lower the price of products as a percentage
before the customer's reluctance to buy again next time (given that the customer
has indicated his / her unwillingness to repurchase).
a) Less than 5% Q b )6%-10% Q c ) l l % - 1 5 % Q
d) 16 % - 20 %o [ ^ e) More than 20 % Q
91. Have you ever recommended your store as a place to purchase to your friends?
a) Yes I I b) No
If your answer is 'Yes', please indicate the frequency of your reconunendation by
circling the appropriate item.
a) About once a month Q b) Two to three times a month | |
c) Very frequent \__\ d) No opinion | |

321
92. Please indicate the level of importance of each of the following factors in
consumer loyahy by circling the number linked to the descriptor
a) An employee's
perception
of the store's
overaU chmate
for service
friendliness 1
b) Store head
recognizes and
appreciates sales
clerks' friendliness
toward customers 1
c)Your store asks your
customers to evaluate
sales clerks' service
friendliness 1
d) Did your customer
just purchase one
kind of product
from your store? 1
e) If your customer
needs to buy a new
product, he / she
will not come to
your store 1
NotataU Alittie Medium Very CriticaUy

322
NotataU A httie Medium Very CriticaUy
f) If your customer
needs to buy a
new product,
he / she will visit
your store 1 2 3 4 5
g) Your customer will
recommend your
store to his / her
friends when they
need to buy new
products 1 2 3 4 5
h) Your customer will
recommend your
store when he / she
chats with his / her
friends about your
store's products 1 2 3 4 5
i) Other 1 2 3 4 5
(Please specify) . —
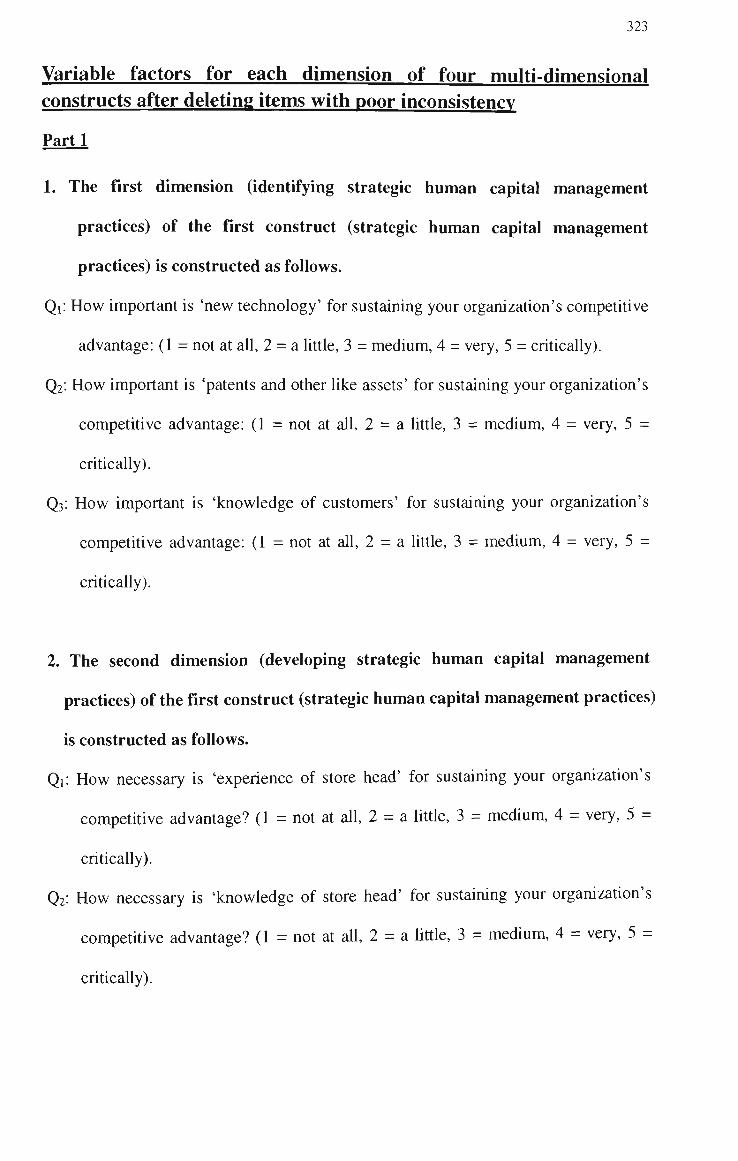
323
Variable factors for each dimension of four multi-dimensional constructs after deleting items with poor inconsistency
Parti
1. The first dimension (identifying strategic human capital management
practices) of the first construct (strategic human capital management
practices) is constructed as follows.
Qi: How important is 'new technology' for sustaining your organization's competitive
advantage: (1 = not at all, 2 = a httle, 3 = medium, 4 = very, 5 = critically).
Qi: How important is 'patents and other like assets' for sustaining your orgaruzation's
competitive advantage: (1 = not at all, 2 = a little, 3 = medium, 4 = very, 5 =
critically).
Q3: How important is 'knowledge of customers' for sustaining your organization's
compethive advantage: (1 = not at all, 2 = a little, 3 = medium, 4 = very, 5 =
critically).
2. The second dimension (developing strategic human capital management
practices) of the first construct (strategic human capital management practices)
is constructed as follows.
Qi: How necessary is 'experience of store head' for sustaining your organization's
compethive advantage? (1 = not at all, 2 = a httle, 3 = medium, 4 = very, 5 =
critically).
Q2: How necessary is 'knowledge of store head' for sustaining your organization's
competitive advantage? (1 = not at all, 2 = a httle, 3 = medium, 4 = very, 5 =
critically).

324
Qs: To what extent is there an understandable sequence of mles that can be followed
by the managers performing tasks in your organization? (1 = very hard, 2 = a
httle hard, 3 = a little easy, 4 = very easy, 5 = critical easy).
3.The third dimension (protecting strategic human capital management practices)
of the first construct (strategic human capital management practices) is
constructed as follows.
Qi: To what extent would you say managerial tasks in your work unit perform
repetitive activities? (1 = not at aU, 2 = a little, 3 = somewhat, 4 = very, 5 =
critically).
Q2: How important is 'product cost' in the product pricing of your company? (1 = not
at aU, 2 = a little, 3 = medium, 4 = very, 5 = critically).
Q3: How important is 'competitors' in the product pricing of your company? (1 = not
at all, 2 = a httle, 3 = medium, 4 = very, 5 = critically).
Q4: How important is the following situation describing your experience of strategic
human capital management practices? Strategic human capital management
practices are employed in your company, but you have never involved with it. (1
= not at all, 2 = a little, 3 = medium, 4 = very, 5 = critically).
Q5: How important is the following situation describing your experience of strategic
human capital management practices? Strategic human capital management
practices are employed in your company, and you help to operate this system. (1
= not at aU, 2 = a little, 3 = medium, 4 = very, 5 = critically).
4. The fourth dimension (deploying strategic human capital management
practices) of the first construct (strategic human capital management
practices) is constructed as follows.

325
Qi: hi your company, you are responsible for the implementation of strategic human
capital management practices? (1 = not at aU, 2 = a httle, 3 = medium, 4 = very,
5 = CriticaUy).
Q2: You feel good when you place the managerial staffing process in your company?
(1 = strongly disagree, 2 = disagree, 3 = neither agree nor disagree, 4 = agree, 5
= strongly agree).
Q3: You want your company to consider an extensive employee selection process
(e.g., the use of tests, interviews, etc.) for a managerial poshion once the
poshion becomes open? (1 = strongly disagree, 2 = disagree, 3 = nehher agree
nor disagree, 4 = agree, 5 = strongly agree).
Q4: You beheve that an important part of being a good CEO is to select the best
person for a managerial position in your company? (1 = strongly disagree, 2 =
disagree, 3 = neither agree nor disagree, 4 = agree, 5 = strongly agree).
Part 2
1. The first dimension (the control factor of personnel control mechanisms) of the
second construct (personnel control mechanisms) is constructed as follows.
Qr. In your company, management control systems are highly tailored to suit differing
business unit and store needs? (1 = strongly disagree, 2 = disagree, 3 = neither
agree nor disagree, 4 = agree, 5 = strongly agree).
Q2: In your company, each store or department sets its own financial goals to frame
the curtent budget? (1 = strongly disagree, 2 = disagree, 3 = neither agree nor
disagree, 4 = agree, 5 = strongly agree).
Q3: In your company, the work within each store or department is govemed by the
use of standardized operating procedures or working practices? (1 = strongly

326
disagree, 2 = disagree, 3 = neither agree nor disagree, 4 = agree, 5 - strongly
agree).
2. The second dimension (the communication-coordination factor of personnel
control mechanisms) of the second construct (personnel control mechanisms)
is constructed as follows.
Qi: How important is the coordination of the work among different stores or
departments? (1 = not at aU, 2 = a little, 3 = medium, 4 = very, 5 - critically).
Q2: How important is the regular meeting within stores or departments to supply
information to store head or department manager? (1 = not at all, 2 = a httle, 3 =
medium, 4 =: very, 5 = critically).
Q3: How important is the regular meeting between stores or departments to supply
information and coordinate activities? (1 = not at all, 2 = a little, 3 = medium, 4 =
very, 5 = critically).
Part 3
1. The first dimension (the change in environment) of the third construct
(employee capability) is constructed as follows.
Qi: How would you classify the market activities of your compethors during the past
five years? (1 = very stable, 2 = a littie stable, 3 = neither stable nor dynamic, 4 =
somewhat dynamic, 5 = very dynamic).
Q2: How stable or dynamic is the extemal economic and technological environment
facing your company? (1 = very stable, 2 = a little stable, 3 = neither stable nor
dynamic, 4 = somewhat dynamic, 5 = very dynamic).

327
Q3: During the past five years, how have the legal, pohtical, and regulatory constraints
surrounding your firm changed? (1 = very stable, 2 = a httle stable, 3 = neither
stable nor dynamic, 4 = somewhat dynamic, 5 = very dynamic).
2. The second dimension (employee skill and organizational structure) of the
third construct (employee capability) is constructed as follows.
Qi: How complex is the service providing or production process in your company? (1
= none, 2 = slight, 3 = moderate, 4 = significant, 5 = extreme).
Q2: How flexible is the service providing or manufacturing facility in your company?
(1 = none, 2 = slight, 3 = moderate, 4 = significant, 5 = extreme).
Q3: In your company, how intensive is the capital equipment of the production
process? (1 = none, 2 = sUght, 3 = moderate, 4 = significant, 5 = extreme).
3. The third dimension (employee motivation) of the third construct (employee
capability) is constructed as follows.
Qi: In your company, how important is the control of the price of products to
employee motivation? (1 = not at all, 2 = a little, 3 = medium, 4 = very, 5 =
critically).
Q2: In your company, how important is the control of the quality of products to
employee motivation? (1 = not at all, 2 = a little, 3 = medium, 4 = very, 5 =
CriticaUy).
Q3: In your company, how important is the variety of products to employee
motivation? (1 = not at all, 2 = a httle, 3 = medium, 4 = very, 5 = critically).
Q4: In your company, how important is budgeting to cost control? (1 = not at all, 2 = a
little, 3 = medium, 4 = very, 5 = criticaUy).

328
4. The fourth dimension (employee productivity) of the third construct (employee
capability) is constructed as follows.
Qi: hi your company, how important is budgeting to operational planning? (1 = not at
aU, 2 = a little, 3 = medium, 4 = very, 5 = critically).
Q2: hi your company, how important is budgeting to decentrahzed decisions? (1 = not
at aU, 2 = a little, 3 = medium, 4 = very, 5 = criticaUy).
Part 4
1. The first dimension (customer complaint) of the fourth construct (customer
loyalty) is constructed as follows.
Qi: How important is the foUowing factor to the reduction of customer complaint: an
employee's perception of the store's overall chmate for service friendhness? (1 =
not at all, 2 = a little, 3 = medium, 4 = very, 5 = critically).
Q2: How important is the following factor to the reduction of customer complaint:
store head recognizes and appreciates sales clerks' friendliness toward customers?
(1 = not at aU, 2 = a little, 3 = medium, 4 = very, 5 = critically).
2. The second dimension (customer satisfaction) of the fourth construct
(customer loyalty) is constructed as follows.
Qi: How important is the following factor to the increase in customer satisfaction:
your customer wiU recommend your store to his friend when he needs to buy a
new product? (1 = not at all, 2 = a little, 3 = medium, 4 = very, 5 = criticaUy).
Q2: How important is the following factor to the increase in customer satisfaction:
your customer will recommend your store to his friend when he chats with his
friends about your store's products? (1 = not at all, 2 = a little, 3 = medium, 4 =
very, 5 = critically).
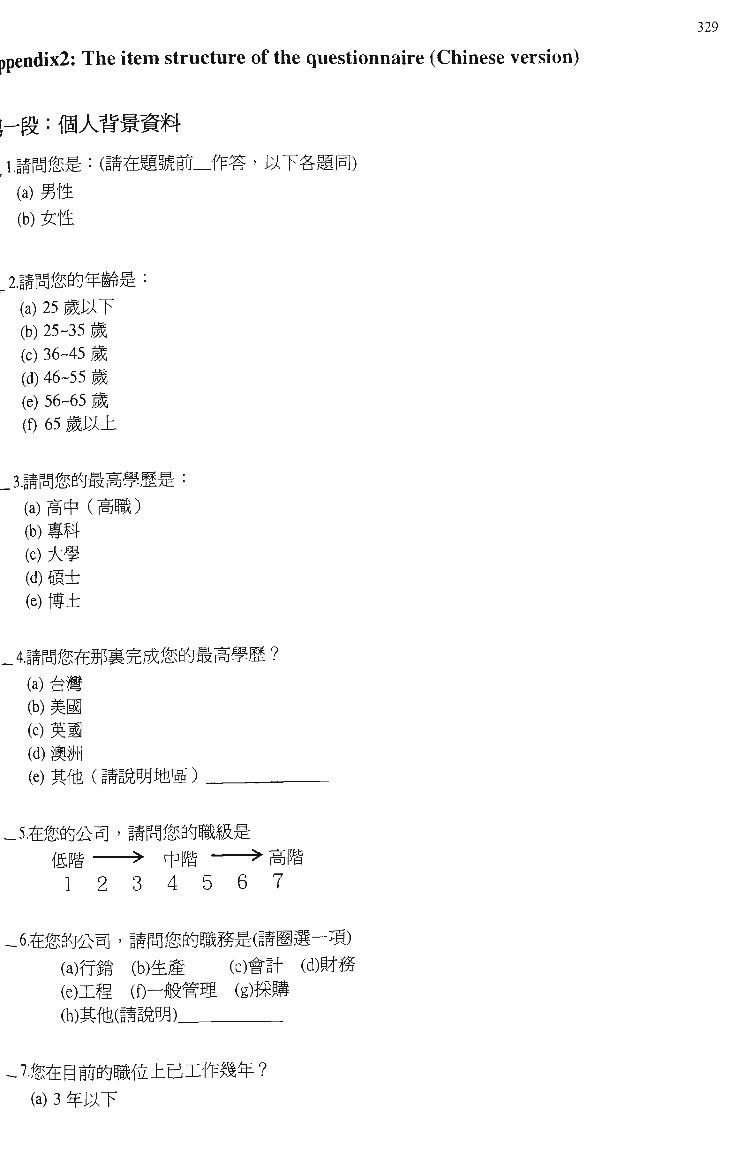
329
)pendix2: The item structure of the questionnaire (Chinese version)
(a) M14
(b) ^14
L2.ifr«iJSH^ (a) 25 Ml^Xf (b) 25-35 M (c) 36-45 M (d) 46-55 a (e) 56-65 M (f) 65 MU±
:7E
(a)iS4^ (i^^) (b) ^^4
(d) m± (e) tf ±
^iwfo^itm^m'^jr^M^mmmm ? ( a ) ^ aim
(c)^a (d) t » i
-.s.^m'i^n' ifraif^e«fs^ fSPI •> 4 Pe •> i f fe-[.fefc
1 2 3 4 5 6 7
(a)fflt (b)^^ (e)X^ (f)- |S^S (h)affe(ifi H )
(c)#ff (d) l«
(a) 3 J.>IT

(b) 3-5 ^ (c) 6-10 ^ (d) 11-20^ (e) 20 ^i.^(±
330
( a ) ^ ( b ) ^ m LT/J^ ^ © ' mmmi^m^mi imi^^m^^mmmmxirM-
ixp^ ^ W ] 'j^mm
_9.if ra1/^^®i£ifcW#^^MX ? (a)15 Ai-^IT (b)16~30 A (c)31~45A (d)46-60 A (e)60 A1U±
(a)ff^^ 100 llTflialT (b)ff^^ 101-500 HTC (c)|ff^m 501-1000 ^TC (d ) i r ^^ 1001-2000 HTC (e)iif^^ 2001-5000 ^TC
(Off^m 5001 ^ - 1 mit
(g)lf^m 1 M7Ci l±
3 i :
(a)M (b)a?
^i>«]^^^^^W]
a
-ifraif^.a^/z>w]-&- m'x^
(b)S

331
(&)^^mm^m^mij^ 1 2 3 4 5 (b)53^»i[*^e^$^m;^^ 1 2 3 4 5 (mmx.i'^mmmmii^mmi^mij^ 1 2 3 4 5 (d)^ffe(ifi^HJ) 1 2 3 4 5
(cMnmrn^ms.!^
7B
D D D D D
n D n •
u.nm^mn^mmm^' mmimmi^^^^'^rm^mmmnwi ?
(hmi^m^mtim
{dmmmmxmMxm'j>n mi
D D D D
D D D D
i5.ifroi^^e«ja^5&¥e««ii^A^ (a)ff^m 100 ||7r:i^:^T (b)fr^m 101-500 MX (c)if^^ 501-1000 MTC (d)|f^^ 1001-2000 HJC (e)fjf^^ 2001-5000 MTG (Oif^m 5001 m-i fiTc (g)lf^m 1 fi7ui;^±
(a)fg;5^5% (b)6%~10% (c)ll%~15% (d)16%-20%

332
it)20%l)X±.
(a)im 15% (b)16%-25% (c)26%~35% (d)36%-45% {t)A5%})l±
^.
(a)W5I6^SJ5 {h)^nitmm
{dMm^mm
imm^mALM^mi^s
(h)mm^mm)
1 1 1 1 1 1 1 1
m. MM m m •M.
2 2 2 2 2 2 2 2
3 3 3 3 3 3 3 3
4 4 4 4 4 4 4 4
LM
5 5 5 5 5 5 5 5
(a)-fuwif-itfi iSA' /i a i> 1 2 ^' x^isss^^f a f Hit' m
{hmxmtm'j>nmwmmmH.^ 1
mmr^i
4
ZQ [ R I M
(c)AtJ«lig fiS i>W]#itX^S§mffi 1
{dmrnwrnnmrnm > ^WIMXIS i
4
4
4

333
(a)\imi^M (b)l-2fi^ (c)2-3 m^ (d)3~4 f i ^ (e)4-5 f@^
(f)5mMi^j.±
?
(a)Umi^l^ (b)l~2fi^ (c)2-3 f@^ (d)3-4 m^ (e)4~5 f@^ (f)5f@^i.:^±
9
(a) ^^gfTM^W]j^5f]e^>^s^glJ ffi ^^^>^^^ i >£ ^W W%^^^ m>^^^ ^ •m^ -g
1 2 3 4 5 (b) IS#^^W]j^XjJa^;^^^@^
^.^^^^^^ ^-^^i^^W Wfe>.^^^ f5>-^-^ t^^^-^-^ 1 2 3 4 5
(c) mmxmmm^um^'j>nf^m'^^j^^^mm ^^^^^-^ i - ^ ^%^-^ M i ^ mm^jz-^^
1 2 3 4 5
immmm (h)mmmm
(d) ts^^^t i (e)
(a)-i£fP^#^
m' njfit fie^Mi MfM/f' ^iii,fMj^sM ?
fgtff n^Dii' f^m^^^^^MW' nm^^'^mmmn ?

334
(o)wmwk (d)fl#^f (€)imw9k
(a)^
(b)^
(a)-i£ipxais
(b)WS^£lS
(e) ^miS _27.$n / e ^w]' mmixtimumn^mm - itr«iT^©P-f@Ag iiaiifct
E5fS ?
(a)IIIIS ° (b)tit§^^M^I^^§^fMS ° (c)^M§PIIS ° (d)||^Ig^§PliS =
(f) ^ffedf i H )
(a)Mna]S^
(c)^#a^JSm (d)^m
(iMHg)
fe^#iir5^^H^' ^m^um.mn ? (it H ^ - J I )
1 1 1 1
2 2 2 2
3 3 3 3
L M
4 4 4 4
5 5 5 5
(a)^^t^W (b)l~5 S (c)6~10@
(d)ll~15a (e)16-20a (g) 20 » ^ ( X

335
(b)|I^^$? (c)lt^^M (d)ttJj(K$? (e)II^#{t
]i^mm'^mmit/j>nmnmm'\ixtimwmmmm^ °
101 : MmX:t 3\.nimmiyLjsmmmx^'^mm'^^mm > Met « # f is^i A:rm^Bi ? (it H ^ - I D
^
1 LS LM LM # ^ - M ^
4
.32.t/^6^l^f5J^®ISSAa^il^W^^0f ' A.ie^^#^>0trBl:?^tg^)^lg^A:r6^Xf^ ? (a)-f®MI9i')l^ (b)-f@MI§ (c)Xf@SI9 (d)HfigMS
(h) £f®M^i;^±
(a)lOAI' (X (b)ll-20A (c)21-30A (d)31-40A (e)41~50A (f)51-60A (g)60 Ai : x
-34.t/i^e^^f5j^MIMSAa^^^W^ (a)ff^m 1000 7t&.r(WJ^^) (b)ff^^ 1000-3000 7t:(-l^l£) (c)lf^^ 3000-5000 TtiMm) (d)if m 5000 i.:^±(fS^) (e)X?f^^fg#^^@
ua^Hf^W^l^Hf' A,^w#^^A5l5#i^^iiiif5e^MSSxf^ ?
m ' Al^^f2#^^@:rtg^)^l£iiA:r6^Xf^ ?
-35.t>t6^^f5i^®iMSAa^i$^w^^Hf' xmm^'j^'X^mmmmmiii ?
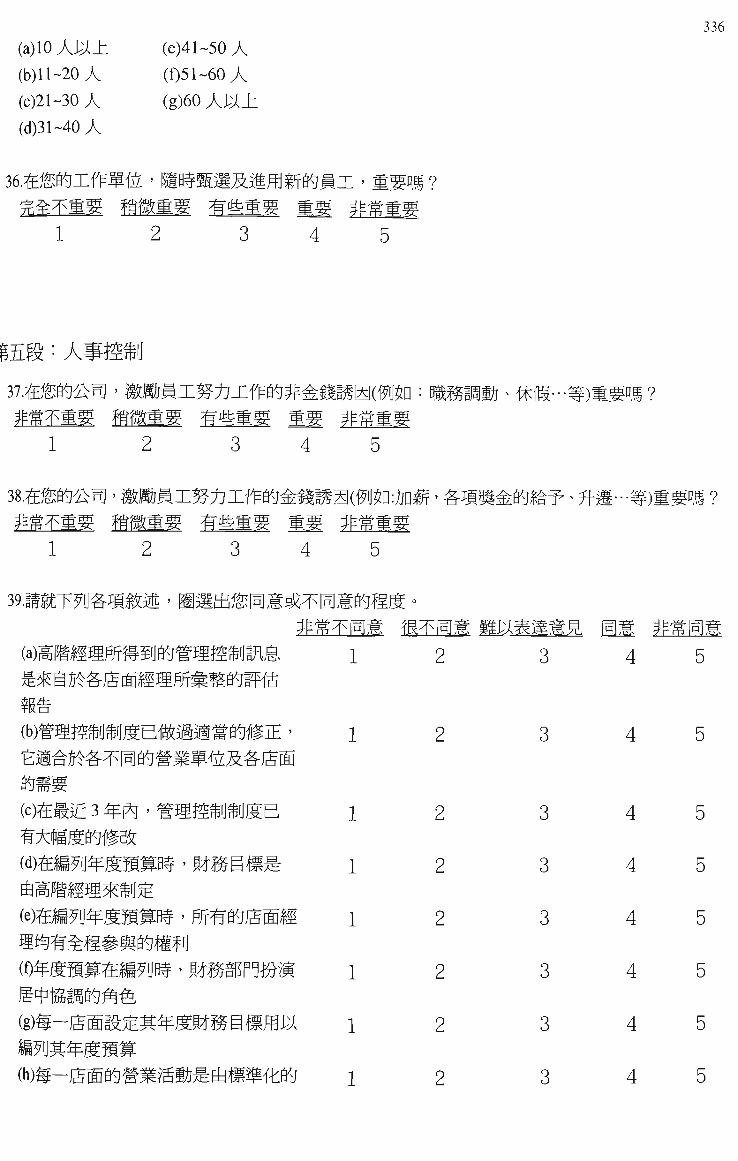
336
(a)10Al')l± (b)ll~20A (c)21-30A (d)31-40A
(e)41-50A (f)51-60A (g)6o Ai :(±
^
1 ^ fek ,^ r'fflS' ll^ks
l a g •• xmm%^\ [i:^tixmm±mmm(mm
m m imm.^ 1 4
^)a^ni ?
38.M^&^ w]. aiijMx^tfXf^e^^fa^H(^u$n:jjpiff' # J I ^ ^ 6 ^ I ^ X ^ ^m--mm'mm ? Mda m MM m m iiMj m
1 4
ii^x^mmj. 1 4
1
1
1
1
1
1
2
2
2
2
2
2
3
3
3
3
3
3
4
4
4
4
4
4
5
5
5
5
5
5
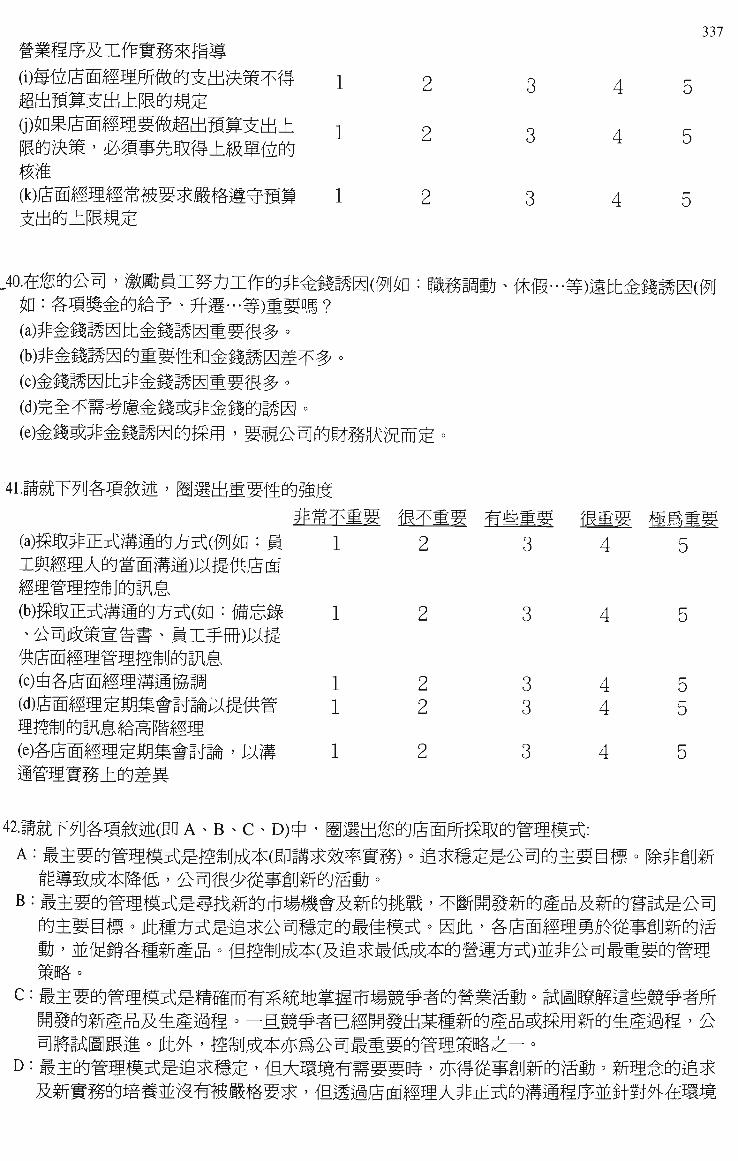
(i)§f5l^®ISWM6^^m^mXf#
G)$n*i£®iS5iM*MtBs»^m±
337
(k)fammmimn^m^m^^mm
1
1
2
2
3
3
4
4
4
5
5
Ao.^m'j>^' iTOMx^;^jxfta^#^^@^gi(M$a: mmmt
(3i)immmmit±mmmmmm ° (b)#^^^He«^tt^p^a^aMx# ° (c)^@^Shh#^@^gia^fS# ° (d)^%X^#)t^^^^N^^e^^S °
f:^ig"-#)5SI:[:^®^a(M
4i.iMx^[i#iifi(2it' ffljima^tefi^^ss i ' ^m.
(a)m3^#X^pae^^^(M$D : M X| |MSAa^mMPii)i :A|gfitjfiM
(b)^15XjtPMe^^^($D : m^M
id)fammmMmmtmm&.m^^
5^1
1 1
fixm^
2 2
3 3
LM
4
4 4
5 5
42.iMx [i#iii(2tt(Hp A ^ B ^ c ^ D)4 ' ffliim/^a^0Mm«^a«siixC:
SJ ' m^m^mmm^u ° fss0jjt:$:(Sii^sfS]^^e^§s:^^)3£#^w]ga^fi^i^a

338
mmitmf^m^mM±mM-m.mm^mm^ (mmm)
: 0 i § § D n D D
(a)i£f 6 />w]@' mum^umi:^! i
(b)^/^6^^W]|i ' Ifl^frMp^p^
(c)S/^e^)£®s' f^ifgMetw
(d)im'j>^^m^mnm - ii?f
(f)M^a^^w]®' m^^'p-^x'
MXIql:t ^ " ^ ' ^ ^ Mfi ^'^[SlM 4
1
1
1
1
1
2
2
2
2
2
3
3
3
3
3
4
4
4
4
4
5
5
5
5
5
HAS: i M r i S g ' n^l^l^MXtiES
44.ifrni/ fHiEx !je i( n,i ? r ^ ^ w j ^ ' ^ a
1 2 3 4 5
l^^-^maiai -?Sf. Wlia^#JM^
5%I)iX 6%-10% 11%-15% 16%-20% 20%iU±
(a) (b) (c) (d) (e)

339
%iUX 6%~10% 11%-15% 16%-20% 20%iU h
(a) (b) (c) (d) (e)
(a)M n (b)^ n 7
^fi^.a^0^^ ^^^''' i f t iqzpisipj^l
(a)A^-'f@^-^:^ (b)A.ftf-f@Hx:5^SX?^ (c)#s^^(M$n:Xi^M®^ Eg i :A±) (d) ? WEM
zn. r.?^ 3EMS M
(a)]£MfM®a:#mma Wigmi fs^
(b))£®|iS#^af[^l^MMI^
{dm^^mt^j^mm' i i' KmSi
(o^o^n^^^iiH-aif^p^p' m#
{g)mm^tmmi^mmf^i^itmm (nmmmmmmm-mmmffam)
(i)
1
1
1
1
1
1
1
1
[ 7 ? ) C M ^
2
2
2
2
2
2
2
rM :?H^M L ^ iu 3
3
3
3
3
3
3
3
3
M
4 5
4 5
4 5
4 5
4 5
4 5
4 5
4 5
4 5
ims.
'^^$^' mmmmm ^ mtmm ^ m^omwimm^mrmmmM^u
1 2 3 4
^X^OMM^r^ frA 7

340
1 2 3 4
m^mm^ ?
1 2 3 4 5
ST 7
52.s/rz>w]m»a«
1 2 3 4 5
53.Siisaija¥^' /^^w]^/f®f#^^w]rs6^fif s^. :sgc0mfMSia^«Kj > s ^ g ^ f p j ?
1 2 a ^ f tw^ i j mmm
mmm^ mm^^ i^mm.^ mmmm(mm^) mmRmm
1 1
2 2
3 3
4 4
5 5
ilX^0#IIi(2ft(55 m-60 M) ' ffl^mS^^IS3lft/^^i>5]m®fltfi^^1^^«^
57.1P°P#X{^
1
1
1
1
1
1
mm^t m^^Mit m^tx mmnmi^.
2
2
2
2
2
3
3
3
3
3
4
4
4
4
4
5
5
5
5
5

341
6\.^Wj>n]m' mmm^ummRmshmm^^^m^^mm > mmmm^^mis.' Hiimii a^M?
(b) ° " P P M
(c)Mp°pjt^
7C X 1
(d)^^a^^SiifMS:Srt:i#^f^^S : n LPP a^xste (e)l
(g)Sffe(ifi^H^). LPPJSJ
1 1 1 1 1 1
m. mm 2 2 2 2 2 2
m 3 3 3 3 3 3
m. m 4 4 4 4 4 4
im 5 5 5 5 5 5
m.
.62 .S i i ^a^-^^ (a)10Sl.)(X (b)ll-20a (c)21~30M (d)31-40@
(e)41~50S (1)51-60 a (g)6o mi;x±
iralBjJa^E / , - v ^ ^ ^ O A O J i^pmm^ummi^^pmmm ?
.63.11 rn1/^6^^W]|i^(M^a^^^^ : (a)S±ftX(Top-down) (b)fiXa±(Bottom-up) (c)#|Siita^(Participative)
(dmimm^m)
.64.S/ a / -oj 7/,X7
(a)^*IS$fJ *;*
(c)Mx^l»^lij^a^r:^^ (d)ft^^^I[f
^ ^ X i [M
1 1 1 1 1 1
2 2 2 2 2 2
3 3 3 3 3 3
4 4 4 4 4 4
5 5 5 5 5 5
LM

342
mmi^xtimmmm'j' Rmmi^xti
(hMxtsmm^mmmmm m' /i^atj^«g^{iiffiiflaij
(c)ifeA^«^a«^MfflM W(x^mr^i.:^±)' mmm
(d)ft/ a^^w]a' mmmim -mnmmmmmmm -i&ir §a fiiHj(' Am.mmy
1
1
1
2
2
^ ^ E immm mmmmmn.
3
66.T^[js:ifMi:%Mffl5i5^ / a^^w]»j«B§t4A^« iga i»' mMmmum^mi^
2E. Xt^3 mmwmm m^i^mm A ^ ± ^ ^ ^ ^^^mm
XtlWM
Mmmi^xtim
Ulthil^tMa^lS
(c)/^a^i>w]x^s
ithil fMa^f^
idmmiixtimm
im^mmaxt!
1
1
2
2
3
3
4
4
4
4
4
5
5

343
mmwM^m
{a).wt&^'j>^nmmm'i^xtimmm - mmmmm.x^^'^mm^^'jz^m^ °
1 2 3 4 5 (h).nitWj>^mmm.m'\±xtimmm - i§ !iA*a smfflir iiA:?'a iistgWi ^ga<j =
1 2 3 4 5 icinitw^WM^mmi^xtimmm' Mtia<j^sA:rsstiiM(^^D: m^ ^ wmm^s^^^^ °
1 2 3 4 5
{d).nit^'j>WMmmmi±xtimmm - ifMii^a^^jiA:?^t^*@s^ifsa^5fc^«f4^ °
1 2 3 4 5
(e).t/ a ^3]5ifflmB§ttA*^ iJi0f' j^mmm^m^mmm^m - f ^wie ^ fmrjrawB ^
1 2 3 4 5
mammimmi Rmumwm R^^mjm ^mmj^^mim mmm^^^ 1 2 3 4 5
69.M e<lXftllfi* ' [Ximmrj>^mmm^mmmmmi^ ?
1
1 2 3 4 5

344
(a) 0%
(b) 1%~10%
(c) ll%-20%
(d)21%-30%
(e)31%-40%
(f)41%-50%
(g)51%l. l±
' m^-^p^' :5L>a yaa ixfe^^Mxa^w^e^tb^^^^ ?
72.s/^aijxf^i^fi3 (a) 0 /jN0f
(b)i-ioX0f
(c) 11-20 Xflf
(d) 21-30 XHf
(e) 31-40 XHf
(f) 41-50 XHf
(g)5i A^mx^L
Blf^ f^iMna^Mx' m^mxm^immmwi^s^p ?
.73.s/^a^xfti^f:^«' w#^^®a^i^fffitt!ixi^:^i iijii^' mm^mmm^^un )
(a) m^ 3 m (b) 3-5 @
(c)6~10M (d)ll-15® (e)16-20@ (f)21-25 S (g)25 SJa^X
[X#i]n ? (M$n: ^w]
-74.4ii^6^-^^. /i^^w]^xt§f iiMx' m?2»a^^^Af(±^#^x ? (Hfi-- (a)l,000i.:(^
(b)l,001-2,000
(c) 2,001-3,000
(d) 3,001-4,000
(e) 4,001-5,000
(1)5,001-6,000
(g)6,000 ])X}L
f ^ ^ XTI:)

(mMUWMfM^ iXimm^m^^
345
imm rmi WMj^^mMm^^m ?
ri^xtsmm^mMmnm D
D
D
D
D
(a^)Xt!mmmMmm^mmii^-m^m'3mm
mxtj'MwmMBmmM.' x^mm^iii (hyjknj^mmm^mm^^mM'M^mm.mi^
xtsmm^mMmmmn^md^^mmn
(cYA^^^mmmi^xfjWMmmi' gp^^
fimmmxtimmmmmmm {dyJ}:^m^mmxtlmmMBmm^^&mn
(&yj}n]m^m^'i]XtimmmB\ - ^±m^mm m^mmmm ° AAf«t.iMi'M^^^w]a^
(a).ft/^a^xfwfi«' j^mmm^mmR^mm^m^M - ^^Mmfi i »(M$D: m^mmm ^mi& immnm&^XA^AM.n^mm^'^XA^mtmmmmmmmtu • mm^Xf^mm ^ ummMMm ^ ^^MMmw ^ ftK^ Q(Tobin's Q)^f#a^ °
1 2 3 4 5
1 2 3 4 5 (c).ft^^i£Miisa^i«^^^s^i^^^^sa!jMS0f' mmm^^mAimxmm.^mmm
1 2 3 4 5
m^SEM. mm^\^M w^nn immm mm^
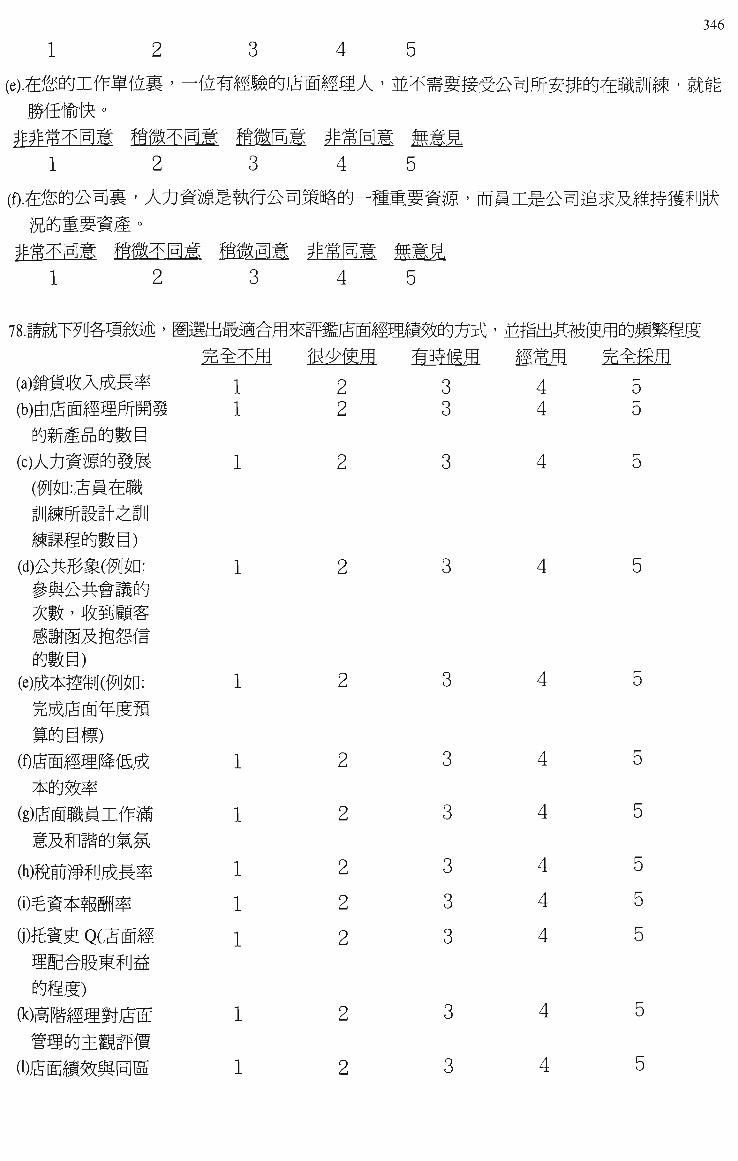
346
1 2 3 4 5
(e).4/^a^xf^iifi«' -iiim^m^fsmmmx' m^m^m^'j>^mmm^mw\m • m^
1 2 3 4 5
^^^x^:ft m i ^ ^ ^ S HmHE #m^M feMW. 1 2 3 4 5
78.itEX^[j#iii^ ^.^?^ffi
imMn^xj^Mm {h)^jsmmm.mmm
a^sfSp°pa«@ (c)At['^i!ia^^M
(M$D:lfiM*li mmmmj-^fjw mmm^mm
idYj^mmimm: ^m'f^^tm^ ^m' mm^ BrnmAmrm a i[@)
(e)^*S$fJ(M$D: %f^JSM^f^M n^mm
immmmmis.f^ $a^^$
(g))£MaMXf^^ MAmfmm.^
(hMmWmf$.M^
ii)^mMmm (j)?^K^ QO^MII
aiB^ssm^y^ ^mm)
(K)mmmmmjam ^mm^mwm
mmm^nn^
1 1
1
1
1
1
1
1
1
1
1
1
2 2
2
2
2
2
2
2
2
2
2
2
3 3
3
3
3
3
3
3
3
3
3
3
4 4
4
4
4
4
4
4
4
4
4
4
5 5
5
5
5
5
5
5
5
5
5
5

347
.79. ftf^a^^w]^jf»a^#xf^^fM^, e i (a){£|(^5% (b)6%~10% (c)ll%-15% (d)16%-20% (e)20%I.:i>±
ix^a^Mxwjffp^, Mmm^x ?
80. sf^a^^wia, iaAMX6 ,« fpM3i5ri ^Mx$gfna f£, iiaf ?£&^^a f>w]m»a^# X{ i fi4 , sthMW#A ?
(a){£|[- 5% (b)6%~10% (c)ll%-15% (d)16%-20% (e)20%i.)l±
_8i. wmi'j>nm, B^x^mmmmmm, m.nm^mm, wrnm-mmw^ (2i)'^±\iXm.rjmmmmmm, x^MX¥^^a^A/J^ ° (b)tMX«' fp ^@ [n]Bf, i.^(Mxx«ms^ ° (c)t*x»itfp^^^[i^w]p/T^^a^^^Bt, i :AMx^«: i+s:aijs# ° (d)^^i^:^Mxaw«:^sm x^Mxa«^fF# ° (e)^i.)(MX^^^:^#Jia^S»f, ^W^ffeH^M 'J: ffma^S# °
_82. fe^^a^^w]*, S'^iifflifMxa^sfsxf^Wu, x^^Mw, A.iew#^XA*ffi
(a)15AJ' lX (b) 16-30 A (c)31-45A (d)46~60 A (e)60 AJ;i.±
.83. ftfi^a^^wia (a){£5^ 5% (b)6%-10% (c)ll%-15% (d)16%~20% (e)20%J. (±
/^^ Xf mfiiWm^Bt, Xi MW, %-mitLm%Wn'ffl\:M^X ?

348
i ^ g • Mx:^iii:&Mx#ffl
84. V/^3l iX.'^Wj^mmmmm^, mwj>nmmim.R^mi5^m
(a)f£J^ 5% (b)6%-10% (c)ll%-15% (d)16%-20% (e)20%ia^±
^inm, a^Mxmfea^thMW^A ?
.85. ftf^a^^w]«, i:i'pmm':]^mRmmmM^mmmmmm^^^jTMim, iitia^xf^ mf5mfea ttMW# A ? (a)f£J-^5% (b)6%-10% (c)ll%-15% (d)16%-20% (e)20%l.:l±
36.^m'j>nm, x^ (a){£!^5% (b)6%-10% (c)ll%-15% (d)16%-20% (e)20%j;i±
iE.mMm'^jii'^mii, ^s^x^pg, mwm^x ?
3T^m'j>nm, xm (a){g5^5% (b)6%-10% (c)ll%-15% (d)16%-20% (e)20%I.)(±
fti^a^iBe:a^a, ^ii^^i^^is^«a^ttMW#A ?
M.isxm'iknm, M X # ^ ^xf^^r^^p^pi (quality circles) j , 1^ ^ ^ S j I M g ^ S f f l i
iltae^hhMW^A ? (a){£5^5% (b)6%~10% (c)ll%-15% (d)16%~20% (e)20%i.)(X
c|§U (quality of work life) J , ^ppMffl^g^it
(labor-management participation teams) j ^ ^
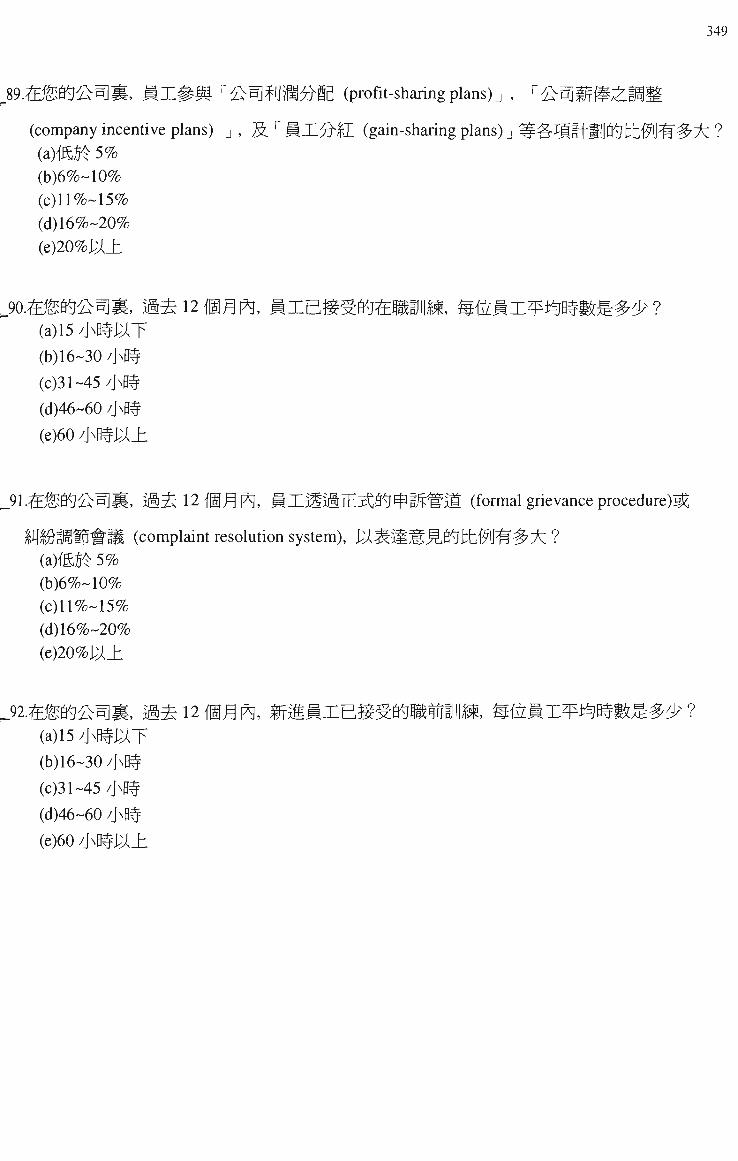
349
S9.^tWj>^ i X # | 2 | ^'j>^mfMM^ (profit-sharing plans) J ,
(company incentive plans) j , S. ^ M X ^ ^ I (gain-sharing plans) j (aMn 5% (b)6%-10% (c)ll%~15% (d)16%-20% (e)20%i.:^±
''An
^mwmtm^^x ?
9o.^m'j>^m, m^nm^^, MxB sa^ i (a)15 /jN0#i. lX (b) 16-30/JN0#
(c)31-45/jNHf (d)46-60 /jN0f (e)60 /jNHf i.)(±
wm, miiL^n^m^m^^p ?
.91.4/^a^^W]^, i i S l 2 f @ ^ ^ , M X ^ i i i X T t a ^ ^ f r ^ i l (formal grievance procedure)^
t ^ (complaint resolution system), lik^MMMMltM'M^X ? 'imtk i&Y&n 5% (b)6%-10% (c)ll%-15% (d)16%-20% (e)20%lU±
92.^im'f^nm, m^nmn^, mmmxE.m^^mmwm, mitmx^i^mm^^p? (a)15 /jN0f J.)IX (b) 16-30 X0f (c)31-45X0f (d)46~60 /jN0|r (e)60 /jN0f i.:^±
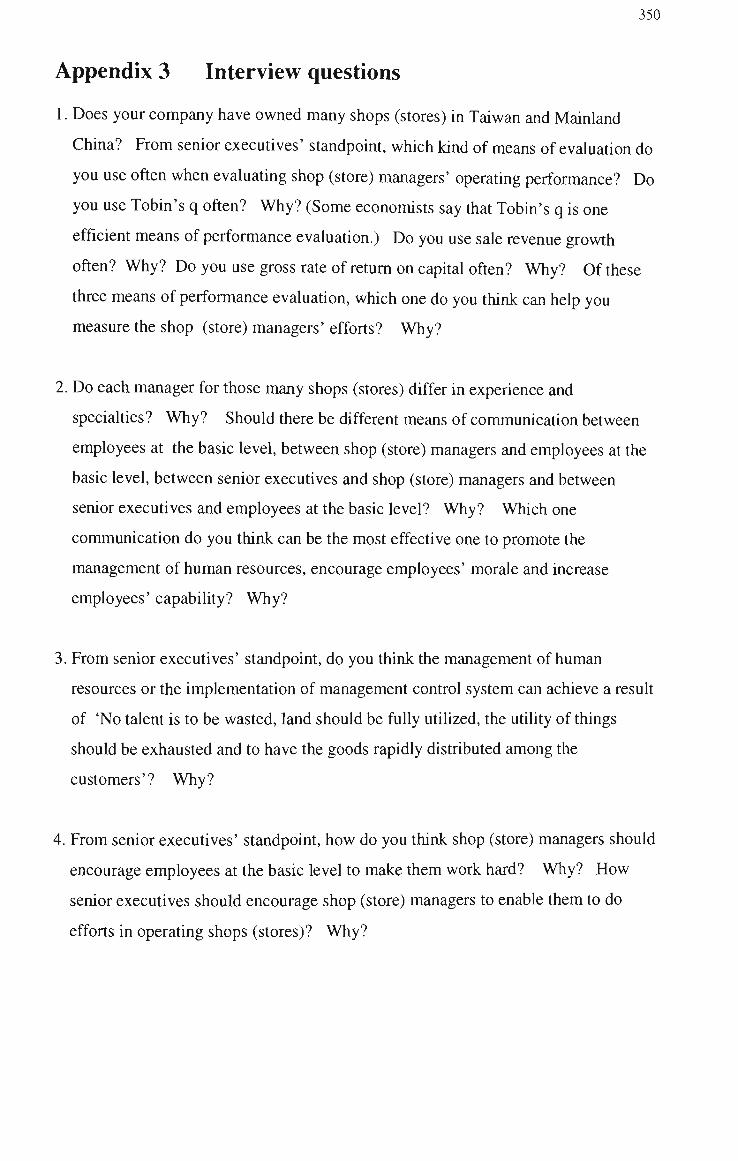
350
Appendix 3 Interview questions
1. Does your company have owned many shops (stores) in Taiwan and Mainland
China? From senior executives' standpoint, which kind of means of evaluation do
you use often when evaluating shop (store) managers' operathig performance? Do
you use Tobin's q often? Why? (Some economists say that Tobm's q is one
efficient means of performance evaluation.) Do you use sale revenue growth
often? Why? Do you use gross rate of retum on capital often? Why? Of these
three means of performance evaluation, which one do you think can help you
measure the shop (store) managers' efforts? Why?
2. Do each manager for those many shops (stores) differ in experience and
specialties? Why? Should there be different means of communication between
employees at the basic level, between shop (store) managers and employees at the
basic level, between senior executives and shop (store) managers and between
senior executives and employees at the basic level? Why? Which one
conununication do you think can be the most effective one to promote the
management of human resources, encourage employees' morale and increase
employees' capabihty? Why?
3. From senior executives' standpoint, do you think the management of human
resources or the implementation of management control system can achieve a result
of 'No talent is to be wasted, land should be fully utihzed, the utility of things
should be exhausted and to have the goods rapidly distributed among the
customers'? Why?
4. From senior executives' standpoint, how do you think shop (store) managers should
encourage employees at the basic level to make them work hard? Why? How
senior executives should encourage shop (store) managers to enable them to do
efforts in operating shops (stores)? Why?

351
5. From senior executives' role, how do you build a good communication channel
with your subordinates when you discover them possess more production
technology or specialized knowledge than you are? Would your subordinates fail
to conununicate with you just because your status as a senior executive? Why?
Do you ever consider your status as a senior executive that would prevent you from
communicating with your subordinates? Why? Do you think 'communication'
and 'control' to be supplemental each other or alternative mutually? Why?
6. Do you practice a system of 'be strict and fair in meting out rewards and
punishments' immediately or conduct an overall-examination to find out all
possible causes that affect operating performance and carry out benign
communication between each shop (store) when you discover a great difference of
operating performance for each shop (store) (suppose those shops or stores sharing
the same conditions) under your mling and management? Why? How do you
conduct the communication mentioned above?
7. Have your company implemented (or is implementing) just-in-time, total quality
management and activhy-based costing? Do they affect human resources
management? Why? Is your company's gradual increase of operating
performance arising out of an implementation of the preceding three management
control systems? Why?
8. Do you think a prenuse of implementing the balanced seorecard to be a good
human resources management and a sound human resources management system?
Why? Or do you think there exists no inevitable causation between 'good or bad
human resources management' and 'implementation of the balanced seorecard'?
Why?

352
Appendix 4 The external and internal quality of data in the
LISREL model
h is basically a confirmatory method to test the causation of theoretical models by the
analytical process of LISREL (Linear Stracture Relation) (i.e. developing the
theoretical models, estabhshing the path diagram of causation and hsting the
parameters to be estimated, assessing the identification of models, processing the
estimation of parameters, assessing the model fit). This kind of confirmatory
method is usually a study that theories guide the relationship of causation, more than
the one guided by data. This study presents the exploratory analysis first in Chapter
3, then foUowed by the confirmatory analysis. The main reason lies in: the sequence
of the causation on time will not necessarily be the sufficient condition for the
causation between each dimension though causation is theoreticaUy supported
between each constmct, and consequently, the cause and effect model of LISREL
shall be identified through the exploratory analysis first.
According to Hair et al. (1995), the structural equation modeling not only can deal
with the relationship between one set of independent variables and one set of
dependent variables but also the relationship among a series of dependent variables as
well. Besides, the stmctural equation modeling can provide researchers with paths
of research tuming from the exploratory analysis to the confirmatory one thanks to its
being able to handle the relationship among numerous sets of variables
simultaneously. LISREL which is one computer software used to analyze the
stmctural equation modeling features an advantage of offering rich output, but also
generates a drawback, i.e. up to eight matrices used to give a difficulty for those
rookies in writing programmes. This study works to put factors extracted from the
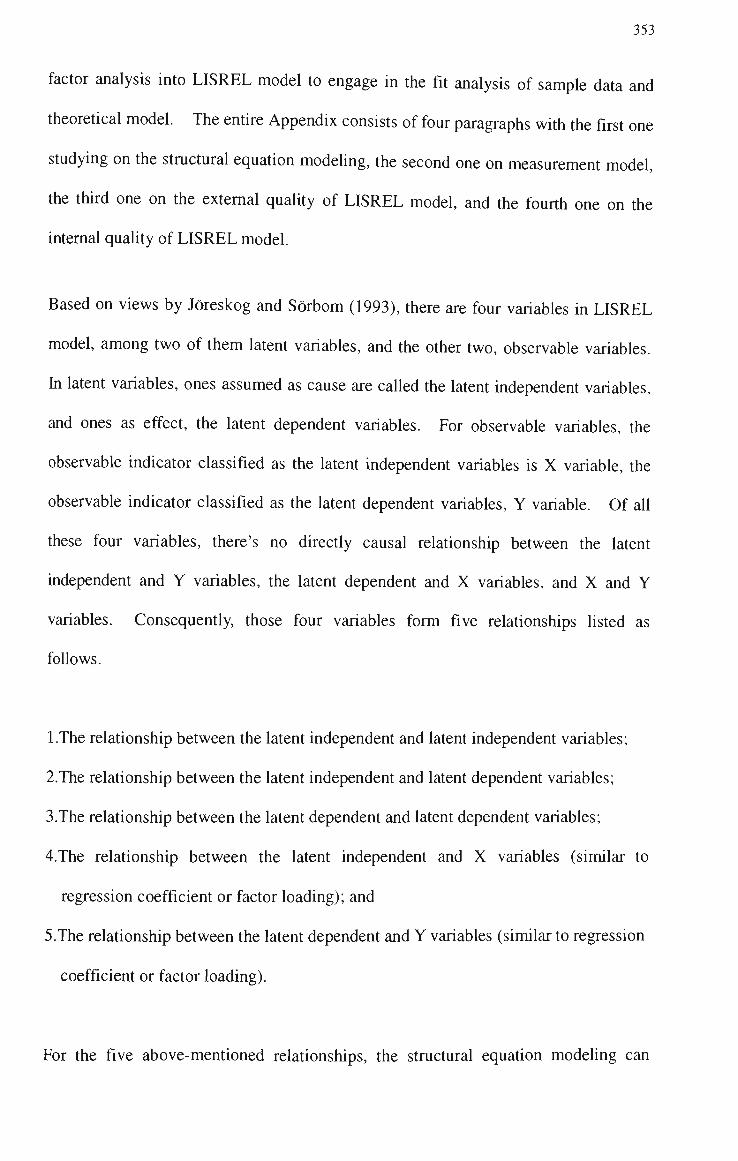
353
factor analysis into LISREL model to engage in the fit analysis of sample data and
theoretical model. The entire Appendix consists of four paragraphs with the first one
studying on the stmctural equation modehng, the second one on measurement model,
the third one on the extemal qualhy of LISREL model, and the fourth one on the
intemal quality of LISREL model.
Based on views by Joreskog and Sorbom (1993), there are four variables in LISREL
model, among two of them latent variables, and the other two, observable variables,
hi latent variables, ones assumed as cause are called the latent independent variables,
and ones as effect, the latent dependent variables. For observable variables, the
observable indicator classified as the latent independent variables is X variable, the
observable indicator classified as the latent dependent variables, Y variable. Of all
these four variables, there's no directly causal relationship between the latent
independent and Y variables, the latent dependent and X variables, and X and Y
variables. Consequently, those four variables form five relationships hsted as
follows.
l.The relationship between the latent independent and latent independent variables;
2.The relationship between the latent independent and latent dependent variables;
3.The relationship between the latent dependent and latent dependent variables;
4.The relationship between the latent independent and X variables (similar to
regression coefficient or factor loading); and
5.The relationship between the latent dependent and Y variables (similar to regression
coefficient or factor loading).
For the five above-mentioned relationships, the stmctural equation modehng can

354
indicate the relationship between the latent variables while the measurement model,
the relationship between the latent and observable variables. Therefore, LISREL
model consists of the stractural equation modehng and measurement model.
In addition five relationships mentioned in the preceding paragraph, LISREL model
comprises three error terms.
l.The measurement error terms of X variables;
2.The measurement error terms of Y variables;
3.Residual unexplained by the latent dependent variables.
In LISREL model, there are more than one term for the latent independent, latent
dependent, X and Y variables, and consequently, the above-mentioned five
relationships and three error terms are matrices. These are the eight main parametric
matrices of LISREL model. Figure A4.1 shown in the end of this appendix indicates
one causation path of LISREL model according to theories after deleting variable
factors with poor consistence. The round in this diagram indicates the latent
variables, square, the observable variables, sign of arrow, the causation (effect as
indicated by arrow, cause as indicated by the source of arrow), and double arrows,
relevance but no causation.
A. Structural equation modeling
In Figure A4.1 shown in the end of this appendix, h is inferred according to theories
that causation model of LISREL has four latent independent variables and seven
latent dependent variables. Factor analyses mentioned in Chapter 3 manifest the
variable factors of each dimension being in conformity with the factor disposition of

355
each dimension of four constracts discussed in the present study.
The step to hst parameters to be estimated is to transform the path diagram of the
causation model of LISREL into the stractural equation modehng and measurement
model, and then list the parameters desired to be estimated in detail. Take Figure
A4.1 shown in the end of this appendix as a basis, seven latent dependent variables
can be indicated in equation and the stractural equation modeling discussed in this
study are as follows.
latent dependent variables = latent independent variables + latent dependent variables + error terms
7/m ^1 ^2 ^3 ^4 VIVIV^VA C
V 1 = Yll^l + 712^2 + yi3^3 + 714^4+ P2I 7? 2+ P3I ?? 3 + P4I 7? 4
+ Cl
V 2 = 721^1 + 722^2 + 723^3 + 724^4 + Pl2 7? 1 + P32 7? 3 + P42 ^ 4
m
?/ 3 = 731^1 + Y32^2 + 733^3 + T34^ + Pl3 ?7 1 + P23 ?/ 2 + p43 ?7 4
+?3
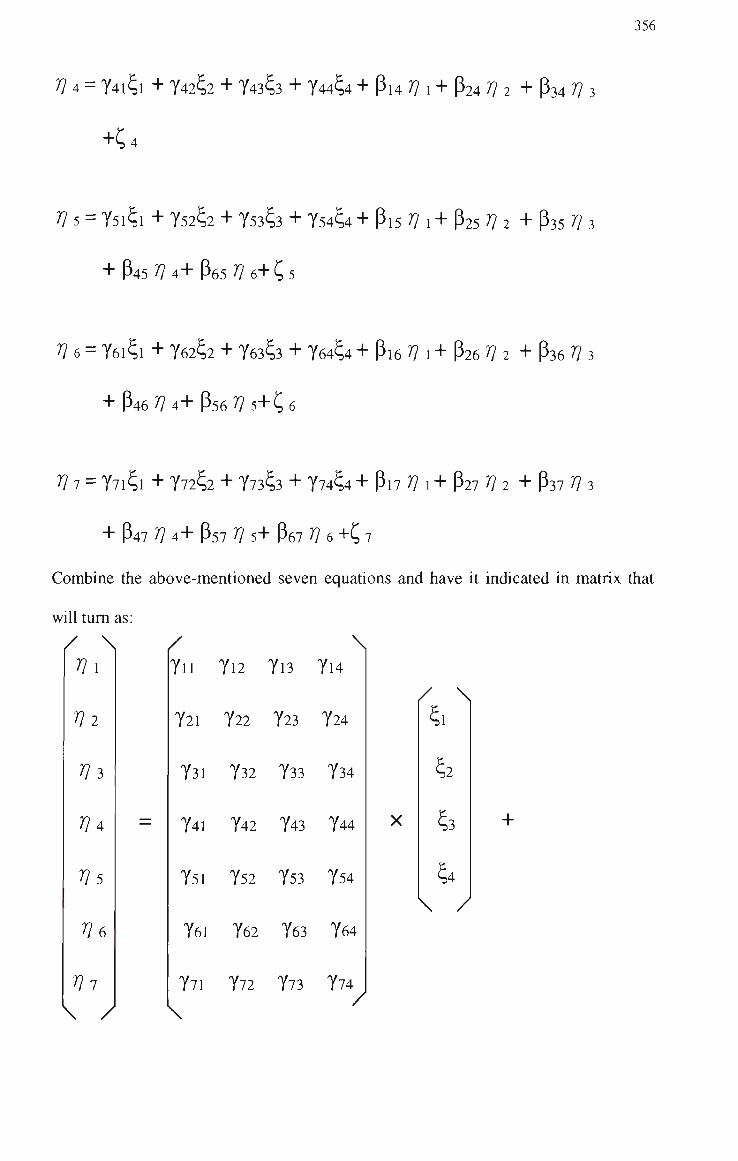
356
V 4 = 741^1 + 742^2 + 743^3 + 744^4 + Pl4 ?/ 1 + P24 ^ 2 + P34 V
<
V 5 = 751^1 + 752^2 + 753^3 + 754^4 + Pl5 ?7 1 + p25 7? 2 + P35 V
+ p45?y4+P65^6+?5
V 6 = 761^1 + 762^2 + 763^3 + 764^ + P16 ?7 1 + P26 ?? 2 + p36 7?
+ P46^4+P56 7y5+C6
V 1 = 771^1 + 772^2 + 773^3 + 774^4 + Pl7 ^ 1 + p27 ^ 2 + p37 ?7 3
+ p47 V 4+ P57 V 5+ P67 7? 6 +C 7
Combine the above-mentioned seven equations and have it indicated in matrix that
\
will tum as: / \ y
7ii 7i2 7i3 7i4 Vi
V3
V4
Vs
Ve
Vi \ /
721 722 723 724
731 732 733 734
741 742 743 744
751 752 753 754
761 762 763 764
771 772 773 774
/
X
^1
^2
§3
\ /
+
\ /
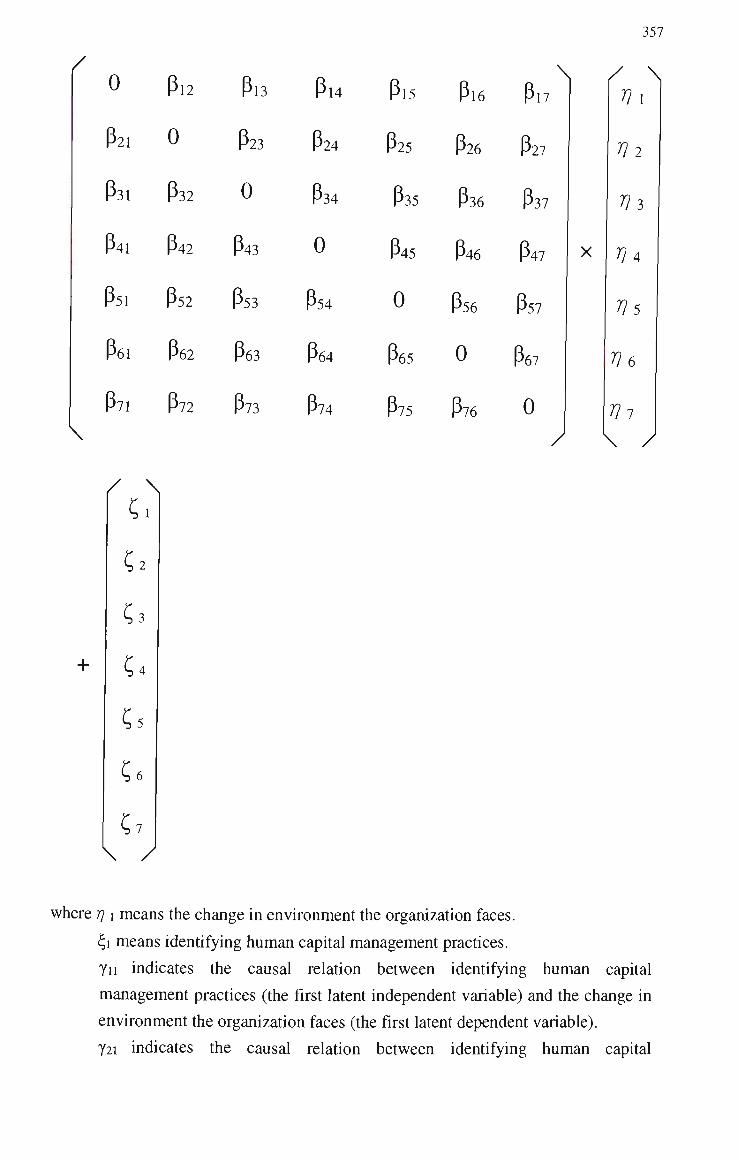
357
/
l
0
P21
P31
P41
P5,
P61
P7,
P12
0
P32
P42
P52
P62
P72
Pl3
P23
0
P43
P53
P63
P73
Pl4
P24
P34
0
P54
P64
P74
+
/ \
?3
^ 4
Pl5 P16 p
p 65
P75 p 76
\
17
P25 P26 P 27
P35 P36 P 37
P45 P4« P 47
0 P56 P 57
0 P 67
0
X
/
/ \
V\
Til
v?>
Vs
Ve
Vi \ /
where TJ \ means the change in environment the organization faces.
4i means identifying human capital management practices,
yii indicates the causal relation between identifying human capital
management practices (the first latent independent variable) and the change in
environment the organization faces (the first latent dependent variable).
721 indicates the causal relation between identifying human capital

358
management practices (the first latent independent variable) and employee
skill and organizational stmcture (the second latent dependent variable).
731 indicates the causal relation between identifying human capital
management practices (the first latent independent variable) and employee
motivation (the third latent dependent variable).
741 indicates the causal relation between identifying human caphal
management practices (the first latent independent variable) and employee
productivhy (the fourth latent dependent variable).
751 indicates the causal relation between identifying human capital
management practices (the first latent independent variable) and customer
complaint (the fifth latent dependent variable).
761 indicates the causal relation between identifying human capital
management practices (the first latent independent variable) and customer
satisfaction (the sixth latent dependent variable).
771 indicates the causal relation between identifying human capital
management practices (the first latent independent variable) and company's
financial performance (the seventh latent dependent variable).
^2 means developing human capital management practices.
7i2 indicates the causal relation between developing human capital
management practices (the second latent independent variable) and the change
in environment the orgaruzation faces (the first latent dependent variable).
722 indicates the causal relation between developing human capital
management practices (the second latent independent variable) and employee
skill and organizational stracture (the second latent dependent variable).
732 indicates the causal relation between developing human capital
management practices (the second latent independent variable) and employee
motivation (the third latent dependent variable).
742 indicates the causal relation between developing human capital
management practices (the second latent independent variable) and employee
productivity (the fourth latent dependent variable).
752 indicates the causal relation between developing human caphal
management practices (the second latent independent variable) and customer
complaint (the fifth latent dependent variable).
762 indicates the causal relation between developing human capital
management practices (the second latent independent variable) and customer
satisfaction (the sixth latent dependent variable).
772 indicates the causal relation between developing human caphal
management practices (the second latent independent variable) and company's

359
financial performance (the seventh latent dependent variable).
3 means protecting human caphal management practices.
7i 3 indicates the causal relation between protecting human capital management
practices (the third latent independent variable) and the change in environment
the organization faces (the first latent dependent variable).
723 indicates the causal relation between protecting human capital management
practices (the third latent independent variable) and employee skill and
organizational stracture (the second latent dependent variable).
733 indicates the causal relation between protecting human capital management
practices (the third latent independent variable) and employee motivation (the
third latent dependent variable).
743 indicates the causal relation between protecting human capital management
practices (the third latent independent variable) and employee productivity
(the fourth latent dependent variable).
753 indicates the causal relation between protecting human capital management
practices (the third latent independent variable) and customer complaint (the
fifth latent dependent variable).
763 indicates the causal relation between protecting human capital management
practices (the third latent independent variable) and customer satisfaction (the
sixth latent dependent variable).
773 indicates the causal relation between protecting human capital management
practices (the third latent independent variable) and company's financial
performance (the seventh latent dependent variable).
^ means deploying human capital management practices.
7i4 indicates the causal relation between deploying human capital management
practices (the fourth latent independent variable) and the change in
environment the organization faces (the first latent dependent variable).
724 indicates the causal relation between deploying human capital management
practices (the fourth latent independent variable) and employee skill and
organizational stracture (the second latent dependent variable).
734 indicates the causal relation between deploying human caphal management
practices (the fourth latent independent variable) and employee motivation
(the third latent dependent variable).
744 indicates the causal relation between deploying human capital management
practices (the fourth latent independent variable) and employee productivity
(the fourth latent dependent variable).
754 indicates the causal relation between deploying human capital management
practices (the fourth latent independent variable) and customer complaint (the

360
fifth latent dependent variable).
764 indicates the causal relation between deploying human capital management
practices (the fourth latent independent variable) and customer satisfaction
(the sixth latent dependent variable).
774 indicates the causal relation between deploying human capital management
practices (the fourth latent independent variable) and company's financial
performance (the seventh latent dependent variable).
Tj 2 means employee skiU and organizational stracture.
p2i(or P12) indicates the correlation between the change in environment the
organization faces (the first latent dependent variable) and employee skill and
organizational stracture (the second latent dependent variable).
P32(or P23) indicates the correlation between employee skill and organizational
stracture (the second latent dependent variable) and employee motivation (the
third latent dependent variable).
Tj 3 means employee motivation.
P3i(or P13) indicates the correlation between the change in environment the
organization faces (the first latent dependent variable) and employee
motivation (the third latent dependent variable).
Tj 4 means employee productivity.
P4i(or P14) indicates the correlation between the change in environment the
organization faces (the first latent dependent variable) and employee
productivity (the fourth latent dependent variable).
P42(or P24) indicates the cortelation between employee skill and orgaruzational
stracture (the second latent dependent variable) and employee productivity
(the fourth latent dependent variable).
P43(or P34) indicates the correlation between employee motivation (the third
latent dependent variable) and employee productivity (the fourth latent
dependent variable).
Tj 5 means customer complaint.
P15 indicates the correlation between the change in environment the
organization faces (the first latent dependent variable) and customer complaint
(the fifth latent dependent variable).
P25 indicates the correlation between employee skill and orgaruzational
stractiire (the second latent dependent variable) and customer complaint (the
fifth latent dependent variable).
p35 indicates the correlation between employee motivation (the third latent
dependent variable) and customer complaint (tiie fifth latent dependent
variable).

361
P45 indicates the correlation between employee productivity (the fourth latent
dependent variable) and customer complaint (the fifth latent dependent
variable).
Tj 6 means customer satisfaction.
Pi6 indicates the correlation between the change in environment the
organization faces (the first latent dependent variable) and customer
satisfaction (the sixth latent dependent variable).
p26 indicates the correlation between employee skill and organizational
stracture (the second latent dependent variable) and customer satisfaction (the
sixth latent dependent variable).
P36 indicates the correlation between employee motivation (the third latent
dependent variable) and customer satisfaction (the sixth latent dependent
variable).
P46 indicates the correlation between employee productivity (the fourth latent
dependent variable) and customer satisfaction (the sixth latent dependent variable).
P65(or P56) indicates the correlation between customer complaint (the fifth
latent dependent variable) and customer satisfaction (the sixth latent dependent
variable).
Tj 7 means company's financial performance.
Pi7 indicates the correlation between the change in environment the
organization faces (the first latent dependent variable) and company's financial
performance (the seventh latent dependent variable).
P27 indicates the correlation between employee skill and organizational
stracture (the second latent dependent variable) and company's financial
performance (the seventh latent dependent variable).
P37 indicates the correlation between employee motivation (the third latent
dependent variable) and company's financial performance (the seventh latent
dependent variable).
P47 indicates the correlation between employee productivity (the fourth latent
dependent variable) and company's financial performance (the seventh latent
dependent variable).
P57 indicates the correlation between customer complaint (the fifth latent
dependent variable) and company's financial performance (the seventh latent
dependent variable).
P67 indicates the correlation between customer satisfaction (the sixth latent
dependent variable) and company's financial performance (the seventh latent
dependent variable).

362
^ 1, ^ 2, C 3, C 4, C 5, C 6 and C, 7 indicate the residual error of each stracmral
equation.
Therefore, the stractural equation modehng discussed in the present study is as
follows.
where Tj means latent dependent variables.
r is a coefficient matrix describing the direct impact of the latent independent
variable on the latent dependent variable.
t, means latent independent variables.
B is a coefficient matrix describing the direct impact of one latent dependent
variable on another latent dependent variable.
C, means the residual error of stractural equation modeling.
B. The measurement model
According to Figure A4.1 shown in the end of this Appendix, the observable variables
X can be indicated in equation as follows.
Xi ^X^l^ l +5i ; X2 = A.^1^1 -.52; X3 = X\^^x +83;
X4 = V^Aik 2 + S 4 ; X5 = }i^52^ 2 + S 4 ; X6 = V^ei^ 2 + ^ 6 ;
X7 =A-^3^ 3 + 87 ; Xg = ^""83^ 3 + Sg ; X9 = A.\3^ 3 + §9 ;
Xio =?^%3^3 + 5 i o ; X l l = ^ ^ l 3 ^ 3 +811 ; X12 = ^^24^4 + 5 i 2 ;
Xi3 =^^134^4-. 5i3 ; Xi4=X^144^4 + 5l4 ; X15 = A,^154^4+5i5-
where Xi means tiie first observable indicator of the first latent independent variable,
identifying human capital management practices.
X2 means the second observable indicator of the first latent independent
variable, identifying human capital management practices.
X3 means the third observable indicator of the first latent independent variable,
identifying human capital management practices.
X4 means the first observable indicator of the second latent independent

363
variable, developing human capital management practices.
X5 means the second observable indicator of the second latent independent
variable, developing human caphal management practices.
X6 means the third observable indicator of the second latent independent
variable, developing human caphal management practices.
X7 means the first observable indicator of the third latent independent variable,
protecting human capital management practices.
Xg means the second observable indicator of the third latent independent
variable, protecting human caphal management practices.
X9 means the third observable indicator of the third latent independent
variable, protecting human caphal management practices.
Xio means the fourth observable indicator of the third latent independent
variable, protecting human capital management practices.
Xll means the fifth observable indicator of the third latent independent
variable, protecting human caphal management practices.
X12 means the first observable indicator of the fourth latent independent
variable, deploying human capital management practices.
Xi3 means the second observable indicator of the fourth latent independent
variable, deploying human capital management practices.
Xi4 means the third observable indicator of the fourth latent independent
variable, deploying human capital management practices.
Xi5 means the fourth observable indicator of the fourth latent independent
variable, deploying human capital management practices.
t, 1 means the first latent independent variable, identifying human capital
management practices.
^ 2 means the second latent independent variable, developing human capital
management practices.
t, 3 means the third latent independent variable, protecting human caphal
management practices.
t, 4 means the fourth latent independent variable, deploying human capital
management practices.
^ 11 is a coefficient describing the relation between the first latent independent
variable (t, 1) and its first observable indicator, Xi.
A, 2i is a coefficient describing the relation between the first latent independent
variable (^ 1) and its second observable indicator, X2.
A, 3i is a coefficient describing the relation between the first latent independent
variable (^ 1) and its third observable indicator, X3.
1 42 is a coefficient describing the relation between the second latent

364
independent variable (^ 2) and its first observable indicator, X4.
X 52 is a coefficient describing the relation between the second latent
independent variable (^ 2) and hs second observable indicator, X5.
). 62 is a coefficient describing the relation between the second latent
independent variable (^ 2) and hs third observable indicator, X6.
>- 73 is a coefficient describing the relation between the third latent
independent variable (^ 3) and its first observable indicator, X7.
X 83 is a coefficient describing the relation between the third latent
independent variable (^ 3) and its second observable indicator, Xg.
X 92 is a coefficient describing the relation between the third latent
independent variable (^ 3) and its third observable indicator, X9.
A, 103 is a coefficient describing the relation between the third latent
independent variable (^ 3) and hs fourth observable indicator, Xio.
X, 113 is a coefficient describing the relation between the third latent
independent variable (^ 3) and its fifth observable indicator, Xn.
1 124 is a coefficient describing the relation between the fourth latent
independent variable (^ 4) and its first observable indicator, X12. • y
I. 134 is a coefficient describing the relation between the fourth latent
independent variable (t, 4) and its second observable indicator, X13.
X 144 is a coefficient describing the relation between the fourth latent
independent variable (^ 4) and its third observable indicator, X14.
X 154 is a coefficient describing the relation between the fourth latent
independent variable (^ 4) and hs fourth observable indicator, X15.
61 means the measurement error of the observable indicator, Xi.
82 means the measurement error of the observable indicator, X2.
83 means the measurement error of the observable indicator, X3.
84 means the measurement error of the observable indicator, X4.
55 means the measurement error of the observable indicator, X5.
56 means the measurement error of the observable indicator, X6.
87 means the measurement error of the observable indicator, X7.
Sg means the measurement error of the observable indicator, Xg.
89 means the measurement error of the observable indicator, X9.
610 means the measurement error of the observable indicator, Xio.
5ii means the measurement error of the observable indicator, Xn.
5i2 means the measurement error of the observable indicator, X12.
5i3 means the measurement error of the observable indicator, X13.
814 means the measurement error of the observable indicator, X14.
815 means the measurement error of the observable indicator, X15.

If indicated in matrix, the above-mentioned equation for 15 X is:
365
/ \
Xi
X2
X3
X4
X5
X6
X7
Xs
X9
Xio
Xu
X12
Xi3
Xi4
X,5
=
/
A 11
^ 21
^ 31
0
0
0
0
0
0
0
0
0
0
0
0
0 0
0 0
0 0
X\2 0
X\ 0
^""62 0
0 x\
0 X\3
0 l\
0 ^ 103
0 ^^13
0 0
0 0
0 0
0 0
\
0
0
0
0
0
0
0
0
0
0
0
^ 124
^ 134
A 144
^ 154
\ /
/ \
^ 1
^ 2
^ 3
^ 4
\ /
+
\ /
/ \
81
82
83
84
85
86
87
88
89
810
8„
812
813
814
815
\ /
In the same principle, the equation and matrix of the observable variables Y can be
indicated as;

366
Yi = ?L^ir|i +ei; ¥ 2 = X^^iiii -.82;
Y4 = X,\2r|2 + £ 4; Y5 = >u''52ri2 + £ 5;
Y7 = A.^3r|3 +S7; Yg = >^\3r|3 +Sg;
Yio = A.\o3ri3+e 10
Yi3 = A.^135r|5+8i3
Yi6 = ^^166116+ £ 16
Y3 = A-^lTli+S3;
Y6 = X.''62'n2+£6;
Y9 = }i^93ri3-HS9;
Y i i = ?i^ii4r|4 -^s 11; Y12 = A.^24ri4 + £ 12;
Yi4 = 'k^u5r{s + £ 14; Yi5 = A.''i56r|6 + £ 15
Yl7 = A^l77'n7+£l7-
where Yi means the first observable indicator of the first latent dependent variable,
the change in environment.
Y2 means the second observable indicator of the first latent dependent
variable, the change in environment.
Y3 means the third observable indicator of the first latent dependent variable,
the change in environment.
Y4 means the first observable indicator of the second latent dependent
variable, employee skill and organizational stracture.
Y5 means the second observable indicator of the second latent dependent
variable, employee skill and organizational stracture.
Y6 means the third observable indicator of the second latent dependent
variable, employee skill and organizational stracture.
Y7 means the first observable indicator of the third latent dependent variable,
employee motivation.
Yg means the second observable indicator of the third latent dependent
variable, employee motivation.
Y9 means the third observable indicator of the third latent dependent
variable, employee motivation.
Yio means the fourth observable indicator of the third latent dependent
variable, employee motivation.
Yii means the first observable indicator of the fourth latent dependent
variable, employee productivity.
Y12 means the second observable indicator of the fourth latent dependent

367
variable, employee productivhy.
Yi3 means the first observable indicator of the fifth latent dependent
variable, customer complaint.
Yi4 means the second observable indicator of the fifth latent dependent
variable, customer complaint.
Yi5 means the first observable indicator of the sixth latent dependent
variable, customer satisfaction.
Yi6 means the second observable indicator of the sixth latent dependent
variable, customer satisfaction.
Yi7 means the observable indicator of the seventh latent dependent variable,
company's financial performance.
Til means the first latent dependent variable, the change in environment.
T|2 means the second latent dependent variable, employee skill and
organizational stracture
Ti3 means the third latent dependent variable, employee motivation.
r|4 means the fourth latent dependent variable, employee productivity.
ri5 means the fifth latent dependent variable, customer complaint.
Tie means the sixth latent dependent variable, customer satisfaction.
Ti7 means the seventh latent dependent variable, company's financial
performance.
ifn is a coefficient describing the relation between the first latent
dependent variable (t^i) and its first observable indicator, Yi.
X 2i is a coefficient describing the relation between the first latent
dependent variable (T]I) and its second observable indicator, Y2.
" 31 is a coefficient describing the relation between the first latent
dependent variable (T^I) and its third observable indicator, Y3.
5i 42 is a coefficient describing the relation between the second latent
dependent variable (TI2) and its first observable indicator, Y4.
?i 52 is a coefficient describing the relation between the second latent
dependent variable (TI2) and its second observable indicator, Y5.
)v,' 62 is a coefficient describing the relation between the second latent
dependent variable (ri2) and hs third observable indicator. Ye-
X^73 is a coefficient describing the relation between the third latent
dependent variable (TI3) and its first observable indicator, Y7.
}y&3 is a coefficient describing the relation between the third latent
dependent variable (TI3) and hs second observable indicator, Yg.
X 93 is a coefficient describing the relation between the third latent
dependent variable (TI3) and its third observable indicator, Y9.

368
I 103 is a coefficient describing the relation between the third latent
dependent variable (113) and its fourth observable indicator, Yio.
>. 114 is a coefficient describing the relation between the fourth latent
dependent variable (TI4) and its first observable indicator, Yn.
X 124 is a coefficient describing the relation between the fourth latent
dependent variable (114) and its second observable indicator, Yn.
l 135 is a coefficient describing the relation between the fifth latent
dependent variable (TI5) and its first observable indicator, Y13.
X 145 is a coefficient describing the relation between the fifth latent
dependent variable (TI5) and its second observable indicator, Y14.
X, 156 is a coefficient describing the relation between the sixth latent
dependent variable (rje) and hs first observable indicator, Y15.
X 166 is a coefficient describing the relation between the sixth latent
dependent variable (r|6) and its second observable indicator, Y16.
X 177 is a coefficient describing the relation between the seventh latent
dependent variable (TI7) and its observable indicator, Y17.
ei means the measurement error of the observable indicator, Yi.
82 means the measurement error of the observable indicator, Y2.
S3 means the measurement error of the observable indicator, Y3.
84 means the measurement error of the observable indicator, Y4.
85 means the measurement error of the observable indicator, Y5.
86 means the measurement error of the observable indicator, Y^.
87 means the measurement error of the observable indicator, Y7.
Sg means the measurement error of the observable indicator, Yg.
89 means the measurement error of the observable indicator, Y9.
Sio means the measurement error of the observable indicator, Yio.
Sii means the measurement error of the observable indicator, Yn.
812 means the measurement error of the observable indicator, Y12.
813 means the measurement error of the observable indicator, Y13.
814 means the measurement error of the observable indicator, Y14.
815 means the measurement error of the observable indicator, Y15.
816 means the measurement error of the observable indicator, Y16.
Si7 means the measurement error of the observable indicator, Y17.

369
/ \
Y,
Y2
Y3
Y4
Ys
Y6
Y7
Yg
Y,
Yio
Y„
Y,2
Yl3
Yl4
Yl5
Y16
Yl7
=
/
A 11
^ 21
^ 31
0
0
0
0
0
0
0
0
0
0
0
0
0
0
0
0
0
^ 42
^ 52
^ 62
0
0
0
0
0
0
0
0
0
0
0
0
0
0
0
0
0
^ 73
^ 83
f^ 93
^ 103
0
0
0
0
0
0
0
0
0
0
0
0
0
0
0
0
0
A 114
^ 124
0
0
0
0
0
0
0
0
0
0
0
0
0
0
0
0
0
^ 135
A 145
0
0
0
0
0
0
0
0
0
0
0
0
0
0
0
0
0
^ 156
X 166
0
\
0
0
0
0
0
0
0
0
0
0
0
0
0
0
0
0
A 177
\ /

370
X
/
111
Tl2
Tl3
ll4
ns
^6
^ 7
\
\
/
/ \
£ i
£ 2
£ 3
£ 4
£ 5
£ 6
£ 7
£ 9
£ 10
£11
£12
£13
£ 14
£15
£ 16
£17
The measurement model, therefore, of the observable variables X and Y is as foUows.

371
X = A x ^ + 5 ; Y = A Y T I - H 8
where Ax describes the relation between the latent independent variable ( ) and the
observable variable, X.
AY describes the relation between the latent dependent variable (ri ) and the
observable variable, Y.
8 means the measurement error of the observable variable, X.
8 means the measurement error of the observable variable, Y
While processing the analysis of LISREL model, apply the parameters to be estimated
to the above-mentioned stractural equation modeling and measurement model,
followed by an estimation of eight main parametric matrices (Ax, AY, F , B, @^, ©5,0
and ^ ) , which shall be processed in iteration by computer, required by the LISREL
model in the variance-covariance formula mentioned below.
A Y A ( r o r ' + ^ ) A ' A Y ' +0S A Y A T O A X '
i: =
A x ^ r A AY A X O A X +©6
\ /
where A Y is a coefficient matrix describing the relation between the latent dependent
variable (r\) and the observable variable, Y
A means ( I - B) ' ; B is a coefficient matrix describing the direct impact of
one latent dependent variable on the other latent dependent variable,
r is a coefficient matrix describing the direct impact of the latent independent
variable (^) on the latent dependent variable (r\).
O is a variance-covariance matrix describing the relations between two
different latent independent variables.
^ is a variance-covariance matrix describing the residual error (Q of stractural
equation modeling,
©e is a variance-covariance matrix describing the measurement error of the
observable variable, Y
A X is a coefficient matrix describing the relation between the latent
independent variable (t,) and the observable variable, X.

372
08 is a variance-covarisuice matrix describing the measurement error of the
observable variable, X.
Eight parametric matrices, according to the stractural equation modehng and
measurement model mentioned above, can be described as follows.
/ i
A X =
A.^ 21
0
0
0
0
0
0
\
A.^31
0
0
0
0
0
0
0
0
0
0
0
0
0
1
A-^52
^^62
0
0
0
0
0
0
0
0
0
. 0
0
0
0
1
A- 83
A 93
A 103
A^113
0
0
0
0
0
0
0
0
0
0
0
0
0
1
A 134
A 144
f^^\5^
\ / q x n = 15x4

373
where Ax is a coefficient matrix describing the relation between the latent
independent variable ( ) and the observable variable, X.
q means the number of the observable variable,
n means the number of the latent independent variable (t,).
r =
Til 712 yi3 yi4
721 722 723 724
731 732 733 734
741 742 743 744
751 752 753 754
761 762 763 764
771 772 773 774
\ / mx n = 7 x4
where F is a coefficient matrix describing the direct impact of the latent independent
variable (t,) on the latent dependent variable (T| ).
m means the number of the latent dependent variable (T] ).
n means the number of the latent independent variable ( ).
/ \
0 Oi2 Oi3 <Di4
0 =
O21 0 O23 O24
0^1 Ocio 0 o 34
041 O42 O43 0
\ / n x n = 4 x 4
where O is a variance-covariance matrix describmg the relations between two

374
different latent independent variables.
n means the number of the latent independent variable ( ).
/
SiiO 0 0 0 0 0 0 0 0 0 0 0 0 0
O 6 2 2 O 0 0 0 0 0 0 0 0 0 0 0 0
0 0 833 0 0 0 0 0 0 0 0 0 0 0 0
0 0 0 844 0 0 0 0 0 0 0 0 0 0 0
0 0 0 0 855 0 0 0 0 0 0 0 0 0 0
0 0 0 0 0 866 0 0 0 0 0 0 0 0 0
0 0 0 0 0 0 877 0 0 0 0 0 0 0 0
© 8 = 0 0 0 0 0 0 0 888 0 0 0 0 0 0 0
0 0 0 0 0 0 0 0 899 0 0 0 0 0 0
0 0 0 0 0 0 0 0 O81010O 0 0 0 0
0 0 0 0 0 0 0 0 0 O81111O 0 0 0
0 0 0 0 0 0 0 0 0 0 O81212O 0 0
0 0 0 0 0 0 0 0 0 0 0 O81313O 0
0 0 0 0 0 0 0 0 0 0 0 0 O81414O
0 0 0 0 0 0 0 0 0 0 0 0 0 0 8i5i5
\ y qx q= 15 X 15
where ©5 is a variance-covariance matrix describing the measurement error of the observable variable, X.
\

q means the number of the observable variable.
375
/
A Y =
1
^ 21
^ 31
0
0
0
0
0
0
0
0
0
0
0
0
0
0
0
0
0
1
^ 52
^ 62
0
0
0
0
0
0
0
0
0
0
0
0
0
0
0
0
0
1
^ 83
^ 93
^ 103
0
0
0
0
0
0
0
0
0
0
0
0
0
0
0
0
0
1
^ 124
0
0
0
0
0
0
0
0
0
0
0
0
0
0
0
0
0
1
^ 145
0
0
0
0
0
0
0
0
0
0
0
0
0
0
0
0
0
1
^ 166
0
0
0
0
0
0
0
0
0
0
0
0
0
0
0
0
0
1
\
\ /
p x m= 17 X 7

376
where A Y is a coefficient matrix describing the relation between the latent dependent
variable (ri) and the observable variable, Y
p means the number of the observable variable,
m means the number of the latent dependent variable (TI).
/
B =
0 Pl2 |3l3 Pl4 |3i5 Pl6 P \
17
P 21 0 P23 P24 P25 P26 P 27
P31 P32 0 P 34 P35 P36 P 37
P41 P42 P 43 0 P45 P46 P 47
P5I P52 P53
Pel P62 P63
P
P
54 0 P56 P 57
64 P65 0 p,
P71 P72 P 73 P74 P75 P 76
\
67
0 /
mx m = 7 X 7
where B is a coefficient matrix describing the direct impact of one latent dependent
variable on the other latent dependent variable (t]).
m means the number of the latent dependent variable.
/ \
^11 0 0 0 0 0 0
^ =
0 ^ 22 0 0 0 0 0
0 0 ^ 33 0 0 0 0
0 0 0 ^ 44 0 0 0
0 0 0 0 ^ 5 5 0 0
0 0 0 0
0 0 0 0
0
0
^ . . 0
0 ^ 77 m x m = 7 X 7 \ /

377
where ^ is a variance-covariance matrix describing the residual ertor ( C ) of
stractural equation modeling,
m means the number of the latent dependent variable.

378
/
£ 11 0 0 0 0 0 0 0 0 0 0 0 0 0 0 0 0 \
0£22 0 0 0 0 0 0 0 0 0 0 0 0 0 0 0
0 0 £ 33 0 0 0 0 0 0 0 0 0 0 0 0 0 0
0 0 0 s 44 0 0 0 0 0 0 0 0 0 0 0 0 0
0 0 0 0 s 55 0 0 0 0 0 0 0 0 0 0 0 0
0 0 0 0 0 s 66 0 0 0 0 0 0 0 0 0 0 0
0 0 0 0 0 0 s 77 0 0 0 0 0 0 0 0 0 0
0 0 0 0 0 0 0 s gg 0 0 0 0 0 0 0 0 0
0 0 0 0 0 0 0 0 s 99 0 0 0 0 0 0 0 0
0 0 0 0 0 0 0 0 OsioioO 0 0 0 0 0 0
0 0 0 0 0 0 0 0 0 OsiiiiO 0 0 0 0 0
0 0 0 0 0 0 0 0 0 0 O61212O 0 0 0 0
0 0 0 0 0 0 0 0 0 0 0 O s n n O 0 0 0
0 0 0 0 0 0 0 0 0 0 0 0 OS1414O 0 0
0 0 0 0 0 0 0 0 0 0 0 0 0 Osi.i.O 0
0 0 0 0 0 0 0 0 0 0 0 0 0 0 Os 1616 0
\
0 0 0 0 0 0 0 0 0 0 0 0 0 0 0 0 61
p X p = 17 X 17
717
/

379
where ©gis a variance-covariance matrix describing the measurement error of
the observable variable, Y.
p means the number of the observable variable.
In matrices of Ax and Ay mentioned above, there is one parameter to be fixed as 1
in each straight line with its purpose aiming at taking the reference indicator as the
unit of the latent variables. Generally, each latent variable must have one parameter
to be fixed as the reference indicator (Joreskog and Sorbom, 1993).
The computer programmes automaticaUy apply the eight parametric matrices
mentioned above to the following formula of S matrix for each iteration, and then
calculate the value of the fitting function.
F = l o g | | E | | + t r ( S 2 : - ' ) - l o g | | S | | - ( p - h q )
where tr means the sum of diagonal elements.
S means the variance-covariance matrix of the observable variables, X and Y.
P means the number of the observable variable, Y.
q means the number of the observable variable, X.
11 S 11 means the determinant of S.
E means the variance-covariance matrix for processing the estimation of
eight main parametric matrices (Ax, AY, F, B , ©E, ©5, O and ^ ) in the
LISREL model mentioned above.
In the above-mentioned formulas, S is a matrix of the observable variables X and Y
resulted from an actual inspection of the data. Following an increase of frequency of
iteration, the fitting function values for formulas mentioned above are increasingly
smaller, generally. When the difference of the two fitting function values is smaUer
than the convergent standard, the estimation draws a conclusion while the fitting
function acquired is the smallest one of the fitting function value, then foUowed by

380
the X' test according to the smallest fitting function value.
X ' = ( N - 1 ) X F
d f = l / 2 ( p - H q ) ( p - h q - h l ) - t
where N means the number of observable variables,
df means degree of freedom,
p means the number of the observable variable, Y
q means the number of the observable variable, X.
t means the number of parameters expected to be estimated in the
above-mentioned eight parametric matrices.
Null hypothesis is thus accepted if the test resuh finds unsignificant x' value, thus
indicating the theoretical model of LISREL (the figure shown in the end of this
Appendix) and data gained from an observation to be well fit (Joreskog and Sorbom,
1993).
C. The external quality of data in the LISREL model
Upon listing parameters to be calculated, this study further decides the type of data
matrix used for analysis. First, distinguish the input matrix from analytic matrix
while the former indicates the data matrixes read by the computer programmes and
the latter, the above-mentioned eight parametric matrixes reproduced by the computer
when conducting LIESEL analysis, i.e. the variance-covariance matrix of X and Y
variables resulted from data observation. The present study takes
variance-covariance matrix as the analytic matrix, and the correlation matrix is the
one used most frequent beside the variance-covariance matrix. If taking the
correlation matrix as the analytic matrix, however, incorrect x^ value or standard
error can be produced, particularly when there are restricted parameters to be

381
estimated in models (Joreskog and Sorbom, 1993). hi the process of obtaining the
correlation matrix or variance-covariance matrix to be working as the analytic matrix,
this study adopts listwise method to deal with the deficient data for an avoidance of
"not-positive-definite" issues generated by LISREL model.
The identification of LISREL model means that if there is the unique solution for
parameters in LISREL model. If there comes a non-solution or non-unique solution,
computer will not be able to reproduce the above-mentioned eight parametric matrices
that would automatically bring an end to the estimation (BoUen, 1989). There are
numerous discussions by scholars on regulations about if LISREL model being able to
make identification, and BoUen (1989) has suggested four methods conceming if
inspection models being able to identify.
1. Apply the LISREL programmes to deal with the issues concerning the identification
of LISREL model. In the process of estimating parameters, LISREL programmes
will automatically check models to see if they can identify. The computer will
automatically conclude the estimation and show the warnings whenever the models
can not make identification.
2. To adopt methods suggested by Joreskog and Sorbom (1993), first key in the
variance-covariance matrix of X and Y variables in normal process, then the
computer programmes will bring an output of the above-mentioned eight
parametric matrices and the estimation value of each parameter. Secondly, take
eight parametric matrices gained in the preceding step as the input of the
variance-covariance matrix of X and Y variables, and LISREL programmes will
bring out another parametric matrix and the estimation value of each parameter. If
the model is able to make identification, the two estimation values of each

382
parameter will be consistent. Should it be inconsistent, h indicates that the
identification of the model is problematic.
3. Run several times for the same programmes, and set estimation values in difi'erent
starting point each time. The model is capable of identifying if the estimation
values of each parameter are in close proximity; or on the other hand, it means the
identification of the model to be problematic.
4. Divide samples into several sub-samples randomly to see if these estimation
values of each parameter are close. There shall be no problem of identification if
the estimation values calculated of each parameter are in close proxinuty; or on
the other hand, it means the identification of the model to be problematic.
hi addhion to the four methods mentioned above. Hair et al. (1995) suggest that
LISREL models presented by researchers may violate regulations of identification if
four conditions listed below appear in the results of each parameter estimation: (1)
part of parameter estimations have greater standard error; (2) computer programmes
can not transform the data matrices; (3) unreasonable and impossible estimation
values appear, such as negative error variance; and (4) the correlation among the
parameters is too high (exceeding ±0.9).
In spite of solutions brought forwarded by numerous scholars to solve the problems of
identification, the present study suggests that researchers had better to re-hst
parameters desired to be estimated in detail, i.e. re-hst the path of cause and effect in
detail according to theoretic fundamental, whenever encountering the unidentified
problems.
While processing the estimation of parameter, the present study must write computer

383
programmes according to the developed theoretical model, path diagram of causation,
and identified assessment model. Upon the accomphshment of writing the computer
progranunes, enter the LISREL system under Window system.
The purpose of assessing the model fit hes m an assessment from each respect that if
theoretical models can explain those data gained from a practical observation, or tiie
scale of difference between theoretical models and data gained from the practical
observation (Bagozzi, 1980). The analysis of LISREL model adopts x ^ test to assess
the model fit, b u t ^ ' value varies with the change in the sample size (BoUen, 1989;
Hah et al., 1995). When the sample size is small, x ^ value is lUcely to be unmarked,
making researchers hastily produce a conclusion that the theoretical model and data
resulted from observation fit well. Besides, x ^ value easily becomes a significant
level whenever the sample size is big, thus enabling researchers to reach a conclusion
rashly that the theoretical model and data resulted from observation are nusfit. The
present study suggests that the assessment of the model fit from different aspects is
necessary, and showing a reasonable judgment by using various indicators is
important.
Regarding the assessment of model fit. Hair et al. (1995) think to have it assessed
from the preliminary fit criteria, overall model fit and fit of intemal stracture of model.
The present study recognizes it a good reference framework while the overaU model
fit is the extemal qualhy of model in assessing the fit level of the entire model and
observable data; the fit of intemal stracture of model is the intemal quality of model
in assessing the significance of estimating parameter of model and the rehabihty of
each indicator and latent variables. Literatures in the past frequently assessed the
model fit from the standard of the overaU model fit, rather than involving in the

384
quality assessment in the model (BoUen, 1989). hi addition to take the extemal
quality of model into consideration, however, the intemal quahty of model does not
tolerate to be overlooked.
According to Bagozzi (1980), there are several important basic criteria of model fit
hsted as below:
1. There shall be no negative error variance.
2. The error variance must reach a marked level.
3. The absolute value of correlation among the parameters shaU not to be in proximity
to 1.
4. The factor loading shaU not be too low (lower than 0.5) or too high (higher than
0.95).
5. The standard error shall not be too big.
While violating several of the above-mentioned criteria, it indicates that there may
have error listed in detail, problems of identification or erroneous input. Researchers
had better to re-inspect that if the model parameters listed in detail make sense, and
examine if the computer programmes to be in consistence with parameters listed in
detail (Bagozzi, 1980). If the estimation results of the model can meet the five
criteria, it can further examine the overaU model fit and the fit of intemal stracture of
model.
The overall fit criteria in assessing the model in the past took the significance of x ^
value as criteria, x ^ value, however, fluctuates according to the sample number, and
almost all models can be tumed down whenever the sample number is too big (Hair et
al., 1995). Therefore, statisticians have developed a series of indicators in assessing

385
the model fit in addition to take x ^ test. These indicators to assess the overall model
fit include: the coefficient of determination (TCD), x ^ value, goodness-of-fit index
(GFI), adjusted goodness-of-fit index (AGFI), root mean square residual (RMR),
standardized RMR, normed incremental fit index (NFI) and comparative fit index
(CFI) (BoUen, 1989).
Scholars still have inconsistent views that if each index will fluctuate according to the
sample number (Anderson and Gerbing, 1988). According to Anderson and Gerbing
(1988) and BoUen (1989), eight indices used frequentiy used to assess the overall
model fit are selected from the present study, and the numerical range and ideal
numerals are hsted in Table A4. 1.
Table A4. 1 The numerical range and ideal numerical value of the nine indices of
the overall model fit
Indicator
1. x^Value
2. GFI
3. AGFI
4. RMR
5. Standardized RMR
6. Ratio of X value
7. NFI
Numerical Range
Above 0
Between 0-1, but negative
value may appear
Between 0-1, but negative
value may appear
If the analytic matrix is
related matrix, it shall be
between 0-1;
if the analytic matrix is
variance-covariance matrix,
it shall be above 0.
-ditto-
Above 0
Between 0-1
Ideal Numerical Value
Not remarked
At least above 0.9
At least above 0.9
If the analytic matrix is
related matrix, it shall be
lower than 0.05, and the
value lower than 0.025 shall
be the best;
if the analytic matrix is
variance-covariance matrix,
SRMR value should be less
than 0.05.
-ditto-
Less than 3
At least above 0.9

386
8. CFI
9. TCD
Above 0, but most between
0-1
Above 0, but most between
0-1
At least above 0.9
At least above 0.9
GFI = 1- { [tr (E- S -1) '] / [tr (E-^S)' ]}
= (p + q) / [ ( p + q) + 2 x F ]
A G F I = l - [ ( p + q)x(p-Fq-Hl) / 2 df ] x (1-GFI)
where GFI means goodness-of-fit index.
AGFI means adjusted goodness-of-fit index..
p means the number of the observable variable, Y
q means the number of the observable variable, X.
F means the minimum value of fitting function.
S means the variance-covariance matrix of observable variables, X and Y.
E means the fitted or reproduced matrix.
tr means the sum of diagonal elements.
df means degree of freedom.
GFI and AGFI indices indicate the variance-covariance amount that can be explained
by the theoretical model while AGFI is just adjusted according to the degree of
freedom number. The maximum value for both two indices is 1, but the negative
value may appear.
RMR =
2 i : i : (S i j - a i j )
(p -I- q) X (p -h q -h 1)
where RMR means root mean square residual.
Sij means variance / covariance of observable variables.
Oij means variance / covariance of reproduced matrix.

387
RMR is the square root of average of fit residual variance/covariance, reflecting the
magnhude of residual. Therefore, the smaller the value, the better the model fit. If
the analytic matrix is a correlation matrix, RMR must be lower than 0.05, or a value
lower than 0.025 shall be the best. If taking the variance-covariance matrix as the
analytic matrix, the meaning of RMR value shall be difficuh for judgment (BoUen,
1989) while the value for the standardized RMR (SRMR) shaU be smaUer than 0.05
(Hair, et al, 1995).
T C D o f X ( o r Y ) = l - ( || 0 || / || E || )
where TCD means the coefficient of detemunation.
© is a variance-covariance matrix describing the measurement error of the
observable
variable, X or Y.
II © II means the determinant of ©.
S is a variance-covariance matrix describing the fitting function.
II E II means the determinant of S .
TCD of stractural equation modeling = 1 - ( | | ^ | | / | | C o v (T| ) || )
where TCD means the coefficient of determination.
^ is a variance-covariance matrix describing the residual error ( ^ ) of
stractural
equation modeling.
11 ^ II means the determinant of ^ .
Cov (ri) is a variance-covariance matrix of latent dependent variables.
II Cov (r|) II means the determinant of Cov (r|).
The TCD of X or Y variables (indicated in TCD (X) or TCD (Y)) represents a level
that how weU the latent independent variables f which takes X variables as well as
the latent dependent variables Tj which takes Y variables as an ideal observable

388
indicators. The TCD of stractural equation (indicated m TCD (E)) represents a level
that how well the latent dependent variables 77 in models be explained. Numerical
values of these three indices are between 0-1 while the greater value represents the
better level of model fit. On point necessarily to be noticed while explaining TCD
(E) is that not all TCD (E) values come from the antecedents (ordinary f ) of latent
dependent variables whenever there is correlation among the residual f of latent
dependent variables (Bagozzi, 1980). As the maximum value for all these three
indexes are 1, take value above 0.9 as the model fit criteria.
2
The ratio of X = , where df means degree of freedom. df
2 Ratio of X is one index used frequently, and what it represents is how big the
difference to be with the expectation value thanks to the expectation value of ; ^
exactly to be its degree of freedom (BoUen, 1989). How much the ratio will be still
indicates a lack of consensus for the overall model fit while some advocate 3 or 2
(BoUen, 1989). The present study takes a value less than 3 as the ideal value of
model fit which may be far more loose.
NFI = (Xb'-Xm') / X b ' 2 2
where ^b mccuis X of the base model. 2 2
Xm means X of the theoretical model.
CFI = (Xb'-Xm') / (Xb ' -d fm) 2 2
where Xb means X of the base model. 2 2
Xm means x of the theoretical model. dfm means the degree of freedom of the theoretical model.

389
NFI and CFI indices originate from a comparison of x^ value or degree of freedom of
the theoretical model with x value or degree of freedom of base model. As model
fit of the base model will be the worst one, consequently, these two indices reflect the
incremental fit of the theoretical model. Values of NFI and CFI are between 0-1,
and BoUen (1989) thinks that it indicates an excellent model fit if the index is at least
above 0.9.
D. The internal quality of data in the LISREL model
Model fit of intemal stracture of LISREL is the intemal quality of the model. Six
criteria suggested by Bagozzi (1980) are as foUows:
1. The individual factor reliability is above 0.5.
The individual factor reliability is R of X or Y variables, and the calculation
method is:
R ' (Xi) = 1- (0 i i / o i i )
where R (Xi) means individual item reliability of the observable variable, X,.
0 i i is the variance of the estimated error of the observable variable, Xi.
Oii is the variance of the observable variable, Xi.
2. The composite rehability (CR) of latent variables is above 0.6.
The calculation of CR for latent variables takes individual latent variable as
calculation unh, with hs value be equivalent to Cronbach's a coefficient of
observable indicator belonging to the latent variable. The calculation method is:
where p^j is the composite reliabihty of a certain latent dependent variable or latent

390
independent variable.
Xjj means standardized loading of a certain latent dependent variable or latent
independent variable.
O means the measurement error of the observable variable, X or Y
3. The average variance extracted of the latent variable is above 0.5.
The average variance extracted of the latent variable also takes the individual
latent variable as calculation unit, while the indication of value is made through
the observable indicator, and how much percent of the latent variable can be
measured (BoUen, 1989). The calculation method is as foUows:
Pvc(^i)=2:5iij' / ( s ^ j ' + E 0 )
where Py^ m) is the average variance extracted of a certain latent dependent
variable or latent independent variable.
A j means standardized loading of a certain latent dependent variable or
latent independent variable.
0 means the measurement error of the observable variable, X or Y.
4. All estimated parameters reach marked level.
5. The absolute value of standardized residuals must be smaller than 1.96.
6. The modification indices is smaller than 3.84.
h can leam from the output in the computer form that if all estimated parameters
reach significant level, h indicates that the intemal quahty of model is exceUent if
all estimated parameters reach significant level; or on the contrary, it indicates poor
intemal quality.
The standardized residual is a resuh of fit residual divided by the asymptotic standard

391
error while 1.96 is the critical value of z at the time a equals to 0.05. According to
Jdreskog and Sorbom (1993), h supposes that just have the absolute value of
standardized residuals to be less than 2.58 (i.e. the critical value of z at the time a
equals to 0.01).
The modification indices is a result aiming at the restricted parameters, with its
numerical value indicating that how much the x ^ of the model shall be reduced if
tuming one restricted parameter into free parameter (i.e. estimating the parameter).
The degrees of freedom of the model shall be reduced one due to tuming one
restricted parameter into free parameter while the critical value of x o.95(i)is 3.84.
Therefore, it not only indicates that the model fit will be improved significantly after
tuming the restricted parameter into the free parameter when the modification index is
more than 3.84, but also signifies there shall be error listed in detail for the model
(Bagozzi, 1980; Joreskog and SOrbom, 1993).

1
ri 0
'2
'i u i - <
< B d f)(»
£
J W C 00
HJ
o
§
agr,
^ ^ •*7l
OH
0) T3 O 6

393
Appendix 5 The definition of each dimension of all
multidimensional constructs
IDEN means identifying strategic human capital management practices.
DEVE means developing strategic human capital management practices.
PROT means protecting strategic human capital management practices.
DEPL means deploying strategic human capital management practices.
CONT represents the control factor of personnel control mechanisms.
COMM represents the communication-coordination factor of personnel control
mechanisms.
TCIE means the changes in environment facing the organization.
ESAOS means employee skill and orgaruzational stracture.
EM means employee motivation.
EP means employee productivity.
CC means customer complaint.
CS means customer satisfaction.
SRG means sales revenue growth.
NIBT means net income before tax.
GRROC means gross rate of retum on caphal.

394
Appendix 6: Null model, the direct model, the completely mediated model and the partially mediated model
The nested-model analysis of LISREL is employed in the present study to explore the
intervening effect of employee capabihty on the dimensions of strategic human
capital management practices, customer loyalty and financial performance of an
organization, hi the nested-model analysis, there are four models brought up while
model 1 is Null Model which highlights the model with a non-existence of the relation
paths between each dimension; model 2, the Direct Model which indicates the
existence of paths model with marked effects of strategic human capital management
practices on customer loyahy and on company's financial performance as weU as of
employee capability on customer loyalty as well as customer loyahy on company's
financial performance; model 3, the Completely Mediated Model, marks the existence
of paths model with the evident effects of strategic human capital management
practices on employee capability which in tum on customer loyalty, and consequently
on company's financial performance; and model 4, the Partially Mediated Model
which means the existence of paths model with marked effects of strategic human
capital management practices on employee capability, on customer loyalty and on
company financial performance as well as of employee capabihty on customer loyalty
and on company financial performance as well as of customer loyalty on company
financial performance. The paths models of the direct model, the completely
mediated model and the partially mediated model are portrayed as follows.

<" Ci S «> • a • " ^ o
"s 2 y t3 ^ .w o. n. 53 ^ S c 5 £ c S 6^ ^ K, u c s g « p « 2 S c C 6 2 2 =2 S rt 2 r3 —
• - •= i3 s« M Ki a . D ,
rt u C rt 6 3
S" a ?f 5b •? « 2 « S = •- " « rt <u
O H r-(3J3 00 " «J • -C .S °P OO 0)
— <U U O 4 3
S 5 O Q. ^ .a ^ cx -o j= c« ^ crt c« '*^
< ^ ^ § s D Ji 0) D S
6 e e E i 2 tn H J r 1
w > o 5 a Q m ftS w u " Q a, Q H
O

u O
T3
73
I o U
(U 73 O
(J
O
o c (U
- C c o c _o
'(Zl
c
73 Xi o <u
< ^ o c
'c u
73 (U 4—'
73 C
3 o
•4—»
o Z

u 73 O
73 1-!
73
(U 73 O
O
• 4 — * o c
c o c _o 'S c
x: o
c o
c y:3 <u
73
73
C 5C
rt
OH
cn
3 O >-iJ o Z

398
References
Abemethy, M.A. and Brownell, P. (1997), Management Control Systems in Research
and Development Organizations: The Role of Accounting, Behavior and Personnel
Controls, Accounting, Organizations and Society, 22, April / May, pp.233-248.
-, Chua, W. F., Luckett, P. F. and Selto, F. H. (1999), Research in
Managerial Accounting: Leaming from Others' Experiences, Accounting and Finance,
39, pp. 1-27.
Afifi, A. A. and Clark, V. (1996), Computer-Aided Multivariate Analysis, New York:
Chapman & Hall, Chapter 11.
Amir, E. and Lev, B. (1996), Value-Relevance of Nonfinancial Information: The
Wireless Communication Industry, Journal of Accounting and Economics, 22, pp.
3-30.
Amit, R. and Schoemaker, P. J. H. (1993), Strategic Assets and Organizational Rent,
Strategic Management Journal, 14, January, pp. 33-46.
Anderson, E. W., ForneU, C. and Lehmann, D. R. (1997), Customer Satisfaction,
Productivity, and Profitabihty: Differences between Goods and Services, Marketing
Science, 16, 2, pp. 129-145.
and Sulhvan, M. W. (1993), The Antecedents and Consequences of
Customer Satisfaction for Firms, Marketing Science, 12, pp. 125-143.

399
and Young, S. M. (1999), The Impact of Contextual and Process
Factors on the Evaluation of Activity-Based Costing Systems, Accounting,
Organization and Society, 24, pp.525-559.
Anderson, J. C. and Gerbing, D. W. (1988), Stractural Equation Modelling in Practice:
A Review and Recommended Two-Step Approach, Psychological Bulletin, 103, pp.
411-423.
Arnold, H. J. and Feldman, D. C. (1982), A Multivariate Analysis of the Determinants
of Turnover, Journal of Applied Psychology, 67, pp.350-360.
Arthur, J. B. (1994), Effects of Human Resource Systems on Manufacturing
Performance and Tumover, Academy of Management Journal, 37, pp.670-687.
Atkinson, A. A., Balakrishnan, R., Booth, P., Cote, J. M., Grout, T., Malmi, H.,
Uhana, R. E. and Wu, A. (1997), New Directions in Management Accounting
Research, Joumal of Management Accounting Research, 9, pp.79-108.
Bagozzi, R. P. (1980), Causal Models in Marketing, New York: Wiley, Chapter 1-3.
Baldwin, J. R., Hanel, P. and Sabourin, D. (2000), Determinants of Innovative Activity
in Canadian Manufacturing Firms: The Role of Intellectual Property Rights,
Working Paper, Statistics Canada, pp. 1-11.

400
Balkcom, J. E., Ittner, C. D. and Larcker, D. F. (1997), Strategic Performance
Measurement: Lessons Learned and Future Directions, Joumal of Strategic
Performance Measurement, April / May, pp. 22-32.
Banker, R. D., Konstans, C. and Mashrawala, R. (2000), A Contextual Study of Links
between Employee Satisfaction, Employee Tumover, Customer Satisfaction and
Financial Performance, Working Paper, The University of Dallas at Texas, Dallas,
TX, pp. 1-22.
-, Lee, S., Potter, G. and Srinivasan, D. (1996), Contextual Analysis of
Performance Impacts of Outcome-Based Incentive Compensation, Academy of
Management Journal, 39, August, pp.920-948.
, Potter, G. and Srinivasan, D. (2000), An Empirical Investigation of An
Incentive Plan That Includes Nonfinancial Performance Measures, The Accounting
Review, 75, January, pp.65-92.
Barker, R. T. and Camarata, M. R. (1998), The Role of Communication in Creating
and Maintaining A Leaming Organization: Preconditions, Indicators and DiscipUnes,
Joumal of Business Communication, 35, 4, pp. 443-467.
Barney, J. (1991), Firm Resources and Sustained Competitive Advantage, Joumal of
Management, 17, March, pp.99-120.
Bartel, A. P. (1994), Productivity Gains from the Implementation of Employee
Training Programs, Industrial Relation, 33, pp. 411-425.

401
Bass, B. M. and Avoho, B. J. (1993), Transformational Leadership: A Response to
Critiques. In Chemers, M. M. and Ayman, R. (Eds.), Leadership Theory and Research-
Perspectives and Directions, pp. 49-80, San Diego: Academic Press.
Batra, R. and Sinha, I. (2000), Consumer-Level Factors Moderating the Success of
Private Label Brands, Journal of Retailing, 76, 2, pp. 175-191.
Behn, B. K. and Riley, R. (1999), Using Nonfinancial Information to Predict
Financial Performance: The Case of the U.S. Airhne Industry, Journal of Accounting,
Auditing and Finance, 14, Winter, pp. 29-56.
Bentler, P. M. and Bonett, D. G. (1980), Significance Tests and Goodness of Fit in
The Analysis of Covariance Stractures, Psychological Bulletin, 88, pp. 588-606.
Belsley, D., Kuh, E. and Welsch, R. (1980), Regression Diagnostics: Identifying
Influential Data and Sources of CoUinearity, New York: Wiley, Chapter 1-3.
Birdi, K., Allan, C. and Warr, P. (1997), Correlates and Perceived Outcomes of Four
Types of Employee Development Activity, Joumal of Applied Psychology, 82, 6, pp.
845-857.
BoUen, K. A. (1989), Structural Equations with Latent Variables, New York: Wiley,
Chapter 2-5.

402
Bolton, R. N. and Lemon, K. N. (1999), A dynamic Model of Customers' Usage of
Services: Usage as an Antecedent and Consequence of Satisfaction, Joumal of
Marketing Research, 36, 2, pp. 171-186.
Borman, W. C. (1991), Job Behavior, Performance, and Effectiveness. In
Dunnette, M. D. & Hough, L. M. (Eds.), Handbook of Industrial and Organizational
Psychology (2"* Ed.), Vol. 2, pp. 271-326, Palo Alto, CA: Consulting Psychologists
Press.
Boracki, C. C. and Burke, M. J. (1999), An Examination of Service-Related
Antecedents to Retail Store Performance, Joumal of Organizational Behavior, 20, 6,
pp. 943-962.
Bryman, A. and Cramer, D. (1997), Quantitative Data Analysis with SPSS, London:
Routledge, Chapter 10-11.
Caruana, A., Pitt, L. and Berthon, P. (1999), Excellence-Market Orientation Link:
Some Consequences for Service Firms, Joumal of Business Research, 44, pp. 5-15.
Cheng, J. L. C, and McKinley W. (1983), Toward an hitegration of Organization
Research and Practice: A Contingency Study of Bureaucratic Control and
Performance in Scientific Settings, Administrative Science Quarierly, 29, pp.85-100.
Chiang, S. H. and Chiang, S. C. (1990), General Human Capital as a Shared
Investment under Asymmetric Information, Canadian Joumal of Economics, 23, pp.
175-188.

403
Coff, R. W. (1997), Human Assets and Management Dilemmas: Coping with Hazards
on the Road to Resource-Based Theory, Academy of Management Review, 22, April,
pp. 374-402.
Cotton, J. L. and Tuttle, J. M. (1986), Employee Tumover: A Meta-Analysis and
Review with Imphcations for Research, Academy of Management Review, 11, pp.
55-70.
Cutcher-Gershenfeld, J. (1991), The Impact on Economic Performance of a
Transformation in Industrial Relations, Industrial and labor Relations Review, AA, pp.
241-260.
De Hass, M. and Kleingeld, A. (1996), Muhilevel Design of Performance
Measurement Systems: Enhancing Strategic Dialogue throughout the Organization,
Management Accounting Research, 10, pp. 233-261.
Deming, W. E. (1989), Out of Crisis, Cambridge, MA: MIT press, pp.27-36.
DiUman, D. A. (2000), Mail and Telephone Surveys: The Total Design Method (2"*
Ed.), New York: John Wiley & Sons, Chapter 1-4.
Dixon, J. R., Nanni, A. J. and VoUman, T. E. (1990), The New Performance
Challenge: Measuring Manufacturing for World Class Competition, Homewood, IL:
Dow Jones-Irwin, pp.27-55.

404
Douglas T. J. and Judge, W. Q. (2001), Total Quality Management Implementation
and Competitive Advantage: The Role of Stractural Control and Exploration,
Academy of Management Journal, AA, pp. 158-169.
Eisenhardt, K.M. (1989), Making Fast Strategic Decisions in High Velocity
Environments, Academy of Management Joumal, 32, pp. 543-576.
Fomell, C. (1995), The Quality of Economic Output: Empirical Generahzations about
Its Distribution and Relationship to Market Share, Marketing Science, 14, pp.
203-211.
-, Johnson, M. D., Anderson, E., Cha, W. J. and Bryant, B. E. (1996), The
American Customer Satisfaction Index: Nature, Purpose, and Findings, Joumal of
Marketing, Vol. 60, pp. 7-18.
and Wemerfelt, B. (1987), Defensive Marketing Strategy by Customer
Complaint Management, Joumal of Marketing Research, 24, pp.337-346.
Foster, G. and Gupta, M. (1999), The Customer Profitability Implications of
Customer Satisfaction, Working Paper, Stanford University and Washington
University, St. Louis, MO, pp. 1-26.
Gerhart, B. and MiUcovich, G. T. (1992), Employee Compensation: Research and
Practice. In Dunnette, M. D. & Hough, L. M. (Eds.), Handbook of Industrial and
Organizational Psychology (2"** Ed.), Vol. 3, pp.481-569, Palo Alto, CA: Consulting
Psychologists Press.

405
Goodman, M. B. (1998), Corporate Communications for Executives, Albany, NY:
SUNY Press, Chapter 2-5.
Govindarajan, V. (1984), Appropriateness of Accounting Data in Performance
Evaluation: An Empirical Examination of Environmental Uncertainty as an
Intervening Variable, Accounting, Organizations and Society, 9, 2, pp. 125-135.
(1988), A Contingency Approach to Strategy Implementation at the
Business-Unit Level: Integrating Administrative Mechanism with Strategy,
Academy of Management Journal, 31, December, pp. 828-853.
Grahn, D. P. (1995), The Five Drivers of Total Quality, Quality Progress, 28, 1, pp.
65-70.
Grant, R. M. (1991), The Resource-Based Theory of Competitive Advantage:
Imphcations for Strategy Formulation, Califomia Management Review, 33, Spring,
pp.114-135.
Greene, W. (1997), Econometric Analysis, New York: Macmillan, Chapter 3-7.
Guzzo, R. A., Jette, R. D. and KatzeU, R. A. (1985), The Effect of PsychologicaUy
Based Intervention Programs in Worker Productivity: A Meta Analysis, Personnel
Psychology, 38, pp. 275-291.
Hair, J. F., Aderson, R. E., Tatham, R. L. and Black, W. C. (1995), Multivariate Data
Analysis (4 Ed.), New Jersey: Prentice HaU, Chapter 7-8.

406
Hall, R. (1993), A Framework Linking hitangible Resources and Capabihties to
Sustainable Competitive Advantage, Strategic Management Joumal, 14, 8, pp.
607-618.
Harthne, M. D. and FerreU, O. C. (1996), The Management of Customer-Contact
Service Employees: An Empirical Investigation, Joumal of Marketing, 60, 4, pp.
52-70.
Haspeslagh, P. (1982), PortfoUo Planning: Uses and Limits, Harvard Business Review,
January / February, pp. 58-73.
Heskett, J. L., Jones, T. O., Loveman, G. W., Sasser, W. E. and Schlesinger, L. A.
(1994), Putting the Service-Profit Chain to Work, Harvard Business Review, 72,
March / April, pp. 164-174.
HiU, C. W. L. and Hoskisson, R. E. (1987), Strategy and Stracture in Multiproduct
Firms, Academy of Management Review, 12, pp.331-341.
Hirsch, B. T. (1991), Labor Unions and the Economic Performance of Firms,
Kalamazoo, MI: W. E. Upjohn histitute for Employment Research, pp. 1-37.
Hirschey, M. and Wichern, D. W. (1984), Accounting and Market-Value Measures of
Profitabihty: Consistency, Determinants and Uses, Joumal of Business and Economic
Statistics, 2, pp.375-383.

407
Hirschman, A. O. (1970), Exit, Voice and Loyalty —Responses to Decline in Firms,
Organizations and States, Cambridge, MA: Harvard university press. Chapter 3.
Hitt, M. A., Bierman, L., Shimizu, K. and Kochhar, R. (2001), Dhect and Moderating
Effects of Human Capital on Strategy and Performance in Professional Service Fums:
A Resource-Based Perspective, Academy of Management Joumal, Vol. 44, No.l, pp.
13-28.
-, Hoskisson, R. E. and Ireland, R. D. (1990), Mergers and Acquisitions and
Managerial Commitment to Innovation in M-Form Firms, Strategic Management
Joumal, 11, Special issue, pp.29-47.
Holzer, H. J. (1987), Hiring Procedures in the Firm: Their Economic Determinants
and Outcomes, In Kleiner, M. M., Block, R. N., Roomkin, M. & Salsburg, S. W.
(Eds.), Human Resources and the Performance of the Firm, Washington, DC: BNA
Press, pp.21-37.
Hom, P. W., Caranikas-Walker, F., Prassia, G. E. and Griffeth, R. W. (1992), A
Meta-Analytical Structural Equations Analysis of a Model of Employee Tumover,
Joumal of Applied Psychology, 11, pp.890-909.
Hopwood, A. G. (1972), An Empirical Study of the Role of Accounting Data in
Performance Evaluation, Joumal of Accounting Research, Supplement, pp. 156-182.
(1974), Accounting and Human Behaviour, London: Haymarket
Pubhshing Company, Chapter 3-4.

408
Humphrys, P. and O'Brien, G. E. (1986), The Relationship between Skill Utihzation,
Professional Orientation and Job Satisfaction for Pharmacists, Joumal of Applied
Psychology, 59, pp.315-326.
Huriey, R. F. and Huh, G. T. M. (1998), Innovation, Market Orientation and
Organizational Leaming: An Integration and Empirical Examination, Journal of
Marketing, 62, 3, pp .42-54.
Husehd, M.A. (1995), The Impact of Human Resources Management Practices on
Tumover, Productivity and Corporate Financial Performance, Academy of
Management Journal, 38, pp. 635-672.
Ittner, C. D. and Larcker, D. (1996), Measuring the Impact of Quahty hiitiatives on
Firm Financial Performance. In Ghosh, S. and Fedor, D. (Eds.), Advances in the
Management of Organizational Quality, pp. 1-37, Greenwich, CT: JAI.
and (1998a), Are Nonfinancial Measures Leading Indicators
of Financial Performance? An Analysis of Customer Satisfaction, Joumal of
Accounting Research, 36, Supplement, pp. 1-35.
and (1998b), Innovations in Performance Measurement:
Trends and Research Imphcations, Joumal of Management Accounting Research, 6,
pp.205-238.
, and Rajan, M. (1997), The Choice of Performance
Measures in Annual Bonus Contracts, The Accounting Review, 72, April, pp.231-255.

409
Jaeger, A. M. and Baliga, B. R. (1985), Control Systems and Strategic Adaptation:
Lessons from the Japanese Experience, Strategic Management Joumal, 6, pp.
115-134.
Johnson, H.T. (1992), Relevance Regained: From Top-Down Control to Bottom-Up
Empowerment, New York: Free Press, Chapter 2-3.
Johnson, J. W. (1996), Linking Employee Perceptions of Service Chmate to Customer
Satisfaction, Personnel Psychology, 49, 4, pp.831-851.
Jones, T. O. and Sasser, W. E. (1995), Why Satisfied Customers Defect, Harvard
Business Review, November-December, pp.88-99.
Joreskog, K.G. and Sorbom, D. (1993), LISREL 8: Structural Equation Modeling with
the SIMPLIS Command Language, Hillsdale, NJ: Lawrence Erlbaum Associates,
Chapter 8-11.
Jung, K. G., Dalessio, A. and Johnson, S. M. (1986), Stabihty of the Factor Stracture
of the Job Descriptive Index, Academy of Management Joumal, 29, pp.609-616.
Kaplan, R. S. and Norton, D. P. (1992), The Balanced Seorecard — Measures that
Drive Performance, Harvard Business Review, January-Febraary, pp. 71-79.
and (1993), Putting the Balanced Seorecard to Work,
Harvard Business Review, September-October, pp. 134-147.

410
and (1996a), Using the Balanced Seorecard as a Strategic
Management System, Harvard Business Review, January-Febraary, pp. 75-85.
and (1996b), Linking the Balanced Seorecard to Strategy,
Califomia Management Review, Fall, pp.53-79.
and (1996c), The Balanced Seorecard: Translating Strategy
into Action, Boston, MA: Harvard Business School Press, Chaptersl- 6.
and (2001a), Transforming the Balanced Seorecard from
Performance Measurement to Strategic Management: Part I, Accounting Horizons, 15,
1, March, pp. 87-104.
and (2001b), Transforming the Balanced Seorecard from
Performance Measurement to Strategic Management: Part II, Accounting Horizons,
15, 2, June, pp. 147-160.
Katz, H. C, Kochan, T. A. and GobeiUe, K. R. (1983), Industrial Relations
Performance, Economic Performance and QWL Programs: An hiterplant Analysis,
Industrial and Labour Relations Review, 37, pp. 3-17.
and Weber, M. R. (1985), Assessing the Effects of
Industrial Relations Systems and Efforts to Improve the Quahty of Working Life on
Organizational Effectiveness, Academy of Management Joumal, 28, pp.509-526.

411
Kerr, S. (1975), On the Folly of Rewarding A While Hoping for B, Academy of
Management Joumal, 18, pp.769-782.
Kerr, J. L. (1985), Diversification Strategies and Managerial Rewards: An Empirical
Study, Academy of Management Journal, 28, pp. 155-179.
Klein, J. P. (1991), A Reexamination of Autonomy in Light of New Manufacturing
Practices, Human Relations, AA, pp. 21-38.
Koberg, C. S., Boss, R. W., Senjem, J. C. and Goodman, E. A. (1999), Antecedents
and Outcomes of Empowerment, Group & Organization Management, 24, 1, pp.
71-91.
LaBarbera, P. A. and Mazursky, D. (1983), A Longitudinal Assessment of Customer
Satisfaction / Dissatisfaction: The Dynamic Aspects of the Cognitive Process,
Joumal of Marketing Research, 20, pp.393-404.
Lahiri, K. and Schmidt, P. (1978), On the Estimation of Triangular Stractural Systems,
Econometrica, 46, pp. 1217-1221.
Lane, P. J. and LubaUcin, M. (1998), Relative Absorptive Capabihty and
Interorganizational Learning, Strategic Management Joumal, 19, pp. 461-477.
Lawler, E. E. and Jenkins, G. D. (1990), Sfategic Reward Systems. In Dunnette, M.
and Hough, L. (Eds.), Handbook of Industrial and Organizational Psychology,
pp. 1009-1055, Palo Alto, CA: Consulting Psychologists Press.

412
Lee, J. and MiUer, D. (1999), People Matter: Commitment to Employees, Strategy
and Performance in Korean Fums, Strategic Management Journal, 20, pp. 579-593.
Lewis, B. R. and Gabrielsen, G. D. S. (1998), Intra-Organizational Aspects of Service
Quahty Management: The Employee's Perspective, Service Industry Journal, 18, 2,
pp. 64-89.
Lippman, S. A. and Rumeh, R. P. (1982), Uncertain Imitabihty: An Analysis of
Interfirm Differences in Efficiency under Competition, The Bell Journal of
Economics, 13, pp. 418-438.
London, M. and Smither, J. W. (1995), Can Multi-Source Feedback Change
Perceptions of Goal Accomphshment, Self-Evaluations and Performance-Related
Outcomes? Theory-Based Apphcations and Directions for Research, Personnel
Psychology, 48, pp. 803-839.
Lynch, L. M. and Black, S. E. (1998), Determinants of Employee-Related Training,
Industrial & Labor Relations Review, October, pp. 45-59.
Mahna, M. A. and Seho, F. H. (2000), Communicating and Controlling Strategy: An
Empirical Study of the Effectiveness of the Balanced Seorecard, Working paper,
University of Colorado at Boulder and Univershy of Melboume at Victoria, pp. 1-29.
Merchant, K. A. (1989), Rewarding Results: Motivating Profit Center Managers,
Boston, MA: Harvard Business School Press, Chapter 4.

413
Mulaik, S. A., James, L. R., Alstine, J. V., Bennett, N., Lind, S. and StilweU, C. D.
(1989), Evaluation of Goodness of Fh hidices for Stractural Equation Models,
Psychological Bulletin, 105, pp. 430-450.
Nahapiet, J., and Ghoshal, S. (1998), Social Capital, hiteUectual Capital and the
Organizational Advantages, Academy of Management Review, 23, pp. 242-266.
Nayyar, P. R. (1993), Performance Effects of Information Asymmetry and Economies
of Scope in Diversified Service Fhms, Academy of Management Joumal, 36, pp.
28-57.
Nunnally, J. C. (1978), Psychometric Theory (2"' Ed.), New York: MacGraw-Hill,
Chapter 3-4.
Ohver, J. (1998), Invest in People and Improve Profitabihty and Productivity,
Management of Today, March, pp. 90-91.
Ohver, N. and Davies, A. (1990), Adopting Japanese-Style Manufacturing Methods:
A Tale of Two [UK] Factories, Joumal of Management Studies, 27, pp.555-570.
O'ReiUy, C. A., Caldwell, D. F. and Barnett, W. P. (1989), Work Group Demography,
Social Integration and Tumover, Administrative Science Quarierly, 34, pp. 21-37.
Osbom, R. N. and Hunt, J. G. (1975), An Adaptive-Reactive Theory of Leadership —
The Role of Macro Variables in Leadership Research, Organization and
Administrative Sciences, 6, 2-3, pp.1- 27.

414
Ouchi, W. G. (1977), The Relationship between Organizational Stracture and
Organizational Control, Administrative Science Quarierly, 20, pp. 95-113.
(1979), A Conceptual Framework for the Design of Organizational
Control Mechanisms, Administrative Science Quarierly, 24, pp. 833-848.
(1980), Markets, Bureaucracies and Clans, Administrative Science
Quarierly, 25, pp. 129-141.
Pfeffer, J. and Cohen, Y. (1984), Determinants of Intemal Labor Markets in
Organizations, Administrative Science Quarterly, 29, pp.550-572.
Pillai, R., Schriesheim, C. A. and Wilhams, E. S. (1999), Fairness Perceptions and
Trast as Mediators for Transformational and Transactional Leadership: A
Two-Sample Study, Joumal of Management, Vol. 25, No.6, pp.897-933.
Porter, M. E. (1985), Competitive Advantage, New York: Free Press, Chapter 4-5.
Pritchard, R. D., Jones, S. D., Roth, P. L., Stuebing, K. K. and Ekeberg, S. E. (1988),
Effects of Group Feedback, Goal Setting, and hicentives on Organizational
Productivity, Joumal of Applied Psychology, 73, pp. 337-358.
Reichheld, F. F. and Sasser, W. E. (1990), Zero Defections: Quahty Comes to
Services, Harvard Business Review, 68, pp. 105-111.

415
RusseU, J. S., Terborg, J. R. and Powers, M. L. (1985), Organizational Performance
and Organizational Level Training and Support, Personnel Psychology, 38,
pp.849-863.
Ryan, B., Scapens, R. W. and Theobald, M. (1992), Research Method and
Methodology in Financial and Accounting, London: Academic Press, Chapter 2.
Sama, L. M., Kopelman, R. E. and Manning, R. J. (1994), hi Search of a Ceihng
Effect on Work Motivation: Can Kaizen Keep Performance "Risin"?, Journal of
Social Behavior and Personality, 9, pp. 231-237.
Schein, E. H. (1985), Organizational Culture and Leadership, San Francisco:
Jossey-Bass, Chapter 4-5.
Seal, W.B. (1993), Accounting, Management Control and Business Organization,
Brookfield, Vermont: Ashgate Pubhshing Company, Chapter 6.
Sheridan, J. E. (1992), Organizational Culture and Employee Retention, Academy of
Management Joumal, 35, pp. 1036-1056.
Silk, S. (1998), Automating the Balanced Seorecard, Management Accounting, 79, 11,
pp.38-42.
Simon, H. A. (1976), Administrative Behavior: A Study of Decision-Making
Processes in Administrative Organization, New York: Free Press, Chapter 4.

416
SneU, S. A. (1992), Contt-ol Theory in Sti-ategic Human Resource Management: The
Mediating Effect of Administrative Information, Academy of Management Joumal.
35, June, pp. 292-327.
and Dean, J. W. (1992), Integrated Manufacturing and Human Resource
Management: A Human Capital Perspective, Academy of Management Joumal, 35,
August, pp. 467-504.
Spicer, B. H. and BaUew, V. (1983), Management Accounting Systems and the
Economics of hiternal Organization, Accounting, Organizations and Society, 8, 1, pp.
73-96.
Stivers, B. P., Covin, T., Hah, N. and Smalt, S. (1998), How Nonfinancial
Performance Measures Are Used, Strategic Finance, 79, February, pp.44- 49.
Szulanski, G. (1996), Exploring Intemal Stickiness: Impediments to the Transfer of
Best Practice within the Firm, Strategic Management Joumal, 17, pp.27-43.
Tannenbaum, A. S. (1968), The Social Psychology of Work Organization, Belmont,
CA: Brooks Cole, Chapter 3.
Teece, D. (1982), Towards an Economic Theory of the Multiproduct Firm, Joumal of
Economic Behavior and Organization, 3, pp. 38-63.
Terpstra, D. E. and RozeU, E. J. (1993), The Relationship of Staffing Practices to
Organizational Level Measures of Performance, Personnel Psychology, 46, pp.27-48.

417
Tichy, N. M., Fombum, C. J. and Devanna, M. A. (1982), Strategic Human Resource
Management, Sloan Management Review, Winter, pp. 47-61.
Tucker, M. L., Meyer, D. and Westerman, J. W. (1996), Organizational
Communication: Development of Intemal Strategic Competitive Advantage, Joumal
of Business Communication, 33, 1, pp.51-69.
Uhich, D. and Lake, D. (1990), Organizational Capability: Competing from the
Inside Out, New York: Wiley, Chapter 3.
Vroom, V. H. (1964), Work and Motivation, New York: Wiley, Chapter 5-6.
Wagner, J. A. (1994), Participation's Effects on Performance and Satisfaction: A
Reconsideration of Research Evidence, Academy of Management Review, 19, pp.
312-330.
Wah, L. (1998), An Ounce of Prevention, Management Review, 87, 9, pp.9.
Walton, R. A. (1985), From Control to Commitment in the Workplace, Harvard
Business Review, 63, 2, pp.77-84.
Wash, J. P. and Seward, J. K. (1990), On the Efficiency of hiternal and Extemal
Corporate Control Mechanisms, Academy of Management Review, 15, pp. 421-458.
Whitaker, A. (1999), What Causes IT Workers to Leave, Management Review, 88, 9,
p.8.

418
White, H. (1980), A Heteroskedasticity-Consistent Covariance Matrix Esthnator and a
Direct Test for Heteroskedasticity, Econometrica, 48, May, pp.817-838.
Widener, S. K. (2000), An Empirical Investigation of the Relation between the
Strategic Use of Human Capital, the Design of the Management Control System and
Performance, Colorado State University, pp. 1-32.
Wilhamson, O. (1975), Markets and Hierarchies, New York: Free Press, Chapter 3-4.
Yin, R. K. (1984), Case Study Research: Design and Methods, Beverly Hills, CA:
Sage Publications, Chapter 1-3.
Young, S. M. (1996), Research Methods in Accounting: Issues and Debates,
CGA, Canada Research Monograph, No. 25.
Zenger, T. and MarshaU, C. R. (1995), Group-Based Pay Plans: An Empirical Test of
the Relationships among Size, Incentive Intensity, and Performance, Academy of
Management Best Papers Proceedings, pp.161-165.