Embed Size (px)
Citation preview

Linking QoE and QoS on data services
Esa Vesterinen
Vice President
Omnitele
ITU Workshop on “Monitoring and Benchmarkingof QoS and QoE of Multimedia Services in
Mobile Networks”
(Dubai, UAE 2-3 November 2014)

©Omnitele Ltd. 2014 2
Content
• QoS – QoE framework for data services
• Case studies: • WWW browsing• Network performance vs YouTube experience• Optimisation

our company
PIONEERINGfounded in 1988 to design and rollout world’s first GSM network, 1000+ projects in 80+ countries since then
INDEPENDENTowned by Finnish telecom investors, independent of all operator groups and equipment vendors
CONSULTINGconsulting and professional services for telecom service providers and regulators
consulting for mobile industry since 1988

©Omnitele Ltd. 2014 4
Technology
Strategy
Design and
Optimisation
Audit and
Benchmark
Performance
Management
our services
maximised customer experienceminimised network cost

©Omnitele Ltd. 2014 5
QOE DEPENDS ON…
expectations
branding
socio-economic background
price
customer care
provisioning
end-user QoS
network
service
device
QoE
brand
price
QoS
expectations
session focus
what are QoS and QoE?

©Omnitele Ltd. 2014 6
QoE, QoS and network performance quantified
QUALITY OF EXPERIENCEhow well service quality meets expectations?
QUALITY OF SERVICEmeasured application/service KPIs
NETWORK PERFORMANCEcapacity, coverage, functionality, efficiency…
RSCP Ec/N0 latency jitter packet loss RSRP RLC throughput RSRQ
RAB setup success rate modulation coding TX power G-factor Channel C/I
Timing Advance Mobile TX Power Voice Codec Usage Handover Success Rate
MCS Usage Distribution Time Slot Utilization Block Error Ratio Active Set
Size SHO Success Rate ISHO Success Rate CQI E-DPDCH Throughput PDSCH
modulation MAC DL BLER MAC UL BLER MAC UL Retransmission Rate
call setup time call completion rate sms send time smscompletion rate file transfer time www page waiting time www
page success rate video buffering time video setup success rate

©Omnitele Ltd. 2014 7
“network is excellent…” “…customers not satisfied”
???
Common challenge: “How is the quality?”
need to find right targets for acceptable QoE!

©Omnitele Ltd. 2014 8
Let’s take a dive into WWW browsing Quality of Experience…
OPERATOR CASE: CEM FOR WWW BROWSING

©Omnitele Ltd. 2014 9
2. QoS targets: measure QoE & QoS and cross-correlate to define the relation
3. CTO Targets: Link QoS with NW performance to find right network performance KPI targets
1. QoE targets: define the desired WWW QoE level
OBJECTIVE | sufficient web browsing experience for high value customers

©Omnitele Ltd. 2014 10
QoE defined in MOS scale
Captured with end-user queries: “On 1-5 scale, what is your WWW browsing experience?”
MOS QoE Impairment
5 Excellent Imperceptible
4 Good Perceptible but not annoying
3 Fair Slightly Annoying
2 Poor Annoying
1 Bad Very Annoying
1. QOE TARGET | define the desired WWW QoE
SUFFICIENT QoE TARGET
90% of high value customers MOS ≥ 4

©Omnitele Ltd. 2014 11
unsatisfactory region(MOS < 4)
13.83
9.99
6.02
3.74
2.18
1
2
3
4
5
0 2 4 6 8 10 12 14 16 18 20
QoE [
MO
S]
QoS: WWW page waiting time [s]
Web Browsing QoS and QoE
MOS Average(s)
2. QOS TARGET | correlate QoS with QoE
QoS target: WWW download time < 3s

©Omnitele Ltd. 2014 12
accepted region(www download time < 3s)
unsatisfactory region(www download time > 3s)
0
2
4
6
8
10
0 1 2 3 4 5 6 7 8 9 10 11 12 13 14 15 16 17 18 19 20QoS:
WW
W p
age w
aitin
g t
ime [
s]
NW Performance: Bitrate [Mbit/s]
1000KB WWW Page Waiting Time vs. Bitrate
HSPA LTE
3. CTO TARGETS | find required NW performance
CTO TARGET
90% of subs get
>3.5 Mbit/s in 4G>4.5 Mbit/s in 3G

©Omnitele Ltd. 2014 13
RSCP Ec/N0 latency jitter packet loss RSRP RLC throughput RSRQ
RAB setup success rate modulation coding TX power G-factor Channel C/I
Timing Advance Mobile TX Power Voice Codec Usage Handover Success Rate
MCS Usage Distribution Time Slot Utilization Block Error Ratio Active Set
Size SHO Success Rate ISHO Success Rate CQI E-DPDCH Throughput PDSCH
modulation MAC DL BLER MAC UL BLER MAC UL Retransmission Rate
call setup time call completion rate sms send time smscompletion rate file transfer time www page waiting time www
page success rate video buffering time video setup success rate
2. QoS targets: measure QoE & QoS and cross-correlate to define the relation
3. CTO Targets: Link QoS with NW performance to find right network performance KPI targets
1. QoE targets: define the desired WWW QoE level
Case summary
MOS ≥ 4
WWW DL time< 3 s
NW performance>3.5 Mbit/s in 4G>4.5 Mbit/s in 3G

©Omnitele Ltd. 2014 14
competitive positioning of YouTube experience
OPERATOR CASE: CUSTOMER EXPERIENCE BENCHMARK

©Omnitele Ltd. 2014 15
4G smartphone benchmark in Netherlands
Vodafone higher bitrate,but KPN faster YouTube
0
10
20
30
40
T-Mobile Vodafone KPN
bitrate [Mbit/s]
big difference in NW performance…
0
0.5
1
1.5
2
T-Mobile Vodafone KPN
buffering time [s]
…thin margins in customer experience

©Omnitele Ltd. 2014 16
improving QoE for Kuwaiti operator
OPERATOR CASE: CUSTOMER EXPERIENCE OPTIMISATION

©Omnitele Ltd. 2014 17
objective: customer experience improvement
1. Measure end-user QoS of smartphone voice and data
2. Measure network performance
3. End-to-end troubleshooting & improvement recommendations

©Omnitele Ltd. 2014 18
customer centric optimisation area prioritisation
tickets coverage plots
churn
complaintsplanned sitespopulation
landmarks
number porters
©Omnitele Ltd. 2014 19
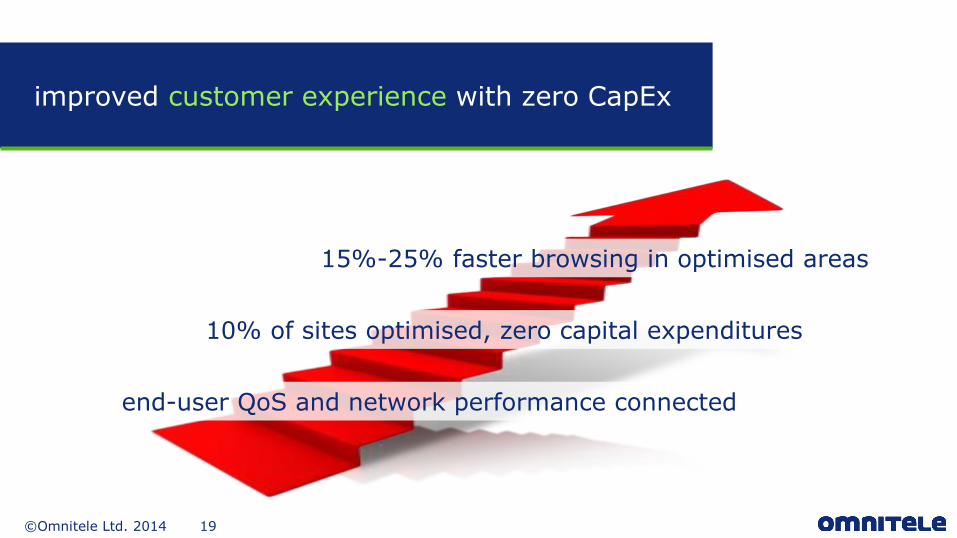
improved customer experience with zero CapEx
15%-25% faster browsing in optimised areas
end-user QoS and network performance connected
10% of sites optimised, zero capital expenditures

©Omnitele Ltd. 2014 20
recap & takeaway messages
common challenge: CTO team & CMO team targets often not fully aligned
linking network performance to customer experience challenging but not impossible
proper CEM framework results in maximised customer experience & minimised network cost
1
2
3

©Omnitele Ltd. 2014 21
w w w . o m n i t e l e . c o m