Embed Size (px)
Citation preview
Linking Planning and Budgeting Under UIC’s Modified Responsibility Centered Management
(RCM) Budget Model
Frank Goldberg Vice Provost for Resource Planning and Management
April 11, 2012
2012 BRINGING ADMINISTRATORS TOGETHER CONFERENCE

2012 BRINGING ADMINISTRATORS TOGETHER CONFERENCE
UIC 2010
Strategic Vision
And
Strategic Plan
Diversity Vision
& Emerging
Strategic Plan
IT Governance
Planning
Master
Plan
Capital
Planning
Research
Planning
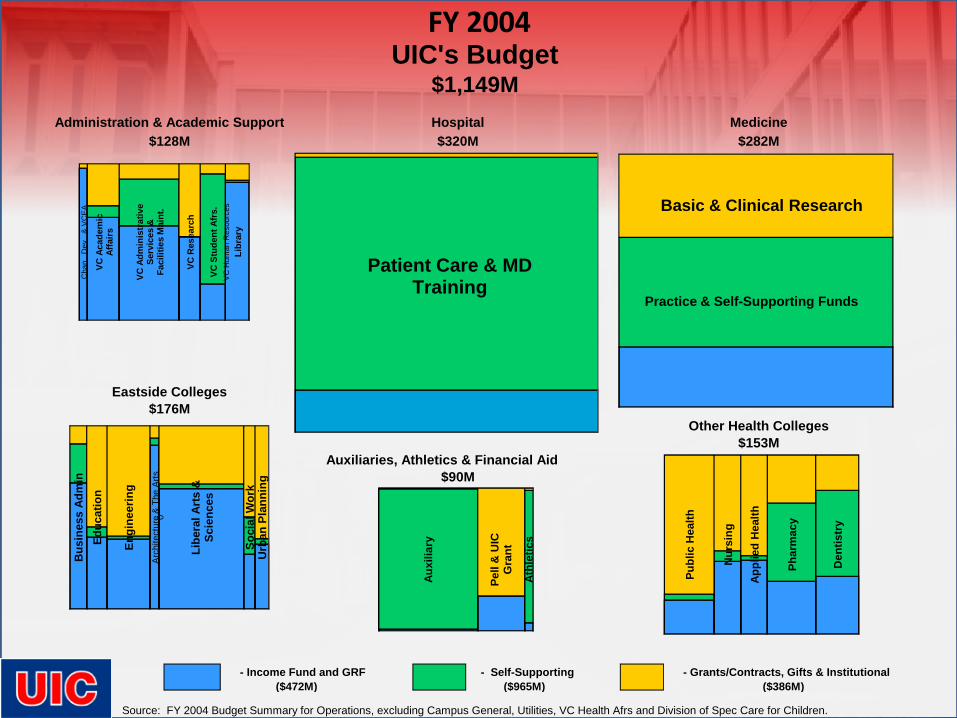
FY 2004
Administration & Academic Support Medicine$128M $282M
Eastside Colleges$176M
Other Health Colleges$153M
Auxiliaries, Athletics & Financial Aid
- Self-Supporting ($965M)
- Grants/Contracts, Gifts & Institutional ($386M)
$90M
$320MHospital
Source: FY 2004 Budget Summary for Operations, excluding Campus General, Utilities, VC Health Afrs and Division of Spec Care for Children.
- Income Fund and GRF ($472M)
UIC's Budget$1,149M
Patient Care & MD Training
Basic & Clinical Research
Practice & Self-Supporting Funds
Cha
n., D
ev.,
& V
CE
A
VC A
cade
mic
Af
fairs
VC A
dmin
istr
ativ
e Se
rvic
es &
Fa
cilit
ies
Mai
nt.
VC R
esea
rch
VC S
tude
nt A
frs.
VC
Hum
an R
esou
rces
Libr
ary
Bus
ines
s Ad
min
Educ
atio
n
Engi
neer
ing
Arc
hite
ctur
e &
The
Arts
0
Libe
ral A
rts
&
Scie
nces
Soci
al W
ork
Urb
an P
lann
ing
Auxi
liary
Pell
& U
IC
Gra
nt
Athl
etic
s
Publ
ic H
ealth
Nur
sing
Appl
ied
Hea
lth
Phar
mac
y
Den
tistr
y

4
FY 2005 College Earnings & Commitments (Shown as a percentage of the College’s total F&A earnings)
$0
$2
$4
$6
$8
$10
$12
$14
$16
$18
Earnings @ 36.5% Campus Commitments
36.5% 36.5%
53.9% 65.9%
55.8%
36.8% 55.6%
55.4%
116.2%
57.4%
70.8% N/A
46.0%
$ in Millions

ICR Distribution Timeline
Colleges 30% 36.5% 50% 47.5%
Provost 35% 28.5% 15% 12.5%
VCR 2.7% 2.7% 2.7% 7.7%
Others 32.3% 32.3% 32.3% 32.3%
FY 2004
FY 2005
FY 2006
FY 2011
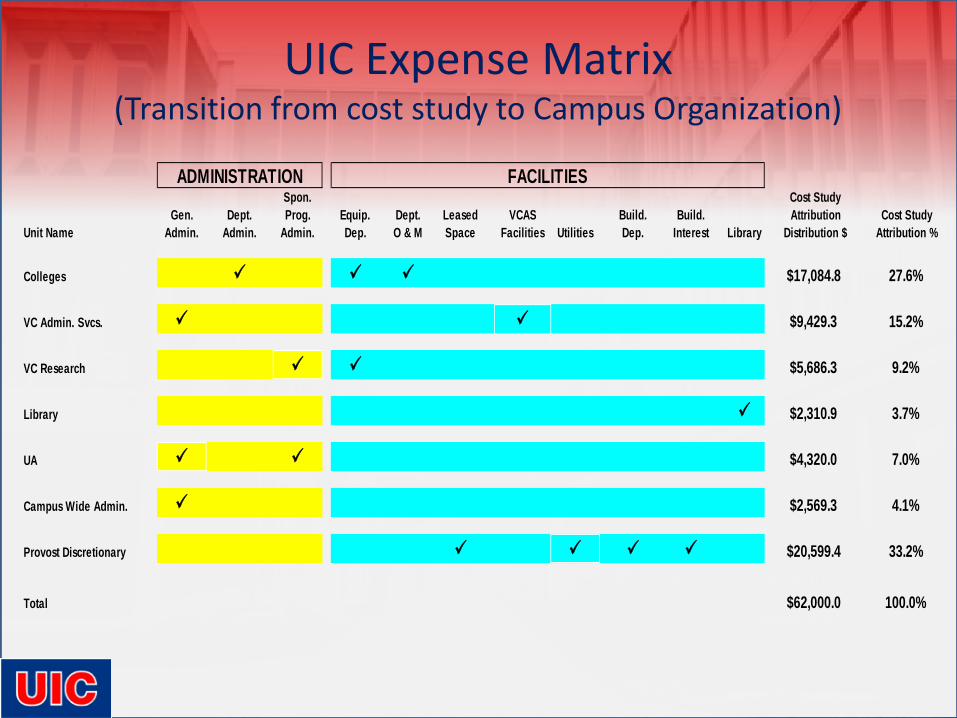
UIC Expense Matrix (Transition from cost study to Campus Organization)
Unit NameGen.
Admin.Dept.
Admin.
Spon. Prog.
Admin.Equip. Dep.
Dept. O & M
Leased Space
VCAS Facilities Utilities
Build. Dep.
Build. Interest Library
Cost Study Attribution
Distribution $Cost Study
Attribution %
Colleges $17,084.8 27.6%
VC Admin. Svcs. $9,429.3 15.2%
VC Research $5,686.3 9.2%
Library $2,310.9 3.7%
UA $4,320.0 7.0%
Campus Wide Admin. $2,569.3 4.1%
Provost Discretionary $20,599.4 33.2%
Total $62,000.0 100.0%
ADMINISTRATION FACILITIES

What’s next?
$ in Millions
Cost Study Attribution
Unit Name Amount% of Total
Colleges $17.1 27.6%
Provost Discretionary $20.6 33.2%
VCAS $9.4 15.2%
VCR $5.7 9.2%
Library $2.3 3.7%
Campus Wide Admin. $2.6 4.1%
UA $4.3 7.0%
Total $62.0 100.0%
@ 50.0%
Share% of Total
$33.1 53.4%
$10.0 16.2%
$6.6 10.7%
$3.6 5.8%
$1.8 2.9%
$2.5 4.1%
$4.3 7.0%
% $62.0 100.0%
Existing FY 06 Commitments & a Percent Share
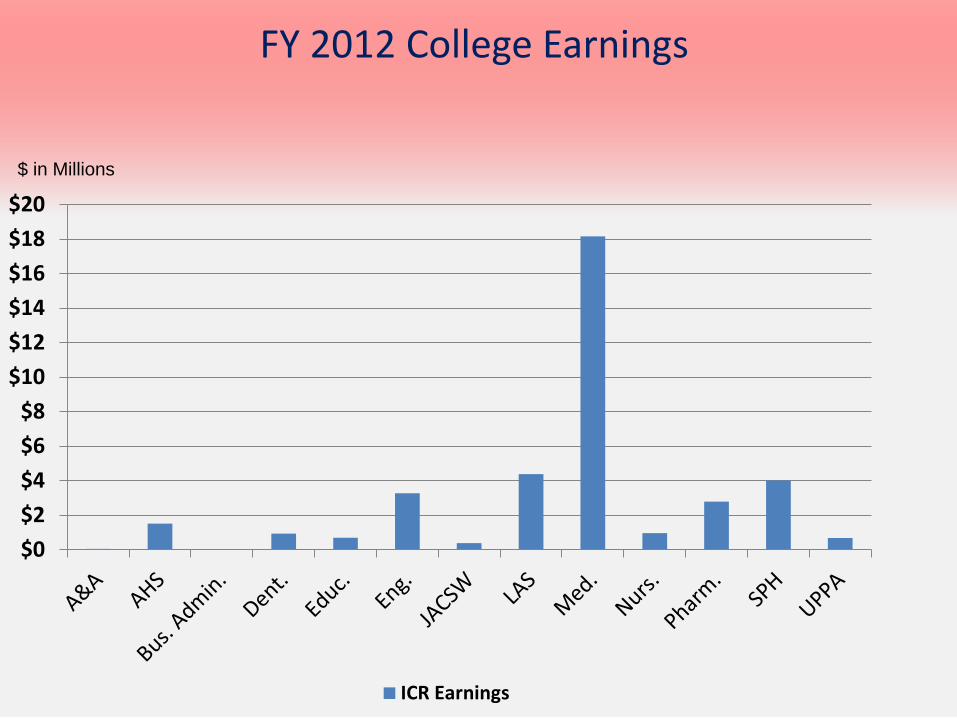
FY 2012 College Earnings
$ in Millions
$0$2$4$6$8
$10$12$14$16$18$20
ICR Earnings

FY 2006 Comparison of State Appropriations and Tuition Revenue
0%
25%
50%
75%
100%
125%
Pharmacy Nursing Dentistry App Hlth Medicine Pub Hlth
Tuition State Appr

Methodology – Attribute Tuition Base Differential
Undergraduate 3 year average, student credit hr & headcount, weighted 80/20
actual net revenue - 1 year
Graduate actual net revenue - 1 year actual net revenue - 1 yearProfessional
"Campus Tax" Base DifferentialUndergraduate 25% 25%Graduate 25% 15%Professional
actual net revenue - 1 year
15%

FY 2011 Comparison of State Appropriations and Tuition Revenue
General Campus Health Science Colleges
0%
25%
50%
75%
100%
CBA LAS A&A JACSW ENG EDUC CUPPA0%
25%
50%
75%
100%
PHARM DENT CAHS NURS MED SPH
Tuition State Approp
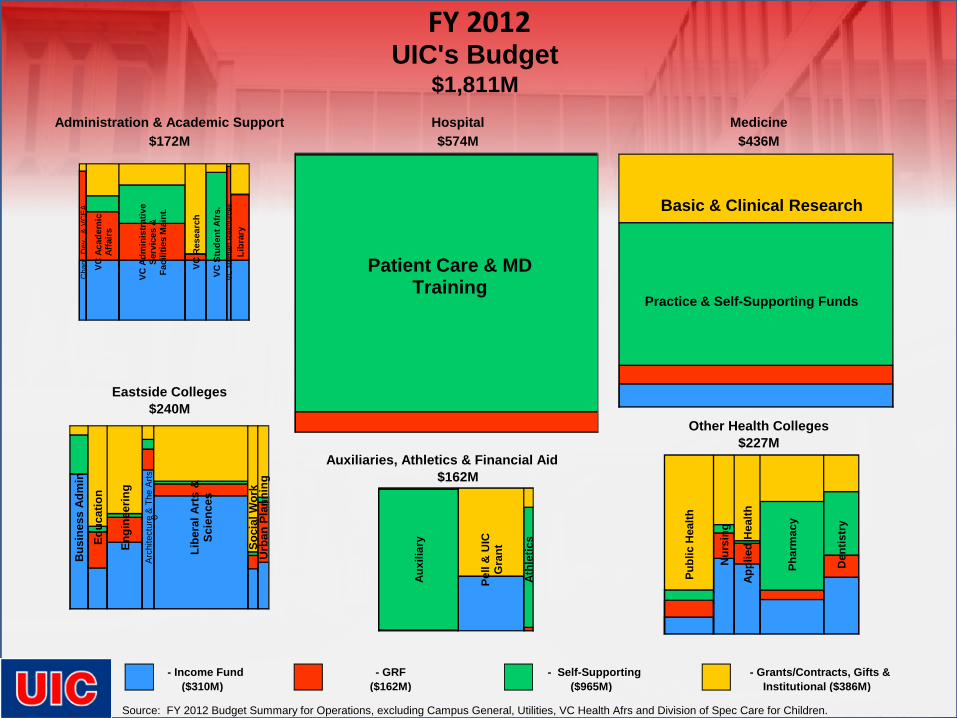
FY 2012
Administration & Academic Support Medicine$172M $436M
Eastside Colleges$240M
Other Health Colleges$227M
Auxiliaries, Athletics & Financial Aid$162M
$574MHospital
- Grants/Contracts, Gifts & Institutional ($386M)
Source: FY 2012 Budget Summary for Operations, excluding Campus General, Utilities, VC Health Afrs and Division of Spec Care for Children.
- Self-Supporting ($965M)
- GRF ($162M)
- Income Fund ($310M)
UIC's Budget$1,811M
Patient Care & MD Training
Basic & Clinical Research
Practice & Self-Supporting Funds
Cha
n., D
ev.,
& V
CE
A
VC A
cade
mic
Af
fairs
VC A
dmin
istr
ativ
e Se
rvic
es &
Fa
cilit
ies
Mai
nt.
VC R
esea
rch
VC S
tude
nt A
frs.
VC
Hum
an R
esou
rces
Libr
ary
Bus
ines
s Ad
min
Educ
atio
n
Engi
neer
ing
Arc
hite
ctur
e &
The
Arts
0
Libe
ral A
rts
&
Scie
nces
Soci
al W
ork
Urb
an P
lann
ing
Auxi
liary
Pell
& U
IC
Gra
nt
Athl
etic
s
Publ
ic H
ealth
Nur
sing
Appl
ied
Hea
lth
Phar
mac
y
Den
tistr
y
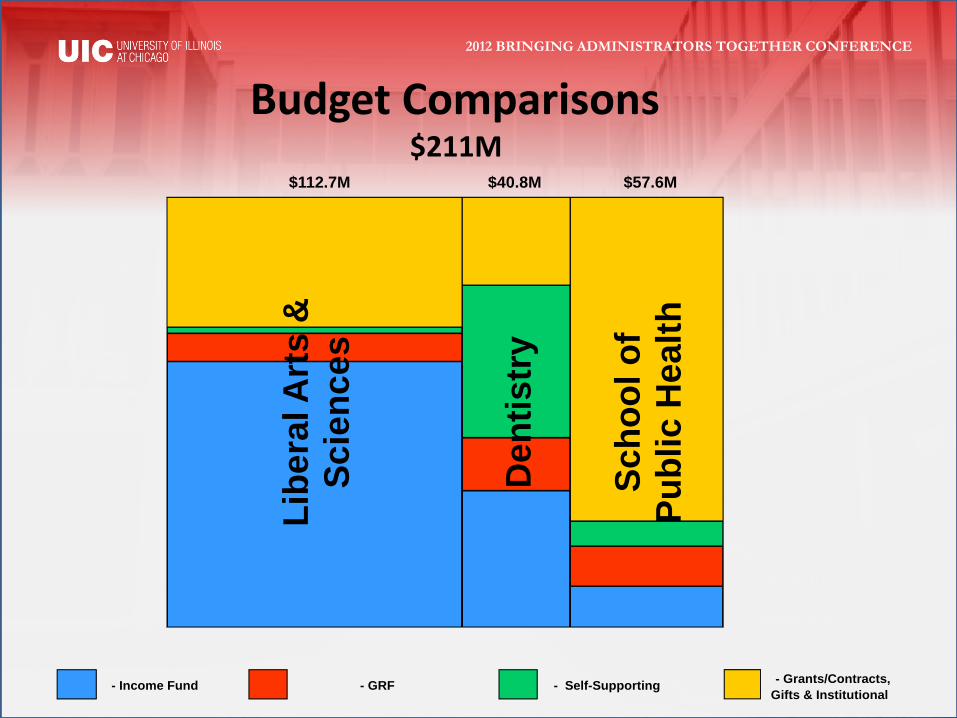
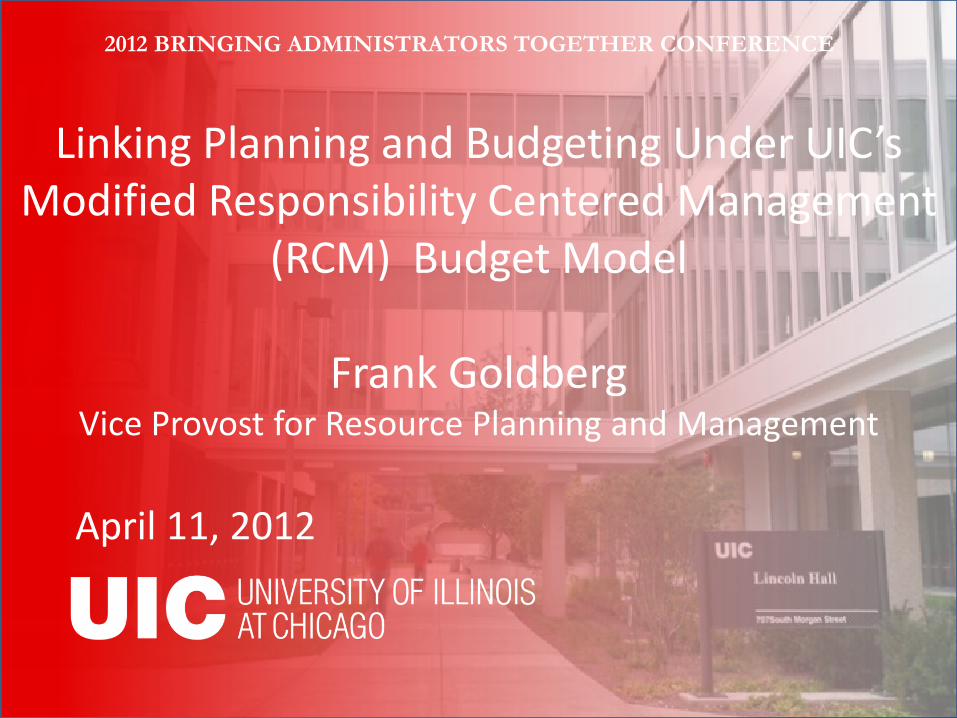
Budget Comparisons $211M
2012 BRINGING ADMINISTRATORS TOGETHER CONFERENCE
$112.7M $40.8M $57.6M
- Grants/Contracts, Gifts & Institutional
- Self-Supporting - GRF - Income Fund
Libe
ral A
rts
&
Scie
nces
Den
tistr
y
Scho
ol o
f Pu
blic
Hea
lth

Other centrally-budgeted costs $30.9M Other centrally-budgeted costs $68.3M Utilities $24.7M
Utilities $46.4M
Financial Aid $20.8M
Academic Support & Admin Units $185.4M
Academic Support & Admin Units $177.0M
Colleges (incl Grad & Honors) $257.4M
Colleges (incl Grad, Honors, & SCS)
$326.0M
University of Illinois at Chicago Unrestricted Funds - by Use
FY 2002 FY 2011
$498.4M $639.0M
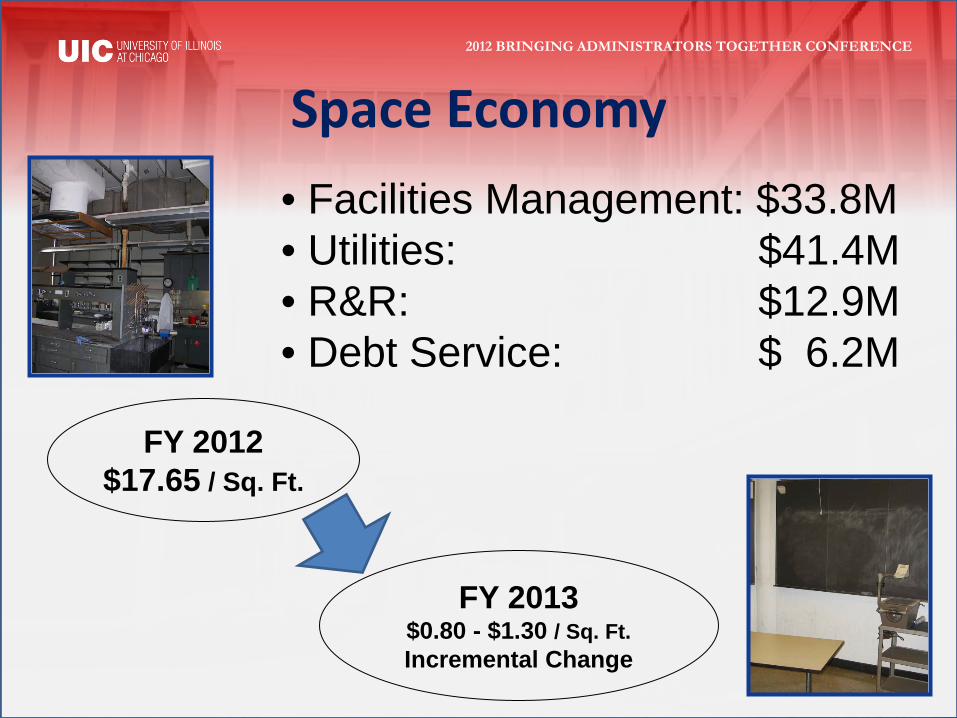
Space Economy 2012 BRINGING ADMINISTRATORS TOGETHER CONFERENCE
• Facilities Management: $33.8M • Utilities: $41.4M • R&R: $12.9M • Debt Service: $ 6.2M
FY 2012 $17.65 / Sq. Ft.
FY 2013 $0.80 - $1.30 / Sq. Ft. Incremental Change

Budget Decision Principles: •Ensure fiscal integrity – decentralized responsibility and decentralized accountability •Ensure good decision making – assign decision making authority to appropriate entity •Maximize use of resources – include financial, physical and human resources •Balance priorities – balance support for instructional, research, patient care, economic development and service missions of the Campus •Maintain quality – reduce and redirect budgets in a manner that best preserves quality

UIC Budget Model
Budget Units
Tuition Distribution
Salary Program (Admin)
Strategic Initiatives
Hold Harmless
Space Economy
Space Costs
UIC Budget Model
GRF
Tuition Revenue Reallocation
State Budget Reductions UA Central Costs

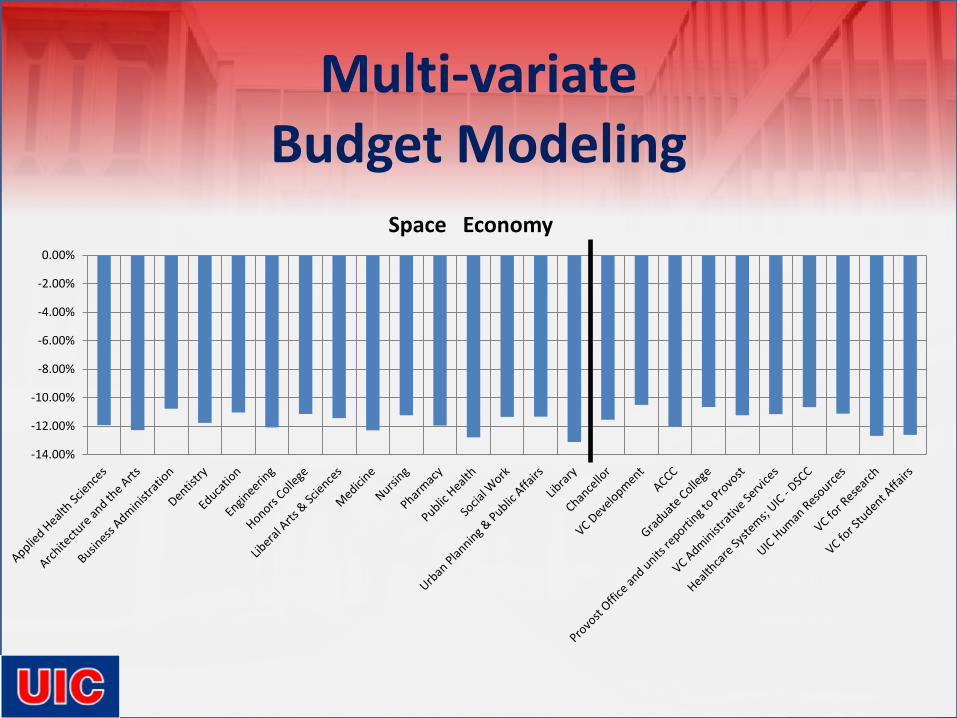
Multi-variate Budget Modeling
-12.00%
-10.00%
-8.00%
-6.00%
-4.00%
-2.00%
0.00%
Campus Reallocation
Multi-variate Budget Modeling
-14.00%
-12.00%
-10.00%
-8.00%
-6.00%
-4.00%
-2.00%
0.00%
Space Economy

Multi-variate Budget Modeling
-18.00%
-16.00%
-14.00%
-12.00%
-10.00%
-8.00%
-6.00%
-4.00%
-2.00%
0.00%
Tuition Revenue
Multi-variate Budget Modeling
-18.00%
-16.00%
-14.00%
-12.00%
-10.00%
-8.00%
-6.00%
-4.00%
-2.00%
0.00%
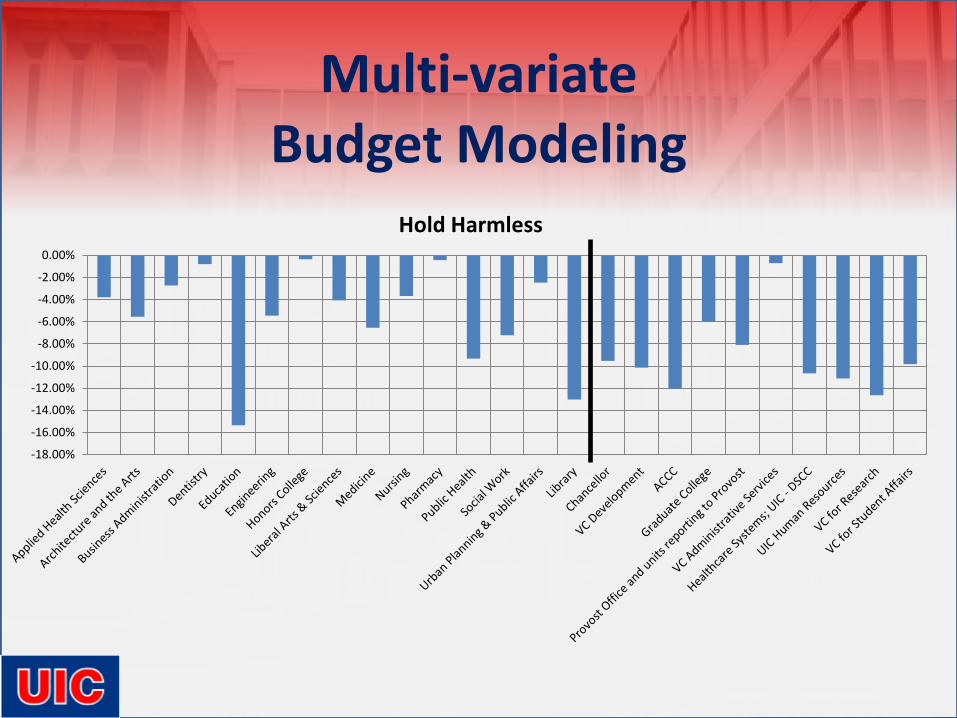
Hold Harmless

Multi-variate Budget Modeling
-18.00%
-16.00%
-14.00%
-12.00%
-10.00%
-8.00%
-6.00%
-4.00%
-2.00%
0.00%
Salary Program
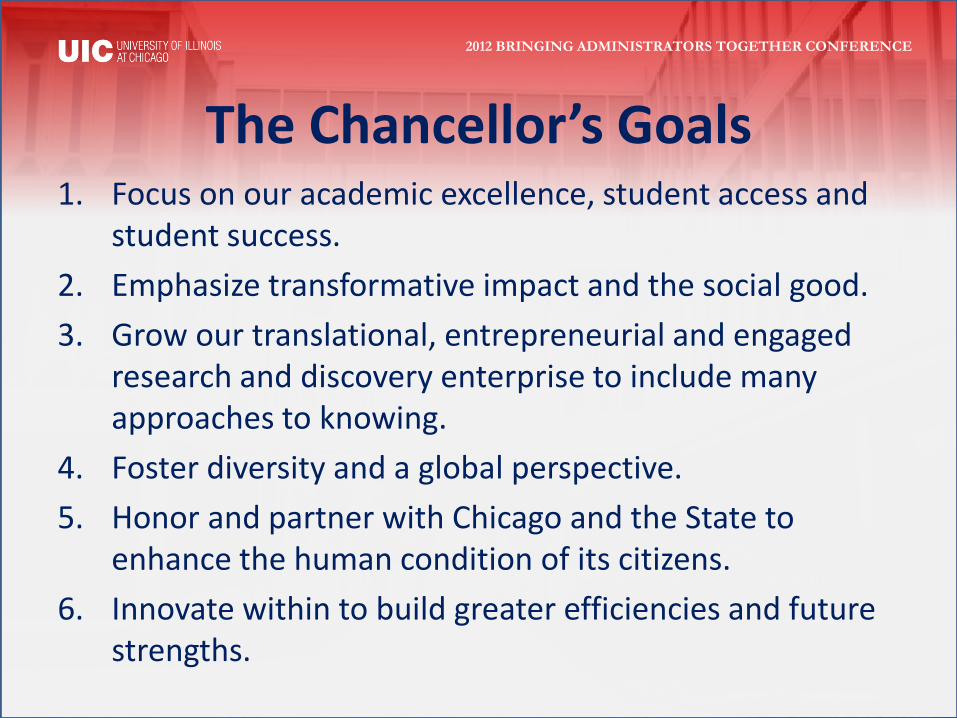
The Chancellor’s Goals 1. Focus on our academic excellence, student access and
student success. 2. Emphasize transformative impact and the social good. 3. Grow our translational, entrepreneurial and engaged
research and discovery enterprise to include many approaches to knowing.
4. Foster diversity and a global perspective. 5. Honor and partner with Chicago and the State to
enhance the human condition of its citizens. 6. Innovate within to build greater efficiencies and future
strengths.
2012 BRINGING ADMINISTRATORS TOGETHER CONFERENCE
24
Questions?
2012 BRINGING ADMINISTRATORS TOGETHER CONFERENCE