Embed Size (px)
Citation preview

Linking ETS in China and Japan: An economic assessment based on
CASE II model
2014.10.15 Bangkok Fei TENG
Institute of Energy, Environment and Economy, Tsinghua University
1

Outline
• CASE II model • Sector selection • Data • Results • Linkage • Conclusion
2

Review of CASE II • Purpose
– comparing the performance of the two alternatives—free allocation and border adjustment—to limit carbon leakage and mitigate production loss during the third period of EU ETS
• Characteristic – represent industries at a disaggregated level – quantitatively analyze the impact of different “anti-leakage” options on
the activity of the different industries • Static and partial equilibrium model, covering four sectors
– Cement, Aluminums, Steel and Electricity (changeable) – two regions: EU27 and the rest of world (changeable)
• Four sectors are linked through the 𝐶𝐶2market, 𝐶𝐶2 price clears the market.
• Two regions are linked through international trade
3

Principle
4

𝐶𝐶2 price clear the market
𝑃∗
MAC Curve for different sectors
Unitary Abatement
𝐶𝐶2 Price
In 𝐶𝐶2 market, when equilibrium the supply equals the demand. And given the 𝐶𝐶2 price 𝑃∗, the emission reductions are 𝑥𝑎, 𝑥𝑏, 𝑥𝑐, 𝑥𝑑;
𝑥𝑎 𝑥𝑏 𝑥𝑐 𝑥𝑑
Sector’ s production cost (marginal cost)
Maximum the profit function to obtain the supply curve
𝐶𝐶2 supply and demand curve
𝐶𝐶2 price (equilibrium)
5

Consumption: Two-tier utility function
Maximizing (2)
6

Supply: Standard Cournot Oligopoly Maximizing
Firm number
• 10 equations and 10 unknown variables for each region and sector • 4 demand equation & 4 first order condition & 2 free entry condition
7
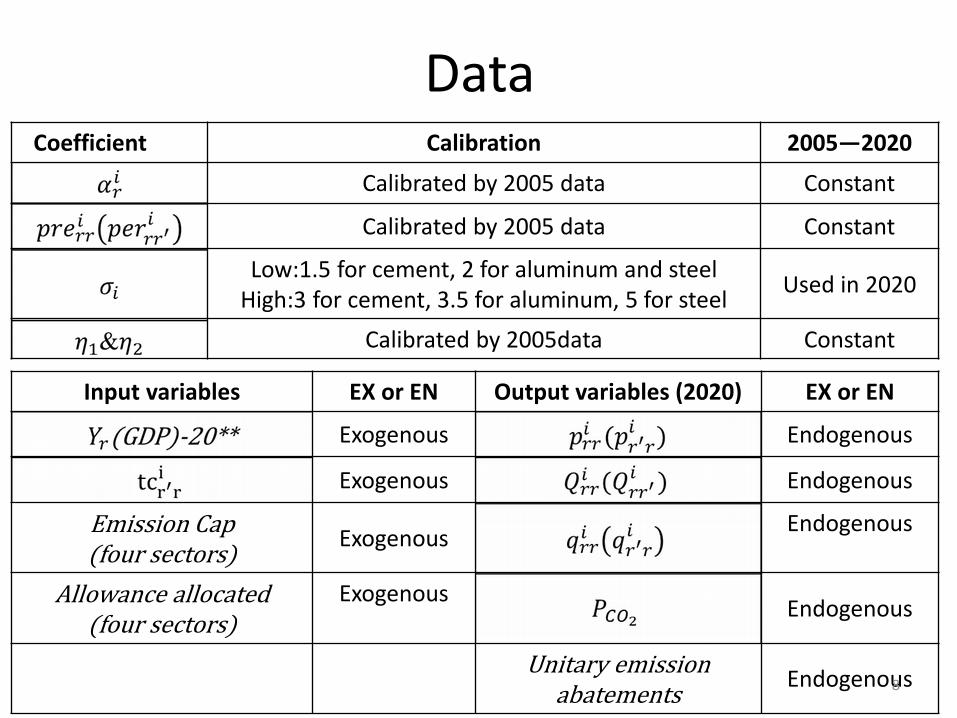
Data =Coefficient Calibration 2005—2020
Calibrated by 2005 data Constant
Calibrated by 2005 data Constant
Low:1.5 for cement, 2 for aluminum and steel High:3 for cement, 3.5 for aluminum, 5 for steel Used in 2020
Calibrated by 2005data Constant
Input variables EX or EN Output variables (2020) EX or EN
Exogenous Endogenous
Exogenous Endogenous
Emission Cap (four sectors) Exogenous Endogenous
Allowance allocated (four sectors)
Exogenous Endogenous
Unitary emission abatements Endogenous 8

Sector coverage
• Define three indicators to evaluate the influence of ETS in industries
• The three indicators are based on the following variables of industry – Direct & indirect emissions – Embodied emission intensive (including and without
imports) – Imports & exports and domestic production amount
9

Methodology • Carbon Cost per Unit of Industrial Value Added
• Trade intensity
• Price incremental ratio
10
where represents the CO2 price, and direct and indirect CO2 emissions from
industry i, and the added value of industry i.
In China, the electricity price is subject to the control of the Government, rather than the
market. Therefore, only considers the intensity of direct CO2 emissions in industry i, and
represents Leontief reverse matrix.

Data source and parameters
• Data source: National Bureau of Statistics of China – 2007 China energy balance table – 2007 China input-output table – Fuel emission factors – Sector splitting
• Parameters – Carbon price: 50 yuan (S1) & 100 yuan (S2)/ton 𝐶𝐶2 – Emission per KWh generation: 0.85Kg-𝐶𝐶2/KWh
11

Carbon Cost per Value Added • Cost rising significant in
Energy/emission intensive sectors
• Given a baseline of a 2% increase in MVAS, the accumulated industrial value added in relation to GDP approaches 15.8%
12
Figure 1 Impact of CO2 price at RMB 50 yuan/ton industrial MVAS in China (industries with MVAS at 2% or above marked only)
Electricity generation
Chemistry
Ferrous metal smelting
150 yuan/CO2 GDP share
China1 16.3%
Germany2 1-2%
Japan2 1.5%
1: MVAS above 5% 2: MVAS above 5%
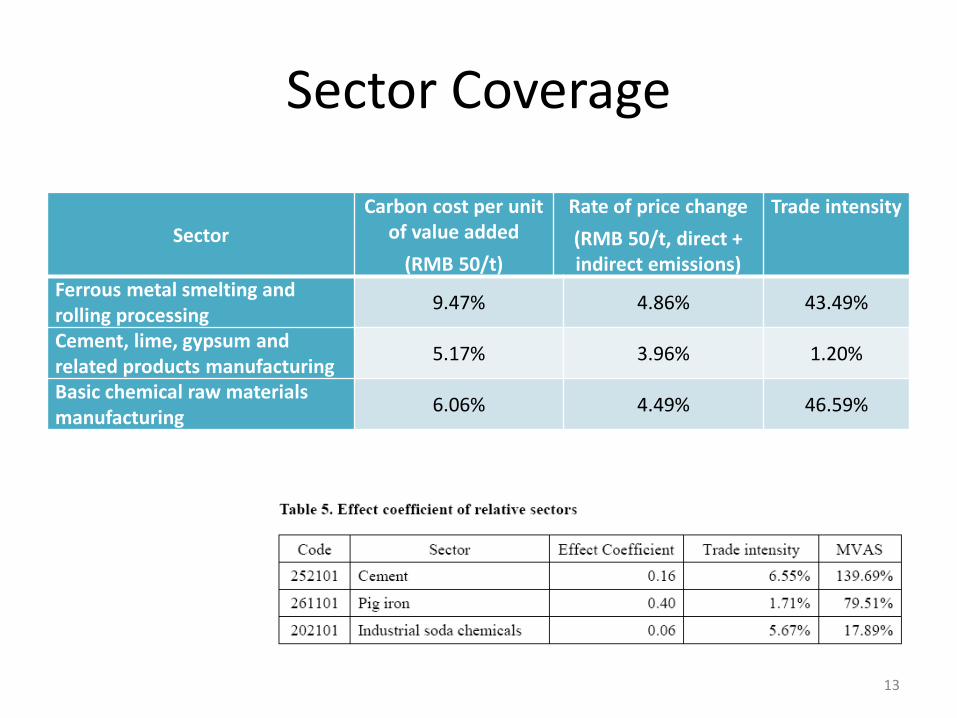
Sector Coverage
13
Sector Carbon cost per unit
of value added (RMB 50/t)
Rate of price change (RMB 50/t, direct + indirect emissions)
Trade intensity
Ferrous metal smelting and rolling processing 9.47% 4.86% 43.49%
Cement, lime, gypsum and related products manufacturing 5.17% 3.96% 1.20%
Basic chemical raw materials manufacturing 6.06% 4.49% 46.59%

Scenarios: Allocation & Border Adjustment BAU No climate policy, established on the base of growing GDA and changing technical coefficients Grandfathering Auction AUCTION: 100% auction without border adjustment 100% auction with border adjustment in every sector
– FULL BA: both exports and imports, both direct and indirect emission. Export adjustment is refer to China average specific emission for direct and average specific electricity consumption for indirect. Import adjustment is refer to the rest of world level.
– Chn_AV_BA: same as FULL BA except that import adjustment is refer to China level
– IMPORT_DIRECT_BA: only consider import and direct emission, others the same as FULL BA
– Chn_IMPORT_DIRECT: only consider import and direct emission, import adjustment is refer to China level
Output-based OB_full: free allocation base on output in every sector

Calibration and Simulation • To facilitate follow-up study in the integration of Chinese and
Japanese carbon markets, the time dimension and parameters in the CASE II model are set similar between two countries. Through parameter calibration based on the 2005 statistics, the consumer preference coefficient and unit transportation cost can be obtained, and assumed to be constant in the study interval (2020).
• To accomplish the target of a carbon intensity reduction by 40%-45%, compared with literature, the total CO2 emissions must fall by 27% over the BAU scenario in the power, cement, steel and basic chemical raw materials manufacturing sectors.
15

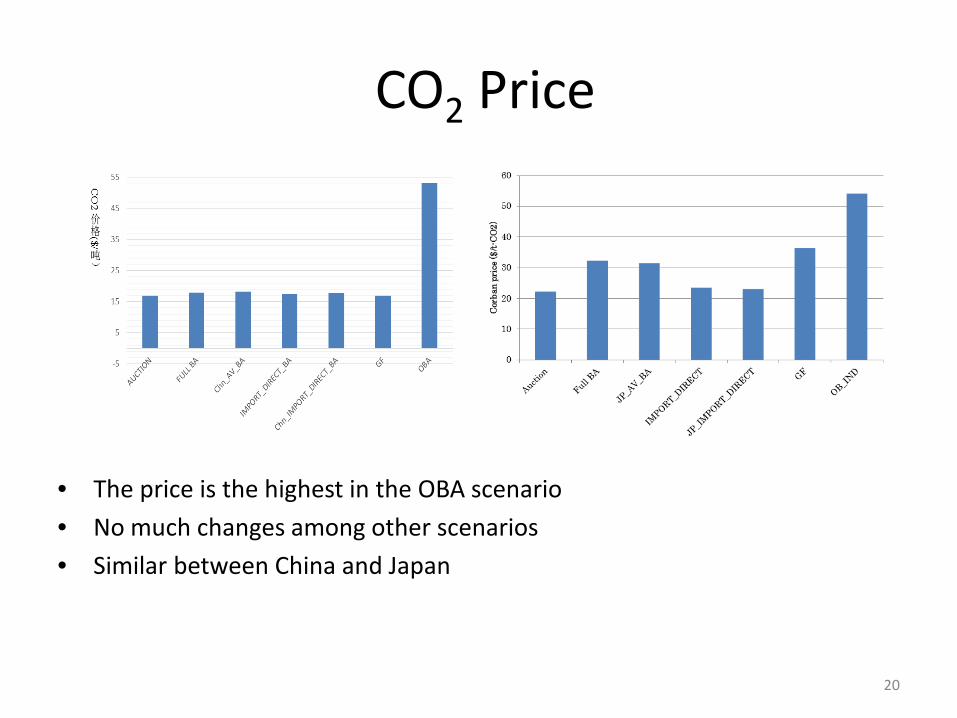
CO2 Price
• The price is the highest in the OBA scenario • No much changes among other scenarios • Similar between China and Japan
16
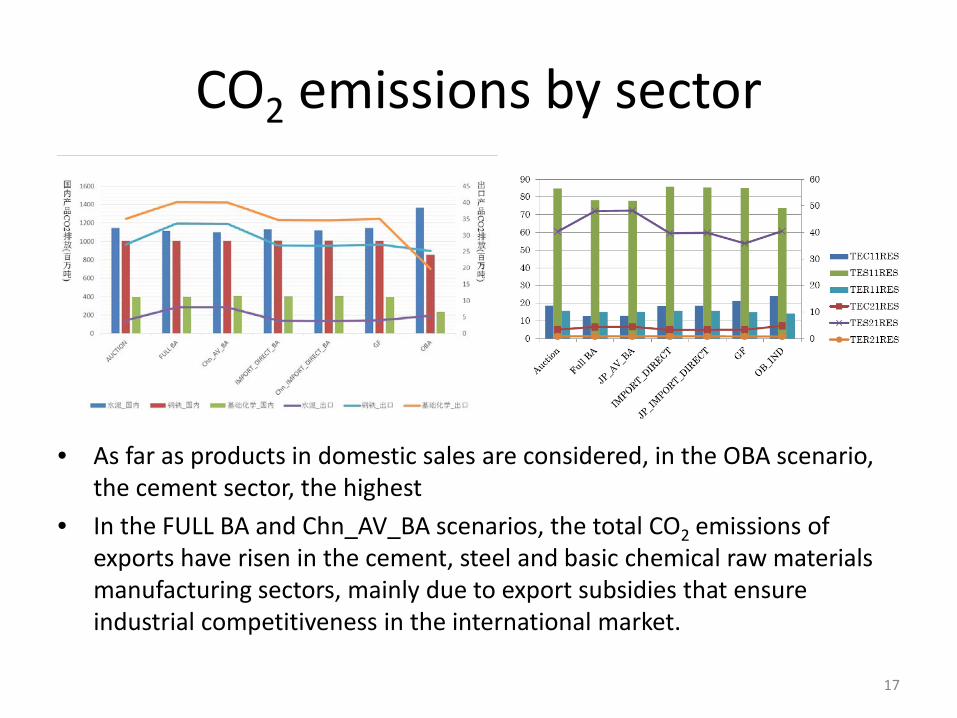
CO2 emissions by sector
• As far as products in domestic sales are considered, in the OBA scenario, the cement sector, the highest
• In the FULL BA and Chn_AV_BA scenarios, the total CO2 emissions of exports have risen in the cement, steel and basic chemical raw materials manufacturing sectors, mainly due to export subsidies that ensure industrial competitiveness in the international market.
17
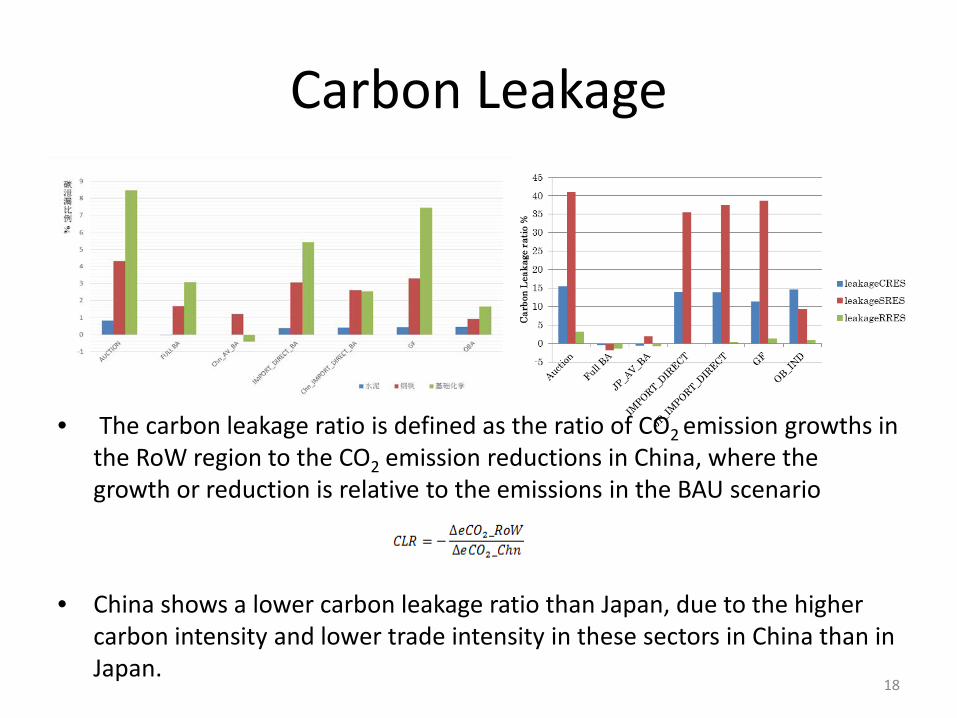
Carbon Leakage
• The carbon leakage ratio is defined as the ratio of CO2 emission growths in the RoW region to the CO2 emission reductions in China, where the growth or reduction is relative to the emissions in the BAU scenario
• China shows a lower carbon leakage ratio than Japan, due to the higher carbon intensity and lower trade intensity in these sectors in China than in Japan.
18

19
Exploring linkage
Case II model in China Case II model in Japan
Rest of World Rest of World
CO2 Price
• The price is the highest in the OBA scenario • No much changes among other scenarios • Similar between China and Japan
20

CO2 Price
• Little influence on China is shown, but the CO2 price in Japan is effectively reduced. • The price in Japan decreases maximum by 43% under FULL BA scenario , from USD
32.21/t decrease to USD 18.36/t, approximately 30% decrease under other scenarios (except OBA)
• The CO2 price rises slightly by less than 2.5% in China • It can be attributed to the much limited quota available in Japanese ETS market. In the
scope of this report, the quota liquidity in Chinese ETS market reaches 3.47 billion tons, while only 210 million tons in Japan. 21

MACs and Linking Methodology: MACs 1、Tax Linear Interpolation(PBL)
2、CO2 Price –Reduction Rate
4、 CO2 Price –Reduction Amount
Feature -Before Linking: China: q2, p2; Japan q1, p1;
-After Linking: China: q2*, p*; Japan q1*,p*;
-Benefit from Linking: Japan: S1; China: S2;
Japan
Carbon Price
China
Reduction Amount
22

Linking Benefit: Price and Flow
23
AUCTION FULL BA Chn/JP_AV_BA
IMPORT_DIRECT_BA
Chn/JP_IMPORT_DIRECT_BA GF OBA
Carbon Price CHINA 16.86 17.92 18.30 17.43 17.77 16.86 53.24 Carbon Price JAPAN 22.23 32.21 31.44 23.42 23.04 22.23 54.11 LINKAGE 17.05 18.36 18.72 17.67 17.98 17.05 53.26
CHINA_Change rate 1.12% 2.48% 2.31% 1.36% 1.18% 1.12% 0.04%
JAPAN_Change rate -23.31% -42.99% -40.47% -24.57% -21.95% -23.31% -1.58%
Trade flow (Mt) 14.05 25.69 24.33 13.93 12.35 13.57 1
Linking Benefit AUCTION FULL BA Chn/JP_AV_BA
IMPORT_DIRECT_BA
Chn/JP_IMPORT_DIRECT_BA GF OBA
China( million US dollar) 2.66 11.39 10.30 3.29 2.60 2.57 0.02
Japan ( million US dollar) 72.81 355.69 309.59 80.16 62.45 70.32 0.85

Conclusions • This study shows that the introduction of the ETS will have significant impacts
on China's economic sectors. • According to the input-output analysis, given the same carbon price level, the
severely affected MVAS in China is more than ten times that of developed countries - the EU, Japan and Germany.
• The partial equilibrium framework – CASE II model is established as a tool for economic analysis to measure the equilibrium impact of CO2 price and industrial competitiveness and carbon leakage at the sectoral level.
• The study also explores the ETS market linkage between China and Japan. • It is found that in the CASE II model, an integrated carbon market relative to a
separate one is effective in reducing the CO2 price and brings incremental benefits to both Chinese the Japanese society.
• Design matters, The benefit of linking depends on how parties consider the initial allocation of allowance and border adjustment;
• The distribution of linking benefit among markets depends on the size of the market and the form of the MAC. Smaller market with steeper MAC will gain more from linking.
24