Embed Size (px)
Citation preview

Linking DVH-parameters
to clinical outcome
Richard Pötter,
Medical University of Vienna,
General Hospital of Vienna, Austria

Outline
• DVH parameters for HR CTV (D90) and OAR (2 ccm)
„simple“ integration of 3D EBRT and Brachytherapy
• Clinical endpoints: local failure, morbidity
• Material: mono/multi-institut. series of consecutive patients
• Method: Prospective evaluation of clinical outcome (Vienna)
3D assessment of failures and morbidity + link
• Results: links between DVH parameters and outcome
CTV D90 and local control
OAR 2 ccm and morbidity
• Conclusions and limitations

Overview of adaptive target concepts in cervix cancer
3
ICRU/GEC ESTRO
report 88
under publication
Fig. 5.9-11
2cc1cc
0.1cc
Bladder
Rectum
ICRU 38 Ref. Points
GTV
Sigmoid
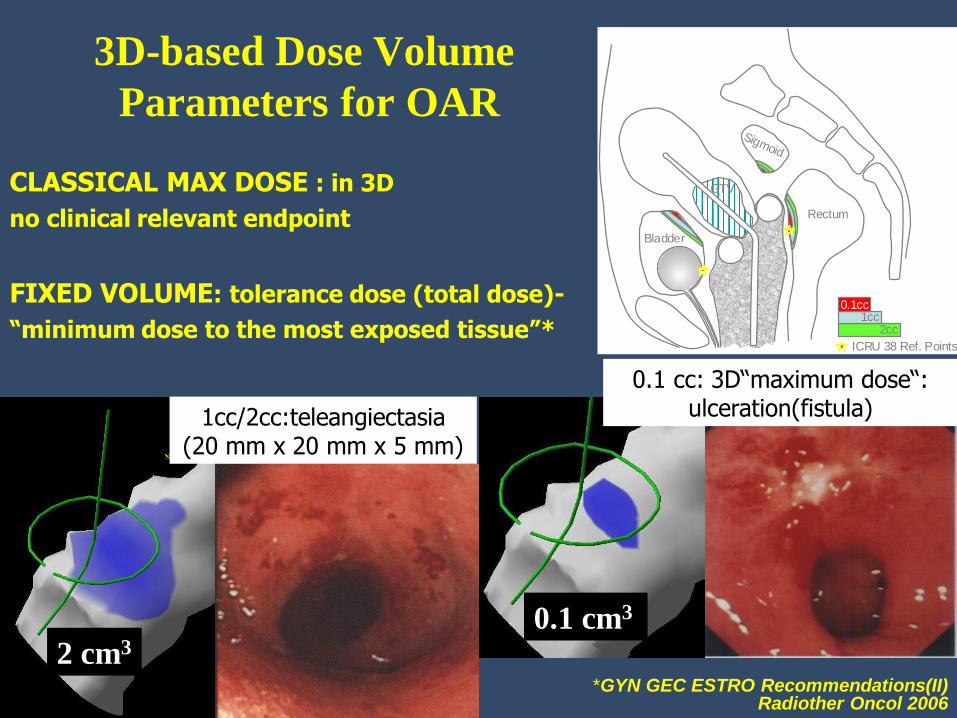
3D-based Dose Volume
Parameters for OAR
2 cm3
0.1 cm3
CLASSICAL MAX DOSE : in 3D
no clinical relevant endpoint
FIXED VOLUME: tolerance dose (total dose)-
“minimum dose to the most exposed tissue”*
*GYN GEC ESTRO Recommendations(II) Radiother Oncol 2006
1cc/2cc:teleangiectasia (20 mm x 20 mm x 5 mm)
0.1 cc: 3D“maximum dose“: ulceration(fistula)

• 145 consecutive patients
141 with MRI assisted cervix cancer brachytherapy
• 18 local recurrences (18/145: crude 12%)
• Analysis of recurrence topography and morbidity in 3D
relation to HR-CTV and D90
• 3D Dose-volume-effect relationships
Linking DVH-parameters to clinical outcome HR CTV and GTV and Recurrence (Vienna)
Analysis (n=141, FIGO: IB-IVA, median follow-up=51 months)
523 treatment plans / 608 fractions
Dimopoulos et al. IJROBP 2009

Summary dose values HR CTV (EQD2)
Mean Gy Intracavitary1 interstitial2 145 patients3
Prescribed 85 85 83
HR CTV Vol. 35cm³ 44cm³ 36cm³
HR CTV D90 87 96 86
Point A 82 - -
1 Kirisits et al Int J Radiat Oncol Biol Phys 2005, 22 pts
2 Kirisits et al Int J Radiat Oncol Biol Phys 2006, 22 pts
3 Pötter et al Radiother Oncol 2007, 145 pts
Depending on treatment period
(experience, modification of application)
D90: 81 Gy (98-00) – 90 Gy (01-03)

Linking DVH-parameters to clinical outcome HR CTV and GTV and Recurrence
3D Analysis of recurrence topography
FIGO stage IIB
a b
B
R
GTV
HR CTV
84 Gy EQD2
c
GTVDG
B
R
GTV DG
B
d e
C
C
f
a b
B
R
GTV
HR CTV
84 Gy EQD2
c
GTVDG
B
R
GTV DG
B
d e
C
C
f
Diagnosis Diagnosis Brachytherapy
6 mths after treatment 6 mths after treatment 9 mths after treatment
Dimopoulos et al. IJROBP 2009

18%
22%
Pötter R. et al Radiother Oncol 2007 81 Gy vs. 90 Gy in HR CTV
Vienna experience

Linking DVH-parameters to clinical outcome HR CTV/Tumour
Analysis (n=141, FIGO: IB-IVA, median follow-up=51 months) D90 for the HR-CTV and probability of local control
1
Pro
ba
bili
ty o
f lo
ca
l co
ntr
ol
0 10 20 30 50 40 90 100 70 60 80 110 120 130 140 0
0.1
0.2
0.3
0.5
0.4
0.9
0.7
0.6
0.8
D90 (HR CTV)
Entire population (n=141)
Tumours > 5cm (n=76)
Dimopoulos et Radioth & Oncol 2010
D90 HR CTV 90 Gy EQD2
90% probability for local control
D90 HR CTV 70 Gy EQD2
65% probability for local control

a) b)
c) d)
Figure 1
Vienna 2001-2008: 156 patients Mean D90: 93 Gy, 91 Gy for tumozurs >5 cm, 96 Gy 2-5 cm
Radioth & Oncology in press

Multicenter studies with IGABT in cervix ca.
STIC
• Prospective
• 2D vs. 3D (CT)
– Non random.
– Availability
• Completed
• 2005-2008
• 20 centers
• 705 pts
• Def. EBRT+BT
• Preop BT
• Preop. EBRT+BT
Embrace
• Prospective
• Phase IV (MRI)
• Accruing
• 2008-2013
• 27 centers
• 800 pts
• Def. EBRT+BT
Retro Embrace
• Retrospective
• Before Embrace
• Collecting
• 2011-2012
• 12 centers
• 700 pts
• Def. EBRT+BT
Lindegaard ESTRO 2012
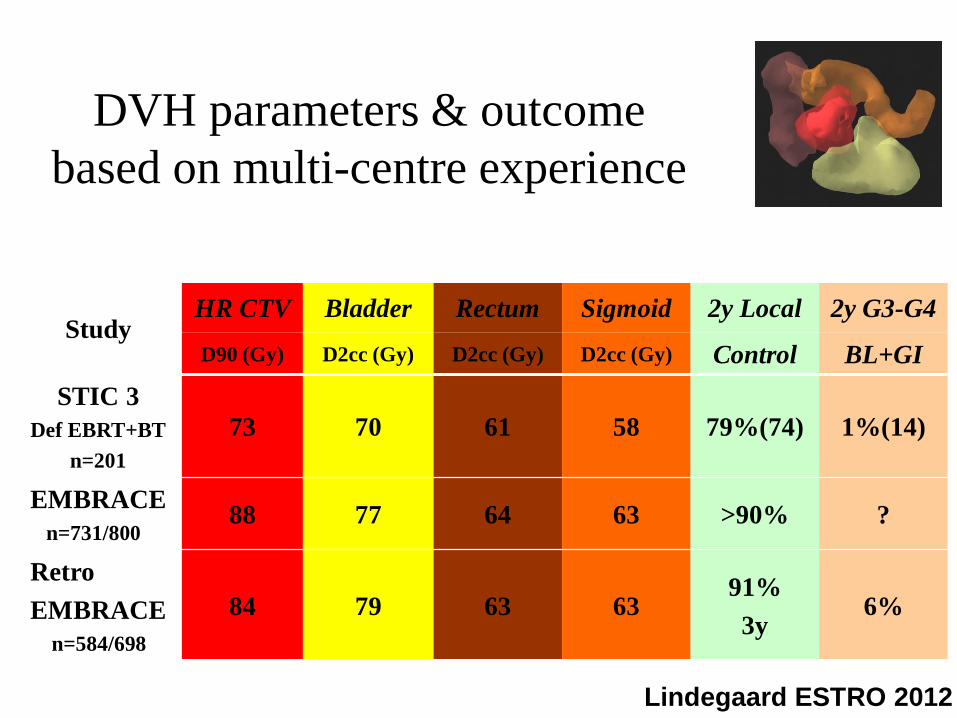
DVH parameters & outcome
based on multi-centre experience
Study HR CTV Bladder Rectum Sigmoid 2y Local 2y G3-G4
D90 (Gy) D2cc (Gy) D2cc (Gy) D2cc (Gy) Control BL+GI
STIC 3
Def EBRT+BT
n=201
73 70 61 58 79%(74) 1%(14)
EMBRACE
n=731/800 88 77 64 63 >90% ?
Retro
EMBRACE
n=584/698
84 79 63 63 91%
3y 6%
Lindegaard ESTRO 2012

Retro EMBRACE: Sturdza et al. ESGO 10/2013
69 local failures out of 731 patients,
median follow-up: 44 months
Actuarial Local Control
@ 3 years:
Stage 1B: 98%
Stage 2B: 95%
Stage 3B: 79%
Actuarial Local Control
@ 3 years: 91%
@ 5 years: 88%

FIGO
stage
Total no Local
failure
only
Local and
systemic
failure
Local and
regional
failure
Local,
regional
and
systemic
failure
Overall
local
failure
No
evidence
Of any local
disease
Mean D90
HRCTV
(Gy)
Actuarial
LC at 3
years %
Actuarial
LC at 5
years %
IA 2 0(0) 0(0) 0(0) 0(0) 0(0) 0(0) 100 100
IB 123 0(0) 0(0) 2(2) 0(0) 2(2) 121(121) 93.24±16.7 98 98
IIA 42 1(0) 1(1) 0(0) 1(1) 3(2) 39(40) 88.3±15.4 97 94
IIB 368 14(11) 5(3) 4(3) 5(4) 28(21) 340(347) 87.5±14 93 91
IIIA 23 1(1) 3(2) 0(0) 1(1) 5(4) 18(19) 83.4±11.8 71 71
IIIB 145 19(15) 4(4) 1(1) 4(4) 28(24) 117(121) 83.4±13 79 75
IVA 23 1(1) 0(0) 0(0) 2(2) 3 (3) 20(20) 77.92±23 76 76
IVB 5 0(0) 0(0) 0(0) 0(0) 0(0) 5(5) 78.26±13
Total 731 36(27) 13(11) 7(6) 13(11) 69(56) 662(676) 87.6±14.6 91 89
() Number of recurrences at three years
Table 3.Local failures in any form and D90 for HRCTV stage based
RetroEMBRACE Evaluation, to be published
Sturdza et al. 2013

Months to event
Survival Function
1.0
0.8
0.6
0.4
0.2
0.0
Local control
Overall survival
697 557 421 307 184 117
697 604 463 350 228 139
91%
85%
87.5%
79%
Figure 1: Actuarial LC and OS for 698 patients
with median 32 months F/U.
Absolute numbers for Local failures: 63 patients
(23 persistent diseases, 40 true local recurrences);
234/698 patients died.

Figure 6. Actuarial stage related overall survival at 3 years
and 5 years: stage IB: 88% & 83%, II A: 83% & 80% ,
IIB: 78% & 70%, IIIA: 54% & 42%, IIIB: 58% & 45%
and IV A: 43% and 32% .

Pro
bab
ilit
y
Months after treatment
100%: tumor < 4 cm
95.3%: tumor > 4 cm
HR-CTV D90 > 60 GyEQD2
40.0%: tumor > 4 cm
HR-CTV D90 < 60 GyEQD2
P = 0.001
HR-CTV D90 need more than 60 GyEQD2 (WP 30 Gy + ICBT 5.8 Gy x 4 to HR-CTV)
Correlation between HR-CTV D90
and local control : NIRS
2011 JASTRO Kato

0
.2
.4
.6
.8
1
0 12 24 36 48 60 72
D90≧ 58 GyEQD2 (n=21)
Pro
ba
bili
ty
Months
95%
70%
p=0.0470
D90 < 58 GyEQD2 (n=21)
0
.2
.4
.6
.8
1
0 12 24 36 48 60 72
Pro
ba
bili
ty
Months
Group 1
Group 2
Group 3
100%
92%
61%
Group 1 tumor size< 4cm (n=13)
Group 2 tumor size ≧ 4cm で
D90 ≧ 58 GyEQD2 (n=13)
Group 3: tumor size ≧ 4cm で
D90 < 58 GyEQD2 (n=16)
p=0.0884
(JSGO 48th Ohno et al.)
D90: 58GyEQD2 WP 30Gy/15fr + ICBT5.5Gy x 4fr (HR-CTV D90)
Correlation between HR-CTV D90
and local control : Gunma University

Dose Effects: local control multi-centre data, retrospective (RetroEMBRACE)
Figure 1.2.4: Relationship between EBRT-C+BT dose and local control from retroEMBRACE patients
(Tanderup et al, unpublished data)
Figure 1.2.4: Relationship between
EBRT-C+BT dose and local control from
retroEMBRACE, n=592 patients
(Tanderup et al, unpublished data)

LOCAL CONTROL - CLINICAL DATA
DOSE AT POINT A vs. D90 IN IMAGE BASED HR-CTV
Vienna experience, Rad&Onc 2011 (RetroEMBRACE)
EARLY DISEASE IB
DOSE
Pt A / D90 HR
BEST STANDARDS AIM/Vienna 2011
(RetroEMBRACE)
75 Gy / 90+ Gy
90-95%
100%/100% (98%)
ADVANCED
DISEASE
IIB
80 Gy / 90+ Gy
70-85%
95-100%/96% (95%)
IIIB
85 Gy / 90 Gy
50-65%
85-90%/86% (79%)
Expected Improvement through Image Guided Adaptation:
5-40%: IB: 5-10%; IIB lim: 10-20%; IIb ext/IIIB: 20-40%

Summary dose values OAR (EQD2)
Mean Gy Intracavitary1 interstitial2 145 patients3
Bladder D2cc 83 83 95
ICRU 75 73 72
Rectum D2cc 64 66 65
ICRU 69 71 67
Sigmoid D2cc 63 67 62
1 Kirisits et al Int J Radiat Oncol Biol Phys 2005
2 Kirisits et al Int J Radiat Oncol Biol Phys 2006
3 Pötter et al Radiother Oncol 2007 treatment period 1998-2003

145 consecutive patients with MRI assisted cervix cancer brachytherapy
prospective assessment of morbidity
Analysis of morbidity topography in 3D
for organs and
subgroups
2 ccm organ volume
(1 ccm, 0.1 ccm)
3D Dose-volume-
effect relationships
Linking DVH-parameters to clinical outcome morbidity (Vienna)
(n=141, FIGO: IB-IVA, median follow-up=51 months) 523 treatment plans / 608 fractions
P. Georg et al. IJROBP 2011;
LENT/
SOMA
G1 G2 CR*
G1/2 G3
G4
CR*
G3/4
Bladder 7 10 20% 1
2
4%
Rectum 2 6 9% 2 0
2%
Sigmoid 0 1 1% 0 2
2%
*CR: actuarial complication rate

D2cc = 81 Gy EQD2
D1cc = 90 Gy EQD2
D0.1cc= 108 Gy EQD2
ventral
dorsal
high dose area
corresponding to 0.1cc
Georg et al. IJROBP 2011
Endoscopic mapping

Incid
en
ce
VR
S >
3
0
10
20
30
40
50
60
70
80
90
100
Dose [Gy]
30 40 50 60 70 80 90 100 110 120 130 140
Incid
en
ce
LE
NT
/SO
MA
> 2
0
10
20
30
40
50
60
70
80
90
100
D2 ccm
D1 ccm
D0.1 ccm
DICRU
Dose volume effects
for rectal morbidity applying
GEC ESTRO recommendations
VRS: Vienna Rectoscopy
Score
Clinical late Effects
LENT SOMA score
Georg et al. Radioth&Oncol 2009
N = 35 patients
with rectosigmoidoscopy
Koom et al. IJROBP 2007
P. Georg et al. IJROBP 2011

Dose Volume Effect for sigmoid for 2 ccm (?)
0
0,1
0,2
0,3
0,4
0,5
0,6
0,7
0,8
0,9
1
0 10 20 30 40 50 60 70 80 90 100 110 120 130 140 150 160
D2cc (Sigmoid)
P
0/2 0/1 0/9 0/7 0/15 0/22
1/280/24
0/11
0/10
2/10
0/2
Sigma
N=141
0
1
2
3
4
1 2 3 4 5 6 7 8 9 10 11 12 13 14 15 16 17 18 19 20 21 22
Patients
VS
sc
ore
mean VS
common observation
Topographical interfractional
changes
In addition: No clear
correlation in endoscopy study
(2007) Sturdza et al. Boston 2008
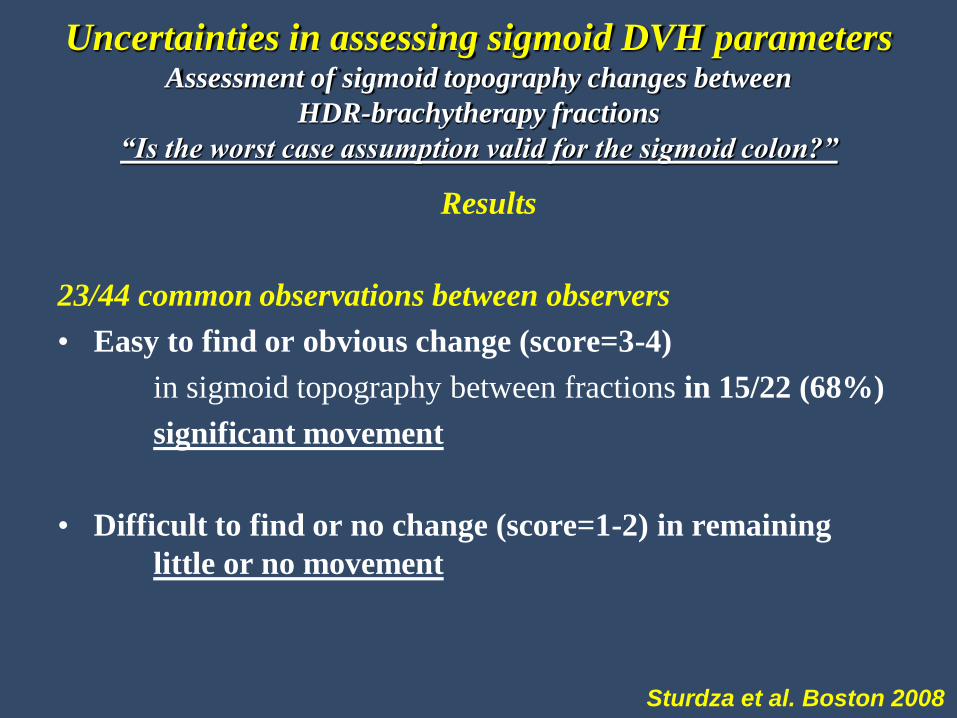
Uncertainties in assessing sigmoid DVH parameters Assessment of sigmoid topography changes between
HDR-brachytherapy fractions
“Is the worst case assumption valid for the sigmoid colon?”
Results
23/44 common observations between observers
• Easy to find or obvious change (score=3-4)
in sigmoid topography between fractions in 15/22 (68%)
significant movement
• Difficult to find or no change (score=1-2) in remaining
little or no movement
Sturdza et al. Boston 2008

Dose effect bladder
P. Georg et al. 2011 IJROBP
(Vienna data)
Significant dose response
for Bladder D2cc
on urinary incontinence (frequ)
(EMBRACE)
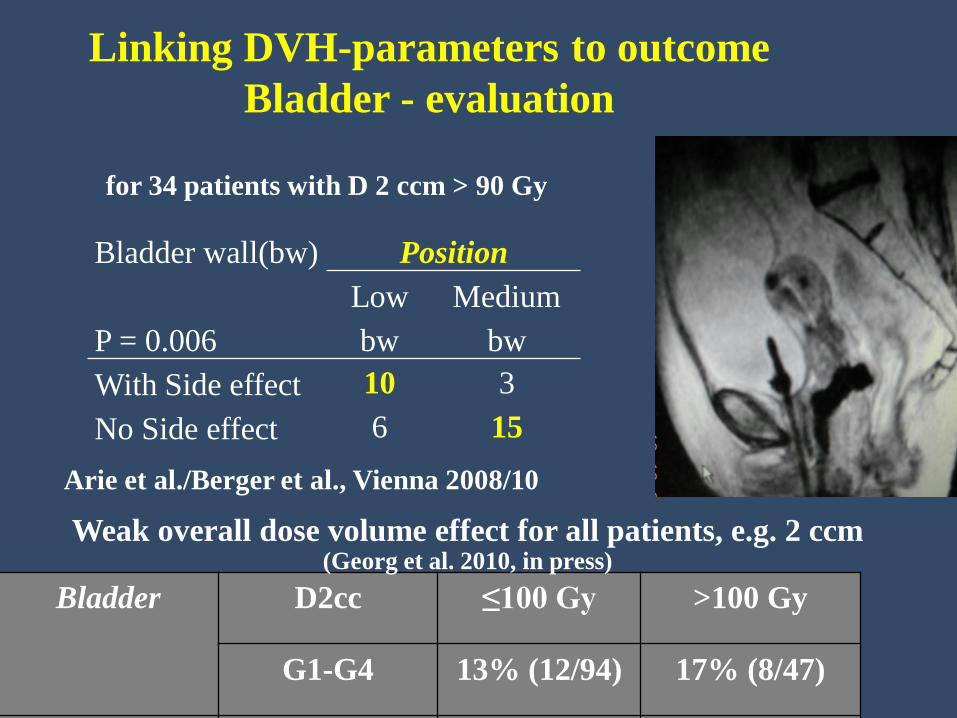
Linking DVH-parameters to outcome
Bladder - evaluation
Bladder wall(bw)
Position
P = 0.006
Low
bw
Medium
bw
With Side effect 10 3
No Side effect 6 15
Arie et al./Berger et al., Vienna 2008/10
Bladder D2cc ≤100 Gy >100 Gy
G1-G4 13% (12/94) 17% (8/47)
Rectum D2cc ≤75 Gy >75 Gy
G1-G4 4% (5/116) 20% (5/25)
Sigmoid D2cc ≤75 Gy >75 Gy
G1-G4 1% (1/119) 9% (2/22)
Weak overall dose volume effect for all patients, e.g. 2 ccm (Georg et al. 2010, in press)
for 34 patients with D 2 ccm > 90 Gy

RetroEMBRACE
Fokdal et al. 2013 Publication under preparation
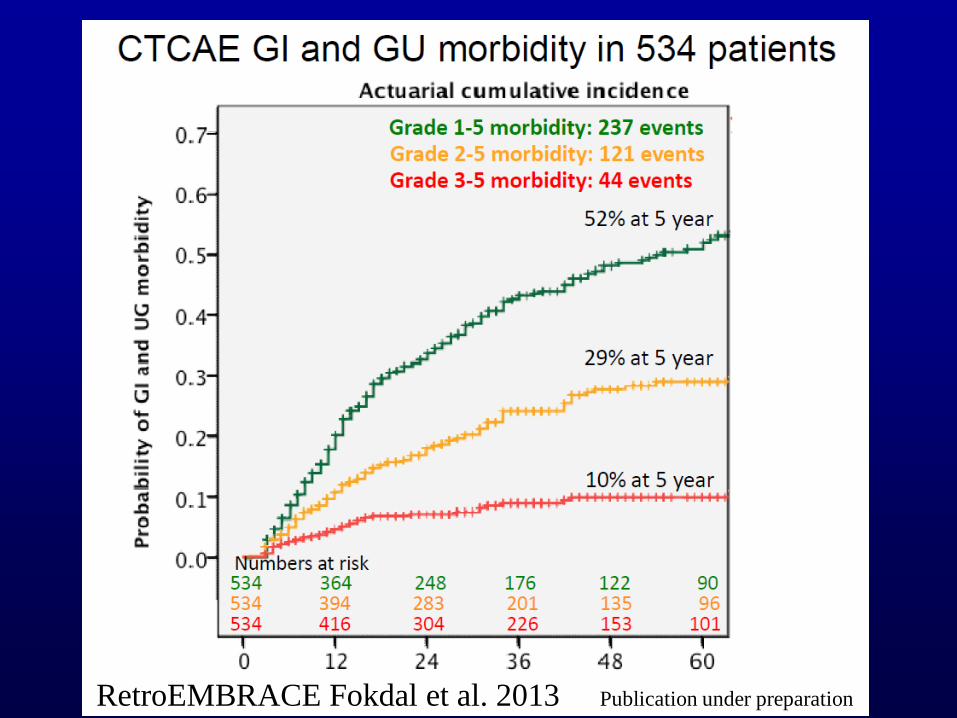
RetroEMBRACE Fokdal et al. 2013 Publication under preparation

Vaginal dose assessment and reporting
DVH parameters have HIGH uncertainty for representative vaginal dose estimation
They are influenced by the resolution of
sectional imaging, contouring accuracy and applicator reconstruction
Berger et al, IJROBP 2007

Vaginal morbidity was not (significantly) correlated to
any DVH-parameters which were applied in
3D MRI-based cervical cancer brachytherapy
bleeding teleangiectasia
shortening fibrosis
LENT SOMA 1 or 2
0,0 20,0 40,0 60,0 80,0 100,0 months after RT
0,0
0,2
0,4
0,6
0,8
1,0
pe
rce
nt
ACTUARIAL LATE SIDE EFFECTS (LENT/SOMA)
G1 / G2
G3 / G4
Upper vagina
n=145 G1/G2= 114
G3/G4= 5
Fidarova et al. Radioth&Oncol 2010

ICRU/GEC ESTRO Report 88 under publication Fig. 6.1/Fig. 8.11
Vaginal morbidity and radiation doses
at 5 mm
60-115 Gy
65 Gy ICRU
rectovag. P
50 Gy
37 Gy
4 Gy
(Westerveld et al.
Vienna 2013)

DVH Parameters and Reference Points,
variations in application
ICRU/GEC ESTRO
report 88
under publication
Fig. 6.4, Fig. 8.8

Dose Effects: vaginal morbidity multi-centre data, prospective (EMBRACE)
Vaginal morbidity
(shortening /stenosis)
and dose in 446 patients
(EMBRACE, Doctor reported outcome) (Kirchheiner et al, ESTRO Geneva 2013,
unpublished data)
Such dose effect correlations
also possible
for Patient reported outcome (?)
see Bergmark et al. 1999, 2002,
recent endometrium work


CONCLUSIONS AND LIMITATIONS (IGABT)
Linking DVH parameters to clinical outcome
• D90 HR CTV and local control: strong link
• 2 ccm for rectal morbidity (ICRU Point): strong link
• 2 ccm for bladder morbidity: some link
improvement by location assessment?
• 2 ccm for sigmoid morbidity: weak link
improvement by movement assessment?
• Any DVH parameter for vaginal morbidity: no link so far
improvement by ICRU rectovaginal Point strong link
Limitations: limited prospective study data
multicenter study: RetroEMBRACE/EMBRACE


