Embed Size (px)
Citation preview

Link to an accessible report
2 Israel Discount Bank Limited and its Subsidiaries
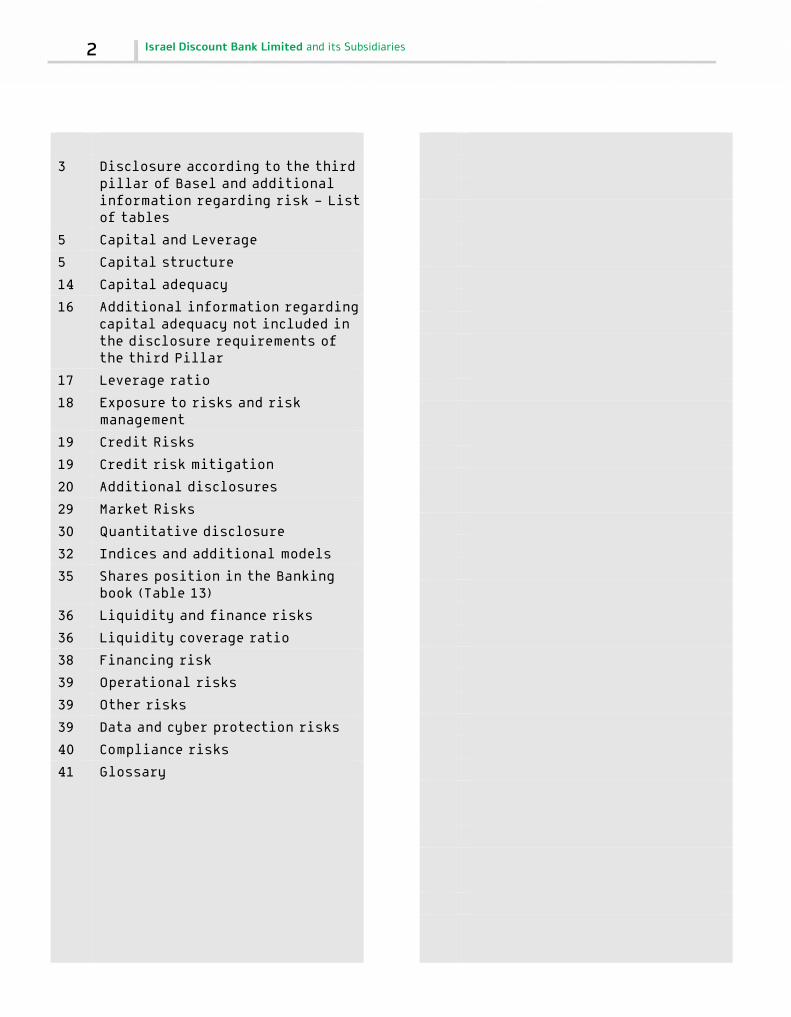
3 Disclosure according to the third pillar of Basel and additional information regarding risk - List of tables
5 Capital and Leverage
5 Capital structure
14 Capital adequacy
16 Additional information regarding capital adequacy not included in the disclosure requirements of the third Pillar
17 Leverage ratio
18 Exposure to risks and risk management
19 Credit Risks
19 Credit risk mitigation
20 Additional disclosures
29 Market Risks
30 Quantitative disclosure
32 Indices and additional models
35 Shares position in the Banking book (Table 13)
36 Liquidity and finance risks
36 Liquidity coverage ratio
38 Financing risk
39 Operational risks
39 Other risks
39 Data and cyber protection risks
40 Compliance risks
41 Glossary

First Quarter of 2018 Disclosure according to the third pillar of Basel and additional information regarding
risks 3
Disclosure according to the third pillar of Basel and
additional information regarding risk - List of tables

4 Israel Discount Bank Limited and its Subsidiaries
PRINCIPAL REGULATORY RATIOS AND REVIEW OF RISK
MANAGEMENT AND RISK ASSETS
Principal regulatory ratios (KM1)
31.3.2018 31.12.2017 30.9.2017 30.6.2017 31.3.2017
in NIS millions
Available capital Common equity tier 1 16,180 16,003 15,698 15,370 15,157
Common equity tier 1 before applying the effect of the transitional provisions 16,007 15,689 15,378 15,049 14,828
Tier 1 capital 16,892 16,893 16,588 16,046 16,047
Tier 1 capital before applying the effect of the transitional provisions 16,007 15,689 15,378 15,049 14,828
Total capital 22,033 22,288 22,137 21,852 21,635
Total capital before applying the effect of the transitional provisions 18,645 18,277 17,981 17,606 17,371
Weighted average of risk assets Total weighted average of risk assets 164,313 160,070 160,806 156,921 155,899
Ratio of capital adequacy in accordance with Directives of the supervisor of banks (in %)
Ratio of common equity tier 1 9.8 10.0 9.8 9.8 9.7
Ratio of common equity tier 1 before applying the effect of the transitional provisions 9.7 9.8 9.6 9.6 9.5
Tier I capital ratio 10.3 10.6 10.3 10.4 10.3
Tier I capital ratio before applying the effect of the transitional provisions 9.7 9.8 9.6 9.6 9.5
Ratio of total capital 13.4 13.9 13.8 13.9 13.9
Ratio of total capital before applying the effect of the transitional provisions 11.3 11.4 11.2 11.2 11.1
Ratio of common equity tier 1 required by the Supervisor of Banks 9.2 9.2 9.2 9.2 9.2
Ratio of common equity tier 1 over the required by the Supervisor of Banks 0.6 0.8 0.6 0.6 0.5
Leverage ratio according to Directives of the Supervisor of Banks Total exposures (in NIS millions) 255,319 248,020 245,654 243,259 243,731
Leverage ratio (in %) 6.6 6.8 6.8 6.7 6.6
Leverage ratio before applying the effect of the transitional provisions (in %) 6.3 6.3 6.3 6.1 6.1
Liquidity coverage ratio according to Directives of the Supervisor of Banks Total High Quality Liquidity Assets 46,131 44,410 46,368 47,996 50,062
Total cash outflows 34,133 35,058 34,588 34,962 33,193
Liquidity coverage ratio (in %) 135.1 126.7 134.1 137.3 150.8
Material leading and developing risks

First Quarter of 2018 Disclosure according to the third pillar of Basel and additional information regarding
risks 5
CAPITAL AND LEVERAGE
Capital structure
CAPITAL COMPONENTS FOR CALCULATING RATIO OF CAPITAL
Unaudited Audited
March 31,
December 31,
2018 2017 2017
in NIS millions
A. Common Equity Tier 1 Common equity 16,378 15,185 16,068
Difference between common equity and common equity tier 1 (202) (49) (59)
Total common equity tier 1 before supervisory adjustments and deductions 16,176 15,136 16,009
Supervisory adjustments and deductions Goodwill and other intangible assets 160 160 160
Deferred tax assets - - -
Supervisory adjustments and other deductions 7 5 6
Total supervisory adjustments and deductions before adjustments in respect to the efficiency plan 167 165 166
Total adjustments in respect to the efficiency plan 171 186 160
Total common equity tier 1 after supervisory adjustments and deductions 16,180 15,157 16,003
B. Additional tier 1 capital Additional tier 1 capital before deductions 712 890 890
Total additional tier 1 capital after deductions 712 890 890
C. Tier 2 capital Instruments before deductions 3,221 3,830 3,543
Allowance for credit losses before deductions 1,854 1,758 1,804
Minority interests in a subsidiary 66 -- 48
Total tier 2 capital before deductions 5,141 5,588 5,395
Deductions - -- -
Total tier 2 capital 5,141 5,588 5,395

6 Israel Discount Bank Limited and its Subsidiaries
PRESENTATION OF THE COMPONENTS OF THE REGULATORY CAPITAL, AS STATED IN THE CONSOLIDATED REGULATORY BALANCE SHEET (TABLE 3)
Consolidated regulatory
balance sheet
Consolidated regulatory
balance sheet
Consolidated regulatory
balance sheet
References to components of the regulatory
capital⁽¹⁾
March 31, 2018 March 31, 2017
December 31, 2017
In NIS million
Assets Cash and deposits with banks 30,382 29,179 28,026
Securities* 32,834 36,187 32,703 * Of which: Investments in the equity of financial corporations, which do
not exceed 10% of the share capital of the financial corporation 10 61 31 14
* Of which: Investments in the equity of financial corporations, which exceed 10% of the share capital of the financial corporation and which do not exceed the deduction threshold - - - 21
* Of which: Other securities 32,824 36,126 32,672 securities borrowed or purchased under resale agreements 682 369 954 Credit to the public 155,681 145,548 150,868 allowance for credit losses* (2,114) (2,089) (2,111) * Of which: group allowance for credit losses included in tier 2 (1,660) (1,570) (1,610) 20
* Of which: Allowance for credit losses not included in the regulatory capital (454) (519) (501)
Credit to the public, net 153,567 143,459 148,757 Credit to Government 1,515 795 1,493 Investments in affiliated companies* 120 147 153 * Of which: Investments in the equity of financial corporations, which
exceed 10% of the share capital of the financial corporation and which do not exceed the deduction threshold 24 23 24 21
* Of which: Investment in other affiliated companies 96 124 129 Buildings and equipment 2,387 2,318 2,366 Intangible assets and goodwill* 160 160 160 * Of which: goodwill 160 160 160 6
* Of which: other Intangible assets - - -- 7
Assets in respect of derivative instruments 3,472 3,034 2,953 Other assets * 3,663 3,448 3,656 * Of which: Deferred tax assets** ⁽²⁾1,704 ⁽²⁾1,607 ⁽²⁾1,695 21+75
** Of which: Deferred tax assets excluding those attributed to timing differences - - - 9
** Of which: Deferred tax liabilities in respect of intangible assets - - -- 8
** Of which: Other deferred tax assets 1,704 1,607 1,695 * Of which: Excess of deposits over provision - - -- 12
* Of which: Additional other assets 1,959 1,841 1,961 Total assets 228,782 219,096 221,221 Liabilities and Equity
Deposits from the public 181,111 171,642 175,170 Deposits from banks 5,924 5,184 4,804 Deposits from the Government 275 302 267 Securities loaned or sold under repurchase agreements 1,478 3,340 1,943 Bonds and subordinated capital notes* 7,407 8,648 7,639 * Of which: Deferred debt notes not recognized as regulatory capital 3,474 3,928 3,206 * Of which: Deferred debt notes recognized as regulatory capital** 3,933 4,720 4,433 16b,18b
** Of which: Qualified as regulatory capital components 784 784 784 16a,18a
** Of which: Not qualified as regulatory capital components and subject to transitional provisions 3,149 3,936 3,649 16b,18b For notes see next page.

First Quarter of 2018 Disclosure according to the third pillar of Basel and additional information regarding
risks 7
PRESENTATION OF THE COMPONENTS OF THE REGULATORY CAPITAL, AS STATED IN THE CONSOLIDATED REGULATORY BALANCE SHEET (TABLE 3) (CONTINUED)
Consolidated regulatory
balance sheet
Consolidated regulatory
balance sheet
Consolidated regulatory
balance sheet
References to components of the regulatory
capital⁽¹⁾
March 31, 2018 March 31, 2017
December 31, 2017
In NIS million
Liabilities in respect of derivative instruments* 3,290 3,639 3,232 * Of which: In respect of self credit risk 7 6 7 11
Other liabilities* 12,919 11,156 12,098 * Of which: group allowance for credit losses included in tier 2 194 188 194 20
* Of which: Deferred tax liability attributed to pension - - -- 13
* Of which: Adjustment in respect of put option for Non-controlling interests holders in a subsidiary which is subject to transitional provisions - - --
Liabilities held for sale - - - Total liabilities 212,404 203,911 205,153 Equity attributed to the banking corporation's shareholders* 15,896 14,754 15,594 * Of which: Ordinary share capital** 11,722 10,625 11,420 ** Of which: Ordinary share capital 676 675 676 1
** Of which: Retained earnings 11,579 10,290 11,246 3
** Of which: Accumulated other comprehensive income*** (533) (340) (502) 4
*** Of which: Net losses on the hedging of cash flows from items not presented in the balance sheet at fair value - - -- 10
*** Of which: Net loss on financial statements translation adjustments (268) (168) (313) * Of which: Capital reserves 4,174 4,129 4,174 2
* Of which: Preference share capital** - - -- ** Of which: Qualified as regulatory capital components - - -- 15a
** Of which: Not qualified as regulatory capital components and subject to transitional provisions - - -- 15b
* Of which: Other capital instruments** - - -- ** Of which: Qualified as regulatory capital components - - -- ** Of which: Not qualified as regulatory capital components and subject
to transitional provisions - - -- Non-controlling interests* 482 431 474 * Of which: Non-controlling interests that can be attributed to common
equity tier 1 280 278 302 5
* Of which: Non-controlling interests that can be attributed to additional tier 1 capital - - -- 17
* Of which: Non-controlling interests attributed to tier 2 capital 66 - 48 19
* Of which: Non-controlling interests not attributable to the regulatory capital 135 153 124
Total equity capital 16,378 15,185 16,068 Total assets and liabilities 228,782 219,096 221,221 Notes:
(1) The references are to the Table "Mapping of the components used for the presentation of the composition of the regulatory capital", presented hereunder, to the figure presented under the column "References from stage 2". (2) In view of the relief granted by the Supervisor of Banks with respect to the 2016 efficiency plan, the balance of deferred tax assets does not include the deferred taxes in respect of the efficiency plan.
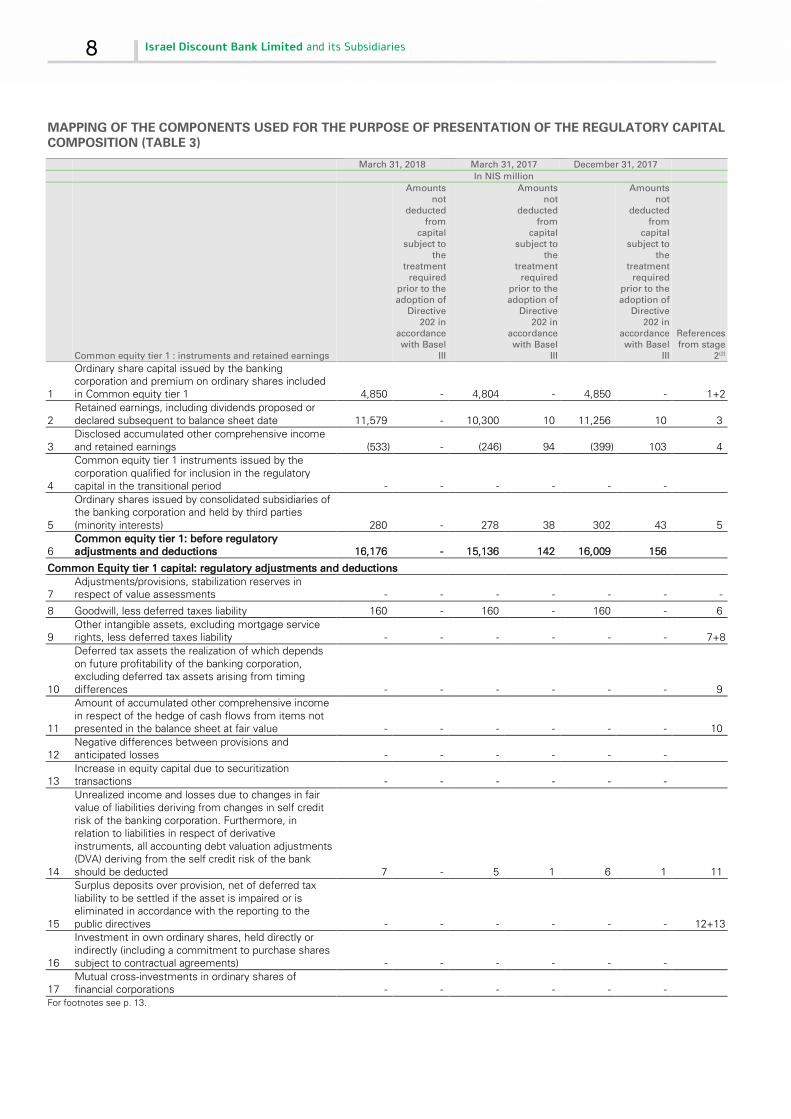
8 Israel Discount Bank Limited and its Subsidiaries
MAPPING OF THE COMPONENTS USED FOR THE PURPOSE OF PRESENTATION OF THE REGULATORY CAPITAL COMPOSITION (TABLE 3)
March 31, 2018 March 31, 2017 December 31, 2017
In NIS million
Common equity tier 1 : instruments and retained earnings
Amounts not
deducted from
capital subject to
the treatment
required prior to the adoption of
Directive 202 in
accordance with Basel
III
Amounts not
deducted from
capital subject to
the treatment
required prior to the adoption of
Directive 202 in
accordance with Basel
III
Amounts not
deducted from
capital subject to
the treatment
required prior to the adoption of
Directive 202 in
accordance with Basel
III
References from stage
2(2)
1
Ordinary share capital issued by the banking corporation and premium on ordinary shares included in Common equity tier 1 4,850 - 4,804 - 4,850 - 1+2
2 Retained earnings, including dividends proposed or declared subsequent to balance sheet date 11,579 - 10,300 10 11,256 10 3
3 Disclosed accumulated other comprehensive income and retained earnings (533) - (246) 94 (399) 103 4
4
Common equity tier 1 instruments issued by the corporation qualified for inclusion in the regulatory capital in the transitional period - - - - - -
5
Ordinary shares issued by consolidated subsidiaries of the banking corporation and held by third parties (minority interests) 280 - 278 38 302 43 5
6 Common equity tier 1: before regulatory adjustments and deductions 16,176 - 15,136 142 16,009 156
Common Equity tier 1 capital: regulatory adjustments and deductions
7 Adjustments/provisions, stabilization reserves in respect of value assessments - - - - - - -
8 Goodwill, less deferred taxes liability 160 - 160 - 160 - 6
9 Other intangible assets, excluding mortgage service rights, less deferred taxes liability - - - - - - 7+8
10
Deferred tax assets the realization of which depends on future profitability of the banking corporation, excluding deferred tax assets arising from timing differences - - - - - - 9
11
Amount of accumulated other comprehensive income in respect of the hedge of cash flows from items not presented in the balance sheet at fair value - - - - - - 10
12 Negative differences between provisions and anticipated losses - - - - - -
13 Increase in equity capital due to securitization transactions - - - - - -
14
Unrealized income and losses due to changes in fair value of liabilities deriving from changes in self credit risk of the banking corporation. Furthermore, in relation to liabilities in respect of derivative instruments, all accounting debt valuation adjustments (DVA) deriving from the self credit risk of the bank should be deducted 7 - 5 1 6 1 11
15
Surplus deposits over provision, net of deferred tax liability to be settled if the asset is impaired or is eliminated in accordance with the reporting to the public directives - - - - - - 12+13
16
Investment in own ordinary shares, held directly or indirectly (including a commitment to purchase shares subject to contractual agreements) - - - - - -
17 Mutual cross-investments in ordinary shares of financial corporations - - - - - -
For footnotes see p. 13.

First Quarter of 2018 Disclosure according to the third pillar of Basel and additional information regarding
risks 9
MAPPING OF THE COMPONENTS USED FOR THE PURPOSE OF PRESENTATION OF THE REGULATORY CAPITAL COMPOSITION (TABLE 3) (CONTINUED)
March 31, 2018 March 31, 2017 December 31, 2017
In NIS million
Common equity tier 1 : instruments and retained earnings
Amounts not
deducted from
capital subject to
the treatment
required prior to the adoption of
Directive 202 in
accordance with Basel
III
Amounts not
deducted from
capital subject to
the treatment
required prior to the adoption of
Directive 202 in
accordance with Basel
III
Amounts not
deducted from
capital subject to
the treatment
required prior to the adoption of
Directive 202 in
accordance with Basel
III
References from stage
2(2)
18
Investment in equity of financial corporations that are not consolidated in the statements to the public of a banking corporation, where the holdings of the banking corporation does not exceed 10% of the ordinary share capital issued by the financial corporation - - - - - - 14
19
Investment in equity of financial corporations that are not consolidated in the statements to the public of a banking corporation, where the holdings of the banking corporation exceed 10% of the ordinary share capital issued by the financial corporation - - - - - -
20 Mortgage service rights the amount of which exceeds 10% of the Common equity tier 1 - - - - - -
21
Deferred tax assets created by timing differences, the amount of which exceeds 10% of the Common equity tier 1 - - 73 18 76 19
22
Amount of mortgage service rights, deferred tax assets arising from timing differences and investments at a rate exceeding 10% of the ordinary share capital issued by financial corporations exceeding 15% of the Common equity tier 1 of the banking corporation - - - - - -
23
Of which: in respect of investments at a rate exceeding 10% of the ordinary share capital issued by financial corporations - - - - - -
24 Of which: in respect of mortgage service rights - - - - - -
25 Of which: deferred tax assets created by timing differences - - - - - -
26 Regulatory adjustments and additional deductions determined by the Supervisor of Banks (171) - (259) - (236) -
26A Of which: in respect of investments in the equity of financial corporations - - - - - -
26B Of which: in respect of mortgage service rights - - - - - -
26C Of which: additional regulatory adjustments to Common equity tier 1 - - (73) - (76) -
Of which: adjustments in respect to the efficiency plan (171)
(186)
(160)
Regulatory adjustments to Common equity tier 1 subject to the treatment required prior to the adoption of Directive 202 in accordance with Basel III - - - - - -
Of which: investment in equity of financial corporations that are not consolidated in the statements to the public of a banking corporation, where the holdings of the banking corporation exceed 10% of the ordinary share capital issued by the financial corporation - - - - - -
27
Deductions applying to Common equity tier 1 since the amounts of additional tier 1 capital and of tier 2 capital are insufficient to cover the deductions - - - - - -
For footnotes see p. 13.
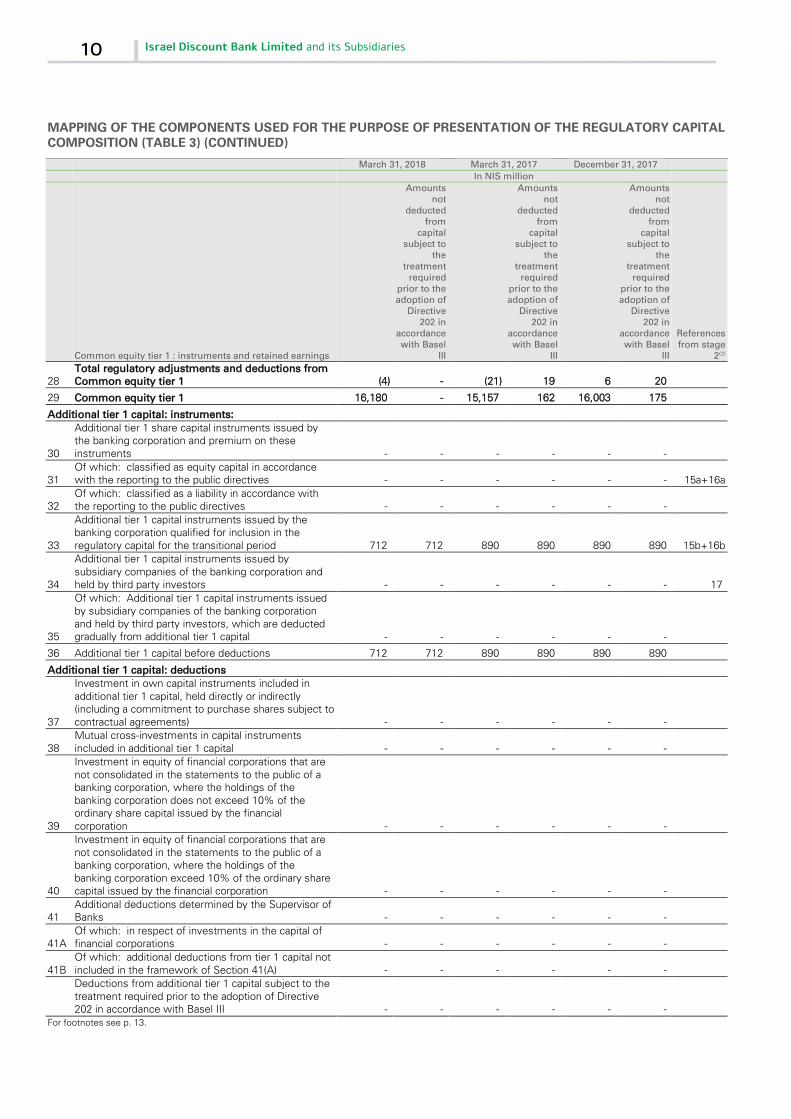
10 Israel Discount Bank Limited and its Subsidiaries
MAPPING OF THE COMPONENTS USED FOR THE PURPOSE OF PRESENTATION OF THE REGULATORY CAPITAL COMPOSITION (TABLE 3) (CONTINUED)
March 31, 2018 March 31, 2017 December 31, 2017
In NIS million
Common equity tier 1 : instruments and retained earnings
Amounts not
deducted from
capital subject to
the treatment
required prior to the adoption of
Directive 202 in
accordance with Basel
III
Amounts not
deducted from
capital subject to
the treatment
required prior to the adoption of
Directive 202 in
accordance with Basel
III
Amounts not
deducted from
capital subject to
the treatment
required prior to the adoption of
Directive 202 in
accordance with Basel
III
References from stage
2(2)
28 Total regulatory adjustments and deductions from Common equity tier 1 (4) - (21) 19 6 20
29 Common equity tier 1 16,180 - 15,157 162 16,003 175 Additional tier 1 capital: instruments:
30
Additional tier 1 share capital instruments issued by the banking corporation and premium on these instruments - - - - - -
31 Of which: classified as equity capital in accordance with the reporting to the public directives - - - - - - 15a+16a
32 Of which: classified as a liability in accordance with the reporting to the public directives - - - - - -
33
Additional tier 1 capital instruments issued by the banking corporation qualified for inclusion in the regulatory capital for the transitional period 712 712 890 890 890 890 15b+16b
34
Additional tier 1 capital instruments issued by subsidiary companies of the banking corporation and held by third party investors - - - - - - 17
35
Of which: Additional tier 1 capital instruments issued by subsidiary companies of the banking corporation and held by third party investors, which are deducted gradually from additional tier 1 capital - - - - - -
36 Additional tier 1 capital before deductions 712 712 890 890 890 890 Additional tier 1 capital: deductions
37
Investment in own capital instruments included in additional tier 1 capital, held directly or indirectly (including a commitment to purchase shares subject to contractual agreements) - - - - - -
38 Mutual cross-investments in capital instruments included in additional tier 1 capital - - - - - -
39
Investment in equity of financial corporations that are not consolidated in the statements to the public of a banking corporation, where the holdings of the banking corporation does not exceed 10% of the ordinary share capital issued by the financial corporation - - - - - -
40
Investment in equity of financial corporations that are not consolidated in the statements to the public of a banking corporation, where the holdings of the banking corporation exceed 10% of the ordinary share capital issued by the financial corporation - - - - - -
41 Additional deductions determined by the Supervisor of Banks - - - - - -
41A Of which: in respect of investments in the capital of financial corporations - - - - - -
41B Of which: additional deductions from tier 1 capital not included in the framework of Section 41(A) - - - - - -
Deductions from additional tier 1 capital subject to the treatment required prior to the adoption of Directive 202 in accordance with Basel III - - - - - -
For footnotes see p. 13.

First Quarter of 2018 Disclosure according to the third pillar of Basel and additional information regarding
risks 11
MAPPING OF THE COMPONENTS USED FOR THE PURPOSE OF PRESENTATION OF THE REGULATORY CAPITAL COMPOSITION (TABLE 3) (CONTINUED)
March 31, 2018 March 31, 2017 December 31, 2017
In NIS million
Common equity tier 1 : instruments and retained earnings
Amounts not
deducted from
capital subject to
the treatment
required prior to the adoption of
Directive 202 in
accordance with Basel
III
Amounts not
deducted from
capital subject to
the treatment
required prior to the adoption of
Directive 202 in
accordance with Basel
III
Amounts not
deducted from
capital subject to
the treatment
required prior to the adoption of
Directive 202 in
accordance with Basel
III
References from stage
2(2)
Of which: investment in equity of financial corporations that are not consolidated in the statements to the public of a banking corporation, where the holdings of the banking corporation exceed 10% of the ordinary share capital issued by the financial corporation - - - - - -
42
Deductions applying to additional tier 1 capital because the amount of tier 2 capital is insufficient to cover the deductions - - - - - -
43 Total deductions from additional tier 1 capital - - - - - - 44 Additional tier 1 capital 712 712 890 890 890 890 45 Tier 1 capital 16,892 712 16,047 1,052 16,893 1,064 Tier 2 capital: Instruments and Provisions
46
Instruments issued by the banking corporation (not included in tier 1 capital) and premium on such instruments 784 - 784 - 784 - 18a
47
Tier 2 capital instruments issued by the banking corporation, which are qualified for inclusion in the regulatory capital during the transitional period 2,437 2,437 3,046 3,046 2,759 2,759 18b
48
Tier 2 capital instruments issued by subsidiary companies of the banking corporation to third party investors - - - - - - 19
49
Of which: Tier 2 capital instruments issued by subsidiary companies of the banking corporation and held by third party investors, which are deducted gradually from tier 2 capital - - - - - -
50 Group allowances for credit losses before the related tax effect 1,854 - 1,758 - 1,804 - 20
Minority interest in a subsidiary 66 - - - 48 -
51 Tier 2 capital before deductions 5,141 2,437 5,588 3,046 5,395 2,759 Tier 2 capital: deductions
52
Investment in own tier 2 capital instruments, held directly or indirectly (including commitment to purchase instruments subject to contractual obligation) - - - - - -
53 Mutual cross-holdings of tier 2 capital instruments of financial corporations - - - - - -
54
Investment in equity of financial corporations that are not consolidated in the statements published to the public of the banking corporation, when the holdings of the banking corporation does not exceed 10% of the ordinary share capital issued by the financial corporation - - - - - -
55
Investment in equity of financial corporations that are not consolidated in the statements published to the public of the banking corporation, when the holdings of the banking corporation exceed 10% of the ordinary share capital issued by the financial corporation - - - - - -
56 Additional deduction determined by the Supervisor of Banks - - - - - -
For footnotes see p. 13.

12 Israel Discount Bank Limited and its Subsidiaries
MAPPING OF THE COMPONENTS USED FOR THE PURPOSE OF PRESENTATION OF THE REGULATORY CAPITAL COMPOSITION (TABLE 3) (CONTINUED)
March 31, 2018 March 31, 2017 December 31, 2017
In NIS million
Common equity tier 1 : instruments and retained earnings
Amounts not
deducted from
capital subject to
the treatment
required prior to the adoption of
Directive 202 in
accordance with Basel
III
Amounts not
deducted from
capital subject to
the treatment
required prior to the adoption of
Directive 202 in
accordance with Basel
III
Amounts not
deducted from
capital subject to
the treatment
required prior to the adoption of
Directive 202 in
accordance with Basel
III
References from stage
2(2)
56A Of which: in respect of investments in the capital of financial corporations - - - - - -
56B Of which: additional deductions to tier 2 capital - - - - - -
Regulatory adjustments to tier 2 capital subject to the treatment required prior to the adoption of Directive 202 in accordance with Basel III - - - - - -
Of which: investment in equity of financial corporations that are not consolidated in the statements published to the public of the banking corporation, when the holdings of the banking corporation exceed 10% of the ordinary share capital issued by the financial corporation - - - - - -
57 Total deductions to tier 2 capital - - - - - - 58 Tier 2 capital 5,141 2,437 5,588 3,046 5,395 2,759 59 Total capital 22,033 3,149 21,635 4,099 22,288 3,824
Total weighted average of risk assets in accordance with the treatment required prior to the adoption of Directive 202 in accordance with Basel III - - 18 - 19 -
Of which: deferred tax assets the realization of which is based on the future profitability of the banking corporation, excluding deferred tax assets arising from timing differences - - - - - -
Of which: deferred tax assets arising from timing differences - - 18 - 19 -
60 Total weighted average of risk assets ⁽³⁾164,313 - ⁽³⁾155,899 - ⁽³⁾160,070 - Capital ratios and capital conservation buffers (percentages)
61 Common equity tier 1 9.8 - 9.7 - 10.0 - 62 Tier 1 capital 10.3 - 10.3 - 10.6 - 63 Total capital 13.4 - 13.9 - 13.9 - 64 Not relevant - - - - - - 65 Not relevant - - - - - - 66 Not relevant - - - - - - 67 Not relevant - - - - - - 68 Not relevant - - - - - - Minimum requirements determined by the Supervisor of Banks
69 Minimum Common equity tier 1 ratio determined by the Supervisor of Banks ⁽¹⁾9.2 - ⁽¹⁾9.2 - ⁽¹⁾9.2 -
70 Minimum Tier I capital ratio determined by the Supervisor of Banks ⁽¹⁾9.2 - ⁽¹⁾9.2 - ⁽¹⁾9.2 -
71 Overall capital ratio determined by the Supervisor of Banks ⁽¹⁾12.7 - ⁽¹⁾12.7 - ⁽¹⁾12.7 -
For footnotes see next page.
First Quarter of 2018 Disclosure according to the third pillar of Basel and additional information regarding
risks 13
MAPPING OF THE COMPONENTS USED FOR THE PURPOSE OF PRESENTATION OF THE REGULATORY CAPITAL COMPOSITION (TABLE 3) (CONTINUED)
March 31, 2018 March 31, 2017 December 31, 2017
In NIS million
Common equity tier 1 : instruments and retained earnings
Amounts not
deducted from
capital subject to
the treatment
required prior to the adoption of
Directive 202 in
accordance with Basel
III
Amounts not
deducted from
capital subject to
the treatment
required prior to the adoption of
Directive 202 in
accordance with Basel
III
Amounts not
deducted from
capital subject to
the treatment
required prior to the adoption of
Directive 202 in
accordance with Basel
III
References from stage
2(2)
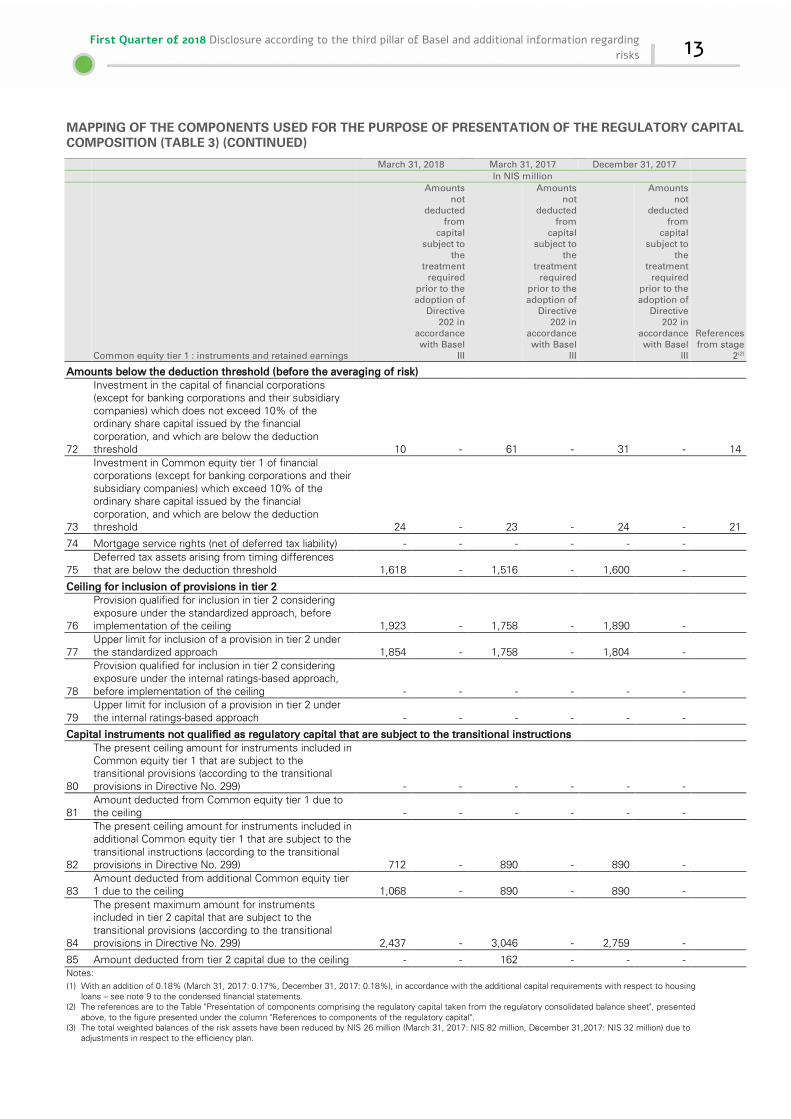
Amounts below the deduction threshold (before the averaging of risk)
72
Investment in the capital of financial corporations (except for banking corporations and their subsidiary companies) which does not exceed 10% of the ordinary share capital issued by the financial corporation, and which are below the deduction threshold 10 - 61 - 31 - 14
73
Investment in Common equity tier 1 of financial corporations (except for banking corporations and their subsidiary companies) which exceed 10% of the ordinary share capital issued by the financial corporation, and which are below the deduction threshold 24 - 23 - 24 - 21
74 Mortgage service rights (net of deferred tax liability) - - - - - -
75 Deferred tax assets arising from timing differences that are below the deduction threshold 1,618 - 1,516 - 1,600 -
Ceiling for inclusion of provisions in tier 2
76
Provision qualified for inclusion in tier 2 considering exposure under the standardized approach, before implementation of the ceiling 1,923 - 1,758 - 1,890 -
77 Upper limit for inclusion of a provision in tier 2 under the standardized approach 1,854 - 1,758 - 1,804 -
78
Provision qualified for inclusion in tier 2 considering exposure under the internal ratings-based approach, before implementation of the ceiling - - - - - -
79 Upper limit for inclusion of a provision in tier 2 under the internal ratings-based approach - - - - - -
Capital instruments not qualified as regulatory capital that are subject to the transitional instructions
80
The present ceiling amount for instruments included in Common equity tier 1 that are subject to the transitional provisions (according to the transitional provisions in Directive No. 299) - - - - - -
81 Amount deducted from Common equity tier 1 due to the ceiling - - - - - -
82
The present ceiling amount for instruments included in additional Common equity tier 1 that are subject to the transitional instructions (according to the transitional provisions in Directive No. 299) 712 - 890 - 890 -
83 Amount deducted from additional Common equity tier 1 due to the ceiling 1,068 - 890 - 890 -
84
The present maximum amount for instruments included in tier 2 capital that are subject to the transitional provisions (according to the transitional provisions in Directive No. 299) 2,437 - 3,046 - 2,759 -
85 Amount deducted from tier 2 capital due to the ceiling - - 162 - - - Notes:
(1) With an addition of 0.18% (March 31, 2017: 0.17%, December 31, 2017: 0.18%), in accordance with the additional capital requirements with respect to housing loans – see note 9 to the condensed financial statements. (2) The references are to the Table "Presentation of components comprising the regulatory capital taken from the regulatory consolidated balance sheet", presented above, to the figure presented under the column "References to components of the regulatory capital". (3) The total weighted balances of the risk assets have been reduced by NIS 26 million (March 31, 2017: NIS 82 million, December 31,2017: NIS 32 million) due to adjustments in respect to the efficiency plan.

14 Israel Discount Bank Limited and its Subsidiaries
Statement of flows of the regulatory capital (Table 2 D)
Summary of movements and changes in the regulatory capital
First quarter of 2018
For the year 2017
in NIS millions
Balance at the beginning of period 22,288 21,124
Common Equity Tier 1 before deductions Paid up share capital - 3
Share premium - 216
Retained earnings, including dividends proposed or declared after the balance sheet date 323 1,259
Unrealized profit (loss) from adjustments of available-for-sale securities to fair value (134) 25
Unrealized profit (loss) in respect of cash flow hedging - (1)
Translation adjustments of autonomous units held abroad 45 (335)
Other reserves which received the Supervisor's approval (33) (191)
Minority interests in the equity of consolidated subsidiaries (23) (4)
Total Common Equity Tier 1 before deductions 178 971
Goodwill and Intangible assets - -
Deferred taxes the realization of which is based on future profitability of a banking corporation - -
Deferred taxes attributable to timing differences (over 10% of Common Equity Tier 1) - -
Unrealized profit (loss) as a result of changes in fair value of liabilities resulting from changes in the Bank's self credit risk 1 3
Threshold deductions - the amount exceeding 15% ( in accordance with Section 13 of Directive No. 202) - -
Others - -
Total deductions from Common Equity Tier 1 1 3
Total Common Equity Tier 1 after deductions 177 968
Instruments issued by the banking corporation qualified for inclusion in regulatory capital in accordance with transitional instructions in Directive No. 299 (178) (178)
Total Additional Tier 1 Capital after deductions (178) (178)
Instruments issued by the banking corporation and premium on these instruments (in accordance with Section 10A and 10B of Directive No. 202) - 784
Instruments issued by the banking corporation qualified for inclusion in regulatory capital in accordance with transitional instructions in Directive No. 299 (322) (542)
Minority interests in the equity of consolidated subsidiaries 18 48
Group allowances for credit losses before related tax effect 50 84
Total Common Equity Tier 2 before deductions (254) 374
Deduction in respect of investment in financial corporations mainly in respect of FIBI - -
Total deductions from Tier 2 Capital - -
Total Tier 2 Capital after deductions (254) 374
Balance at period end 22,033 22,288
Capital adequacy
First Quarter of 2018 Disclosure according to the third pillar of Basel and additional information regarding
risks 15
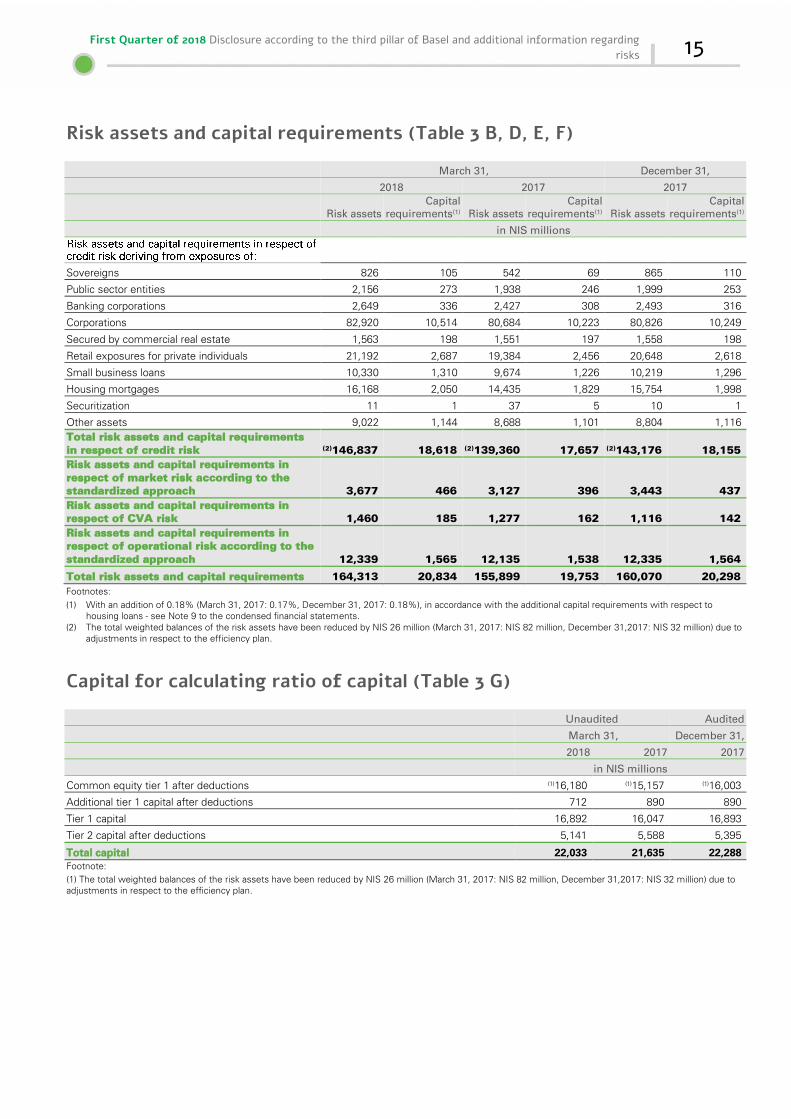
Risk assets and capital requirements (Table 3 B, D, E, F)
March 31, December 31,
2018 2017 2017
Risk assets
Capital requirements⁽¹⁾ Risk assets
Capital requirements⁽¹⁾ Risk assets
Capital requirements⁽¹⁾
in NIS millions
Sovereigns 826 105 542 69 865 110
Public sector entities 2,156 273 1,938 246 1,999 253
Banking corporations 2,649 336 2,427 308 2,493 316
Corporations 82,920 10,514 80,684 10,223 80,826 10,249
Secured by commercial real estate 1,563 198 1,551 197 1,558 198
Retail exposures for private individuals 21,192 2,687 19,384 2,456 20,648 2,618
Small business loans 10,330 1,310 9,674 1,226 10,219 1,296
Housing mortgages 16,168 2,050 14,435 1,829 15,754 1,998
Securitization 11 1 37 5 10 1
Other assets 9,022 1,144 8,688 1,101 8,804 1,116
Total risk assets and capital requirements in respect of credit risk ⁽²⁾146,837 18,618 ⁽²⁾139,360 17,657 ⁽²⁾143,176 18,155
Risk assets and capital requirements in respect of market risk according to the standardized approach 3,677 466 3,127 396 3,443 437
Risk assets and capital requirements in respect of CVA risk 1,460 185 1,277 162 1,116 142
Risk assets and capital requirements in respect of operational risk according to the standardized approach 12,339 1,565 12,135 1,538 12,335 1,564
Total risk assets and capital requirements 164,313 20,834 155,899 19,753 160,070 20,298
Footnotes:
(1) With an addition of 0.18% (March 31, 2017: 0.17%, December 31, 2017: 0.18%), in accordance with the additional capital requirements with respect to housing loans - see Note 9 to the condensed financial statements.
(2) The total weighted balances of the risk assets have been reduced by NIS 26 million (March 31, 2017: NIS 82 million, December 31,2017: NIS 32 million) due to adjustments in respect to the efficiency plan.
Capital for calculating ratio of capital (Table 3 G)
Unaudited Audited
March 31, December 31,
2018 2017 2017
in NIS millions
Common equity tier 1 after deductions ⁽¹⁾16,180 ⁽¹⁾15,157 ⁽¹⁾16,003
Additional tier 1 capital after deductions 712 890 890
Tier 1 capital 16,892 16,047 16,893
Tier 2 capital after deductions 5,141 5,588 5,395
Total capital 22,033 21,635 22,288 Footnote:
(1) The total weighted balances of the risk assets have been reduced by NIS 26 million (March 31, 2017: NIS 82 million, December 31,2017: NIS 32 million) due to adjustments in respect to the efficiency plan.

16 Israel Discount Bank Limited and its Subsidiaries
Ratio of capital to risk assets (Table 3 H and I)
Unaudited Audited
March 31, December 31,
2018 2017 2017
In %
A. Consolidated Ratio of common equity tier 1 to risk assets 9.8 9.7 10.0
Ratio of total capital to risk assets 13.4 13.9 13.9
Ratio of minimum common equity tier 1 required by the Supervisor of Banks ⁽⁴⁾9.2 ⁽⁴⁾9.2 ⁽⁴⁾9.2
Minimum total capital adequacy ratio required by the Supervisor of Banks ⁽⁴⁾12.7 ⁽⁴⁾12.7 ⁽⁴⁾12.7
B. Significant subsidiaries 1. Mercantile Discount Bank LTD. and its consolidated companies Ratio of common equity tier 1 to risk assets 11.0 10.7 10.9
Ratio of total capital to risk assets 13.7 13.4 13.9
Ratio of minimum common equity tier 1 required by the Supervisor of Banks ⁽⁵⁾9.2 ⁽⁵⁾9.2 ⁽⁵⁾9.2
Minimum total capital adequacy ratio required by the Supervisor of Banks ⁽⁵⁾12.7 ⁽⁵⁾12.7 ⁽⁵⁾12.7
2. Discount Bancorp Inc. ⁽¹⁾ Ratio of common equity tier 1 to risk assets 14.3 13.3 13.6
Ratio of total capital to risk assets 15.3 14.4 14.7
Ratio of minimum common equity tier 1 required in accordance with local regulation ⁽²⁾4.5 ⁽²⁾4.5 ⁽²⁾4.5
Minimum total capital adequacy ratio required in accordance with local regulation ⁽²⁾8.0 ⁽²⁾8.0 ⁽²⁾8.0
3. Israel Credit Cards LTD. Ratio of common equity tier 1 to risk assets 13.7 14.1 14.4
Ratio of total capital to risk assets 14.8 15.4 15.6
Ratio of minimum common equity tier 1 required by the Supervisor of Banks 8.0 8.0 8.0
Minimum total capital adequacy ratio required by the Supervisor of Banks ⁽³⁾11.5 ⁽³⁾11.5 ⁽³⁾11.5 Footnotes: (1) The data in this item was computed in accordance with the rules mandatory in the U.S.A. (2) IDB New York is subject to the new Basel III capital rules based on the final rules published by the FRB. Capital ratios are as follows: 4.5% CET1 to risk- weighted assets; 6.0% Tier 1 capital to risk-weighted assets; and 8.0% Total capital to risk-weighted assets. (3) In accordance with the approach by the Supervisor of Banks, ICC was required to maintain a total capital ratio of not less than 15%, starting from December 31, 2010. In February 2018, the Supervisor of Banks notified ICC of the removal of this restriction. (4) With an addition of 0.18% (March 31, 2017: 0.17%, December 31, 2017: 0.18%), in accordance with the additional capital requirements with respect to housing loans - see item 1 (b) above. (5) With an addition of 0.19% (March 31, 2017: 0.18%, December 31, 2017: 0.18%), in accordance with the additional capital requirements with respect to housing loans - see item 1 (b) above.
Additional information regarding capital adequacy not
included in the disclosure requirements of the third Pillar
RISK WEIGHTED ASSETS ACCORDING TO REGULATORY OPERATING SEGMENTS
Domestic operations
Households
Private Banking
Small and minute
businesses Medium
businesses Large
businesses Institutional
bodies Financial
management
Total Domestic
operations
Total International
operations Total
in NIS millions
For the three months ended March 31, 2018
Average Risk-assets⁽¹⁾ 44,261 452 30,909 13,104 35,762 1,221 12,632 138,341 22,474 160,815 Balance of Risk-assets at the period end ⁽¹⁾ 46,910 481 31,096 12,925 36,676 1,058 13,101 142,247 22,066 164,313
For the three months ended March 31, 2017(2)
Average Risk-assets⁽¹⁾ 40,225 401 29,734 13,424 33,401 1,602 11,807 130,594 23,801 154,395 Balance of Risk-assets at the period end ⁽¹⁾ 40,669 415 29,964 12,649 35,348 1,652 12,191 132,888 23,011 155,899 Footnotes: (1) Risk weighted assets – as computed for capital adequacy purposes. (2) Reclassified - Some of the data as of March 31, 2017, and for the period ended therein, were reclassified in this report, including reclassification in classifying customers to the different segments.

First Quarter of 2018 Disclosure according to the third pillar of Basel and additional information regarding
risks 17
SUMMARY OF MOVEMENT AND CHANGES IN RISK-WEIGHTED ASSETS
First quarter of 2018
For the year 2017
NIS millions
Balance at the beginning of period 144,292 138,335
Change in exposures Realizations (balance-sheet credit) 4,156 5,802
Bonds (5) (635)
Derivatives 311 (137)
Facilities 3,441 1,397
Guarantees 1,008 1,445
Other assets 331 228
Total Change in exposures 9,242 8,100
CCF effect (4,044) (1,223)
Change in exposures after CCF effect 5,198 6,877
Changes in risk mitigates
Guarantees (replacement) 203 2,572
Financial risk mitigates 1,510 (775)
Total 1,713 1,798
CCF effect (176) (703)
Change in risk mitigates after CCF effect 1,537 1,095
Change in CVA 344 174
Total Change in credit risk-weighted assets 4,005 5,956
Balance at period end 148,297 144,292
Leverage ratio
Comparison between Balance sheet assets and the measurement of
exposure for the purpose of the leverage ratio (Table 3 A)
March 31 December 31,
2018 2017 2017
NIS millions
Total assets according to the consolidated financial statements 228,782 219,096 221,221
Adjustment in respect of investments in entities in the banking, finance, insurance and commercial fields, consolidated for accounting purposes, but not included in consolidation for regulatory purposes - - -
Adjustments in respect of trusteeship assets recognized in the balance sheet according to the Reporting to the Public Directives, but not included in the measurement of exposure of the leverage ratio - - -
Adjustments in respect of derivative financial instruments (56) (432) 53
Adjustments in respect of SFTs 532 1,102 1,542
Adjustments in respect of off-balance sheet items (conversion of off-balance sheet exposure to credit equivalent amounts) 24,501 22,506 23,703
Other adjustments 1,560 4591, 1,501
Exposure for the purpose of the leverage ratio 255,319 731243, 248,020

18 Israel Discount Bank Limited and its Subsidiaries
Disclosure of the leverage ratio (Table 3 B)
March 31 December 31,
2018 2017 2017
NIS millions
Balance sheet exposures On-balance sheet items (excluding derivatives and SFTs, but including collateral and
group allowance) 222,408 213,814 215,856
Asset amounts deducted in determining Tier 1 capital (160) (160) (160)
Total balance sheet exposures (excluding derivatives and SFTs) 222,248 213,654 215,696
Derivative exposures Replacement cost associated with all derivatives transactions 1,830 1,409 1,401
Add-on amounts for PFE associated with all derivatives transactions 1,602 1,217 1,622
Gross-up for derivatives collateral provided which where deducted from the balance sheet assets pursuant to the Reporting to the Public Directives - - -
Deductions of receivables assets for cash variation margin provided in derivatives transactions - - -
Exempted CCP leg of client-cleared trade exposures - - -
Adjusted effective notional amount of written credit derivatives - - -
Adjusted effective notional offsets and add-on deductions for written credit derivatives - - -
Total derivative exposures 3,432 2,626 3,023
Securities financing transaction exposures Gross SFT assets (with no recognition of netting), after adjusting for transactions treated
as an accounting sale 4,606 3,843 4,056
Netted amounts of cash payables and cash receivables of gross SFT assets - - -
Credit risk exposure of a counterparty for SFT assets 532 1,102 1,542
Agent transaction exposures - - -
Total securities financing transaction exposures 5,138 4,945 5,598
Other off-balance sheet exposures Off-balance sheet exposure at gross notional amount 84,914 76,457 79,161
Adjustments for conversion to credit equivalent amounts (60,413) (53,951) (55,458)
Total off-balance sheet items 24,501 22,506 23,703
Capital and total exposures Tier 1 capital ⁽¹⁾16,892 ⁽¹⁾16,047 ⁽¹⁾16,893
Total exposures 255,319 243,731 248,020
Leverage ratio
Leverage ratio according to Proper Conduct of Banking Business Directive No. 218 6.6 6.6 6.8
Footnote:
(1) The Tier I capital and the total exposure are presented after the relief granted by the Supervisor of Banks in respect of the 2016 efficiency plan.
EXPOSURE TO RISKS AND RISK MANAGEMENT
First Quarter of 2018 Disclosure according to the third pillar of Basel and additional information regarding
risks 19
Drafts and Instructions published during the first quarter of
2018
CREDIT RISKS
Drafts and Instructions published during the first quarter of
2018
Credit risk mitigation

20 Israel Discount Bank Limited and its Subsidiaries
Credit risk mitigation (table 7)
Gross credit exposure before
allowance for credit losses⁽¹⁾⁽²⁾
Gross credit exposure after allowance for
credit losses⁽¹⁾⁽²⁾
Credit exposure
covered by eligible
financial collateral⁽³⁾⁽⁴⁾
Total amounts
subtracted⁽⁵⁾
Total amounts added⁽⁵⁾
Net credit exposure
in NIS millions
March 31, 2018
Sovereigns debts 53,688 53,688 (28) (919) 34 52,775
Public sector entities debts 7,755 7,747 - - 1,326 9,073
Banking corporations debts 6,453 6,451 (201) (286) 8,242 14,206
Corporations debts 123,677 123,676 (8,330) (13,176) 12,606 114,776
Secured by commercial real estate debts 1,711 1,703 (144) - - 1,559
Retail exposures for private individuals 58,634 58,583 (1,477) (7,786) - 49,320
Small business loans 20,946 20,711 (2,711) (41) - 17,959
Housing mortgages 32,104 31,951 (8) - - 31,943
Securitization 53 53 - - - 53
Other assets 9,261 9,261 - - - 9,261
Total 314,282 313,824 (12,899) (22,208) 22,208 300,925
March 31, 2017
Sovereigns debts 53,362 53,362 (21) (344) 144 53,141
Public sector entities debts 7,349 7,346 (1) (124) 549 7,770
Banking corporations debts 5,151 5,150 (33) (88) 8,091 13,120
Corporations debts 117,138 117,136 (7,082) (10,389) 9,762 109,427
Secured by commercial real estate debts 1,760 1,753 (204) - - 1,549
Retail exposures for private individuals 53,068 52,897 (1,552) (7,582) - 43,763
Small business loans 19,486 19,299 (2,749) (19) - 16,531
Housing mortgages 28,602 28,449 (1) - - 28,448
Securitization 185 185 - - - 185
Other assets 8,546 8,546 - - - 8,546
Total 294,647 294,123 (11,643) (18,546) 18,546 282,480
December 31, 2017
Sovereigns debts 52,845 52,845 (11) (907) 29 51,956
Public sector entities debts 7,329 7,321 - - 1,308 8,629
Banking corporations debts 5,630 5,630 (108) (284) 8,100 13,338
Corporations debts 118,876 118,853 (6,825) (13,042) 12,456 111,442
Secured by commercial real estate debts 1,749 1,743 (186) - - 1,557
Retail exposures for private individuals 55,314 55,234 (1,459) (7,627) - 46,148
Small business loans 20,540 20,310 (2,706) (33) - 17,571
Housing mortgages 30,714 30,557 (5) - - 30,552
Securitization 52 52 - - - 52
Other assets 8,572 8,572 - - - 8,572
Total 301,621 301,117 (11,300) (21,893) 21,893 289,817 Footnotes: (1) Off balance sheet credit risk is stated prior to conversion to credit equivalent (before multiplication by the CCF coefficient). (2) Credit risk in respect of transactions in derivative financial instruments is presented in terms of credit equivalent (after netting effect and after multiplication by the "add-on" coefficient). (3) After balance sheet or off-balance sheet netting, when relevant, and after application of haircuts, including positive adjustments added to the exposure. (4) Including gold. (5) The amount of exposure covered by guaranties is presented as part of the obligations of the counterparty providing the guarantees.

First Quarter of 2018 Disclosure according to the third pillar of Basel and additional information regarding
risks 21
Additional disclosures
Quantitative disclosure regarding credit risk (Table 4 B)
Gross credit risk exposure
March 31, 2018
Average for the
period⁽¹⁾ March 31,
2017
Average for the
period⁽¹⁾ December
31, 2017
Average for the
period⁽¹⁾
in NIS millions
Credit 186,994 183,925 174,711 173,390 180,855 176,884
Bonds 30,102 30,261 32,728 33,904 30,420 31,625
Others⁽²⁾ 9,261 8,917 8,546 8,524 8,572 8,638
Guarantees and other liabilities on account of clients⁽³⁾ 84,494 81,623 76,036 75,823 78,751 77,889
Transactions in derivative financial instruments⁽⁴⁾ 3,431 3,227 2,626 2,504 3,023 2,889
Total 314,282 307,953 294,647 294,145 301,621 297,925
Footnotes:
(1) The average is computed on a quarterly basis.
(2) Primarily: cash, shares, fixed assets.
(3) Off balance sheet credit risk is stated prior to conversion to credit equivalent (before multiplication by the CCF coefficient).
(4) Credit risk in respect of transactions in derivative financial instruments is presented in terms of credit equivalent, after netting effect and after multiplication by the "add-on" coefficient.

22 Israel Discount Bank Limited and its Subsidiaries
DISTRIBUTION OF EXPOSURES ACCORDING TO MAIN GEOGRAPHICAL AREAS AND PROBLEMATIC DEBTS
ACCORDING TO MAIN GEOGRAPHICAL AREAS
Total Credit Risk⁽¹⁾
Debts⁽²⁾and off-balance sheet Credit Risk (excluding Derivatives)⁽³⁾
Credit Losses⁽⁴⁾
Total
Credit Performance
Rating⁽⁷⁾ Problematic⁽⁵⁾
Total Of which: Debts⁽²⁾⁽⁷⁾ Problematic⁽⁵⁾ Impaired
Periodic Credit
Loss Expenses
Net Accounting Write-Offs
Recognized during the
Period
Balance of Allowance for Credit Losses
in NIS millions
March 31, 2018
Total Commercial 113,172 108,442 2,437
110,420 74,874 2,433 1,516 57 52 1,270
Total Public 202,600 193,058 3,240
199,838 132,230 3,236 1,626 133 118 2,011
Total Lending Activity in Israel 225,983 216,432 3,240
202,855 133,277 3,236 1,626 133 118 2,011
Lending Activity Abroad
Total Commercial 39,675 37,400 1,018
29,280 22,009 1,011 500 (22) (6) 283
Total Public 41,752 39,425 1,025
31,353 23,451 1,018 500 (21) (6) 297
Total Lending Activity Abroad 48,898 46,540 1,056
35,011 27,046 1,018 500 (21) (6) 298
TOTAL 274,881 262,972 4,296 237,866 160,323 4,254 2,126 112 112 2,309
March 31, 2017
Lending Activity in Israel
Total Commercial 102,483 95,919 3,525
100,058 69,053 3,498 2,298 77 123 1,334
Total Public 183,408 173,245 4,281
180,972 122,136 4,254 2,363 148 183 1,966
Total Lending Activity in Israel 208,797 198,630 4,281
183,669 123,302 4,254 2,363 148 183 1,966
Lending Activity Abroad
Total Commercial 41,609 40,010 874
30,901 21,911 861 441 (4) 10 294
Total Public 43,699 42,089 877
32,989 23,412 864 441 (3) 10 310
Total Lending Activity Abroad 51,642 50,000 910
37,350 27,579 864 441 (3) 10 310
TOTAL 260,439 248,630 5,191 221,019 150,881 5,118 2,804 145 193 2,276
December 31, 2017
Lending Activity in Israel
Total Commercial 107,323 103,258 2,695
104,859 71,035 2,691 1,712 232 336 1,268
Total Public 192,023 184,362 3,498
189,541 127,249 3,494 1,800 564 558 1,999
Total Lending Activity in Israel 216,240 208,576 3,498
192,673 128,387 3,494 1,800 565 558 2,000
Lending Activity Abroad
Total Commercial 39,113 36,874 1,123
29,372 22,216 1,110 459 11 24 292
Total Public 41,094 38,839 1,127
31,351 23,619 1,114 459 9 24 305
Total Lending Activity Abroad 47,902 45,615 1,158
34,831 27,035 1,114 459 9 24 305
TOTAL 264,142 254,191 4,656 227,504 155,422 4,608 2,259 574 582 2,305
Footnotes: (1) Balance Sheet and Off-Balance Sheet Credit Risk, including in respect of derivative instruments. Including: Debts(2), bonds, securities borrowed or purchased under resale
agreements, assets in respect of derivative instruments, and credit risk in respect of off-balance sheet financial instruments, as calculated for single borrower liability limitation, guarantees and liabilities on account of clients in an amount of NIS 160,323, 31,911, 682 3,473, 78,492 million, respectively. (As at 31.3.2017 amount of NIS 150,881, 35,237, 369, 3,034, 70,918 million, respectively and As at 31.12.2017 amount of NIS 155,422, 31,815, 954, 2,954, 72,997 million, respectively).
(2) Credit to the Public, Credit to Governments, deposits with banks and other debts, excluding investments in bonds and securities borrowed or purchased under resale agreements. (3) Credit risk in respect of off-balance sheet financial instruments, as calculated for single borrower liability limitation, excluding in respect of derivative instruments. (4) Including in respect of off-balance sheet credit instruments (stated in the balance sheet under "Other liabilities"). (5) Balance sheet and off-balance sheet credit risk, which is impaired, substandard or under special mention, including in respect of housing loans, in respect of which an allowance is
made according to the extent of arrears, and housing loans in respect of which no allowance is made according to the extent of arrears, and are in arrears of 90 days or more. (6) Credit risk, the credit rating thereof at date of reporting matches the credit rating for the granting of new credit in accordance with the Bank's policy of the Bank. (7) The balance of commercial debts includes housing loans in the amount of NIS 255 million, which are combined in the layout of transactions and collateral of commercial borrowers'
business, or which were granted to acquisition groups, the projects being built by them are in the course of construction.(As at 31.3.2017 amount of NIS 258 million, As at 31.12.2017 amount of NIS 250 million).
First Quarter of 2018 Disclosure according to the third pillar of Basel and additional information regarding
risks 23
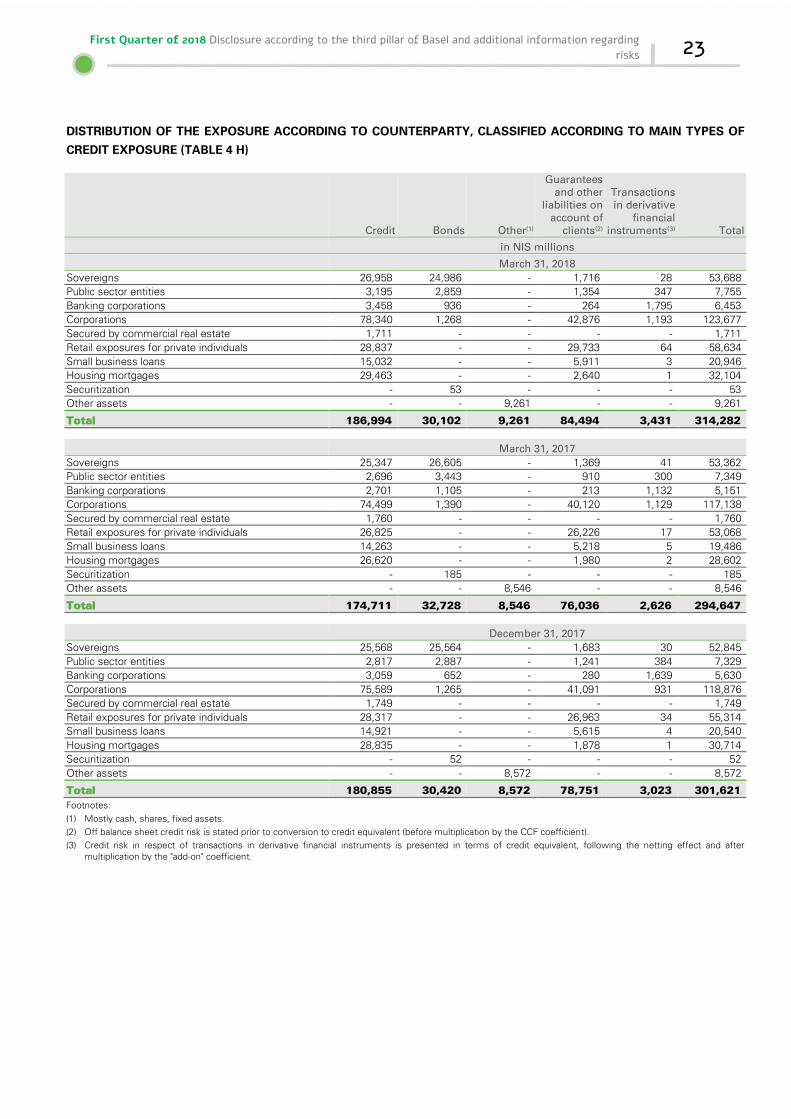
DISTRIBUTION OF THE EXPOSURE ACCORDING TO COUNTERPARTY, CLASSIFIED ACCORDING TO MAIN TYPES OF
CREDIT EXPOSURE (TABLE 4 H)
Credit Bonds Other⁽¹⁾
Guarantees and other
liabilities on account of
clients⁽²⁾
Transactions in derivative
financial instruments⁽³⁾ Total
in NIS millions
March 31, 2018
Sovereigns 26,958 24,986 - 1,716 28 53,688
Public sector entities 3,195 2,859 - 1,354 347 7,755
Banking corporations 3,458 936 - 264 1,795 6,453
Corporations 78,340 1,268 - 42,876 1,193 123,677
Secured by commercial real estate 1,711 - - - - 1,711
Retail exposures for private individuals 28,837 - - 29,733 64 58,634
Small business loans 15,032 - - 5,911 3 20,946
Housing mortgages 29,463 - - 2,640 1 32,104
Securitization - 53 - - - 53
Other assets - - 9,261 - - 9,261
Total 186,994 30,102 9,261 84,494 3,431 314,282
March 31, 2017
Sovereigns 25,347 26,605 - 1,369 41 53,362
Public sector entities 2,696 3,443 - 910 300 7,349
Banking corporations 2,701 1,105 - 213 1,132 5,151
Corporations 74,499 1,390 - 40,120 1,129 117,138
Secured by commercial real estate 1,760 - - - - 1,760
Retail exposures for private individuals 26,825 - - 26,226 17 53,068
Small business loans 14,263 - - 5,218 5 19,486
Housing mortgages 26,620 - - 1,980 2 28,602
Securitization - 185 - - - 185
Other assets - - 8,546 - - 8,546
Total 174,711 32,728 8,546 76,036 2,626 294,647
December 31, 2017
Sovereigns 25,568 25,564 - 1,683 30 52,845
Public sector entities 2,817 2,887 - 1,241 384 7,329
Banking corporations 3,059 652 - 280 1,639 5,630
Corporations 75,589 1,265 - 41,091 931 118,876
Secured by commercial real estate 1,749 - - - - 1,749
Retail exposures for private individuals 28,317 - - 26,963 34 55,314
Small business loans 14,921 - - 5,615 4 20,540
Housing mortgages 28,835 - - 1,878 1 30,714
Securitization - 52 - - - 52
Other assets - - 8,572 - - 8,572
Total 180,855 30,420 8,572 78,751 3,023 301,621
Footnotes:
(1) Mostly cash, shares, fixed assets.
(2) Off balance sheet credit risk is stated prior to conversion to credit equivalent (before multiplication by the CCF coefficient).
(3) Credit risk in respect of transactions in derivative financial instruments is presented in terms of credit equivalent, following the netting effect and after multiplication by the "add-on" coefficient.

24 Israel Discount Bank Limited and its Subsidiaries
DIVISION OF THE PORTFOLIO ACCORDING TO REMAINING CONTRACTUAL MATURITY PERIODS (TABLE 4 E)
Up to 1 year
Over 1 year and up to 5 years Over 5 years
No fixed maturity date⁽²⁾ Total Cash Flow
March 31, 2018
Credit 104,829 57,684 40,584 1,132 ⁽¹⁾204,229
Bonds 7,481 15,262 14,952 - 37,695
Others⁽³⁾ 3,199 376 948 4,763 9,286
Guarantees and other liabilities on account of clients⁽⁴⁾ 55,516 19,272 1,744 8,032 84,564
Transactions in derivative financial instruments⁽⁵⁾ 1,819 1,433 575 608 4,435
Total 172,844 94,027 58,803 14,535 340,209
March 31, 2017
Credit 97,600 54,143 38,092 1,633 191,468
Bonds 6,589 19,160 14,878 - 40,627
Others⁽³⁾ 2,671 457 691 4,760 8,579
Guarantees and other liabilities on account of clients⁽⁴⁾ 49,594 19,315 (6)351 (6)6,765 76,025
Transactions in derivative financial instruments⁽⁵⁾ 1,505 1,401 574 359 3,839
Total 157,959 94,476 54,586 13,517 320,538
December 31, 2017
Credit 99,478 55,682 40,111 1,919 197,190
Bonds 7,052 16,560 13,294 - 36,906
Others⁽³⁾ 2,759 320 937 4,585 8,601
Guarantees and other liabilities on account of clients⁽⁴⁾ 50,268 19,390 (6)1,853 (6)7,280 78,791
Transactions in derivative financial instruments⁽⁵⁾ 1,441 1,303 475 668 3,887
Total 160,998 93,255 56,670 14,452 325,375 Footnotes:
(1) This note presents the anticipated future contractual cash flows in respect of the exposures, according to the remaining periods to the contractual maturity date of each cash flow. The data is shown net of the allowance for credit losses, the allocation of which over periods is made in accordance with an estimate based on the credit periods in respect of which they were made.
(2) Including assets whose maturity data has passed in the amount of NIS 297 million (March 31,2017: NIS 444 million, December 31, 2017: NIS 347 million).
(3) Primarily: cash, shares, fixed assets.
(4) Off balance sheet credit risk is pre conversion to credit equivalent (pre multiplying by CCF coefficient).
(5) Presented as calculated for the purpose of limitation on borrowers indebtedness.
(6) Reclassified.
First Quarter of 2018 Disclosure according to the third pillar of Basel and additional information regarding
risks 25
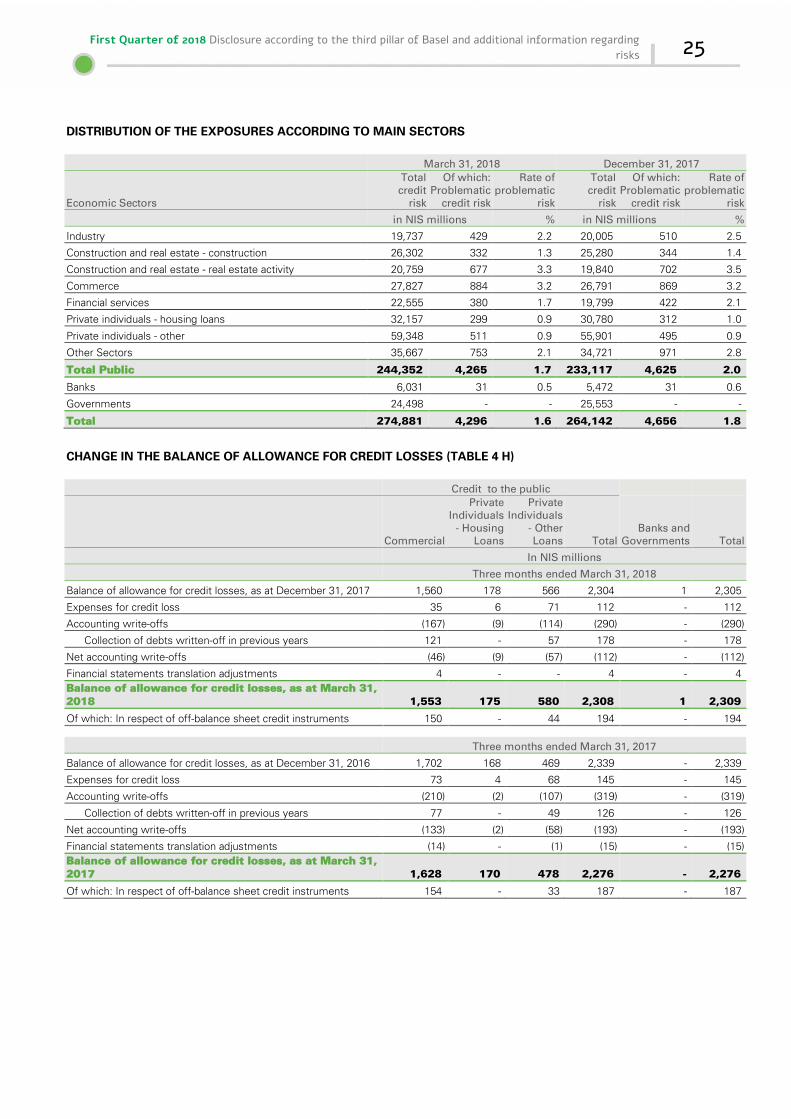
DISTRIBUTION OF THE EXPOSURES ACCORDING TO MAIN SECTORS
March 31, 2018 December 31, 2017
Economic Sectors
Total credit
risk
Of which: Problematic
credit risk
Rate of problematic
risk
Total credit
risk
Of which: Problematic
credit risk
Rate of problematic
risk
in NIS millions % in NIS millions %
Industry 19,737 429 2.2 20,005 510 2.5
Construction and real estate - construction 26,302 332 1.3 25,280 344 1.4
Construction and real estate - real estate activity 20,759 677 3.3 19,840 702 3.5
Commerce 27,827 884 3.2 26,791 869 3.2
Financial services 22,555 380 1.7 19,799 422 2.1
Private individuals - housing loans 32,157 299 0.9 30,780 312 1.0
Private individuals - other 59,348 511 0.9 55,901 495 0.9
Other Sectors 35,667 753 2.1 34,721 971 2.8
Total Public 244,352 4,265 1.7 233,117 4,625 2.0
Banks 6,031 31 0.5 5,472 31 0.6
Governments 24,498 - - 25,553 - -
Total 274,881 4,296 1.6 264,142 4,656 1.8
CHANGE IN THE BALANCE OF ALLOWANCE FOR CREDIT LOSSES (TABLE 4 H)
Credit to the public
Commercial
Private Individuals
- Housing Loans
Private Individuals
- Other Loans Total
Banks and Governments Total
In NIS millions
Three months ended March 31, 2018
Balance of allowance for credit losses, as at December 31, 2017 1,560 178 566 2,304 1 2,305
Expenses for credit loss 35 6 71 112 - 112
Accounting write-offs (167) (9) (114) (290) - (290)
Collection of debts written-off in previous years 121 - 57 178 - 178
Net accounting write-offs (46) (9) (57) (112) - (112)
Financial statements translation adjustments 4 - - 4 - 4
Balance of allowance for credit losses, as at March 31, 2018 1,553 175 580 2,308 1 2,309
Of which: In respect of off-balance sheet credit instruments 150 - 44 194 - 194
Three months ended March 31, 2017
Balance of allowance for credit losses, as at December 31, 2016 1,702 168 469 2,339 - 2,339
Expenses for credit loss 73 4 68 145 - 145
Accounting write-offs (210) (2) (107) (319) - (319)
Collection of debts written-off in previous years 77 - 49 126 - 126
Net accounting write-offs (133) (2) (58) (193) - (193)
Financial statements translation adjustments (14) - (1) (15) - (15)
Balance of allowance for credit losses, as at March 31, 2017 1,628 170 478 2,276 - 2,276
Of which: In respect of off-balance sheet credit instruments 154 - 33 187 - 187

26 Israel Discount Bank Limited and its Subsidiaries
Exposure amounts according to risk weights(2)(1) (Table 5)
AMOUNT OF EXPOSURE AFTER ALLOWANCE FOR CREDIT LOSSES AND BEFORE CREDIT RISK MITIGATION
0% 2% 20% 35% 50% 75% 100% 150% 250% Total
in NIS millions
March 31, 2018
Sovereigns 50,219 - 1,991 - 43 - 1,435 - - 53,688
Public sector entities - - 4,459 - 3,275 - 13 - - 7,747
Banking corporations - - 5,385 - 995 - 71 - - 6,451
Corporations - 829 1,604 - 625 - 119,507 1,111 - 123,676
Commercial real estate - - - - - - 1,698 5 - 1,703
Retail exposures for private individuals - - - - - 58,190 193 200 - 58,583
Small business loans - - - - - 20,447 70 194 - 20,711
Housing mortgages - - - 11,507 8,464 11,181 733 66 - 31,951
Securitization - - 53 - - - - - - 53
Other 3,025 - 3 - - - 3,399 1,101 1,733 9,261
Total 53,244 829 13,495 11,507 13,402 89,818 127,119 2,677 1,733 313,824
March 31, 2017
Sovereigns 50,816 - 2,053 - 4 - 489 - - 53,362
Public sector entities - - 4,821 - 2,524 - - 1 - 7,346
Banking corporations - - 4,222 - 861 - 67 - - 5,150
Corporations - 824 1,708 - 409 - 112,284 1,911 - 117,136
Commercial real estate - - - - - - 1,751 2 - 1,753
Retail exposures for private individuals - - - - - 52,610 122 165 - 52,897
Small business loans - - - - - 19,026 94 179 - 19,299
Housing mortgages - - - 11,251 6,753 9,519 862 64 - 28,449
Securitization - - 183 - 2 - - - - 185
Other 2,471 - 13 - - - -3,328 1,122 -1,612 8,546
Total 53,287 824 13,000 11,251 10,553 81,155 118,997 3,444 1,612 294,123
December 31, 2017
Sovereigns 49,282 - 2,106 - 19 - 1,438 - - 52,845
Public sector entities - - 4,385 - 2,936 - - - - 7,321
Banking corporations - - 4,506 - 1,003 - 121 - - 5,630
Corporations - 1,092 1,529 - 705 - 114,296 1,231 - 118,853
Commercial real estate - - - - - - 1,741 2 - 1,743
Retail exposures for private individuals - - - - - 54,867 194 173 - 55,234
Small business loans - - - - - 20,047 66 197 - 20,310
Housing mortgages - - - 11,359 7,806 10,581 746 65 - 30,557
Securitization - - 52 - - - - - - 52
Other 2,504 - 1 - - - 3,296 1,071 1,700 8,572
Total 51,786 1,092 12,579 11,359 12,469 85,495 121,898 2,739 1,700 301,117 For footnotes see next page.
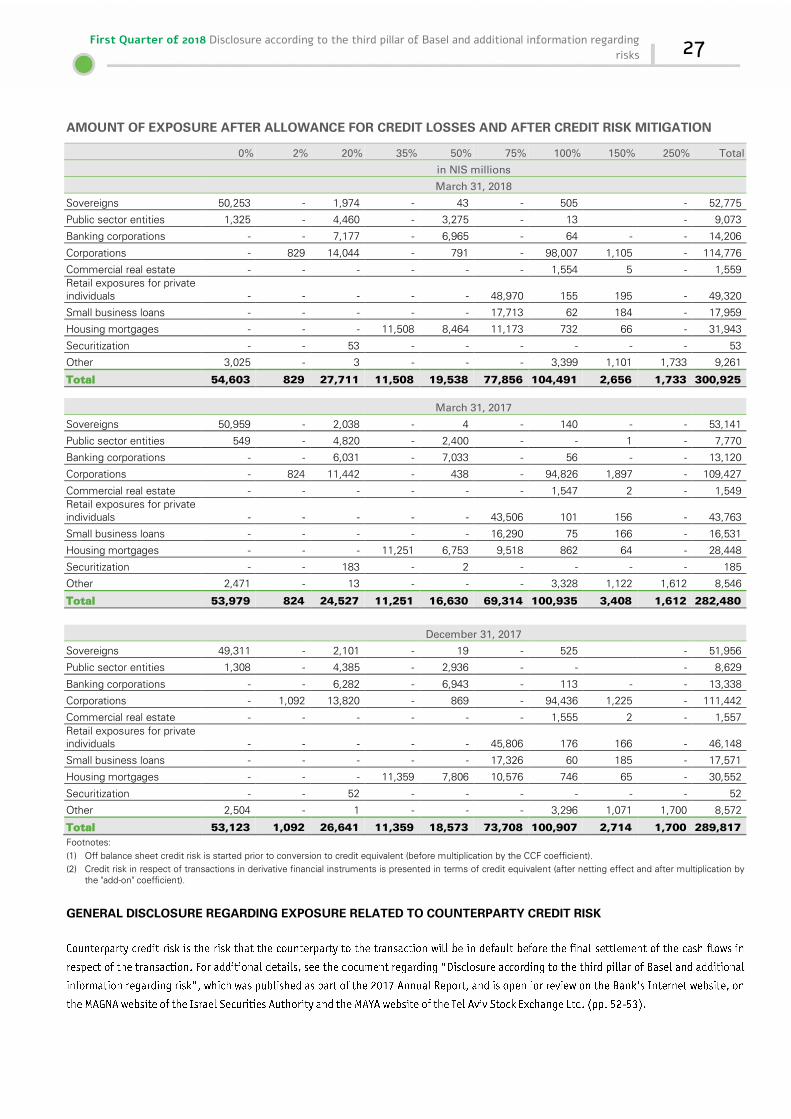
First Quarter of 2018 Disclosure according to the third pillar of Basel and additional information regarding
risks 27
AMOUNT OF EXPOSURE AFTER ALLOWANCE FOR CREDIT LOSSES AND AFTER CREDIT RISK MITIGATION
0% 2% 20% 35% 50% 75% 100% 150% 250% Total
in NIS millions
March 31, 2018
Sovereigns 50,253 - 1,974 - 43 - 505 - 52,775
Public sector entities 1,325 - 4,460 - 3,275 - 13 - 9,073
Banking corporations - - 7,177 - 6,965 - 64 - - 14,206
Corporations - 829 14,044 - 791 - 98,007 1,105 - 114,776
Commercial real estate - - - - - - 1,554 5 - 1,559
Retail exposures for private individuals - - - - - 48,970 155 195 - 49,320
Small business loans - - - - - 17,713 62 184 - 17,959
Housing mortgages - - - 11,508 8,464 11,173 732 66 - 31,943
Securitization - - 53 - - - - - - 53
Other 3,025 - 3 - - - 3,399 1,101 1,733 9,261
Total 54,603 829 27,711 11,508 19,538 77,856 104,491 2,656 1,733 300,925
March 31, 2017
Sovereigns 50,959 - 2,038 - 4 - 140 - - 53,141
Public sector entities 549 - 4,820 - 2,400 - - 1 - 7,770
Banking corporations - - 6,031 - 7,033 - 56 - - 13,120
Corporations - 824 11,442 - 438 - 94,826 1,897 - 109,427
Commercial real estate - - - - - - 1,547 2 - 1,549
Retail exposures for private individuals - - - - - 43,506 101 156 - 43,763
Small business loans - - - - - 16,290 75 166 - 16,531
Housing mortgages - - - 11,251 6,753 9,518 862 64 - 28,448
Securitization - - 183 - 2 - - - - 185
Other 2,471 - 13 - - - 3,328 1,122 1,612 8,546
Total 53,979 824 24,527 11,251 16,630 69,314 100,935 3,408 1,612 282,480
December 31, 2017
Sovereigns 49,311 - 2,101 - 19 - 525 - 51,956
Public sector entities 1,308 - 4,385 - 2,936 - - - 8,629
Banking corporations - - 6,282 - 6,943 - 113 - - 13,338
Corporations - 1,092 13,820 - 869 - 94,436 1,225 - 111,442
Commercial real estate - - - - - - 1,555 2 - 1,557
Retail exposures for private individuals - - - - - 45,806 176 166 - 46,148
Small business loans - - - - - 17,326 60 185 - 17,571
Housing mortgages - - - 11,359 7,806 10,576 746 65 - 30,552
Securitization - - 52 - - - - - - 52
Other 2,504 - 1 - - - 3,296 1,071 1,700 8,572
Total 53,123 1,092 26,641 11,359 18,573 73,708 100,907 2,714 1,700 289,817
Footnotes:
(1) Off balance sheet credit risk is started prior to conversion to credit equivalent (before multiplication by the CCF coefficient).
(2) Credit risk in respect of transactions in derivative financial instruments is presented in terms of credit equivalent (after netting effect and after multiplication by the "add-on" coefficient).
GENERAL DISCLOSURE REGARDING EXPOSURE RELATED TO COUNTERPARTY CREDIT RISK

28 Israel Discount Bank Limited and its Subsidiaries
Disclosure regarding derivatives (Table 8)
March 31,
December 31,
2018 2017 2017
in NIS millions
Gross positive fair value of contracts⁽¹⁾ Interest rate contracts: Shekel/CPI 167 175 163
Other 1,391 1,489 1,103
Foreign currency contracts 1,292 1,002 1,004
Contracts on shares 640 392 703
Commodities and other contracts 1 - 2
Total Gross positive fair value of contracts 3,491 3,058 2,975
Potential off balance sheet exposure⁽²⁾ 2,698 2,249 2,449
Netting benefits (2,758) (2,681) (2,401)
Current credit exposure after netting⁽²⁾ 3,431 2,626 3,023
Held collateral (401) (265) (266)
Net credit exposure in respect of derivatives 3,030 2,361 2,757
Footnotes:
(1) Including embedded derivatives in the amount of NIS 19 million (March 31,2017 NIS 24 million .December 31,2017 NIS 22 million).
(2) Potential off-balance sheet credit exposure with respect to derivative instruments is calculated based on the notional principal amount of the entire counter-party portfolio, multiplied by the "Add-on" coefficient.
ACTIVITY IN DERIVATIVE FINANCIAL INSTRUMENTS
SECURITIZATION EXPOSURE
SECURITIZATION EXPOSURE (TABLE 9)

First Quarter of 2018 Disclosure according to the third pillar of Basel and additional information regarding
risks 29
SECURITIZATION EXPOSURE
Total exposure
March 31
December 31
2018 2017 2017
in NIS millions
Mortgage-backed securities (MBS): Other mortgage-backed securities (including CMO, REMIC and
STRIPPED MBS)
- 2 -
Total mortgage-backed securities
- 2 -
Asset-backed securities (ABS): Collaterized bonds CLO
53 183 53
Total asset-backed securities
53 183 53
Total mortgage and asset-backed securities
53 185 53
March 31 December 31
2018 2017 2017
Exposure
Capital requirements Exposure
Capital requirements Exposure
Capital requirements
12.7%
12.7%
12.7%
in NIS millions
Risk weights: 20% 53 1 183 5 53 1
50% - - 2 - - -
Total 53 1 185 5 53 1
ADDITIONAL DISCLOSURE REGARDING CREDIT RISK IN RESPECT OF SIGNIFICANT EXPOSURE TO GROUPS OF
BORROWERS
MARKET RISKS

30 Israel Discount Bank Limited and its Subsidiaries
Quantitative disclosure
(1) INTEREST RISK EXPOSURE
General
Relation between balance sheet items and the positions included in the disclosure of
Market risk

First Quarter of 2018 Disclosure according to the third pillar of Basel and additional information regarding
risks 31
RELATION BETWEEN BALANCE SHEET ITEMS AND THE POSITIONS INCLUDED IN THE DISCLOSURE OF MARKET RISK
Assets
Affect of 100 BP for end of
the first quarter
Affect of 100 BP for end of
2017 Liabilities
Affect of 100 BP for end of
the first quarter
Affect of 100 BP for end of
2017
March 31,
2018 December 31,
2017
March 31, 2018
December 31, 2017
In NIS millions
Credit 1,619 1,578 Deposits 723 714
Available-for-sale securities portfolio 868 741 Debt notes 236 255
Trading securities portfolio 62 53 Off balance-sheet 235 224
Held-to-maturity securities portfolio 145 123 Current account spreading 877 865
Off balance-sheet - - Employees rights 278 261
Other 53 51 Other 2 (2)
Total 2,747 2,546 Total 2,351 2,317
THE CHARACTERISTICS OF INTEREST RATE RISK WITH RESPECT TO THE BANKING BOOK
DETAILS OF THE EFFECT OF PARALLEL CHANGES OF 100 BASE POINTS IN THE INTEREST RATE APPLYING TO THE BANKING BOOK
The change in interest rates Non-linked CPI linked US dollar Other foreign
currency Total
In NIS millions
For the quarter ended March 31, 2018
An increase of 100BP in interest rates (165) (43) (141) 13 (337)
A decrease of 100BP in interest rates 339 32 (18) (11) 342
For the year ended December 31, 2017
An increase of 100BP in interest rates (87) (32) (58) 3 (175)
A decrease of 100BP in interest rates 244 23 (141) (10) 116
PRINCIPAL INDICES FOR MANAGEMENT
DETAILS OF THE GROUP EXPOSURE AND LIMITATIONS - IN THE INDEX OF ECONOMIC VALUE SENSITIVITY TO PARALLEL CHANGES IN INTEREST GRAPHS BY 100 BASE POINTS (THE EVE MODEL)
For the year ended on
March 31, 2018 December 31, 2017
End of reporting year
Maximum exposure
during the year End of
reporting year
Maximum exposure
during the year
in NIS millions
Actual exposure (396) (396) (238) (238)
Limitation set by the Board of Directors 720 720 709 709
The scenario in which the exposure was measured UP 100 UP 100 UP 100 UP 100

32 Israel Discount Bank Limited and its Subsidiaries
DETAILS OF THE GROUP EXPOSURE AND LIMITATIONS - REDUCTION IN ACCOUNTING VALUE IN INTERMEDIARY SCENARIOS
For the year ended on
March 31, 2018 December 31, 2017
End of first quarter 2018
Maximum exposure
during the quarter
End of reporting year
2017
Maximum exposure
during the year 2017
in NIS millions
Actual exposure (415) (415) (258) (502)
Limitation set by the Board of Directors (800) - 788 -
Indices and additional models
DETAILS OF THE EXPOSURE IN TERMS OF TOTAL VAR
For the period ended on
March 31, 2018 December 31, 2017
End of reporting
period
Maximum exposure
during the quarter
End of reporting
period
Maximum exposure
during the year
in %
Actual exposure 1.6% 1.6% 0.9% 0.9%
Limitation set by the Board of Directors 3.0% 3.0% 3.0% 3.0%
DETAILS OF THE EXPOSURE IN TERMS OF - VAR IN TRADING ACTIVITY
For the end of quarter ended on March 31, 2018 For the end of 2017
End of the quarter
Maximum exposure
during the year
End of reporting
quarter
Maximum exposure
during the year
in NIS millions
Actual exposure 16.3 20.2 6.8 19.0
Limitation set by the Board of Directors 54
54 Note:
The VaR is computed at level of significance of 99% and for time span of 10 days.

First Quarter of 2018 Disclosure according to the third pillar of Basel and additional information regarding
risks 33
(4) BASE RISK EXPOSURE
ACTUAL DISTRIBUTION OF INVESTMENT OF THE EQUITY IN RELATION TO THE SET LIMITATIONS (THE DATA IS STATED IN RELATION TO THE EQUITY)
First Quarter of 2018 2017
Range of exposure
Segment Limitation Period end from to average
Year end from to
CPI linked 25%-(25%) %11.9 %5.9 %11.9 %8.0 6.7% 6.7% 16.4%
Foreign currency 15% - 40% %20.8 %20.4 %21.0 %20.7 21.6% 21.6% 25.4%
(5) Management of positions in the trading portfolio

34 Israel Discount Bank Limited and its Subsidiaries
DATA (ACCOUNTING) AS TO THE VOLUME OF OPERATION IN DERIVATIVE FINANCIAL INSTRUMENTS OF THE BANK AND ITS CONSOLIDATED SUBSIDIARIES
March 31, 2018 December 31, 2017
in NIS millions
Hedging derivatives 1,806 1,749
ALM derivatives 32,021 33,245
Other derivatives 205,695 171,124
SPOT foreign currency swap contracts 4,355 2,492
Total 243,877 208,610
First Quarter of 2018 Disclosure according to the third pillar of Basel and additional information regarding
risks 35
(6) The standardized approach to the allocation of Capital to Market Risks
DETAILS OF CAPITAL ALLOCATION TO MARKET RISKS ACCORDING TO THE STANDARDIZED APPROACH
Capital allocation as of
March 31, 2018
December 31, 2017
In NIS millions
Interest rate risk* 428 311
Foreign exchange rate risk 32 53
Share risk 1 9
Option risk 5 63
Total for the Banking Group 466 437
Allocation in risk asset terms 3,677 3,443 * Including the specific risk in the amount of NIS 35 million and NIS 20 million in March 2018 and December 2017, respectively.
Shares position in the Banking book (Table 13) Strategy and processes

36 Israel Discount Bank Limited and its Subsidiaries
DETAILS REGARDING INVESTMENTS IN SHARES
March 31
December 31
2018 2017 2017
In NIS millions
Investments in shares of affiliated companies⁽¹⁾: Non marketable shares 120 147 153
Shares in the available-for-sale portfolio: Marketable shares 43 76 37
Non marketable shares 837 865 814
Total shares in the available for sale portfolio 880 941 851
Total investment in shares 1,000 1,088 1,004 Footnote: (1) For additional information see Note 15 to the Financial Statements as of December 31, 2017.
CAPITAL REQUIREMENT REGARDING SHARE POSITION
March 31
December 31
2018 2017 2017
In NIS millions
In respect of investments in venture capital funds, in private equity funds and in a fund of hedge funds⁽²⁾ 163 168 160
In respect of investments in other shares⁽³⁾ 56 60 59
Total capital requirement regarding share position⁽¹⁾ 219 228 219
Footnotes:
(1) The capital requirement was computed according to 12.7% and does not include capital requirement in respect of investment in shares in the trading portfolio.
(2) These investments are weighted at risk weight of 150%.
(3) These investments are weighted at risk weight of 100% and 250%.
LIQUIDITY AND FINANCE RISKS
Liquidity coverage ratio

First Quarter of 2018 Disclosure according to the third pillar of Basel and additional information regarding
risks 37
DETAILS OF THE COMPOSITION OF THE LIQUIDITY BUFFER
For the quarter ended
Assets included March 31, 2018
December 31, 2017
in NIS millions
Buffer 1 Cash 21,058 18,775
Israel Bonds/Short-term loans (MAKAM) 18,240 19,537
Foreign bonds 4,479 3,986
Buffer 2 Sovereigns bonds 353 242
Mortgage bonds issued by public corporations 1,027 902
Corporation Bonds AA 885 871
Buffer 2 b Corporation Bonds A 89 98
Total 46,131 44,410
DISTRIBUTION OF THE LIQUIDITY COVERAGE RATIO (AVERAGE FOR THE QUARTER) ACCORDING TO THE LEGAL ENTITIES WITHIN THE GROUP
For the period ended
March 31, 2018
December 31, 2017
In %
Discount Group 135.1% 126.7%
The Bank 153.2% 143.7%
IDB New York 119.1% 121.1%
Mercantile Discount Bank 152.1% 139.6%
Discount Group 135.1% 126.7%
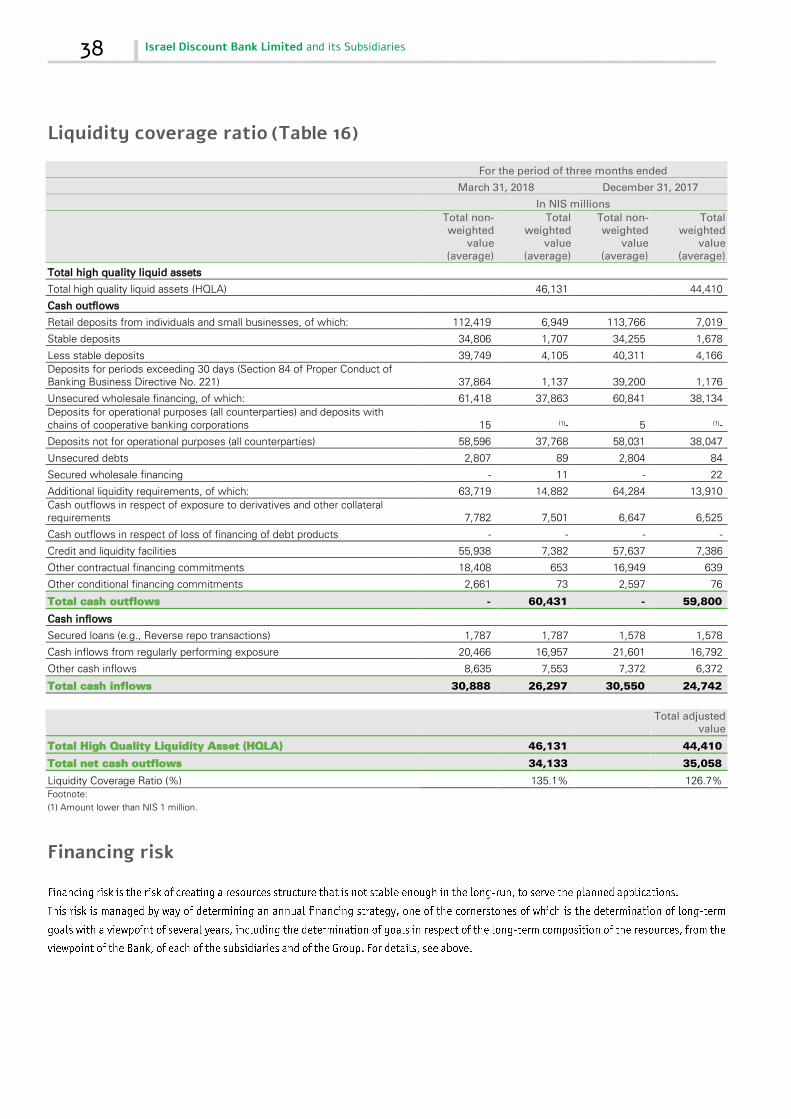
38 Israel Discount Bank Limited and its Subsidiaries
Liquidity coverage ratio (Table 16)
For the period of three months ended
March 31, 2018 December 31, 2017
In NIS millions
Total non-weighted
value (average)
Total weighted
value (average)
Total non-weighted
value (average)
Total weighted
value (average)
Total high quality liquid assets Total high quality liquid assets (HQLA)
46,131
44,410
Cash outflows Retail deposits from individuals and small businesses, of which: 112,419 6,949 113,766 7,019
Stable deposits 34,806 1,707 34,255 1,678
Less stable deposits 39,749 4,105 40,311 4,166
Deposits for periods exceeding 30 days (Section 84 of Proper Conduct of Banking Business Directive No. 221) 37,864 1,137 39,200 1,176
Unsecured wholesale financing, of which: 61,418 37,863 60,841 38,134
Deposits for operational purposes (all counterparties) and deposits with chains of cooperative banking corporations 15 ⁽¹⁾- 5 ⁽¹⁾-
Deposits not for operational purposes (all counterparties) 58,596 37,768 58,031 38,047
Unsecured debts 2,807 89 2,804 84
Secured wholesale financing - 11 - 22
Additional liquidity requirements, of which: 63,719 14,882 64,284 13,910
Cash outflows in respect of exposure to derivatives and other collateral requirements 7,782 7,501 6,647 6,525
Cash outflows in respect of loss of financing of debt products - - - -
Credit and liquidity facilities 55,938 7,382 57,637 7,386
Other contractual financing commitments 18,408 653 16,949 639
Other conditional financing commitments 2,661 73 2,597 76
Total cash outflows - 60,431 - 59,800
Cash inflows Secured loans (e.g., Reverse repo transactions) 1,787 1,787 1,578 1,578
Cash inflows from regularly performing exposure 20,466 16,957 21,601 16,792
Other cash inflows 8,635 7,553 7,372 6,372
Total cash inflows 30,888 26,297 30,550 24,742
Total adjusted value
Total High Quality Liquidity Asset (HQLA)
46,131
44,410
Total net cash outflows
34,133
35,058
Liquidity Coverage Ratio (%)
135.1%
126.7% Footnote:
(1) Amount lower than NIS 1 million.
Financing risk

First Quarter of 2018 Disclosure according to the third pillar of Basel and additional information regarding
risks 39
Financing risk - available and unrestricted assets
31.03.2018 31.12.2017
in NIS millions
Total available assets 63,756 58,962
Liquidity requirement 5,734 5,625
Of which pledged 7,022 5,840
Of which provided as collateral 423 886
Total available assets 50,576 46,611
OPERATIONAL RISKS
OTHER RISKS
Directive in the matter of "supervision over overseas extensions"
Data and cyber protection risks
Threats in the cyberspace
40 Israel Discount Bank Limited and its Subsidiaries
Compliance risks
Prohibition of money laundering and terror financing
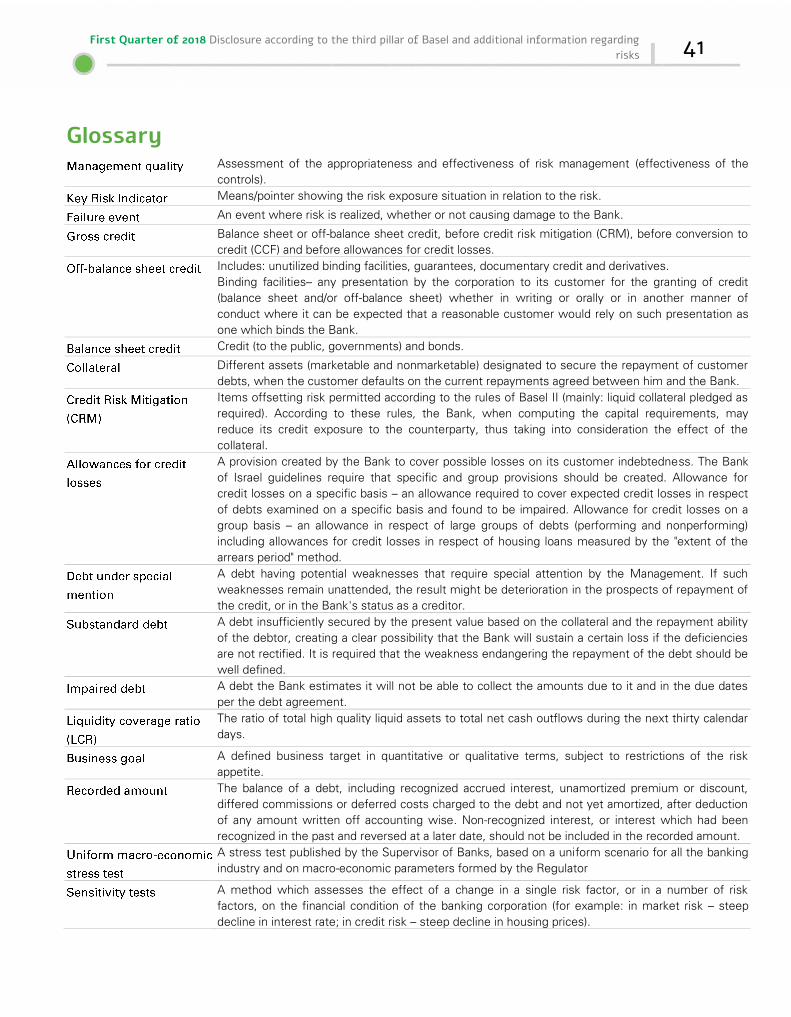
First Quarter of 2018 Disclosure according to the third pillar of Basel and additional information regarding
risks 41
Glossary Assessment of the appropriateness and effectiveness of risk management (effectiveness of the
controls).
Means/pointer showing the risk exposure situation in relation to the risk.
An event where risk is realized, whether or not causing damage to the Bank.
Balance sheet or off-balance sheet credit, before credit risk mitigation (CRM), before conversion to
credit (CCF) and before allowances for credit losses.
Includes: unutilized binding facilities, guarantees, documentary credit and derivatives.
Binding facilities– any presentation by the corporation to its customer for the granting of credit
(balance sheet and/or off-balance sheet) whether in writing or orally or in another manner of
conduct where it can be expected that a reasonable customer would rely on such presentation as
one which binds the Bank.
Credit (to the public, governments) and bonds.
Different assets (marketable and nonmarketable) designated to secure the repayment of customer
debts, when the customer defaults on the current repayments agreed between him and the Bank.
Items offsetting risk permitted according to the rules of Basel II (mainly: liquid collateral pledged as
required). According to these rules, the Bank, when computing the capital requirements, may
reduce its credit exposure to the counterparty, thus taking into consideration the effect of the
collateral.
A provision created by the Bank to cover possible losses on its customer indebtedness. The Bank
of Israel guidelines require that specific and group provisions should be created. Allowance for
credit losses on a specific basis – an allowance required to cover expected credit losses in respect
of debts examined on a specific basis and found to be impaired. Allowance for credit losses on a
group basis – an allowance in respect of large groups of debts (performing and nonperforming)
including allowances for credit losses in respect of housing loans measured by the "extent of the
arrears period" method.
A debt having potential weaknesses that require special attention by the Management. If such
weaknesses remain unattended, the result might be deterioration in the prospects of repayment of
the credit, or in the Bank's status as a creditor.
A debt insufficiently secured by the present value based on the collateral and the repayment ability
of the debtor, creating a clear possibility that the Bank will sustain a certain loss if the deficiencies
are not rectified. It is required that the weakness endangering the repayment of the debt should be
well defined.
A debt the Bank estimates it will not be able to collect the amounts due to it and in the due dates
per the debt agreement.
The ratio of total high quality liquid assets to total net cash outflows during the next thirty calendar
days.
A defined business target in quantitative or qualitative terms, subject to restrictions of the risk
appetite.
The balance of a debt, including recognized accrued interest, unamortized premium or discount,
differed commissions or deferred costs charged to the debt and not yet amortized, after deduction
of any amount written off accounting wise. Non-recognized interest, or interest which had been
recognized in the past and reversed at a later date, should not be included in the recorded amount.
A stress test published by the Supervisor of Banks, based on a uniform scenario for all the banking
industry and on macro-economic parameters formed by the Regulator
A method which assesses the effect of a change in a single risk factor, or in a number of risk
factors, on the financial condition of the banking corporation (for example: in market risk – steep
decline in interest rate; in credit risk – steep decline in housing prices).

42 Israel Discount Bank Limited and its Subsidiaries
Glossary (continued) A statement determined by the Bank, setting out a limit to activity within the framework of the risk
appetite.
A detailed plan of the capital ratios forecast for the coming years, which includes the assumptions used
for the forecast, a description of the expected implications in the capital layers and capital ratios,
sensitivity analysis regarding the principal risks, and conformity by the Bank with the capital targets. The
capital outline serves as a basis for the determination of a recommendation to the Management and to
the Board of Directors regarding the capital targets of the work plan, including the capital buffer, the risk
asset budget, capital issuance and dividend distribution.
Transactions in derivatives not traded on a formal stock exchange, to which the Bank is a party.
Monitoring changes in risk assets and in the capital base of the Group, and an assessment of attaining
the capital targets as determined by the Board of Directors.
Intended to indicate exposure to risk when it reaches a certain level below the stated restriction.
Assessment of the combined risk inherent in the exposures and in the activity of the Bank
Reflects the level of risk a corporation is ready to accept, consistently with its business strategy, capital
planning, liquidity planning and financing resources of the corporation. The risk appetite includes
quantitative restrictions and qualitative goals, which outline the determination of the group business
policy in the various risk fields, and comprises a central tool of the Board of Directors for the
supervision and control of the risk profile of the corporation.
Securities not classified as bonds held to maturity or as trading securities.
Composed of positions in financial instruments held with the intension of trading, for the purpose of
resale within a short period of time, and/or with the intent of earning gains from actual or expected
changes in prices in the short-term or of realizing arbitrage gains. In order for a financial instrument to
be considered part of the trading portfolio, it has to be free of any treaty on its marketability, or that it
may be hedged in full.
Securities in respect of which the Bank has the intention and ability to hold them for a long period of
time/to maturity. The portfolio is stated at the rate of return to maturity inherent therein since purchase
date.
A risk management method used to assess the potential effects of a specific event and/or a change in a
set of financial variables on the financial condition of a banking corporation. Traditionally, the focus of
stress tests is on exceptional events though reasonable.
Conversion of off-balance sheet items to credit equivalents – according to the standardized approach of
Basel II, off-balance sheet items are converted to equivalent credit exposure by means of credit
conversion coefficients
An Annex to the ISDA which regularizes the matter of collateral regarding derivative transactions
against the counterparty. This Annex determines a threshold amount reflecting the maximum exposure
which each of the counterparties is ready to accept without collateral.
An international agreement which allows the setting off of liabilities and mutual requirements stemming
from over the counter derivative transactions, in the case of insolvency of a counterparty.
In order to reduce tax evasion by American taxpayers, the Foreign Account Tax Compliance Act (FATCA) was enacted in 2010 in the United States. Under the FATCA provisions, financial bodies outside the US are required to identify and report to the U.S. Tax Authorities, any U.S. citizen or any U.S. resident having a financial account with them. This Regulation entered to effect on July 1, 2014. The Regulation is being implemented in many countries, including Israel, within the framework of an inter-state treaty signed by Israel and the United States.