Embed Size (px)
Citation preview

1
Link-Based Methods for Web
Information Retrieval
MSc Thesis
written by
Clive Nettey
under the supervision of Dr. ir. Jaap Kamps, and submitted to the Board of Examiners
in partial fulfilment of the requirements for the degree of
MSc in Logic
at the Universiteit van Amsterdam
Date of public defense: Members of the Thesis Committee:
6th March 2006 Dr. ir. Jaap Kamps
Prof. dr. Maarten de Rijke
Dr. Peter van Emde Boas
INSTITUTE FOR LOGIC, LANGUAGE AND COMPUTATION

2
Acknowledgements
Without the support and patience of my supervisor: Dr. ir. Jaap Kamps, this thesis
may well not have materialised. Jaap has taught me many lessons that will stay with
me long from now – amongst which is the benefit of perceiving a half empty glass as
half full.
I owe a debt of gratitude to my employers PricewaterhouseCoopers (in particular
Martin Beckwith-Brown and Anthony Faucher) who have supported me through my
endeavours above and beyond the call of duty.
I dedicate this thesis to my family. In particular, my mother Ruby, father Ebenezer,
elder brothers: Prof. dr. I.R. Nettey, Mr. William Adjei, Mr. Ian Nettey, Mr. Ebenezer
Nettey, Mr Alan Nettey and sisters: Mrs. Diana Nettey-Akinrinsola, Ms. Ceceilia
Nettey and Mrs. Muriel Amoah who continue to inspire me in life.

3
Abstract
Although commercial search engine companies have reported a great deal of success
in appropriating link-based methods, these methods have struggled to demonstrate
significant performance improvements over content-only retrieval methods in several
off-line Web IR evaluations. In this thesis the effectiveness of link-based methods is
assessed against content-only retrieval baselines. Algorithms embodying established
HITS, in-degree, realised in-degree, and sibling score propagation techniques are
evaluated alongside variants of those algorithms. The variant algorithms are devised
to aid in three secondary lines of investigation relating to link-based methods: the
effects of link randomisation, the utility of sibling relationships and the influence of
link densities.
All established link-based algorithms are demonstrated to improve on several content-
only retrieval baseline performance metrics with the realised in-degree algorithm
proving to be particularly effective across all considered metrics. In relation to the
other lines of investigation, the experimentation reveals that: leveraging sibling
relationships does not lead to significant performance improvements, higher link
densities do not afford performance improvements and that algorithms are susceptible
to link randomisation.
Keyword List
Information Retrieval, World Wide Web, Hypertext Algorithms, Web Information
Retrieval, Link-based Methods

4
Table of Contents
1. Introduction . . . . . Page 6
2. Overview of Web IR 2.1 Information Retrieval . . . . Page 9
2.2 Web IR Challenges . . . . . Page 11
2.3 Web IR Evaluation . . . . . Page 13
2.4 Link Structure Analysis . . . . Page 15
2.5 Link Structure Analysis in Web IR . . Page 17
2.6 Typical Web IR Implementations . . . Page 21
2.7 Chapter Summary . . . . Page 23
3. Experimentation 3.1 Experimental Aims . . . . . Page 24
3.2 Experimental Setup . . . . . Page 28
3.3 Content-Only Retrieval Baseline Runs . . Page 33
3.4 Featured Algorithms . . . . Page 34
3.5 List of Experiments . . . . . Page 43
3.6 Implementation Details . . . . Page 46
3.7 Chapter Summary . . . . Page 47
4. Results 4.1 Algorithm Performance . . . . Page 49
4.2 Algorithm Tuning . . . . . Page 52
4.3 Influence of Link Density . . . . Page 62
4.4 Effects of Randomisation . . . . Page 64
4.5 Utility of Siblings . . . . . Page 66
4.6 Chapter Summary . . . . Page 72
5. Conclusion

5
5.1 Effectiveness of Link-Based Methods . . Page 73
5.2 Utility of Sibling Relationships . . . Page 75
5.3 Link Density and Link Randomisation . . Page 78
5.4 Further Work . . . . . Page 79
Bibliography . . . . . . Page 81
Appendices Appendix A - Empirical Correlations . . . Page 88
Appendix B - Algorithm Optimal Run Performance Reports Page 91

6
1. Introduction
In many respects, content on the World Wide Web is no different to content in off-
line document collections. For that reason, the approaches taken in traditional
Information Retrieval are highly applicable to the Web.
The nature of the Web introduces a number of challenges to traditional Information
Retrieval but alongside those challenges are opportunities for exploiting sources of
evidence not present in other contexts. Examples of this evidence are structured
documents facilitating richer abstracted representations, and document usage data
provided by Web servers. Hyperlinks are a particularly valuable source of
information. Due to the fact that hyperlink authors are often not the authors of
documents that are the targets of their hyperlinks, potentially impartial judgments on
documents can be discerned. From the perspective of Web Information Retrieval, the
payload of hyperlinks is two fold. Firstly, the hypertext associated with hyperlinks
enable the representation of target documents to be enriched with typically terse
annotations. Secondly, collectively – hyperlinks allow otherwise unconnected
documents to be modelled as nodes within a graph, yielding valuable topological
properties for those documents.
The value of topological properties has been exalted by commercial Web search
engine companies such as Google who use topological link-based methods to improve
their search results. Although search engine companies remain positive about the
value of link-based methods, many attempts to verify the effectiveness of these
methods with a number of test collections have been unsuccessful. The divergence
between what has been reported by search engine companies and neutral empirical
evidence has raised some doubt as to whether link-based methods really do work.
The primary goal of this thesis is to analyse the effectiveness of a variety of
topological link-based methods by contrasting their performance with content-only
retrieval baselines.
Four particular link based methods are focused on:

7
In-degree
Realised In-degree
HITS
Sibling score propagation
In addition to implementations of these methods, a number of variations are
introduced and evaluated. The variants are designed to help fulfil three secondary
research goals:
Determine the utility of sibling relationships
Determine the influence of link density
Determine the effects of link randomisation
Additionally, an insight into the tuning of all algorithms is sought. A detailed account
of experimental aims can be found in section 3.1.
The remainder of the thesis is organised into four additional chapters:
In chapter 2: The fundamentals of Web IR and link structure analysis are
introduced through an overview of influential and introductory literature in the
field.
In chapter 3: The aims, setup and scope of experimentation is presented.
Specifically, all evaluated algorithms are introduced and the evaluation
environment detailed.
In chapter 4: The results of experimentation pertaining to all research aims are
presented.
In chapter 5: Conclusions relating to all research aims are drawn and a
number of suggestions for further work presented.

8
2. Overview of Web Information Retrieval
Web search engines are typically extensions of Information Retrieval (IR) systems
which were established long before the Web came into existence. With the rapid
growth of the Web in the 1990s, a need for search capability became imminent and by
the mid 1990s rudimentary appropriations of IR systems for the Web surfaced from
early adopters such as AltaVista (who claim to have delivered the Internet’s first Web
index [AltaVista]).
Even before Web searching, searching of other Internet information sources was
possible. Archie facilitated searching of FTP files by name and Veronica offered
keyword search of Gopher menu titles.
Although today’s Web search engines are tailored for searching Web data, their roots
lie in IR and many of the techniques established in IR remain characteristic of Web
search engines.
In this section we start by briefly reviewing classic IR approaches before introducing
a number of challenges posed by the Web. An account is then given of the evaluation
of Web IR systems. An overview of the uses of Web hyperlinks (links) is presented
before an account of the application of links for the purpose of Web IR is presented.
Finally an overview is presented of how link and other sources of Web evidence are
incorporated in typical Web IR implementations.

9
2.1 Information Retrieval A number of retrieval models have been devised to abstract the processes underlying
Information Retrieval systems. Models in which formal queries specify precise
criteria for retrieved documents are said to be exact-match models, whereas best-
match models return a ranked list of documents for a query conveying suitable
documents. Exact-match models such as the Boolean model in which queries are
formulated as logic expressions are more popular in legal and scientific search
systems than Web search engines. The Web’s user base generally demand less-
rigorous, informal querying and are willing to sacrifice certainty in exchange.
Popular contemporary Web search engines in tune with their user base therefore tend
to be underpinned by best match retrieval models.
Perhaps the three most prominent best match models are the vector space model
[Salton1968], probabilistic model [Robertson1977] and the language model
[PonteCroft1988]. In the vector space model, queries and documents are modeled as
vectors in a high-dimensional Euclidean space where each axis corresponds to a
distinct term and the co-ordinate along the axis is a weight determined by statistical
occurrence data for the term. Once encoded in vectors, similarities between queries
and documents can be deduced according to vector arithmetic. Often the inner
product of vectors is used in this regard. Term weighting schemes are key to
performance in these models since terms carry varying levels of significance
depending on context. Typically the weight of a term in a document or a query is
determined by a combination of its local profile within the document or query, its
global profile within a wider context (the document collection as a whole) and a
normalization factor compensating for discrepancies in the length of documents.
The probabilistic model takes a more conceptually intuitive approach. Instead of
being based on relatively abstract vector arithmetic, relevance rankings are based on a
probabilistic measure of searchers’ relevance classifications given a query and
document. The measure used is the likelihood ratio for relevant classifications of the
query and document and is formulated as P(R|Q,D)/P(NR|Q,D) (that’s the probability
of a relevant classification by searchers divided by the probability of non-relevant
classification by searchers). Under the assumption that term occurrences are

10
independent - a little manipulation of this measure involving application of Bayes
rule, reveals that a proportional approximation of it can be derived from estimates of
the probability that the document’s terms feature in relevant classification (
formulated as P(t|R) ) and non-relevant classifications ( formulated as P(t|NR). These
estimates are typically sourced from maximum likelihood data taken from relevance
feedback or from collection-wide term occurrence data.
Similar to the probabilistic model is the language model in which relevance rankings
for documents are based on the probability that a searcher had that particular
document in mind when generating their query, this is formulated as P(D|Q). Under
the assumption that query terms occur independently and some manipulation with
application of Bayes rule it follows that the measure can be approximated using
estimates for the probability that query terms feature in the document ( formulated as
P(t|D) ) along with a prior probability for the document (formulated as P(D) ).
Typically, maximum likelihood estimates taken from document term frequency data
are used in estimating query-term probabilities whilst document lengths are used in
estimating document prior probabilities. In the context of Web Retrieval, authority
measures are more prudent document priors.
Irrespective of the retrieval model underlying an IR system, an inverted index is
conventionally used to store representations of documents within the document
collection. This structure typically consists of an index of terms with pointers to the
documents in which they occur and additional metadata pertaining to those
occurrences. The process of creating an index is dubbed indexing.
Research into the tuning of classic Information Retrieval systems for various
document collections and query-sets can be useful for optimizing Web search engines.
A study by Salton and Buckley on vector space model weighting schemes
[SaltonBuckley1988], revealed that for short queries, schemes in which the local
weight for query-terms do not vary significantly perform better since each query-term
is important. Since Web queries are characteristically short, these findings could be
valid for Web searches also.

11
2.2 Web Retrieval Challenges
The nature of the Web poses a number of challenges to classic IR systems. Several of
these are outlined in this section.
Crawling
Web content is distributed across countless Web servers scattered across the Internet,
therefore unlike IR collections it is a prerequisite to assemble a snapshot of the Web’s
content (a crawl) before constructing a representation of it through indexing.
Typically snapshots are assembled by automated applications which engage in
crawling; the process of recursively fetching documents using a pool of document
locations (URLs) which is replenished with discoveries of new URLs referred to in
the hyperlinks of fetched documents. Although implementing rudimentary crawlers is
relatively straight forward, Google [BrinPage1998-B] intimate that industry strength
crawlers capable of assembling the large crawls typical of major search engines
requires a great deal of engineering.
Diverse Search Requirements
In tandem with developments in Web technology and Web programming, the Web is
increasingly functioning as a platform for a growing number of on-line services and
Web applications such as Internet banking and Web mail. Changes in the use of the
Web induce changes in the intent of Web searchers. Broder [Broder2002] presents
evidence that informational searches – as formulated in the context of traditional IR
[SchneidermanByrdCroft1997] account for less than 50% of all searches. The
majority of searches are explained by Broder to be either navigational search in which
a specific URL such as a corporate homepage is sought or transactional searches in
which access to an interactive process (such as on-line shopping) is sought. Broder
concludes that search engines are challenged by the need to respond to the different
classes of search differently.

12
Although the category of informational searches is common to both IR and Web IR,
the abundance of content on the Web demands greater discrimination when returning
results for broad-topic searches of this type. A shift in emphasis towards a topic
distillation approach to satisfying these queries is advocated by Chakrabarti
[Chakrabarti1998-B]. By topic distillation, Chakrabarti refers to an approach in
which potential search results are evaluated according to how well they represent a
topic as opposed to how similar they are to the topic. Chakrabarti experiments with a
means to identify this representative quality by analysing topological data. Although
numerous techniques for capturing the representative quality of a document through
topological analysis have been devised, Marchiori [Marchiori1997] challenges the
fairness of these approaches. Instead of topological analysis, he advocates using
hyper-information in discerning the added-value of a document, where hyper-
information is described as the information that can be obtained through browsing
additional content that is hyperlinked.
Search Engine Persuasion
Search Engine Persuasion, coined SEP by Marchiori [Marchiori1997] refers to
deliberate manipulation of Web search engines in order to boost the ranking of
documents in search results. SEP is far more common on the Web than in traditional
IR contexts where there is relatively little competition for the attention of collection
audiences. Due to the commercial motives of traffic hungry Web site owners,
manipulation of this sort ranges from being deceptive to fraudulent. The implicit use
of neutral quality judgments in the form of hyperlinks countered the effects of
primitive SEP methods such as hidden text. In more advanced SEP hyperlinks are
manipulated also. Understandably, efforts made by commercial search engines to
maintain the integrity of their search results tend not to be made public.
Incorrect Content
Since there are generally no content controls on material published on the Web there
is a higher chance that Web documents contain incorrect information than traditional
IR collections. Web searchers tend to feel more assured by information that emanates

13
from important sites. The challenge of retrieving correct content is therefore closely
tied to that of retrieving authoritative content.
Duplication
Duplication of content is far more likely in the context of the Web than it is well
controlled collections. Duplication poses a problem for both Search engines and
searchers alike. Search engines are computationally burdened by the crawling,
indexing and storage of duplicate content and Internet searchers find the presence of
duplicates amongst retrieval lists a nuisance. There are generally two approaches to
duplicate elimination. Fine-grained duplication elimination concentrates on
discovering duplicate pages where as coarse-grained duplicate elimination places an
emphasis on identifying duplicate resource directory trees (mirrors).
2.3 Web Retrieval Evaluation
There are a variety of outlooks on what constitutes a good Web search engine. Many
suggestions for performance metrics are somewhat less formal than the criteria used
in assessing Information Retrieval systems.
[Clevedon1966] identifies 6 criteria for the evaluation of information retrieval
systems.
i. Coverage
ii. Time Lag
iii. Recall
iv. Precision
v. Presentation
vi. User Effort
Empirical studies on Web user behavior indicate that Web users are impatient and
have a tendency to abort their requests within the first 20 seconds

14
[RossiMelliaCasetti2003]. In light of this figure ‘Time Lag’ is naturally a key
performance factor. However variations in network latency at different points on the
Internet make the evaluation of ‘Time Lag’ for Web Search engines unreliable.
[GwizdkaChignell1999] intimate further problems with ‘Time Lag’ metrics due to
variations in Internet load.
Although ‘coverage’ (scope of searchable content), ‘presentation’ and ‘user effort’ are
important from a searchers perspective, they pale into insignificance when compared
to precision. [JansenSpinkSaracevic2000] report that 58% of searchers view no more
than the first 10 results returned for a query and that the mean number of pages
examined is 2.35. These facts intimate the need for high precision in Web IR.
In their discussion on Web IR evaluation [Gwizdka&Chignell1999] suggest that ‘user
effort’ can be approximated to the search length method introduced by Cooper
[Cooper1968]. As it’s defined by Cooper, search length corresponds to the number of
irrelevant documents encountered before arriving at a relevant document. A more
elaborate version of the metric is ‘expected search length for n’, which is defined as
the number of documents it is necessary to traverse before finding ‘n’ relevant
documents. [vanRijsbergen1979] adds some mathematical fines to Cooper’s expected
search length formulation.
Presentation of retrieval results has an impact on the precision and user effort a
searcher experiences and for that reason is also a valuable metric. According to
[GwizdkaChignell1999], the vast majority of Web search engines return a linear
ranked list of results and even when there is an attempt to convey that several
documents share the same rank – users are oblivious to it. Some research has gone
into how best to present search results, but as so many search engines opt for the same
linear ranked list presentation – it would be impossible to differentiate them in that
regard.
Fundamental in evaluating recall and precision are relevance judgments, indicating
which documents are relevant for each query. Attaining accurate or even estimated
relevance judgments can be a sizable task particularly when the corpus in question is
the Web. For that reason, alternative methods for ranking Information Retrieval

15
Systems without a base requirement for relevance judgments have been proposed.
[WuCrestani2003] present a number of variations of ranking methods in which the
quality of an individual search engine is based on how well its rankings correlate with
those of other evaluated ranking methods. To this end, the notion of a reference count
is introduced as a measure of how many other evaluated search engines also rank a
document that is ranked by an evaluated system. A sum of reference counts for all
retrieved documents is then used as the basis for ranking the candidate search engines.
Other useful non-human, relevance judgment search engine ranking methods feature
click-through data. Where click-through data can be loosely defined as data
pertaining to the activities of searchers, such as which retrieved pages they visit.
[Joachims2002] presents a method for assessing the quality of two counterpart
systems based on how a user interacts with a neutral retrieval result list featuring an
even mix of results from each search engine. Joachim’s research demonstrates that
the approach produces equivalent results to those obtained through traditional
relevance judgments under a number of plausible assumptions which are empirically
verified. One such assumption is that users click more frequently on relevant links
than irrelevant links.
2.4. Link Structure Analysis
Social network theory is concerned with the application of graph theoretical
properties to problems involving social structures in which entities are involved in ties
with one-another. A common objective in both social network theory and Web IR is
the identification of important entities. Since the Web can be modeled as a social
network in which documents are connected through hyperlinks, research on issues of
importance from the former discipline are often useful. Amongst the various types of
importance, that which is most relevant in Web IR is prestige. Moreno formalized the
notion of prestige as early as 1934 in stating that “A prestigious actor is one who is
the object of extensive ties” [Moreno1934], This is clearly a valuable concept in the

16
context of Web IR and a number of prestige measures emanating from social network
analysis research have found their way into link-based Web IR methods.
Aside from Web IR, link analysis also plays a part in a number of other Web related
disciplines including Webometrics, Web crawling and Web clustering. As the Web
becomes a more integral part of society, a better understanding of its form becomes
vital. To that end, Webometrics yields information on the structural properties of the
Web such as its theoretical diameter and size. [Broder2000] intimates that such
information can be utilized to improve Web crawler design and identify important
phenomena that could be useful in managing the growth of the web. Broder’s study
most notable for it’s bow-tie model of the Web’s structure in which there is a strongly
connected core (SCC) of about 66m pages with a set of 44m pages linking into it (IN
set) and another set of 44m pages linked to by it (OUT set). A number of pages that
are totally isolated from the core then pertain to tentacles that hang off the IN and
OUT sets.
Yet another application of Web link analysis is in Web clustering and categorization
algorithms which grouping similar pages together. [Chakrabarti1998] demonstrates
that links and their surrounding anchor text can be used to develop an automatic
resource compiler with performance that is compatible to the manual Web directory
Yahoo!. Clustering of Web pages also feature in Web meta search engines such as
Vivisimo [Vivisimo] which further categorize search results for the convenience of
searchers.
A more novel application of Web links is introduced by IBM Research [Amitay2003].
They apply temporal link data in identifying significant trends and events in matters
pertaining to a query. A temporal link is introduced as a dated in-link, before a clear
example of how profiling the distribution of dated in-links (by date) can be revealing.
The study concludes by demonstrating the utility of dated in-links to Web IR. An
HITS algorithm in which links are weighted according to their temporal relevance is
shown to produce more contemporary results than standard HITS.

17
2.5 Link Structure Analysis in Web IR Generally link-based methods in Web IR fall into two categories, local link structure
techniques and global link structure techniques. Local link structure techniques focus
on links within a sub-graph pertaining to a query whereas global link structure
techniques operate on the links of an unrestricted graph independent of any query.
Further, global link based methods essentially incorporate the global status of a web
page amongst all other web pages into retrieval assessments. The results of such
global link analysis techniques are combined with the results of content focused
analysis in determining an overall relevance score.
The status or importance that Web pages enjoy can be approximated in several
manners. Perhaps the most simple of these is a citation count approximation
rendering the page with the highest number of in-links as that with the highest status.
The idea central to this, that each in-link to a page is an equally important
endorsement of it, featured in academic citation analysis as early as 1972
[Garfield1972] and implementations of the technique have been employed in
applications as diverse as speculating on future winners of the Nobel Prize
[Sankaran1995].
Another class of link based methods are A mature variant of citation count (or in-link
count in the context of the Web) is the iterative PageRank1 computation
[BrinPage1998] for a page in which the endorsement value of individual links vary
according to their position within the Web graph. The intuition here is that the
magnitude of endorsement contributed by a link should be proportional to the source
pages own status and inversely proportional to the total number of endorsements
offered by that source page.
Amongst the most widely cited link-based algorithms is HITS (Hyperlink Induced
Topic Search) [Kleinberg1998]. At the heart of the HITS algorithm is an attempt to
solve two fundamental problems of content based web retrieval. The first of these
1 )()1(
)()()(
),(uCd
vOutDegreevPRduPR
WebLinksuv−+= ∑
∈
, s.t. C(u) is a pre-computed source of
rank for page u.

18
problems is introduced by Kleinberg as the abundance problem and is described as
occurring when in his words; “The number of pages that could be reasonably relevant
is far too large for a human to digest”. He notes that this problem arises when
applying content-only retrieval to “broad topic” queries with a large representation on
the Web. In developing his extension of HITS; ARC (Automatic Resource
Compilation), [Chakrabarti1998] describes the analogous challenge of a “Topic
Distillation”. Secondly, Kleinberg notes the phenomena of relevant documents which
are elusive to content-only retrieval methods. A Web search engine home page is
given as an example of a page that is unlikely to contain terms in common with a
query such as “search engine” and thus evade retrieval by content-only retrieval
methods. HITS approach to addressing both of these issues is to identify high quality,
authoritative documents amongst self-descriptive and possibly non self-descriptive
relevant documents by augmenting content retrieval methods with link structure
analysis. Key to the link structure analysis is the distinction between hubs and
authorities and the mutually reinforcing effect they have on one another. A hub is a
document with out-links to authorities. The more plentiful and authoritative the out-
linked sites are the better the hub is. Likewise an authority has in-links from many
hubs. Should those in-links be plentiful and originate from good hubs then the better
the authority is.
The meta-algorithm underlying HITS is characteristic of many other link analysis
algorithms.
i. Start with a query focused set of lexically similar retrieved documents,
referred to as a root set.
ii. Speculate on a set of potentially relevant documents related to root set
members and expand the root set with these to produce a base set.
iii. Apply link analysis to the sub-graph structure pertaining to the base set in
producing judgments on the authority of these documents.
The first stage of the meta-algorithm is inevitable since retrieving lexically similar
documents provides a set of potentially relevant documents from which to progress.

19
The value in augmenting the root set in the second phase is two fold. Principally,
there is a broadening of the scope of candidate authorities from just lexically similar
ones which introduces the possibility of retrieving otherwise elusive documents.
Additionally, the link density of the sub-graph will be increased as a consequence
which is likely to be beneficial to subsequent link-analysis. Beyond stating the
intention to keep the size of the base set relatively small for computational efficiency,
Kleinberg gives little consideration to its construction. Interestingly,
[NgZhengJordan2001], show that changes in the linkage patterns within a base set
could cause considerable changes in HITS authority results.
A number of heuristics have been implemented to better refine the semantics of links
within the base set sub-graph. Kleinberg suggests that links from one site to a
particular page on an external site should not signify the same degree of endorsement
as when those in-links are from a variation of sites. In the former case all the in-links
are likely to represent one particular author’s endorsement of the site, whereas in the
latter case the endorsements are widespread and thus more valuable.
[HenzingerBharat1998] makes the same over-influential author observation in the
implementation of a refinement to HITS in which the influence of multiple intra-site
links is tempered. In her experiments, this refinement renders a 25% improvement in
average precision.
A clear semantic distinction between the authority conveyed between inter-site links
and intra-site links is also intimated by Kleinberg in suggesting that inter-site links
very often exist only to allow for navigation of the infrastructure of a site and thus
unlike external links should not convey authority. Both [HenzingerBharat1998] &
[Chakrabarti1998] note that an HITS analysis can result in a loss of focus on the
original query, often referred to as topic-drift. This is demonstrated to occur in cases
where suitably connected components infiltrate into the base set and emerge as
authorities although they are off-topic. [Chakrabarti1998] tackles topic drift by
weighting the links of the sub graph according to the relevance to the query of anchor
and anchor-neighbouring text associated to the link. In this sense, the endorsement
that a linked page gets is proportional to it’s relevance as can be discerned from the
similarity between its associated text and the query.
[HawkingCraswellRobertson2001] as well as numerous TREC participants report

20
good performance of anchor text only retrieval in entry page finding tasks, where an
entry page is the home page of a site.
[HenzingerBharat1998] go a step further by weighting links in accordance to the
similarity between the query and the content of the link target. This approach offered
an improvement when compared to standard HITS as does another introduced content
analysis heuristic that prunes irrelevant documents from the sub graph prior to link
analysis. Interestingly, Henzinger and Bharat reveal that a combination of these two
methods does not lead to a further improvement.
An effect similar to topic drift is introduced by [Lempel2000] as the tightly knit
community effect or TKC. Lempel shows HITS to be susceptible to small clusters of
highly connected nodes. Due to their high link density, the nodes of these clusters
score higher under HITS authority assessment than nodes from larger connected
clusters with more relevance. This phenomenon is well illustrated through examples
before a stochastic approach is shown to alleviate the problem.
In essence, Lempel’s link analysis method considers a site’s authority scores to be the
product of its in-degree and the size of its community where a community is defined
in terms of the connected component the link belongs to. Allowance is thus given for
a site with a high in-degree amongst a small community to have comparable authority
with a site of lower in-degree amongst a larger community.
Although Lempel’s results are largely positive, he is cautious over their merits when
evaluations extend beyond early-precision measures such as precision at 10 to
precision at 200.
[RichardsonDomingos2002] and [Haveliwala2002] advocate the combination of
multiple pre-computed topic-biased page rank vectors in constructing authority
assessments biased towards queries. The idea of biasing page rank scores had already
been conceived in [BrinPage1998] introductory paper for the purpose of
personalization. In Havelinwala’s approach 16 PageRank vectors are computed each
biased according to a topic of the Open Directory Project [ODP] Web directory. At
21
query time a scoring function is used which sums the vector score of each of the 16
topic biased PageRank’s weighted by the probability of the topic’s relevance to the
query. This probability is calculated using a unigram language model and utilizes
maximum likelihood estimates for parameters.
The scores are shown to be equivalent to the PageRank vector corresponding to a
standard random walk except that instead of users jumping to pages with uniform
probability when not following out-links, the jump is biased towards pages belonging
to classes probabilistically more relevant to the query.
Topic sensitive re-ranking of URLs matching queries are demonstrated by Haveliwala
to consistently better standard PageRank re-rankings. These results are especially
encouraging when considering the efficiency and insusceptibility to link spam of topic
sensitive scoring.
2.6 Typical Web IR Implementations
In a technological survey of Web IR systems compiled by Huang [Huang2000], three
components are said to be characteristic of Web search engines; an indexer, a crawler
and a query server. Huang explains that together the crawler and indexer work to
produce a representation of the Web which is optimized for efficient use by the query
server. That much is true of IR systems in general. Where Web IR implementations
differ from IR systems significantly is in the variety of information they exploit in
retrieval, much of which is unavailable in traditional IR collections. Although the
exact details of their systems are generally kept in-house, commercial Web search
engines are known to leverage several Web-rich sources of information such as
hyperlinks, document structure, document meta-data and usage data from Web
servers.
Some consideration was given to document meta-data by Amento, Terveen and Hill
in investigating how well a number of measures were able to predict document quality
[AmentoTerveenHill2000]. In their experiments, simplistic meta-data such as number

22
of images and number of documents on site were demonstrated to be effective. A
similar study [KraaijWesterveldHiemstra2002] found URL form to be particularly
effective for entry page (home page) finding tasks.
Document structure is perhaps more readily available than meta-data. The vast
majority of content on the web is structured in conformance with mark-up languages
such as HTML and increasingly XML. Mark-up offers implicit contextual
information which facilitates richer modelling of documents than the typical bag-of-
words suited to plain text documents. Typically, this representation replaces the
standard term frequency meta-data associated with terms occurring in a document
with term frequency vectors where each co-ordinate of the vector represents the
number of occurrences of the term within designated context classes. Retrieval
algorithms can then take this context information into account during relevance
evaluations, so that occurrences of terms within certain context classes are more
valuable than those occurring within others. Whilst focusing on HTML mark-up,
[CutlerShihMeng1997] demonstrate that ‘strong’ and ‘anchor’ text are particularly
effective descriptors of Web pages.
In XML retrieval, context is important from an addition perspective also. Not only
can context aid with retrieval performance, it is also key to meeting a searcher’s
requirements. Typically the unit of retrieval in XML retrieval is a particular fragment
of an XML document not necessarily the whole document itself. XML queries
therefore often feature strict structural constraints so that not only are terms specified
in queries but also the required contexts of those terms. The quality of retrieval is
consequently not only based on the content resemblance of a fragment to a query but
also on the context resemblance where the notion of context resemblance can be
expanded in a number of ways. A popular context measure is longest common
subsequence which is defined as the how many consecutive components within a
context definition match.
McBride’s World Wide Web Worm was the first Web search engine to make use of
anchor text. Subsequently anchor text use has proved to be a successful means of

23
improving Web IR systems. In an insight into the architecture of their Web search
engine [BrinPage1998-B], Google confirm that they index anchor text. Further,
structural information pertaining to terms such as font and capitalization are used to
enhance their index entries. Terms appearing in URLs and meta-tags are also
distinguished within Google’s index structure. From the insight given by Google it is
clear that commercial search engines must also concern themselves with optimizing
efficiency and eradicating duplication.
TREC Web Track participants are more open about their techniques than Web search
engine companies and their Web IR research publications are well cited. Participants
from the University of Twente [KraaijWesterveldHiemstra2002] are believed to be
the first to have published details on the effectiveness of applying URL form evidence
in entry page searches [HawkingCraswell2004], a technique which is thought to have
since been adopted in commercial Web search engines.
2.7 Chapter Summary In this chapter an overview of literature in the areas of Web IR and link-structure
analysis has been presented. Introductory and influential literature in these areas have
been overviewed to provide the fundamental background knowledge underpinning
and motivating the research carried out in this thesis. With the background material
established, the next chapter goes on to clarify the research questions posed by this
thesis and details the experimentation carried out in addressing them.

24
3. Experimentation
In this chapter we start by re-stating and clarifying the aims of the experimentation
carried out in this thesis. Next, in section 3.2 the test collection used for experiments
is introduced and detailed. The content baselines and algorithms featuring in
experiments are then described in sections 3.3 and 3.4.
At the end of the chapter a list of all runs yielded by the experiments is presented
along with an overview of the experimental architecture implemented to produce
them.
3.1 Experimental Aims
The experimentation carried out is designed to meet two primary objectives:
Evaluate the effectiveness of link-based methods
Gain an insight into the tuning of algorithms
In addition to established link-based methods, a number of variations on them are
introduced and the performance and tuning of these will also be investigated. The
variant algorithms are specifically devised with the following secondary objectives in
mind:
Determine the utility of sibling relationships
Determine the influence of link density
Determine the effects of link randomisation
In the remainder of this section all objectives are further expanded.
Evaluate the Effectiveness of Link-Based Methods

25
A selection of four familiar link-based methods has been chosen to represent link-
based methods in general. The four selected methods are listed below.
HITS Authority
Realised In-Degree
In-Degree
Sibling Propagation
Although many retrieval systems have featured these techniques there is little
evidence of extensive independent appraisal of them. Amento’s study [Amento2000]
is perhaps one of the most widely cited works of this nature. However, his
experimentation featured an arguably insufficient total of 5 queries in a tailor-made
topic distillation task.
By comparing the performance of several link-based algorithms against content-only
retrieval baselines the aim is to determine whether link-structure analysis is beneficial.
Additionally, some insight into the relative merits of the evaluated algorithms is
sought. The emphasis of the experimentation is on the added-value offered by link
structure analysis in addition to content analysis as demonstrated by implemented
algorithms. To this end, the methodological choice is made to restrict algorithms to
using only evidence obtained through link-structure analysis in supplementing ready-
made content-only retrieval similarity information. Any improvements on pure
content-only retrieval performance can then be attributed directly to link-structure
analysis.
Gain Insight into Tuning of Established Algorithms and Their Variants
By varying parameter values, an understanding of which configuration of parameters
lead to optimal performance on a per-algorithm basis is sought. As is a general
impression of how changes in parameter values impact the performance of individual
algorithms.
Determine the Utility of Sibling Relationships

26
In contrast to link relationships, there is far less evidence of the employment of
sibling relationships in Web IR algorithms.
A handful of TREC Web Track participants have experimented with sibling
relationships. The University of RMIT developed an algorithm for 1999’s TREC-8
which re-ranked the results of a content retrieval run by propagating the weighted
scores of retrieved document siblings. A modification of their sibling score
propagation approach which limited the influence of sibling endorsements when re-
ranking was also submitted for TREC-8 evaluation. Both RMIT sibling based runs
failed to improve on their content-only run’s average precision. A subsequent un-
submitted run in which the influence of siblings were further restricted showed more
promise. The University of Twente unveiled an algorithm in TREC-9 which also
made use of sibling relationships, but once again their technique failed to better the
content-only baseline.
By altering several familiar algorithms to use sibling relationships, some insight on
the utility of siblings in algorithms is sought. The aim is to determine if the inclusion
of sibling relationships in algorithms (through a variety of means) lead to performance
improvements.
Determine the Influence of Link Density
The specific question addressed here is if and how the link density of graph structures
analysed by link-based algorithms significantly influences the performance of those
algorithms. The indication from prior research is that link-densities may have an
effect on link-structure analysis.
[EversonFisher2003] have carried out experimentation on the impact of link density
on link-based algorithms for information access tasks. Although the experiments
were specifically focused on the task of text classification, they suggest that their
findings have similar implications in the area of Information Retrieval. In their
experiments the performance of a text classification algorithm, given a low link-
density corpus, a high link-density corpus and a randomized link corpus was
compared. The experiments were repeated on two separate corpuses, firstly a crawl

27
of homepages from the Computer Science departments of selected US universities
and secondly a subset of already classified Web pages relating to Computer Science
research. The results of both sets of experiments reflected one another – higher link
densities lead to far better classification success, the improvements being more
pronounced in the corpus with a higher innate link density. The link densities were
lowered by removing links randomly and raised by adding ‘friendly’ links connecting
documents of similar topics. In their paper, the authors state that the reason they were
unable to concentrate their experimentation on a Web IR task as opposed to text
classification was due to a lack of suitable data sets. However, in light of their
findings, similar experimentation for a Web IR task is valuable.
It has been suspected that the failure of TREC-8 participant’s link based algorithms
was partly due to sparse inter-server linkage in the WT2g test collection
[BaileyCraswellHawking2001]. Bailey et al. suggest that inter-server links are of a
higher quality (from the perspective of link based algorithms) than intra-server links
and that there were too few of these in the WT2g corpus. In engineering the
subsequent WT10g corpus for TREC-9, some attention was given to improving inter-
server link density. Although there were no significant improvements for link-based
algorithms in TREC-9, Bailey et al. demonstrate the benefit of the new corpus in a
home page finding experiment.
[EversenFisher2002] suggest that the link density in the newly created WT10g corpus
is still insufficient for the purpose of their link-density experiments, since it still falls
some way short of the link densities considered in their own experimentation.
The .GOV test collection available since 2002 has higher inter-server link densities
than WT10g and is perhaps better suited for density related experiments.
Determine the Effects of Link Randomisation
Aside from link-densities, Eversen and Fishers’ experiments also focus on the effects
of link randomisation on text classification tasks [EversenFisher2002]. The
randomisation of links was achieved by replacing actual links with arbitrary links
between URLs with the intention of reducing the quality of links in the resulting

28
graph. The effect of the link randomisation was a huge drop in classification
performance far greater than the decline caused by lowering link densities.
By experimenting with random link structures, the aim is to determine how
randomizing link structures affect algorithm performance.
3.2 Experimental Setup
Three consecutive year’s Topic Distillation tasks from the TREC (Text Retrieval
Evaluation Conference) WebTrack are appropriated for evaluations carried out in this
thesis. Partially due to contributions from Web search engine companies, TREC Web
related task results are increasingly becoming true indicators of Web IR performance
and are widely employed in industrial and academic research.
TREC WebTrack Topic Distillation tasks challenge participants to find relevant
documents (key resources) for a number of queries. A list of relevant documents for
each query is pre-determined by a panel predominantly constituted by retired or active
information professionals such as CIA analysts. The queries (topics) together with
their relevance judgments provide a basis for evaluating the performance of
participant retrieval systems submitting up to 1,000 ranked results per query.
Performance metrics such as precision at 10, r-precision and average precision are
evaluated for submissions and based on mean averages across all query submissions.
Ranked results for all participant submissions are evaluated and subsequently made
publicly available.
A test collection, several query sets and relevance judgments for those query sets
(collectively referred to as qrels) are appropriated for the experimentation carried out
in this thesis. In addition, topological data corresponding to the test collection’s graph
structure is extracted for use by algorithms. In the remainder of this section, the test
collection, qrels and additional topological data used in experiments are introduced.

29
Test Collection
Since 2002, TREC WebTrack evaluations have featured a test collection of over
1,000,000 documents crawled from the .GOV top level Internet domain. The 18G
large collection (referred to as .GOV) crawled in early 2002, is distributed by the
University of Glasgow who assumed responsibility from former distributors CSIRO
(Commonwealth Scientific and Industrial Research Organisation) in 2005
[UniversityGlasgowIRDistribution]. Properties of the .GOV collection are listed in
Table 1.
Table 1: TREC .GOV collection properties
Number of Pages 1,247,753Number of pages by mime type text/html 1,053,110 application/pdf 131,333 text/plain 43,753 application/msword 13,842 application/postscript 5,673 other (containing text) 42Average page size 15.2 KBNumber of hostnames 7,794Total number of links 11,164,829Number of cross-host links 2,470,109Average cross-host links per host 317
Queries and Relevance Judgements (QRELS)
Three consecutive year’s TREC Topic Distillation tasks are used in the experiments
carried out here: TREC-2002, TREC-2003 and TREC-2004. A fourth task was
synthesized by concatenating the topics, and qrels of the three official tasks. This
synthesized task, referred to as TREC-0000, is essentially a combined Topic
Distillation task. To avoid the overlap between TREC-2003 and TREC2004 topic
numbers causing confusion, the topic numbers for TREC2004 topics were offset by
100. This allowed topic numbers 1 to 50 to exclusively designate TREC-2003 topics.
Details of the four tasks are listed in Table 2.

30
Table 2: TREC task details
Number of
Queries
Median Average Relevant
Resources
Total Relevant
Resources TREC-2002 49* 22 1574TREC-2003 50 8 516TREC-2004 75 13 1600TREC-0000 174 13 3690*A 50th query has been discounted since it did not have any relevant documents
A significant difference between the relevant documents of the TREC-2002 task and
later years is the inclusion of non-homepages. Since 2003’s task, the hypothetical
searchers information need for a topic distillation query such as ‘cotton industry’ is
modelled as: ‘give me an overview of .gov sites about the cotton industry, by listing
their homepages’, whereas previously it would have had a more ad-hoc interpretation
along the lines of ‘give me all .gov URLs about the cotton industry’. The shift in
emphasis towards home pages subsequently resulted in fewer relevant documents per
query. Although an attempt to counter that effect was made by introducing broader
queries, the two queries detailed below illustrate the gulf between the relevance
judgments of TREC-2002 and TREC-2004.
Table 3
Task Query Relevant
Resources TREC-2002 US immigration history demographics 126 TREC-2004 Federal and state statistics 86 The two queries only had 1 relevant resource in common
The TREC-2002 query ‘US immigration history demographics’ could be considered a
subtopic of the TREC-2004 query ‘Federal and state statistics’, but yet many more
relevant documents have been identified for it.
Topological Data
Of the links between .GOV collection documents, only inter-site links are considered
in experimentation. Links within site are ignored because often those links are put in
place purely for the purposes of site navigation and are less likely to confer authority
or recommendation.

31
For the purposes of this thesis an inter-site link is defined as a link between two URLs
in which (ignoring the hostname portion of the URL’s domain part, typically ‘www’),
either one domain part is a sub-domain of the other or they are the same. For
example, a link between www.nlm.nih.gov/home and http://www.nich.nih.gov/home
is not considered an inter-site link, whereas a link between
www2.nlm.nih.gov/portal/public.html and www.nih.gov/home is. Data on all inter-
site links from the .GOV collection is extracted for use by algorithms performing link-
structure analysis. The link graph corresponding to this data is referred to as the
‘inter-site.GOV’ graph.
Soboroff demonstrates that the power law in-degree and out-degree distributions
observed by Broder et al. for Web URLs [Broder2000] are reflected in the .GOV
collection [Soboroff2002]. A further observation by Broder is that distributions are
almost equivalent when intra-site links are discounted. From Figure 1 and Figure 2 it
is clear that in- and out-degrees for the .GOV collection are distributed according to a
power law whether only inter-site or all links are considered. Aside from link
relationships, sibling relationships also feature in this work. Interestingly, the same
observation largely applies to sibling-degrees, where a power law distribution can be
seen for inter-site links (Figure 2) and for all links except where degree levels are
below approximately 100 (Figure 1).

32
Figure 1: Distribution of degree levels in the Web’s .GOV top-level domain. Log scale plot.
Figure 2: Distribution of URL degree levels within the Web’s .GOV top-level domain (restricted to inter-site link topology). Log scale plot.

33
Further evidence of similarities between in-degrees and sibling-degrees is apparent
when considering degree correlations for the 65,000 URLs with the highest sibling
degrees (Table 4). The correlation between in-degree and sibling-degree is 0.66, but
understandably there is far less correlation where out-degree of URLs is concerned.
The correlation figures quoted in Table 4 are calculated according to the formula
presented in Appendix A.
Table 4: Degree correlation of the 65,000 URLs with highest sibling-degree
In-Degree Out-Degree Sibling-Degree
In-Degree 1.00 Out-Degree 0.04 1.00 Sibling-Degree 0.66 0.08 1.00
In addition to the inter-site.GOV graph, two random mutations of that graph were
created for experimentation. The first (dubbed ‘Random.GOV’) interchanged real
links with arbitrary links ensuring that the in- and out-degrees for individual URLs
were preserved. The second (dubbed ‘RandomX.GOV’) interchanged real links with
arbitrary links ad-hoc with the only proviso being that the overall number of links was
preserved.
3.3 Content-Only Retrieval Baseline Runs
Content-only retrieval results are the standard baseline against which the performance
of link-based algorithms is contrasted. Since, link-based algorithms typically enrich
content analysis with link-structure analysis; the expectation is that they improve on
content-only baselines.
Aside from acting as performance baselines for effectiveness comparisons, the
content runs serve two further purposes. Firstly they constitute the root sets of link-

34
based algorithm runs and secondly they are combined with link based algorithm runs
to produce fusion runs. A complete overview of all runs is detailed in section 3.5.
The University of Amsterdam’s Perl implemented FlexIR Information Retrieval
system [MonzdeRijke2002] was used to produce the content retrieval runs. Pre-
processing consisted of the removal of HTML-tags, punctuation marks, and Snowball
stemming [Snowball2003].
Three sets of content-only retrieval runs were produced for each of the three official
TREC topic distillation task topic sets TREC200[2-4]. A fourth set of three content-
only retrieval runs corresponding to the combined TREC0000 task was synthesized
by concatenating the retrieval results of the three official task runs.
The first of the three sets of content-only retrieval runs feature a statistical language
model [Hiemstra2001] with a uniform query term importance weight of 0.35. These
language model runs are referred to as LM runs in section 3.5’s run list.
The second set of content-only retrieval runs feature an Okapi weighting scheme
[RobertsonWalkerBeaulieu2000] with tuning parameters of k=1.5 and b=0.8. These
runs are referred to as OKAPI runs in section 3.5’s run list.
The third set feature an Lnu.ltc weighting scheme [BuckleySinghalMitra1995] with
slope parameter set at 0.2 and pivot parameter set to the average number of unique
terms per document. Lnu.ltc runs are abbreviated to LNU content runs in section 3.5.
3.4 Featured Algorithms
Six familiar algorithms have been selected for implementation and evaluation; they
are listed below with their abbreviations.

35
In-Degree (id)
Realised In-Degree (rid)
HITS Authority (ha)
RMIT (Rs)
RMIT2 (R2s
RMIT3 (R3s)
The RMIT sibling score propagation algorithms (RMIT, RMIT2 and RMIT3) provide
three ready made representative sibling algorithms.
The meta-algorithm underlying the other three algorithms is the same.
i. Start with a query focused set of lexically similar retrieved documents, referred to as a root
set.
ii. Speculate on a set of potentially relevant documents related to root set members and expand
the root set with these to produce a base set.
iii. Apply link analysis to the sub-graph structure pertaining to the base set in producing
judgments on the authority of these documents which can be applied in re-ranking.
The key detail in which the algorithms differ is in step iii of the meta-algorithm where
they take different approaches to re-ranking members of the base set. In phase ii, all
algorithms that expand their root set select in- and out-linked documents for
augmenting the root set in no particular order. By altering the details of this phase,
variations of algorithms can be obtained. Instead of selecting in- and out-linked
documents, alternatively related documents (augmentation relationship) can be
selected and instead of ad-hoc selection of these an order of precedence can be
applied to selection (augmentation precedence). Further variant algorithms can be
obtained by altering the degree measures applied in the degree algorithms In-Degree
and Realised In-Degree. The final means for varying algorithms is to interchange the
link graph they were presented with from the standard Inter-site.GOV link graph to
either the Random.GOV link graph or the RandomX.GOV link graph.
By using different combinations of values from Table 5 for the augmentation
relationship, augmentation precedence, degree measure and link graph, nine variant
algorithms were produced to add to the six familiar algorithms already listed. In table

36
5, the ranking approach ‘global degree’ refers to a collection level degree measure as
opposed to a degree measure that’s relative to the base set (local degree). The
‘Sibling and parent’ augmentation relationship refers to the interleaved selection of
siblings of root set documents and the parents of those siblings (common in-links), the
intention being to render a higher link density in the base set than achieved through
sibling expansion.
The nine variant algorithms are listed below with their abbreviations.
Sibling Degree (sd)
Realised Sibling Degree (rsd)
Realised Sibling & Parent Degree (rspd)
HITS Sibling Authority (hsa)
HITS Sibling & Parent Authority (hspa)
HITS Low Density Authority (hlda)
HITS High Density Authority (hhda)
HITS Authority (ha)
HITS Random Authority (hra)
HITS Random X Authority (hrxa)
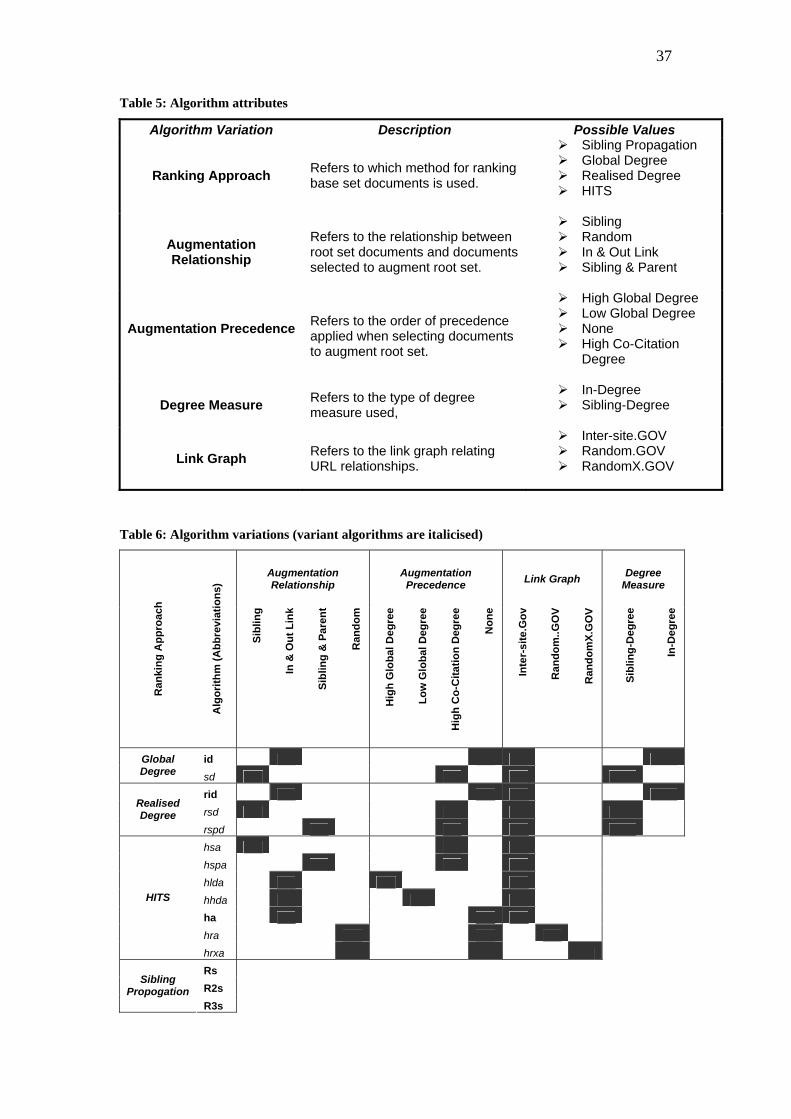
Details of how all 15 algorithms (six familiar and nine variants) vary according to the
5 attributes presented in Table 5 are summarized in Table 6.
37
Table 5: Algorithm attributes
Algorithm Variation Description Possible Values
Ranking Approach Refers to which method for ranking base set documents is used.
Sibling Propagation Global Degree Realised Degree HITS
Augmentation Relationship
Refers to the relationship between root set documents and documents selected to augment root set.
Sibling Random In & Out Link Sibling & Parent
Augmentation Precedence
Refers to the order of precedence applied when selecting documents to augment root set.
High Global Degree Low Global Degree None High Co-Citation
Degree
Degree Measure Refers to the type of degree measure used,
In-Degree Sibling-Degree
Link Graph Refers to the link graph relating URL relationships.
Inter-site.GOV Random.GOV RandomX.GOV
Table 6: Algorithm variations (variant algorithms are italicised)
Augmentation Relationship
Augmentation Precedence Link Graph Degree
Measure
Ran
king
App
roac
h
Alg
orith
m (A
bbre
viat
ions
)
Sibl
ing
In &
Out
Lin
k
Sibl
ing
& P
aren
t
Ran
dom
Hig
h G
loba
l Deg
ree
Low
Glo
bal D
egre
e
Hig
h C
o-C
itatio
n D
egre
e
Non
e
Inte
r-si
te.G
ov
Ran
dom
..GO
V
Ran
dom
X.G
OV
Sibl
ing-
Deg
ree
In-D
egre
e
id Global Degree sd
rid rsd
Realised Degree
rspd
hsa
hspa
hlda
hhda ha
hra
HITS
hrxa Rs R2s
Sibling Propogation
R3s

38
HITS High Density Authority selects in and out linked documents by descending
order of combined degree (sum of in- and out-degrees), whilst HITS Low Density
Authority selects by ascending order of combined degree. The intention is to render
higher link densities in the base set of HITS High Density Authority than in the base
sets of HITS Low Density Authority.
The variant algorithms have been devised with the three secondary objectives listed in
section 3.1 in mind. The obvious interpretation of the connection between the
algorithms and those objectives is pronounced in Table 7. The table lists potentially
valuable performance comparisons that can be made between algorithms in the last
three columns, since those algorithms vary only in terms of the algorithm attribute
listed in the second column.
Table 7: Directed like-comparisons between algorithms
Objective Key Algorithm
Attribute 1st
Comparator 2nd
Comparator 3rd
ComparatorUtility of Siblings Degree Measure* rsd or rspd rid Utility of Siblings Degree Measure* sd id
Utility of Siblings Augmentation Relationship rsd rspd
Utility of Siblings Augmentation Relationship hsa hspa ha
Influence of Link Density
Augmentation Precedence hlda hhda ha
Effects of Randomisation Link Graph* hra hrxa ha
*NB: Comparison only valid when root set is unexpanded
In the remainder of this section further details of the six established algorithms: In-
Degree, Realised In-Degree, HITS Authority, RMIT, RMIT2 and RMIT3 are
presented.
In-Degree
A major advantage of in-degree when compared to PageRank is that it is
computationally less demanding. Additionally, the in-degree of a page can be pre-

39
computed and reused when re-ranking content retrieval results, precluding the query-
time need for link structure analysis required by algorithms such as HITS.
A simplistic use of in-degree is applied in the In-degree algorithm implemented here.
A more principled approach might be to use in-degree prior relevance probabilities in
a language model framework. The algorithm takes a root set of documents from a
text retrieval algorithm, expands it into a base set by including in- and out-linked
documents before re-ranking the base set according to the in-degree of its members.
Pseudo code for the algorithm is presented in Algorithm 1 with ‘d’ and ‘t’ parameter
values as defined in [Kleinberg1998].
Algorithm 1: Pseudo-code for In-Degree algorithm
Let t denote maximum size of root set
Let x denote number of top scoring documents to return
<construct base set>
Set RootSet = GetRetrievalResults(ContentRetrieval, t)
Set BaseSet = RootSet
For each page p є RootSet
BaseSet = BaseSet U SelectInLinks(p, d)
BaseSet = BaseSet U SelectOutLinks (p,d)
End
<calculate in-degrees>
For each p є RootSet
Score[p]=Indegree(Corpus, p)
End
<re-rank BaseSet based on in-degrees>
Return TopScores(BaseSet, Score, x)
HITS Authority
Like in-degree scores, HITS authority scores are a highly established measure of
quality. Although HITS hub scores are also valuable, authority scores tend to be
better predictors of key resources [Amento2000]. It’s for this reason that HITS
authority scores have been selected ahead of hub scores. The details of the HITS
implementation are in Algorithm 2 with ‘d’ and ‘t’ parameters as defined in
[Kleinberg1998].

40
Algorithm 2: Pseudo code for HITS Authority algorithm
Let t,d denote maximum size of root set and maximum in/out-links considered per document
respectively
Let k be a natural number denoting the number of iterations after which Hub and Authority scores
converge
Let x denote number of top scoring documents to return
<construct base set>
Set RootSet = GetRetrievalResults(ContentRetrieval, t)
Set BaseSet = RootSet
For each page p є RootSet
BaseSet = BaseSet U SelectInLinks(p, d)
BaseSet = BaseSet U SelectOutLinks(p,d)
End
<initialize authority and hub vectors>
For each p є BaseSet
HubScore[p]=1
AuthorityScore[p]=1
End
<calculate Hub and Authority scores>
For s = 1 to k
<recalculate hub scores>
For each p є BaseSet
For each o є OutLinks(BaseSet, p)
HubScore[p] = HubScore[p] + AuthorityScore[o]
End
End
<recalculate authority scores using updated hub scores>
For each p є BaseSet
For each i є InLinks(BaseSet, p)
AuthorityScore[p]= AuthorityScore[p] + HubScore[i]
End
End
<normalize Authority and Hub score vectors>
Normalize(AuthorityScore)
Normalize(HubScore)
End
<Return top Hubs and Authorities>
Return TopScores(BaseSet, AuthorityScore, x)
Realised In-Degree
Realised in-degree is a measure introduced by the University of Amsterdam in their
TREC2002 Web Track offering [KampsMonzdeRijke2003]. The measure
corresponds to the square of the local in-degree (where a document’s local in-degree

41
is the number of in-links originating from documents in the base set) divided by a
document’s global in-degree (collection-wide number of in-links for the document).
The resulting product is suggested by Kamps et al. to reflect both the topicality and
relative importance of the document. The pseudo code for the algorithm is detailed in
Algorithm 3 in which ‘d’ and ‘t’ variables are as defined by Kleinberg
[Kleinberg1998].
Algorithm 3: Pseudo code for Realised In-Degree Algorithm
Let t,d denote the size of root set and maximum in/out-links considered per document respectively
Let k be a natural number denoting the number of iterations after which Hub and Authority scores
converge
Let x denote number of top scoring documents to return
<construct base set>
Set RootSet = GetRetrievalResults(ContentRetrieval, t)
Set BaseSet = RootSet
For each page p є RootSet
BaseSet = BaseSet U SelectInLinks(p, d)
BaseSet = BaseSet U SelectOutLinks (p,d)
End
<compute relevance scores>
For each p є BaseSet
Score[p] = InDegree(BaseSet, p) * InDegree(BaseSet, p) /
InDegree(Corpus, p)
End
<return top scoring documents>
Return TopScores(BaseSet, Score, x)
RMIT, RMIT2 and RMIT 3
RMIT University’s TREC-8 Web Track submissions were the product of two sibling
propagation algorithms [Fuller+1999]. A further algorithm was developed after the
TREC-8 submission deadline. Their three algorithms have been selected for
implementation and evaluation because of their reliance on sibling relationships.
They are referred to here as RMIT, RMIT2 and RMIT3.
RMIT is the simplest of the three algorithms and is based on an elementary sibling
propagation approach in which the content similarity (relevance) scores of content-
retrieved documents are supplemented with a weighted sum of the similarity scores of

42
other retrieved siblings. The formalization of this approach is presented below in the
form it was defined by RMIT.
∑∧∈
+=)()('
)',(1),(),(qretdsibd
cc dqsimk
dqsimdqsim
where simc(q,d) is d’s content similarity score for query q, sib(d) is the set of d’s siblings and ret(q) is
the set of documents retrieved for the query.
RMIT2 addresses a concern over documents with poor content being overly endorsed
in cases where they had several good siblings. The approach taken in RMIT2 is to
limit the total endorsement from siblings and to only allow endorsements from top
scoring documents. This is formalized below in a more terse form than presented by
RMIT [Fuller+1999].
))',(1),,(min(),(),(),()('
∑∧∈
+=qxretdsibdccc dqsim
kdqsimdqsimdqsim
where simc(q,d) is d’s content similarity score for query q, sib(d) is the set of d’s siblings and ret(x,q) is
the set of the ‘x’ top documents retrieved for the query.
Their final algorithm (RMIT3) further restricts sibling endorsements by only allowing
sibling score propagation from the best sibling providing that sibling is an overall top
scoring document. Although this is not formalized in their paper, the obvious
interpretation is presented below.
∑∧∈
+=),()('
)',(1),(),(qxretdtopsibdcc dqsim
kdqsimdqsim
where simc(q,d) is d’s content similarity score for query q, sib(d) is the set of d’s siblings and ret(x,q) is
the set of ‘x’ top documents retrieved for the query.
All three algorithms can be abstracted to a single algorithm with suitable constant
parameters. The pseudo code for that algorithm template is presented in Algorithm 4.
The constant settings that differentiate RMIT, RMIT2 and RMIT3 algorithms are
outlined in table 8. These constant settings are obtained directly from RMIT’s
experimentation. In practice the root set size of 2000 was reduced to 1000 in line
with the settings of the content retrieval baseline runs.

43
Table 8: RMIT algorithm constant settings
Algorithm 't' (Root Set Size)
'k' (Propagation Factor)
'L' (Propagation Limited?)
'x' (Top Results)
'y' (Top Siblings)
RMIT 1000 50 No Unbound Unbound RMIT2 2000 10 Yes 500 Unbound RMIT3 2000 10 No 20 1
Algorithm 4: RMIT, RMIT2 and RMIT3 algorithm template
Let t denote the size of the root set
Let k denote the propagation factor
Let L denote whether propagation scores are capped
Let x denote the number of top retrieved documents from which propagation is allowed
Let y denote the number of top siblings from which propagation is allowed
Let n denote the number of documents to be returned
<Initialise RootSet>
Set RootSet = GetRetrievalResults(ContentRetrieval, t)
For each p є RootSet
Score[p] = GetRetrievalScore(ContentRetrieval, p)
End
<calculate document scores>
For each p є RootSet
Propagated[p] = 0
If L = Yes
Then Limit[p] = Score[P]
Else Limit[p] = infinite
end
For each s є TopSiblings(p,y) ∩ TopRetrieved(x)
If (Propagated[a] + Score[s]) < Limit[p]
Then Score[p] = Score[p] + (Score[s]/k)
Else Score[p] = Score[p] + (Limit[p]-Propagated[p])
End
End
<return top scoring documents>
Return TopScores(BaseSet, n)
3.5 List of Experiments
The product of the experimentation is a series of runs produced by the various
algorithms; each run roughly corresponds to a distinct experiment. In total 4752 runs
were produced and a further 12 baseline content-only runs were pre-computed.

44
Runs vary according to the task (topic set) they were presented with, the link-based
algorithm involved and the parameters passed to algorithms. All runs are given a
unique run id which is an encoding of the algorithm and parameters it was invoked
with.
The four parameters used in algorithm invocations are presented in Table 9.
Table 9: Algorithm parameter values
Parameter Description Possible Values
Content Determines which of the retrieval runs are used in
forming a set and is used in producing fusion runs.
LNU, LM, Okapi
D Refers to a maximal limit on
documents selected to augment a root set, applying
to each root set member.
0,10, 50, I (where I denotes an uncapped D value)
T Refers to the size of the root set. 10, 50
Weight Refers to whether the run is a
non-fusion run, or a fusion run.
T (denotes a non-fusion run), F9, F8, F7 (refers to fusion runs with content weight 0.9,0.8 and 0.7
respectively)
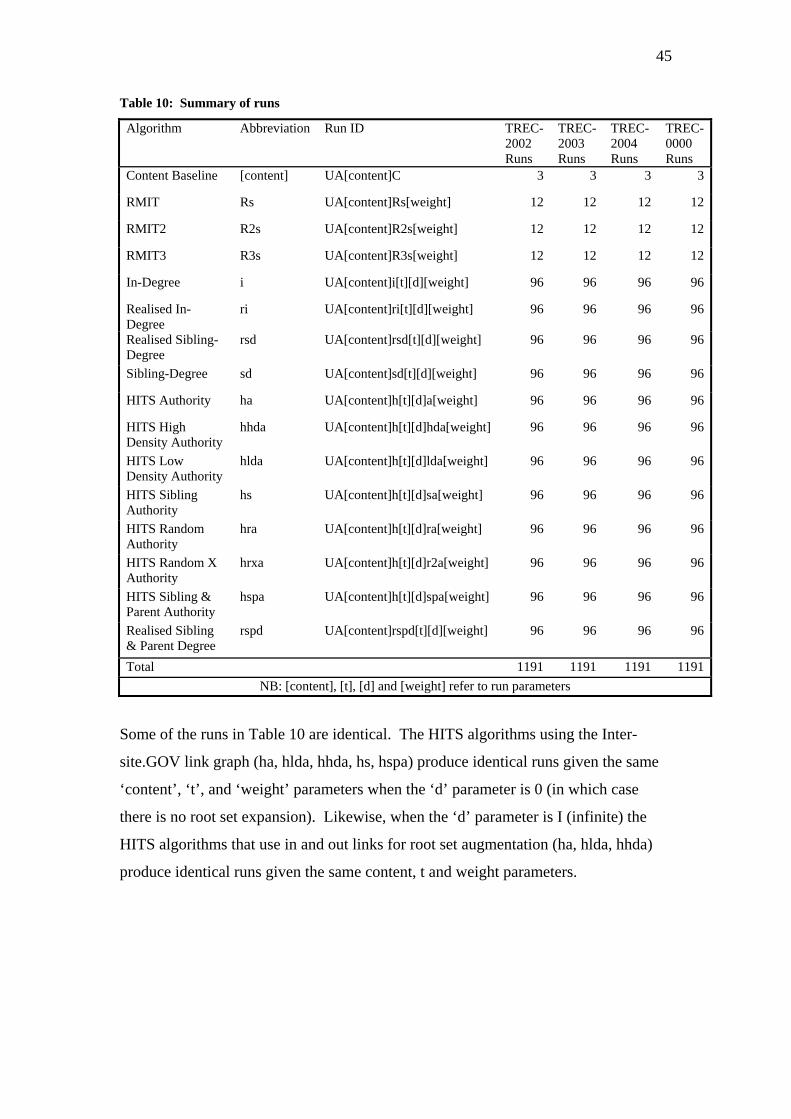
A summary of all runs corresponding to each of the four tasks TREC-
2002/2003/2004/0000 is presented in Table 10.
45
Table 10: Summary of runs
Algorithm Abbreviation Run ID TREC-2002 Runs
TREC-2003 Runs
TREC-2004 Runs
TREC-0000 Runs
Content Baseline [content] UA[content]C 3 3 3 3
RMIT Rs UA[content]Rs[weight] 12 12 12 12
RMIT2 R2s UA[content]R2s[weight] 12 12 12 12
RMIT3 R3s UA[content]R3s[weight] 12 12 12 12
In-Degree i UA[content]i[t][d][weight] 96 96 96 96
Realised In-Degree
ri UA[content]ri[t][d][weight] 96 96 96 96
Realised Sibling-Degree
rsd UA[content]rsd[t][d][weight] 96 96 96 96
Sibling-Degree sd UA[content]sd[t][d][weight] 96 96 96 96
HITS Authority ha UA[content]h[t][d]a[weight] 96 96 96 96
HITS High Density Authority
hhda UA[content]h[t][d]hda[weight] 96 96 96 96
HITS Low Density Authority
hlda UA[content]h[t][d]lda[weight] 96 96 96 96
HITS Sibling Authority
hs UA[content]h[t][d]sa[weight] 96 96 96 96
HITS Random Authority
hra UA[content]h[t][d]ra[weight] 96 96 96 96
HITS Random X Authority
hrxa UA[content]h[t][d]r2a[weight] 96 96 96 96
HITS Sibling & Parent Authority
hspa UA[content]h[t][d]spa[weight] 96 96 96 96
Realised Sibling & Parent Degree
rspd UA[content]rspd[t][d][weight] 96 96 96 96
Total 1191 1191 1191 1191NB: [content], [t], [d] and [weight] refer to run parameters
Some of the runs in Table 10 are identical. The HITS algorithms using the Inter-
site.GOV link graph (ha, hlda, hhda, hs, hspa) produce identical runs given the same
‘content’, ‘t’, and ‘weight’ parameters when the ‘d’ parameter is 0 (in which case
there is no root set expansion). Likewise, when the ‘d’ parameter is I (infinite) the
HITS algorithms that use in and out links for root set augmentation (ha, hlda, hhda)
produce identical runs given the same content, t and weight parameters.

46
3.6 Implementation Details
The fifteen evaluated algorithms were implemented in Perl. The algorithms are
supported by a Perl module (WebRetrieval.pm) which provides a high level interface
to .GOV collection components such as topics, relevance judgments and link structure
data. Additionally, the module offers procedures and functions that abstract on
common Web IR algorithm routines such as vector normalization and root set
expansion. Routines for fusion combination of runs and performance metric
calculations are also made available through the module. Together, the module and
algorithms constitute over 2000 lines of Perl code.
The fusion combination (fusion) of link-structure analysis algorithm runs with content
runs is integrated into the fifteen algorithm scripts. They therefore require only 3 of
the 4 parameters listed in Table 9: ‘t’, ‘d’ and content. The ‘weight’ parameter is not
required since a different run is produced for each possible ‘weight’ parameter value.
Invoking an algorithm therefore results in four runs, a pure non-fusion link-structure
analysis run (sometimes referred to as topology run) and three runs corresponding to
fusions of that run and the content run denoted by the content parameter (fusion runs).
Of the various methods for fusion of runs proposed in [FoxShaw1994], the
‘CombSum’ summation function in which a document’s combined relevance score is
the sum of its normalized relevance scores from each run is used.
The final file produced as a result of algorithm invocations (referred to as ‘.stat’ file)
reports details on each of the four outputted runs, including performance metrics and
pertinent operational data such as base set size and link density. The reports consist
of granular data for each query as well as aggregate and average data over all queries.
Although ‘.stat’ files are structured in a tabular CSV (comma separated values)
format, they are not ideal for reporting. A more robust representation of run data is
made available through an Oracle relational database which is uploaded with data
from the ‘.stat’ files through a Perl DBI [PerlDBI] interface script. Once in Oracle,
performance reports are compiled with SQL scripts.

47
In addition to performance reports, correlation data is also reported. The ‘.stat’ CSV
format file is uploaded into a Microsoft Excel spreadsheet for statistical correlation
analysis via the Excel Analysis ToolPak [ExcelToolPak]. A full report of empirical
correlations between the data pertaining to runs is presented in Appendix A.
The architecture summarised above is illustrated in Figure 3.
Figure 3: FlowChart of experimentation architecture
Perl Retrieval Module
.GOV Collection
Data
Perl Retrieval Algorithm
3.7 Chapter Summary
In this chapter, the experimentation carried out in this research has been detailed. The
background aims and goals directing experiments were clarified before the evaluated
algorithms, baselines, architecture and product of experimentation were presented. In
the next chapter the results yielded from experimentation will be reported.
Correlation Analysis Report
Relevance Rankings File
Microsoft Excel
Spreadsheet
Oracle Relational Database
Performance Reports
Algorithm Parameters
Run Statistics (‘.stat’) Files
Perl DBI Interface
Excel Analysis ToolPak

48
4. Results
In this chapter, the results of experimentation will be sequentially reported in five
sections, each corresponding to one of the research objectives presented in section
3.1.
As is typical in Web IR evaluations, the emphasis is placed on early precision
measures in this chapter. Precision at 10 scores will be the primary criteria when
judging performance but other precision measures evaluated are precision at 5,
precision at 20, r-precision and average precision. Average precision scores often add
a valuable alternative perspective on performance since they are influenced by recall
assessments.
The performance of an algorithm will either be judged by its best scoring run which
corresponds to how it performs under optimal configuration of parameters or by its
mean average score over a number of non-fusion runs. Only non-fusion runs are
considered when comparing mean average run scores because results before fusion
are more characteristic of the link structure analysis performed. All non-fusion runs
produced by algorithms are used as points in mean average run calculations. The
exception is where the mean average score is restricted to unexpanded runs in which
case only runs with a ‘d’ parameter value of 0 are considered.
Of the four topic distillation tasks used in evaluation, results from the unofficial
combined task (TREC-0000) will be quoted most often. Since that task is constituted
by the topics of the three official tasks TREC-200[2-4], it gives a reasonably fair
indication of overall performance. The fact that the TREC-2004 task has roughly
50% more topics than previous years (75 topics - compared to 49 in 2002 and 50 in
2003) means that its topics are likely to have a strong influence on TREC-0000 results
as will the TREC-2002 task topics for which there are the most relevant documents
(see Table 2, section 3.2).
The tables presented in this chapter are largely self-explanatory although a number of
points may need some clarification. Firstly, the value ‘topology’ appearing in

49
‘weighting’ columns denotes a non-fusion run. Secondly, a ‘d’ parameter value of ‘I’
denotes infinite and appears for runs in which root set expansion is uncapped.
Finally, where a table’s row value is blank, the previous specified value in the column
should be taken.
4.1 Algorithm Performance
In this section the performances of all evaluated algorithms are reported. The section
starts by detailing the content-only retrieval run baseline scores against which the
performances of algorithms are compared. With the baseline scores established, the
section continues by assessing the performance of algorithms against the baseline runs
whilst putting scores into context through contrasts with official TREC submissions.
Finally a comparison is made between the performances of the RMIT algorithms as
evaluated here and as evaluated during TREC-8.
Baseline Runs
The performance of the three baseline content-only retrieval runs (LNU, Okapi, and
LM) in the four tasks is detailed in Table 11.
Table 11: Baseline content-only retrieval runs
Task Algorithm Precision at 5
Precision at 10
Precision at 20
Average Precision
r-Precision
lnu 0.1701 0.1443 0.1152 0.1191 0.1348 okapi 0.1563 0.1351 0.1075 0.1139 0.1227 0000 lm 0.0966 0.0828 0.0730 0.0670 0.0816 okapi 0.2776 0.2510 0.1908 0.1922 0.2111 lnu 0.2612 0.2224 0.1724 0.1559 0.1799 2002 lm 0.2041 0.1735 0.1480 0.1221 0.1569 lnu 0.1080 0.0860 0.0690 0.1087 0.1143 okapi 0.0960 0.0740 0.0580 0.0901 0.0845 2003 lm 0.0480 0.0440 0.0370 0.0417 0.0530 lnu 0.1520 0.1320 0.1087 0.1019 0.1189 okapi 0.1173 0.1000 0.0860 0.0785 0.0903 2004 lm 0.0587 0.0493 0.0480 0.0479 0.0514
NB: Ranked by Precision at 10

50
LNU offers the best performance in all but 2002’s task for which Okapi is best.
Since there were far more key resources in 2002’s task, precision scores are
noticeably higher than other years (refer to section 3.2 for an account of task
differences).
Algorithm Performance
Table 12 ranks each of the algorithm’s best runs in the combined TREC Topic
Distillation task (TREC-0000) and compares these to the top scoring TREC-0000
content-only run, which acts as a performance baseline. The run id and parameters
used to produce the top scoring runs can be found in Appendix B.
Table 12: Algorithm optimal scores compared with baselines (TREC-0000 task)
Precision at 5 Precision at 10 Precision at 20 Average Precision R-Precision Rank Algorithm Score Algorithm Score Algorithm Score Algorithm Score Algorithm Score 1) rid 0.2011 rid 0.1644 rid 0.1276 ha 0.1233 rid 0.1406 2) id 0.1943 id 0.1638 id 0.1261 rid 0.1224 id 0.1405 3) sd 0.1908 sd 0.1603 sd 0.1227 hhda 0.1223 Rs 0.1393 4) hspa 0.1862 hspa 0.1592 hspa 0.1210 = hlda R2s 0.1388 5) ha 0.1828 ha 0.1540 ha 0.1207 R3s 0.1218 R3s 0.1380 6) = hhda hhda 0.1534 = hhda R2s 0.1216 hlda 0.1368 7) = hlda = hlda = hlda id 0.1213 rspd 0.1364 8) R3s 0.1805 rsd 0.1506 = hra hspa 0.1212 sd 0.1358 9) hsa 0.1793 = rspd rsd 0.1181 sd 0.1208 rsd 0.1353 10) rsd 0.1782 = hra = rspd Rs 0.1205 ha* 0.1342 11) = rspd 0.1782 R3s 0.1500 R3s 0.1178 rspd 0.1200 hhda* 0.1339 12) R2s 0.1747 hsa 0.1494 hsa 0.1175 rsd 0.1198 hspa* 0.1332 13) Rs 0.1724 R2s 0.1483 R2s 0.1172 hsa 0.1195 hrxa* 0.1305 14) hra* 0.1701 Rs 0.1477 Rs 0.1170 hra* 0.0967 hra* 0.1300 15) = hrxa* 0.1701 hrxa 0.1454 hrxa* 0.1152 hrxa* 0.0965 hsa* 0.1279 Baseline: lnu 0.1701 lnu 0.1443 lnu 0.1152 lnu 0.1191 lnu 0.1348
*Algorithm unable to better baseline score
All except the two random algorithms (HITS Random Authority and HITS Random X
Authority) consistently improve on baseline scores. The only familiar (non-variant)
algorithm that failed to improve on a baseline score was HITS Authority which
marginally fell short of the LNU baseline run’s r-precision score.

51
Realised In-Degree is the best performing algorithm across all metrics except average
precision where HITS Authority excels. Other high achieving algorithms are In-
Degree, HITS Authority and Sibling-Degree which have average ranks of 3, 4.8 and
5.2 across all metrics respectively.
To put these scores into perspective, a comparison between the top run from this
thesis and the top scoring runs submitted for official TREC evaluation is detailed in
Table 13.
Table 13: Comparison between top thesis runs and top TREC submitted runs 200[2-3]
Top Scoring TREC Run Top Scoring Thesis Run
TREC Task Ranking Metric Run ID Score
Run ID (Algorithm) Score TREC Rank
TREC 2002 P_10 thutd5 0.2510 UAlnurid5050F8 0.2265 6th TREC 2003 P_R csiro03td03 0.1636 UAlnurid5050F8 0.1130 11th TREC 2004 P_A uogWebCAU150 0.1790 UAlnurid5050F8 0.1065 12th
The top scoring run in this thesis (UAlnurid5050F8) was produced by the Realised In-
Degree algorithm with content, weight, t and d parameters set to lnu, 0.7, 50 and 50
respectively. Accounts of the TREC 2002, 2003 and 2004 runs referred to in Table
13 are given in TREC Web Track overview papers
[CraswellHawkingWilkinsonWu2004], [CraswellHawking2005],
[CraswellHawking2003]. Interestingly, all top scoring TREC submitted runs in Table
13 use a combination of additional sources of evidence including title indexes, anchor
text indexes and URL forms. The focus in this thesis is on link-structure analysis, so
the comparisons in Table 13 only serve as an indication of the potential effectiveness
of link-structure analysis compared to more extensive techniques.
RMIT Run Comparisons
Interestingly, there is little correlation between the relative precision at 10
performances of the three RMIT University algorithms in TREC-8 as reported by
RMIT [Fuller+1999] 2 and as observed here in the combined TREC task (TREC-
0000). In Table 14, it can be seen that the best run produced by the RMIT2 algorithm
2 RMIT, RMIT2 and RMIT3 correspond to mds08w2, mds08w1 and max-sibling runs referred to in [Fuller+1999]

52
(in terms of precision at 10) in the TREC-0000 task scores higher than the best run
produced by both the other two algorithms although this was not the case when RMIT
experimented with the algorithms in TREC-8.
Table 14: RMIT algorithm TREC-8 and TREC-0000 optimal performance comparisons
Algorithm TREC-8* Precision at 10 TREC-0000 Precision at 10 RMIT 0.386 0.1477RMIT2 0.412 0.1483RMIT3 0.436 0.1477*RMIT runs taken from TREC-8's small web task
When considering the mean average performance (across all runs), the results are
mixed. RMIT3 (R3s) is consistently the worst across all metrics and RMIT2 (R2s) is
best in all metrics except for precision at 10 where RMIT is marginally better (Table
15).
Table 15: RMIT sibling propagation algorithm mean average performance (across all runs)
Algorithm Average Precision
at 5
Average Precision
at 10
Average Precision
at 20
Average -
Average Precision
Average r-
Precision
Rs 0.1475 0.1259 0.1024 0.1018 0.1149 R2s 0.1494 0.1257 0.1024 0.1028 0.1152 R3s 0.1387 0.1226 0.1023 0.0950 0.1090 NB: Ranked by Precision at 10
4.2 Algorithm Tuning
In this section, findings pertaining to each of the 4 algorithm parameters introduced in
section 3.5 (Table 9) are presented. ‘t’ and ‘d’ parameter findings have been reported
together in the final sub-section, whereas the content parameter and fusion weighting
parameter findings are reported in separate sub-sections.
Content parameter
Of the four key run parameters: d, t, content and weight introduced in Table 9 (refer
back to section 3.5). The type of content retrieval root set used (content parameter) is
understandably the most significant. Its significance is illustrated in Table 16, where
it can be seen that over all runs, the precision of the root set correlates significantly to

53
the early precision scores of runs. A full explanation of the correlation figures
presented in Table 16 can be found in Appendix A.
Table 16: Correlation between run performance metrics and root set precision and recall
Correlation Between Root Set Attributes
and Run* Performance
PREC
ISIO
N R
OO
T SE
T
REC
ALL
RO
OT
SET
AVERAGE PRECISION 0.13 0.65
R-PRECISION 0.40 0.40
PRECISION@5 0.49 0.22
PRECISION@10 0.58 0.09
PRECISION@20 0.58 0.24
*Fusion and content runs excluded
Interestingly there seems to be a clear difference between the top performing
algorithms when only LNU content retrieval root set runs are considered and when
only Okapi content retrieval root set runs are considered. Tables 17 and 18 illustrate
this incongruity in terms of precision at 10 for the combined-TREC task (TREC-
0000). From table 17, it’s clear that Realised In-Degree performs the best when only
LNU root set runs are considered whilst the sibling propagation algorithms perform
best when only Okapi root set runs are considered.

54
Table 17: Best lnu content run rankings per algorithm (precision at 10 for TREC-0000 task)
Precision at 10 Algorithm Content Type T D Weighting RUN_ID
0.1644 rid lnu 50 50 ct73 UAlnurid5050F7 ct82 UAlnurid5050F8
0.1638 id lnu 50 0 ct73 UAlnuid500F7 ct82 UAlnuid500F8
0.1603 sd lnu 50 0 ct73 UAlnusd500F7 0.1592 hspa lnu 50 I ct73 UAlnuh50IspaF7
0.154 ha lnu 50 50 ct82 UAlnuh5050aF8 0.1534 hhda lnu 50 50 ct82 UAlnuh5050hdaF8
hlda lnu 50 50 ct82 UAlnuh5050ldaF8 0.1506 hra lnu 50 I ct73 UAlnuh50IraF7
rsd lnu 50 0 ct82 UAlnursd500F8 rspd lnu 50 0 ct82 UAlnurspd500F8
0.15 R3s lnu 0 0 ct82 UAlnuR3sF8 0.1494 hsa lnu 50 0 ct73 UAlnuh500saF7
ct82 UAlnuh500saF8 0.1483 R2s lnu 0 0 topology UAlnuR2sT 0.1477 Rs lnu 0 0 topology UAlnuRsT 0.1454 hrxa lnu 50 10 ct91 UAlnuh5010rxaF9
50 ct91 UAlnuh5050rxaF9 I ct91 UAlnuh50IrxaF9
0.1443 lnu lnu 0 0 content UAlnuC NB: ct-n-x=fusion run with content weight 0.n and topology weight 0.x

55
Table 18: Best Okapi content run rankings per algorithm (precision at 10 for TREC-0000 task)
Precision at 10 Algorithm Content Type T D Weighting RUN_ID
0.1425 R2s okapi 0 0 topology UAokapiR2sT Rs okapi 0 0 topology UAokapiRsT
0.1391 R3s okapi 0 0 ct73 UAokapiR3sF7 0.1362 hra okapi 50 10 ct73 UAokapih5010raF7
id okapi 10 10 ct73 UAokapiid1010F7 ct82 UAokapiid1010F8 ct91 UAokapiid1010F9 50 ct73 UAokapiid1050F7 ct91 UAokapiid1050F9 I ct73 UAokapiid10IF7 ct91 UAokapiid10IF9
0.1351 ha okapi 10 0 topology UAokapih100aT hhda okapi 10 0 topology UAokapih100hdaT hlda okapi 10 0 topology UAokapih100ldaT hrxa okapi 10 0 ct73 UAokapih100rxaF7 ct82 UAokapih100rxaF8 ct91 UAokapih100rxaF9 topology UAokapih100rxaT 50 0 ct73 UAokapih500rxaF7 ct82 UAokapih500rxaF8 ct91 UAokapih500rxaF9 hsa okapi 10 0 topology UAokapih100saT hspa okapi 10 0 topology UAokapih100spaT okapi okapi 0 0 content UAokapiC rid okapi 10 0 topology UAokapirid100T rsd okapi 10 0 topology UAokapirsd100T rspd okapi 10 0 topology UAokapirspd100T sd okapi 10 0 topology UAokapisd100T
NB: ct-n-x=fusion run with content weight 0.n and topology weight 0.x
Further, although there is no significant correlation between the rank of each
algorithm’s optimal run in the TREC-2002 task and other year’s tasks (Table 19 and
Table 20). The correlation becomes significant when the rankings are restricted to
only Okapi runs (Table 21 and Table 22) and LNU runs (Table 23 and Table 24). The
correlation figures quoted in Table 19,21 and 23 are calculated as described in
Appendix A.

56
Table 19: Optimal run correlations Table 20: Optimal algorithm run - rank & score
TREC 2002 TREC 2003 TREC 2004 2002 Optimal Run Rank & Score
Correlation Score Rank Score 0.34 2003 Rank 0.39 Score 0.43 2004 Rank 0.37
Algorithm Score Rank Score Rank Score Rank Rid 0.251 8.5 0.1040 1 0.1693 1 Id 0.2531 1 0.1020 2 0.1653 2 Sd 0.251 8.5 0.0980 6.5 0.1587 3
Hspa 0.251 8.5 0.1000 3 0.1573 4 ha 0.251 8.5 0.0980 6.5 0.1507 6 hhda 0.251 8.5 0.0980 6.5 0.1493 7.5 hlda 0.251 8.5 0.0980 6.5 0.1493 7.5 hra 0.251 8.5 0.0980 6.5 0.1373 13.5 rsd 0.251 8.5 0.0880 14 0.1467 10 rspd 0.251 8.5 0.0880 14 0.1480 9 R3s 0.251 8.5 0.0880 14 0.1533 5 hsa 0.251 8.5 0.0980 6.5 0.1373 13.5 R2s 0.251 8.5 0.0900 11.5 0.1427 11 Rs 0.251 8.5 0.0920 10 0.1387 12 hrxa 0.251 8.5 0.0900 11.5 0.1347 15
Table 21: Optimal LNU run correlations Table 22: Optimal algorithm LNU run – rank & score
2002 Optimal LNU Run
Rank & Score Correlation Score Rank
Score 0.87 2003 Rank 0.90 Score 0.57 2004 Rank 0.50
TREC 2002 TREC 2003 TREC 2004
Algorithm Score Rank Score Rank Score Rank
rid 0.2306 1.5 0.1040 1 0.1693 1 id 0.2306 1.5 0.1020 2 0.1653 2 sd 0.2265 7 0.0980 6.5 0.1587 3 hspa 0.2286 3.5 0.1000 3 0.1573 4
ha 0.2265 7 0.0980 6.5 0.1507 6 hhda 0.2265 7 0.0980 6.5 0.1493 7.5 hlda 0.2265 7 0.0980 6.5 0.1493 7.5 hra 0.2286 3.5 0.0980 6.5 0.1373 13.5 rsd 0.2245 11 0.0880 14 0.1467 10 rspd 0.2245 11 0.0880 14 0.1480 9 R3s 0.2224 13.5 0.0880 14 0.1533 5 hsa 0.2265 7 0.0980 6.5 0.1373 13.5 R2s 0.2204 15 0.0900 11.5 0.1427 11 Rs 0.2224 13.5 0.0920 10 0.1387 12
hrxa 0.2245 11 0.0900 11.5 0.1347 15
LNU Runs Only

57
Table 23: Optimal Okapi run correlations
Table 24: Optimal algorithm Okapi run – rank & score
TREC 2002 TREC 2003 TREC 2004 Algorithm Score Rank Score Rank Score Rank rid 0.251 8.5 0.0740 10.5 0.1093 5
id 0.2531 1 0.0840 1 0.1160 3 sd 0.251 8.5 0.0740 10.5 0.1040 6 hspa 0.251 8.5 0.0740 10.5 0.1000 12.5 ha 0.251 8.5 0.0740 10.5 0.1000 12.5 hhda 0.251 8.5 0.0740 10.5 0.1000 12.5 hlda 0.251 8.5 0.0740 10.5 0.1000 12.5 hra 0.251 8.5 0.0780 3.5 0.1013 7.5 rsd 0.251 8.5 0.0740 10.5 0.1000 12.5 rspd 0.251 8.5 0.0740 10.5 0.1000 12.5 R3s 0.251 8.5 0.0780 3.5 0.1120 4 hsa 0.251 8.5 0.0740 10.5 0.1000 12.5 R2s 0.251 8.5 0.0780 3.5 0.1187 2 Rs 0.251 8.5 0.0780 3.5 0.1253 1 hrxa 0.251 8.5 0.0780 10.5 0.1013 7.5
Okapi Runs Only
2002
Optimal Okapi Run Rank &
Score Correlation Score Rank Score 0.76 2003 Rank 0.52 Score 0.34 2004 Rank 0.32
Although the same behaviour doesn’t hold for LM content-retrieval root set runs,
Tables 19-24 collectively present anecdotal evidence that given LNU and Okapi root
sets the success of algorithms relative to one another (algorithm ranks) is somewhat
independent of the task (topic set). It seems for example that whilst Realised In-
Degree generally works better than In-Degree given LNU content retrieval root sets,
the opposite is true where Okapi content retrieval root sets are used.
It would be reasonable on this evidence to further speculate that the properties of
documents that make them attractive to a particular content-retrieval algorithm could
also make those documents attractive to a particular link-structure analysis technique
and that compatible combinations of content-retrieval and link-structure analysis
algorithms could boost results.
Fusion Weighting Parameter
It is clear from Table 25 that without fusion, only the Sibling Propagation algorithms
can improve on content retrieval run baselines. The other algorithms all fair better

58
when a fusion with a content run is applied (refer back to Table 12). The data in
Table 25 corresponds to the TREC-0000 task, but the same is true of all the three
official tasks TREC-200[2-4] (refer to appendix B for details).
Table 25: Best non-fusion run per algorithm compared with baseline
Precision at 5 Precisoin at 10 Precision at 20 Average Precision R-Precision Rank Algorithm Score Algorithm Score Algorithm Score Algorithm Score Algorithm Score 1) R2s* 0.1747 R2s* 0.1483 R3s* 0.1193 R2s* 0.1216 Rs* 0.1393 2) Rs* 0.1724 R3s* 0.1477 R2s* 0.1178 Rs* 0.1205 R2s* 0.1388 3) id 0.1678 = Rs* Rs* 0.1172 R3s 0.1106 R3s 0.1273 4) R3s 0.1609 Id 0.1408 id 0.1009 id 0.0703 id 0.1038 5) sd 0.1598 hsa 0.1241 rid 0.0828 rid 0.0592 sd 0.0846 6) rid 0.154 Rid 0.1213 sd 0.0822 sd 0.0572 rid 0.0840 7) hspa 0.1264 hspa 0.1115 hspa 0.0767 hspa 0.0544 hspa 0.0772 8) ha 0.1241 Sd 0.1092 ha 0.0764 hld 0.0532 ha 0.0758 9) = hhd Rsd 0.1029 = hhd ha 0.0529 = hhd 10) = hld rspd 0.0948 = hld = hsa = hld 11) = hsa ha 0.0931 = hsa hhd 0.0528 = hsa 12) rsd 0.1034 = hhd rsd 0.0707 rsd 0.0458 rsd 0.0649 13) = rspd = hld = rspd = rspd = rspd 14) hrxa 0.0816 hra 0.0753 hra 0.0644 hrxa 0.0403 hra 0.0596 15) hra 0.0805 = hrxa = hrxa hra 0.0400 = hrxa Baseline lnu 0.1701 lnu 0.1443 lnu 0.1152 lnu 0.1191 lnu 0.1348
*Algorithms that were able to better baseline scores are highlighted
Figure 4 conveys the effect that a 0.9 content weighted fusion has on the average
performance of algorithms in the TREC-0000 task. The observations made here for
the TREC-0000 task are reflected in the three official TREC tasks (TREC-200[2-4]).
A 0.9 content weighting for fusion was used in Figure 4 because on average 0.9
weighted fusions lead to greater performance increases than 0.8 and 0.7 weighted
fusions (Figure 5).

59
Figure 4: Mean average algorithm performance with and without fusion
Mean Average Precision@10 Score With/Without Fusion
0 0.05 0.1 0.15
hra
id
hrxa
hhda
sd
ha
hlda
rspd
rsd
rid
hspa
hsa
R3s
R2s
Rs
Algo
rith
m
Precision@10
With FusionWithout Fusion

60
Figure 5: Mean average performance improvement after application of fusion
Mean Average Performance Improvement After Fusion
125.29%
71.95%
121.34%
76.65%
125.17%
71.07%
119.17%
74.58%
123.99%
69.25%
117.18%
71.94%
0% 50% 100% 150%
Preciscion at10
Precision at20
AveragePrecision
R-Precision
Met
ric
Percentage Improvement
0.7 Content Weighted Fusion
0.8 Content Weighted Fusion
0.9 Content Weighted Fusion
T and D Parameters
The table of optimized algorithm runs is dominated by runs in which the higher ‘t’
parameter value of 50 features (Table 26). Although for all of the HITS family
algorithms a high d parameter value of 50 or infinite is prudent, the opposite is true of
the degree algorithms for which optimal results are attained when using lower ‘d’
parameter values. Realised In-Degree is the exception, since its optimal run was
attained with a d parameter setting of 50. The high ‘t’, low ‘d’, parameter value
combination is also successful for precision@5, precision@20 and r-precision
metrics, however for average precision - higher ‘d’ parameter values are typical in
optimal runs (Table 27).
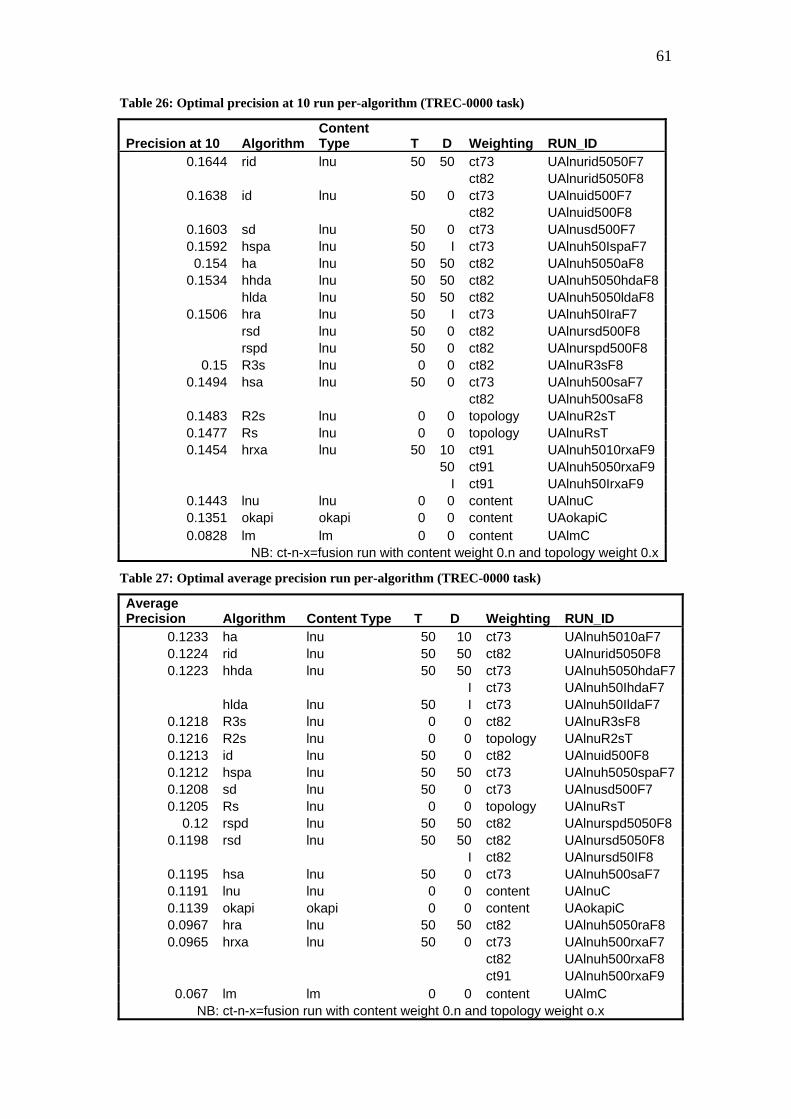
61
Table 26: Optimal precision at 10 run per-algorithm (TREC-0000 task)
Precision at 10 Algorithm Content Type T D Weighting RUN_ID
0.1644 rid lnu 50 50 ct73 UAlnurid5050F7 ct82 UAlnurid5050F8
0.1638 id lnu 50 0 ct73 UAlnuid500F7 ct82 UAlnuid500F8
0.1603 sd lnu 50 0 ct73 UAlnusd500F7 0.1592 hspa lnu 50 I ct73 UAlnuh50IspaF7
0.154 ha lnu 50 50 ct82 UAlnuh5050aF8 0.1534 hhda lnu 50 50 ct82 UAlnuh5050hdaF8
hlda lnu 50 50 ct82 UAlnuh5050ldaF8 0.1506 hra lnu 50 I ct73 UAlnuh50IraF7
rsd lnu 50 0 ct82 UAlnursd500F8 rspd lnu 50 0 ct82 UAlnurspd500F8
0.15 R3s lnu 0 0 ct82 UAlnuR3sF8 0.1494 hsa lnu 50 0 ct73 UAlnuh500saF7
ct82 UAlnuh500saF8 0.1483 R2s lnu 0 0 topology UAlnuR2sT 0.1477 Rs lnu 0 0 topology UAlnuRsT 0.1454 hrxa lnu 50 10 ct91 UAlnuh5010rxaF9
50 ct91 UAlnuh5050rxaF9 I ct91 UAlnuh50IrxaF9
0.1443 lnu lnu 0 0 content UAlnuC 0.1351 okapi okapi 0 0 content UAokapiC 0.0828 lm lm 0 0 content UAlmC
NB: ct-n-x=fusion run with content weight 0.n and topology weight 0.x
Table 27: Optimal average precision run per-algorithm (TREC-0000 task)
Average Precision Algorithm Content Type T D Weighting RUN_ID
0.1233 ha lnu 50 10 ct73 UAlnuh5010aF7 0.1224 rid lnu 50 50 ct82 UAlnurid5050F8 0.1223 hhda lnu 50 50 ct73 UAlnuh5050hdaF7
I ct73 UAlnuh50IhdaF7 hlda lnu 50 I ct73 UAlnuh50IldaF7
0.1218 R3s lnu 0 0 ct82 UAlnuR3sF8 0.1216 R2s lnu 0 0 topology UAlnuR2sT 0.1213 id lnu 50 0 ct82 UAlnuid500F8 0.1212 hspa lnu 50 50 ct73 UAlnuh5050spaF70.1208 sd lnu 50 0 ct73 UAlnusd500F7 0.1205 Rs lnu 0 0 topology UAlnuRsT
0.12 rspd lnu 50 50 ct82 UAlnurspd5050F8 0.1198 rsd lnu 50 50 ct82 UAlnursd5050F8
I ct82 UAlnursd50IF8 0.1195 hsa lnu 50 0 ct73 UAlnuh500saF7 0.1191 lnu lnu 0 0 content UAlnuC 0.1139 okapi okapi 0 0 content UAokapiC 0.0967 hra lnu 50 50 ct82 UAlnuh5050raF8 0.0965 hrxa lnu 50 0 ct73 UAlnuh500rxaF7
ct82 UAlnuh500rxaF8 ct91 UAlnuh500rxaF9
0.067 lm lm 0 0 content UAlmC NB: ct-n-x=fusion run with content weight 0.n and topology weight o.x

62
4.3 Influence of Link Density
The intention in devising HITS High Density Authority and HITS Low Density
Authority was to produce runs in which typical base set link densities were different
to those from HITS Authority runs. On average both HITS High Density Authority
and HITS Low Density Authority runs feature a lower link density than HITS
Authority which selects in and out linked documents in the order they form when
links are sequentially extracted from documents (thus better preserving natural Web
link clusters).
It is clear from Table 28 that the mean average performance of the algorithms across
different metrics is mixed. The higher density algorithm (HITS Authority) performs
well in average precision and r-precision assessments, whilst the lowest density
algorithm (HITS Low Density Authority) performs better in precision@5,
precision@10 and precision@20 assessments. The performance differences across all
metrics are less than emphatic.
Table 28: Density HITS algorithm performance summary
Algorithm Average Base
Set Link Density
Average Expand Set Size
Average Precision
at 5
Average Precision
at 10
Average Precision
at 20
Average -
Average Precision
Average r-
Precision
hlda 0.5632 35.54 0.0783 0.0708 0.0572 0.0367 0.0567ha 0.6743 44.25 0.0778 0.0703 0.0571 0.0372 0.0575hhda 0.6241 35.5 0.0716 0.0655 0.0525 0.0346 0.0534
NB: Ordered by Average Precision at 10.
These inconclusive results are reflected in the marginal differences between the
optimal runs for each of the three algorithms (refer back to Table 12).
Perhaps surprisingly, there is a significant negative empirical correlation between the
link densities of base sets for the runs of these algorithms and the various performance
metrics (Table 29). The correlation figures quoted in Table 29 are calculated using
the formula given in Appendix A.

63
Table 29: Correlations between performance metrics and base set link densities.
Correlations Base Set Link Densities
Average Precision -0.2596R-Precision -0.2724
Precision at 5 -0.5250Precision at 10 -0.6185Precision at 20 -0.3406
HITS Density Related Algorithms: hhda,hlda,ha
A likely explanation for this correlation is that runs in which root sets are unexpanded
(and therefore have lower link densities) perform better than runs in which root sets
are expanded. Since root sets are expanded using in and out links, the link densities
of the poorer performing expanded root set runs are consequently higher.
What is more conclusive is that both the precision and recall of the expand set are
higher when the density of the base set is higher (Table 30 and Table 31). This means
that HITS Authority algorithm runs (with their higher link densities) augmented their
root set with more relevant documents.
Table 30: Average expand set precision for density related HITS algorithm runs
Algorithm Average Base Set Link Density
Average Expand Set Size
Average Expand Set Precision
ha 0.6743 44.25 0.0140 hhda 0.6241 35.50 0.0135 hlda 0.5632 35.54 0.0132 NB: Ranked by average expand set precision
Table 31: Average expand set recall for density related HITS algorithm runs
Algorithm Average Base Set Link Density
Average Expand Set Size
Average Expand Set Recall
ha 0.6743 44.25 0.0140 hhda 0.6241 35.50 0.0135 hlda 0.5632 35.54 0.0132 NB: Ranked by average expand set recall

64
4.4 Effects of Randomisation
Table 32 contrasts the random link graph featuring HITS RandomX Authority and
HITS Random Authority algorithms (refer to Table 6 for differences) with the natural
link graph based HITS Authority algorithm firstly over all runs and then secondly
over all runs in which the root set was unexpanded (as is the case when the ‘d’
parameter is set to 0). Restricting the analysis to runs in which root sets were not
expanded emphasizes the effect of differences in link semantics, or lack of link
semantics in the case of the random HITS algorithms. In these unexpanded root set
runs, the randomisation of links affected by the HITS RandomX and HITS Random
algorithms lead to relatively small falls in mean average precision (over all
unexpanded runs) when compared to the HITS Authority algorithm (Table 32).

65
Randomization Related HITS Algorithm Mean Average Run Performance
0.0000 0.0200 0.0400 0.0600 0.0800 0.1000 0.1200
Precision at 5 (d=0)
Precision at 5
Precision at 10 (d=0)
Precision at 10
Precision at 20 (d=0)
Precision at 20
Average Precision (d=0)
Average Precision
R-Precision (d=0)
R-Precision
ha hrxa hra
Figure 6: Randomisation related HITS algorithm mean average performance over all/unexpanded root set runs
Table 32: Randomisation related HITS algorithm run, mean average performance data (expanded and unexpanded root set runs where d parameter is 0)
ALGORITHM Pre
cisi
on a
t 5 (d
=0)
Pre
cisi
on a
t 5
Pre
cisi
on a
t 10
(d=0
)
Pre
cisi
on a
t 10
Pre
cisi
on a
t 20
(d=0
)
Pre
cisi
on a
t 20
Ave
rage
Pre
cisi
on (d
=0)
Ave
rage
Pre
cisi
on
r-P
reci
sion
(d=0
)
r-Pre
cisi
on
ha 0.0996 0.0778 0.1018 0.0703 0.0642 0.0571 0.0400 0.0372 0.0625 0.0575 hrxa 0.0839 0.0486 0.0929 0.0489 0.0596 0.0383 0.0339 0.0233 0.0550 0.0375 hra 0.0837 0.0430 0.0929 0.0438 0.0595 0.0362 0.0339 0.0213 0.0550 0.0326 ha to hrxa decrease 15.76% 37.53% 8.74% 30.44% 7.17% 32.92% 15.25% 37.37% 12.00% 34.78% ha to hra decrease 15.96% 44.73% 8.74% 37.70% 7.32% 36.60% 15.25% 42.74% 12.00% 43.30%

66
When root set expansion is taken into account, the effect of randomisation is
understandably dramatic since documents with no semantic relation to root set
documents dilute the base set.
It is noticeable that the mean average performance of runs from the HITS RandomX
algorithm is marginally better than that of the HITS Random algorithm. This
indicates that preserving document degrees does not counter the effect of polluting
link semantics, but may in fact exaggerate it.
From the perspective of optimal runs produced by the random HITS algorithms,
fusion with content tends to offset the degradation caused by the randomisation of
links meaning that although performance is largely poorer than other algorithms (refer
back to Table 12) it is still comparable with some most noticeably when precision at
10 performance is considered (refer back to Table 26).
4.5 Utility of Siblings
Table 33 overviews a number of comparisons between sibling and non-sibling
approaches taken in the experimentation. It is clear from the table that overall, the
classical non-sibling approaches produce better results than the trialled sibling
approaches. In the remainder of this section details of the comparisons are presented.

67
Table 33: Comparisons between Sibling and Non-Sibling approaches
Mean Average Performance Optimal Run Performance Comparison Sibling Non-Sibling Sibling Non-Sibling
Global Degree Algorithm Performance x x
Global Degree Algorithm Performance (without root set expansion)
x x
Realised Degree Algorithm Performance x x
Realised Degree Algorithm Performance (without root set expansion)
x x
HITS Algorithm Performance x x Augmentation Set Precision x Augmentation Set Recall x
Global Degree Algorithm Performance
Here we compare the performance of all In-Degree algorithm runs with Sibling-
Degree algorithm runs. The two algorithms vary by both the way they expand their
root set and the degree measure they use in re-ranking.
It is apparent from Table 12 (refer back to section 4.1) that the best runs produced by
the In-Degree algorithm outperform the best runs produced by the Sibling-Degree
algorithm across all 5 metrics. However, from the perspective of mean average
performance over all runs (excluding fusion runs) - Sibling Degree averaged better
runs across all metrics (Table 34).
Table 34: Sibling-Degree and In-Degree algorithm runs mean average performance scores
Algorithm Degree Measure
Average Precision
at 5
Average Precision
at 10
Average Precision
at 20
Average -
Average Precision
Average r-
Precision
sd sibling-degree 0.0748 0.0796 0.0546 0.0329 0.0547
id in-degree 0.0429 0.0463 0.0414 0.0254 0.0390 NB: Ranked by average precision at 10

68
Global Degree Algorithm Performance (without root set expansion)
Table 35 contrasts the effectiveness of sibling-degree and in-degree measures for re-
ranking. Only runs produced by the In-Degree and Sibling-Degree algorithms for
which no root set expansion occur are considered. By concentrating on runs with no
root set expansion, the different expansion techniques are prevented from factoring in
the results.
Table 35: Comparison between in-degree and sibling-degree re-ranking mean average performance across unexpanded root set runs
Algorithm Degree Measure
Average Precision
at 5
Average Precision
at 10
Average Precision
at 20
Average - Average Precision
Average r-
Precision
id in-degree 0.1358 0.1207 0.0746 0.0512 0.0781
sd sibling-degree 0.1180 0.1076 0.0667 0.0427 0.0648
NB: Ranked by average precision at 10
Across all metrics, in-degree re-ranking betters sibling-degree re-ranking.
From the perspective of the (optimal) best run produced by each algorithm, the In-
Degree runs are again better across all metrics (Table 36).
Table 36: Optimal global degree algorithm comparison
Algorithm Precision at 5 Precision at 10 Precision at 20 Average Precision R-Precision
In-Degree UAlnuid500F7 0.1943 UAlnuid500F7 0.1683 UAlnuid500F7 0.1261 UAlnuid500F8 0.1213 UAlnuid500F9 0.1405
Sibling-Degree UAlnusd500F7 0.1908 UAlnusd500F7 0.1603 UAlnusd500F7 0.1227 UAlnusd500F7 0.1208 UAlnusd500F7 0.1337
Realised Degree Algorithm Performance
The results when comparing Realised Sibling-Degree with Realised In-Degree runs
are similar to the global degree findings. Mean average performance of Realised In-
Degree runs is better than that of Realised Sibling-Degree (Table 37).
Table 12 (refer to section 3.1) reveals that optimal Realised In-Degree runs far
outperform Realised Sibling-Degree runs across all five metrics.

69
Table 37: Realised degree algorithms mean average performance comparison
Algorithm Degree Measure
Average Precision
at 5
Average Precision
at 10
Average Precision
at 20
Average -
Average Precision
Average r-
Precision
rid in-degree 0.1083 0.0887 0.0646 0.0416 0.0647
rsd sibling-degree 0.0672 0.0718 0.0504 0.0306 0.0485
NB: Ranked by average precision at 10
Realised Degree Algorithm Performance (without root set expansion)
Table 38 compares the effectiveness of realised sibling-degree and in-degree
measures in re-ranking results. Runs in which the root set was expanded are filtered
out, since the algorithms Realised In-Degree and Realised Sibling-Degree expand
their root sets differently.
Table 38: Mean average performance of realised degree algorithms across unexpanded root set runs
Algorithm Degree Measure
Average Precision
at 5
Average Precision
at 10
Average Precision
at 20
Average -
Average Precision
Average r-
Precision
rid in-degree 0.0998 0.1018 0.0642 0.0398 0.0624
rsd sibling-degree 0.0929 0.0977 0.0619 0.0365 0.0575
NB: Ranked by average precision at 10
The results from Table 38 reflect the results of the earlier comparison between global
degree algorithms (Table 35) except the margin between the in-degree reliant
Realised In-Degree algorithm and the sibling-degree reliant Realised Sibling-Degree
algorithm is narrower.
From the perspective of optimal runs, Realised Sibling-Degree outperforms Realised
In-Degree in all metrics except precision at 10 (Table 39).

70
Table 39: Realised degree algorithm optimal unexpanded root set run performance
Algorithm Precision at 5 Precision at 10 Precision at 20 Average Precision R-Precision
Realised In-Degree UAlnurid500F7: 0.1770 UAlnurid500F8: 0.1529 UAlnurid500F8: 0.1178 UAlnurid500F7: 0.1181 UAlnurid500F8: 0.1281
Realised Sibling-Degree UAlnursd500F7: 0.1782 UAlnursd500F8: 0.1506 UAlnursd500F9: 0.1181 UAlnursd100F9: 0.1185 UAlnursd100F7: 0.135
HITS Algorithms Performance
The three HITS based algorithms HITS Sibling Authority, HITS Sibling & Parent
Authority and HITS Authority only differ in terms of how they perform root set
expansion. The mean average performance of these algorithms over 24 equivalently
configured runs is contrasted below.
Table 40: Comparison of HITS algorithm run mean average performance
Algorithm Augmentation Relationship
Average Precision
at 5
Average Precision
at 10
Average Precision
at 20
Average -
Average Precision
Average r-
Precision
hsa sibling 0.0851 0.0885 0.0603 0.0376 0.0603
hspa sibling & parent 0.0955 0.0869 0.061 0.0412 0.0637
ha in & out link 0.0778 0.0703 0.0571 0.0372 0.0575NB: Ranked by average precision at 10
HITS Sibling & Parent Authority exhibits the best mean average performance for all
metrics excepting precision at 10 and on average comfortably improves on HITS
Authority scores (by nearly 20% for precision at 10). Interestingly, HITS Sibling
Authority runs are also on average better than HITS authority. The success of HITS
Sibling & Parent authority is also reflected in the precision at 10 rankings of optimal
runs produced by the two algorithms (refer to Table 12, section 4.1), where the top
HITS Sibling & Parent authority run outperforms it’s HITS Authority counterpart.
Augmentation Set Precision
An analysis of the precision of the expand set (set difference between the base set and
root set) offers more insight into the merits of the different methods of expanding the
root set.

71
In table 41 the mean average precision of all expand sets derived through either in-
and out-link, sibling, sibling and parent or random link (in the case of random link
graph algorithms) expansion are contrasted.
Table 41: Comparing mean average expand set precision for different expansion techniques
Augmentation Relationship Average Expand Set Size
Average Expand Set Precision
sibling & parent 44.7778 0.0187 in & out link 54.3444 0.0183 sibling 20.1111 0.0172 random 74.9167 0.0001 NB: Ranked by average expand set recall sibling expansion algorithms={sd,rsd,hs} sibling & parent expansion algorithms={rspd,hspa}
in & out_link expansion algorithms={id,rid,ha,hlda,hhda}
random expansion algorithms={hra, hrxa}
Expand sets obtained through sibling and parent expansions are marginally more
precise than those obtained through in and out link expansions. Expand sets obtained
randomly are almost totally imprecise.
Augmentation Set Recall
Table 42 contrasts the recall of the different types of expand sets, where recall of an
expand set is defined as the fraction of all relevant documents in the expand set.
Table 42: Comparison of expand set recall for different expansion methods
Augmentation Relationship Average Expand Set Size Average Expand
Set Recall
in & out link 54.3444 0.0501sibling & parent 44.7778 0.0310sibling 20.1111 0.0181random 74.9167 0.0003NB: Ranked by average expand set recall sibling expansion algorithms={sd,rsd,hs} sibling & parent expansion algorithms={rspd,hspa}
in & out_link expansion algorithms={id,rid,ha,hlda,hhda}
random expansion algorithms={hra, hrxa}

72
In and out link expansion comfortably outperforms the others, whilst random expand
sets are almost baron of relevant documents.
4.6 Chapter Summary
In this chapter findings from experiments have been organised and reported in relation
to the earlier established research objectives. The chapter serves to detail key results
from the experimentation; a thorough analysis of those results is reserved for the next
chapter.

73
5. Conclusion
This chapter features analysis of the results from the experimentation presented in the
previous chapter. In section 5.1, results relating to the primary research objective of
evaluating the effectiveness of link-based methods are analysed. Additionally, results
pertaining to the tuning of algorithms are summarised. Results relating to the utility
of sibling relationships proved to be extensive and section 5.2 is dedicated to
analysing that particular secondary research objective. The analysis of results is
completed with the final two secondary research objectives (determining the influence
of link density and effects of link randomisation) in section 5.3. Finally, in section
5.4 a number of proposals for further research in relation to link-based methods for
Web Retrieval are proposed.
5.1 Effectiveness of Link-Based Methods
A range of link-structure analysis techniques as embodied by evaluated algorithms
have proven able to improve on the performance of content-only retrieval baselines.
Of the familiar link-based algorithms evaluated – Realised In-Degree, In-Degree,
RMIT, RMIT2 and RMIT3 produced runs (under optimal configuration) that
improved on baseline content-only retrieval runs across all considered performance
metrics; precision at 5, precision at 10, precision at 20, average precision and r-
precision. The remaining familiar algorithm - HITS Authority, produced runs that
bettered content-only retrieval run baseline scores across all considered performance
metrics bar r-precision where the content-only retrieval baseline run scored
marginally higher (0.1348 compared to 0.1342, as seen in Table 12). Realised In-
Degree was the top performing algorithm from the perspective of the early precision
measures: precision at 5, precision at 10, precision at 20 and r-precision where it
produced runs bettering content-only retrieval baseline run scores by 18.2%, 13.9%,
10.8% and 4.3% respectively. Improvements were less dramatic in terms of the

74
average precision performance metric where HITS Authority was superior producing
a run that bettered the content-only retrieval baseline score by 3.5%.
The value of link-structure analysis was further emphasised by the performances of
the variant algorithms (excepting HITS Random Authority and HITS Random X
Authority which experimented with randomised link structures). HITS High Density
Authority, HITS Low Density Authority, HITS Sibling Authority, Sibling Degree,
Realised Sibling Degree and Realised Sibling & Parent Degree, all produced runs
improving on content-only retrieval baseline scores across the metrics: precision at 5,
precision at 10, precision at 20 and average precision. Although R-precision
improvements on content-only retrieval baseline runs were more elusive since the
HITS based variant algorithms including HITS Authority itself were the only variants
unable to yield improved runs.
It is noticeable that improvements on content-only retrieval baselines were more
elusive in the official TREC-2002 task than in the later TREC-2003 and TREC-2004
tasks (refer to Appendix B). Only the In-Degree algorithm was able to improve on
the precision at 10 Okapi content-only retrieval baseline in 2002’s task.
Improvements in algorithm performance at TREC-2003 and TREC-2004 tasks
correspond to the change in the nature of the topic distillation task itself. Unlike
2002’s task, the later tasks restricted relevant resources to home pages and the topic
distillation task therefore had strong navigational search characteristics
[CraswellHawking2005-B]. Navigational search is a category of search that link-
based methods have already been shown to be effective in [SinghalKaszkiel2001]
[KraaijWesterveldHiemstra2002]. The effectiveness of in-degree was demonstrated
by [KraaijWesterveldHiemstra2002] who show that the use of in-degree priors in a
language model ranking method improves on content-only retrieval in the TREC-
2001 Home Page Finding task. In the experimentation carried out by
[SingelKazkiel2001], link-structure analysis was not clearly demarcated since
commercial Web search engines were used as representative link-structure analysis
systems although such search engines typically mix link-structure analysis with
anchor text indexing and other factors.

75
The experimentation carried out here has demonstrated that combining link-structure
analysis with content analysis improves on content-only retrieval in topic distillation
searches. However, to answer the broader question of how effective link-structure
analysis is in Web IR as a whole, a better understanding is needed of how
representative topic distillation and navigational searches (a category of search in
which link-structure analysis has already been shown to be effective) are of Web
searches in general. Suggestions from studies [Broder2002] are that these categories
of search could account for more than 50% of all searches; which underlines the value
of link-structure analysis in the broader context.
In addition to confirming the effectiveness of link-based methods the experimentation
has yielded some insight into the tuning of algorithm parameters. Although optimal
configurations for algorithms vary on a case to case basis, generally fusion content
weights of 0.8 and 0.7, ‘t’ parameter values of 50 and ‘d’ parameter values of 0 have
proven to be characteristic of the top runs produced by algorithms (refer back to Table
26).
A few exceptions to the trend are seen in the sibling propagation algorithms which
generally do not improve as a result of fusion and the Realised In-Degree algorithm
which works best with higher ‘d’ parameter values. The local degree factor in
realised degree calculations are likely to counter the effects of topic drift that usually
result from high ‘d’ parameter values.
5.2 Utility of Sibling Relationships
Various studies [Davison2000][Menczer2001] have concluded that linked pages are
likely to be more similar than a random selection of pages. Davison goes a step
further in revealing that when considering only inter-domain links (almost equivalent
to inter-site links); co-cited URLs are likely to be more similar than linked URLs.

76
The University of Twente produced data on the indirect relevance of documents based
on propagated in- and out-link relevance as part of their TREC-9 Web Track efforts
[KraaijWesterveld2000].
∑∈
=)( )(deg
)()(doutlinksi dreeout
irelevancydOutlinkrel ∑∈
=)( )(deg
)()(dinlinksi dreein
irelevancydInlinkrel
In their formulations relevancy(i) is a binary function mapping relevant documents to
the value 1. A similar formulation not considered by Twente is indirect relevance
based on propagated sibling relevance.
∑∈
=)( )(deg
)()(dsiblingi dreesibling
irelevancydSiblingrel
Table 43 details Twente’s findings in relation to TREC-8 relevance judgments
alongside indirect in-, out-link and sibling relevance for the combined TREC-0000
task.
Table 43: Mean average indirect relevance scores across all relevant .GOV documents
Average InLinkRel(d) AverageOutLinkRel(d) AverageSiblingRel(d)
TREC-0000 0.011745 0.014800 0.011107 TREC-8 0.064735 0.026876
It is noticeable that there is more indirect out-linked relevance than indirect in-linked
relevance for relevant documents for TREC-0000 which is very different to Twente’s
findings for TREC-8 and could indicate that relevance judges in later years have
followed out-links from relevant documents when finding more relevant documents.
The more pertinent observation is that the indirect sibling relevance of relevant
documents is less than the indirect in- or out-link relevance of those documents,
which somewhat contradicts Davison’s findings. The implications of that result is
that augmenting the root set with a given number of siblings is no more likely to
prevent topic drift than augmenting with the same number of in- or out-linked
documents. Table 41 (refer back to section 4.5) bears out this finding, since the
average precision of expand sets obtained through sibling expansion is shown to be
lower than that obtained through in- and out-link expansion.

77
Table 41 also reveals that the sibling and parent expansion technique leads to
marginally more precise expand sets than in- and out-link expansion which goes some
way to explaining the success of employing sibling and parent expansion in the HITS
Sibling and Parent algorithm. All other algorithm variants in which sibling or sibling
and parent expansion were trialled did not improve on the performance of their in/out-
link expansion counterparts.
When comparing the algorithms featuring degree measure re-ranking, the mean
average performance of the Sibling-Degree algorithm was around 70% better than
that of its In-Degree counterpart. Although this suggests sibling-degree is a more
useful re-ranking criterion, a closer examination of Sibling-Degree algorithm runs
reveals that far fewer base-set documents were re-ranked in comparison to In-Degree
algorithm runs. Of the top 10 base set documents only 1 document was changed as a
result of re-ranking in the case of Sibling-Degree whereas an average of 5 changes
resulted from In-Degree re-ranking. The more conservative re-ranking applied by the
Sibling-Degree algorithm leaves more reliable content-retrieval judgments in tact,
hence the higher scores. However fusion with a content run rewards the less
conservative re-ranking performed by the In-Degree algorithm, hence the superior
optimal run scores produced by In-Degree. The reason that Sibling-Degree re-ranking
is more conservative is clear from table 44 where it can be seen that the probability
that a document has a sibling and hence a non-zero sibling degree is far lower than the
probability that a document has an in-link and thus a non-zero in-degree.
Table 44: Probability of having relation
Relation Total Documents with Relation Probability of Having Relation In-Link 806,551 0.646402774 Out-Link 153,908 0.123348131 Sibling 35,371 0.028347758 Only Inter-site links considered: Total number of documents is 1,247,753
Figure 7 confirms that the potential to discern relevance through sibling-degree is
about the same as through in-degree. The graph is plotted on a log scale and clearly
illustrates that rises in all three degree levels lead to roughly equivalent rises in the
probability of document relevance.

78
Figure 7: Prior probability of link degrees for combined TREC-0000 tasks
To conclude, in the combined TREC-0000 task, siblings offer neither better topic
locality (as seen in table 43) nor better degree-level to relevance probability ratios (as
seen in Figure 7) and as a result the trials of sibling-based variant algorithms were
largely unsuccessful. Where sibling algorithms were able to improve on standard
in/out link approaches their success tends to be due to conservative re-ranking owing
to the relative scarcity of documents with sibling relationships compared to in/out-link
relationships (as seen in Table 44).
5.3 Link Density and Link Randomisation
We start this section with an analysis of results relating to link density manipulation
experiments before moving onto link randomisation.

79
Results from the experimentation tentatively refute the suggestion that higher link
densities are as valuable in the context of Web IR as they are in Clustering
[EversonFisher2002]. The higher base set density driven approach to root set
expansion experimented with in the HITS High Density Authority algorithm lead to
generally poorer performance than the opposite approach trialled in the HITS Low
Density Authority algorithm. The positive effect that higher base set densities have
on expand set and correspondingly base set precision are not reflected in overall
precision measures.
In reference to randomisation - as expected, both randomisation-based HITS
algorithms that were trialled lead to poorer performance than standard HITS. Further,
the preservation of document in- and out- degrees featured in the HITS Random
algorithm did not offset the deterioration of link semantics since performance was no
better than the HITS Random X algorithm which did not preserve link degrees.
Interestingly, once fusion with content results is applied the optimal performances of
both random algorithms are comparable with content-only retrieval baselines and
even manage to improve on the precision at 20 baseline score (refer back to Table 12).
This suggests that after fusion, link-structure analysis methods such as HITS are
somewhat resilient to perturbations in link structure.
5.4 Further Work
Two areas for further research related to this thesis have been identified;
Correlation Analysis of Link-Based Algorithm Runs
Combining Content-Retrieval and Link-Analysis Methods
Correlation Analysis of Link-Based Algorithm Runs

80
Correlations between a number of the numeric attributes pertaining to the runs
evaluated in this thesis are presented in Appendix A. The attributes range from
overlap between top 10 base set documents before and after re-ranking to
performance metrics.
Many of the correlations are co-incidental and do not denote causation. Other
correlations may offer helpful insights into optimizing and developing improved link-
based methods. A thorough examination of the correlations between data pertinent to
runs, based on perhaps more extensive data than presented in appendix A is a
worthwhile exercise.
Combining Content-Retrieval and Link-Analysis Methods
When considering combining link-analysis and content-retrieval methods, the focus
tends to be on fusion of result sets [Yang2001]. In section 4.1, tentative evidence was
presented of ties between content retrieval methods and link-analysis methods.
Specifically, there was evidence that a root set sourced from an Lnu.ltc vector model
content retrieval had more positive implications for Realised In-Degree algorithms
than sibling propagation algorithms. Such allegiances between link-analysis and
content retrieval implementations could be due to interesting phenomena such as
document properties that are favourable to instances from both classes of algorithms
(perhaps as simple as document length). An understanding of which pairings of link
and content analysis methods are particularly compatible and why would be helpful in
optimizing the performance of link-based algorithms on a particular collection given
prior knowledge of the performance of content-based algorithms on that collection.

81
Bibliography
[AltaVista] About AltaVista, http://www.altavista.com/about/
[AmentoTerveenHill2000] B. Amento, L. Terveen, W. Hill, Does authority mean
quality? Predicting Expert Quality Ratings of Web Documents. In Proceedings of the
23rd International ACM SIGIRConference on Research and Development in
Information Retrieval, pages 296—303. 2000
[Amitay2003] E. Amitay, D. Carmel, M. Herscovici, R. Lempel, A. Soffer, U. Weiss ,
Temporal link analsysis, IBM Research Lab (Haifa), 2003,
[BaileyCraswellHawking2001] N. Bailey, N. Craswell, D. Hawking, Engineering a
multi-purpose test collection for Web Retrieval experiments, Information Processing
and Management 2003 (39) p 853-872, 2001
[BrinPage1998] S. Brin and L. Page. The PageRank citation ranking: Bringing order
to the web. In Proceedings of the 7th International World Wide Web Conference,
pages 161—172. 1998
[BrinPage1998-B] S. Brin and L. Page. The anatomy of a large-scale hypertextual
Web search engine. In Proceedings of the 7th World Wide Web Conference
(WWW7). 1998
[Broder2000] A. Broder, R. Kumar, F. Maghoul, P. Raghavan, S. Rajagopalan, R.
Stata, A. Tomkins, J. Wiener. Graph structure in the Web. Journal of Computer
Networks, 33(1-6), 309-320. 2000
[Broder2002] A. Broder, A Taxonomy of Search, SIGIR Forum, Vol. 36, No. 2., pp.
3-10. 2002

82
[BuckleySinghalMitra1995] C. Buckley, A. Singhal and M. Mitra. New retrieval
approaches using SMART TREC4. In Proceedings of The Fourth Text Retrieval
Conference (TREC-4), pages 25-48. 1998
[Chakrabarti1998] S. Chakrabarti, B. Dom, P. Raghavan, S. Rajagopalan, D. Gibson,
and J. Kleinberg. Automatic resource compilation by analyzing hyperlink structure
and associated text. Computer Networks and ISDN Systems, 30(1--7):65—74. 1998
[Chakrabarti1998-B] S. Chakrabarti, B. Dom, S. R. Kumar, P. Raghavan, S.
Rajagopalan, and A. Tomkins. Experiments in topic distillation. SIGIR workshop on
Hypertext IR. 1998
[Cooper1968] W. Cooper. Expected search length: A single measure of retrieval
effectiveness based on the weak ordering action of retrieval systems. In American
Documentation, 19(1), 30--41. 1968
[CraswellHawking2003] N. Craswell, D. Hawking. Overview of the TREC-2002
Web Track, The Eleventh Text REtrieval Conference (TREC 2002). 2003
[CraswellHawkingWilkinsonWu2004] N. Craswell, D. Hawking, R. Wilkinson, M.
Wu, Overview of the TREC-2003 Web Track, The Twelfth Text REtrieval
Conference (TREC 2003) p78-92. 2004
[CraswellHawking2005] N. Craswell, D. Hawking. Overview of the TREC-2004
Web Track, In the Thirteenth Text Retrieval Conference (TREC 2004). 2005
[CraswellHawking2005-B] D. Hawking, N. Craswell. Very Large Scale Retrieval
and Web Search, In TREC Experimentation and Evaluation in Information Retrieval.
2005
[CutlerShihMeng1997] M. Cutler, Y. Shih, W. Meng. Using the Structure of HTML
Documents to Improve Retrieval. In USENIX Symposium on Internet Technologies
and Systems (NSITS'97), p241-251. 1997

83
[Davison2000] B. Davison, Topical Locality in the Web. In Proceedings of the 23rd
National International ACM SIGIR Conference. 2000
[EversonFisher2003] M. Fisher, R. Everson. When are links useful? Experiments in
text classification. In Advances in IR, 25th European Conference on IR research,
ECIR, 41—56. 2003
[ExcelToolPak] About the Microsoft Excel Analysis ToolPak. http://www.add-
ins.com/Analysis_ToolPak.htm.
[FoxShaw1994] E.A. Fox and J.A. Shaw. Combination of multiple searches. In The
Second Text Retrieval Conference (TREC-2), p243-252. 2002
[Fuller+1999] M. Fuller, M. Kaszkiel, S. Kimberley, C. Ng, R. Wilkinson, M. Wu, J.
Zobel. The RMIT/CSIRO Ad Hoc, Q&A, Web, Interactive, and Speech Experiments
at TREC 8. In the Eighth Text Retrieval Conference (TREC-8) p549-565. 1999
[Garfield1972] E. Garfiled. Citation analysis as a tool in journal evaluation, Science
178 p471-479. 1972
[GwizdkaChignell1999] J. Gwizdka and M. Chignell. Towards Information Retrieval
Measures for Evaluation of Web Search Engines. Unpublished manuscript. 1999
[Haveliwala2002] T. H. Haveliwala, Topic Sensitive Page Rank. In Proceedings of
the 11th International Word Wide Web Conference. 2002
[HawkingCraswellRobertson2001] Effective Site Finding using Link Anchor
Information. In Proceedings of the 24th annual international ACM SIGIR conference
on research and development in information retrieval. 2001
[HenzingerBharat1998] M. Henzinger, Improved Algorithms for Topic Distillation in
a Hyperlinked Environment. In Proceedings of the 21st Annual International ACM
SIGIR Conference on Research and Development in Information Retrieval. 1998

84
[Hiemstra2001] D. Hiemstra. Using Language Models for Information Retrieval.
PhD thesis, University of Twente. 2001
[Huang2000] L. Huang, A Survey on Web Information Retrieval Technologies.
Tech. rep., ECSL. 2000
[Joachims2002] T. Joachims. Evaluating Retrieval Performance using Clickthrough
Data. Proceedings of the SIGIR Workshop on Mathematical/Formal Methods in
Information Retrieval (2002). 2002
[JansenSpinkSaracevic2000] B.J. Jansen, A.Spink and T.Saracevic. Real life, real
users & real needs: Study and analysis of user queries on the web. Information
Processing and Management, 36(2):207 – 227. 2000
[KampsMonzdeRijke2003] J. Kamps, C. Monz, M. de Rijke, The University of
Amsterdam at TREC 2002. In the Eleventh Text Retrieval Conference (TREC2002),
p603-614, 2003
[Kleinberg1998] Authoritative sources in a hyper linked environment. Proceedings
ACM-SIAM Symposium on Discrete Algorithms. 1998
[KraaijWesterveld2000] W. Kraaij, T. Westerveld, TNO/UT at TREC-9: How
different are Web documents? In the Ninth Text Retrieval Conference (TREC-9),
2000
[KraaijWesterveldHiemstra2002] W. Kraaij, T. Westerveld, D. Hiemstra, The
importance of prior probabilities for entry page search. In Proceedings of SIGIR'02.
27—34. 2002
[Lempel2000] R. Lempel, The Stochastic Approach for Link-Structure Analysis
(SALSA) and the TKC effect. Proceedings of the 9th International World Wide Web
Conference. 2000

85
[Marchiori1997] Massimo Marchiori. The quest for correct information on the web.
Comput. Netw. ISDN Syst., 29(8-13):1225—123. 1997
[Menczer2001] F. Menczer, Links tell us about lexical and semantic web content, In
CoRR Journal, 2001
[MonzdeRijke2002] C. Monz and M. de Rijke. Shallow morphological analysis in
monolingual information retrieval for Dutch, German and Italian. In Evaluations of
Cross-Language Information Retrieval Systems, CLEF 2001, volume 2406 of Lecture
Notes in Computer Science, pages 262-277. 2002
[Moreno1934] J.L. Moreno, Who shall survive? Formulations of sociometry, Group
Psychotherapy and Socio Drama. New York: Beacon Press. 1934
[NgZhengJordan2001] A. Y. Ng , Alice X. Zheng, M. I. Jordan, Stable algorithms for
Link Analysis. In Proceedings of the 24th ACM SIGIR Conference. 2001
[ODP] Open Directory Project, http://dmoz.org/about.html
[PerlDBI] About Perl Database Interface, http://dbi.perl.org/about/
[PonteCroft1988] Jay M. Ponte and W Bruce Croft, A Language Modeling Approach
to Information Retrieval. In Proceedings of the 21st ACM SIGIR Conference. 1998
[RichardsonDomingos2002] M. Richardson, P. Domingos. The Intelligent Surfer:
Probabilistic Combination of Link and Content Information in PageRank. In
NIPS*14. 2002
[Robertson1977] Robertson S.E., The probability ranking principle in IR. Journal of
Documentation, 33, p294-304. 1977
[RobertsonWalkerBeaulieu2000] S. Robertson, S. Walker and M. Beaulieu.
Experimentation as a way of life: Okapi at TREC. Information Processing &
Management, 36, p95-108. 2000

86
[RossiMelliaCasetti2003] D. Rossi, C. Casetti, M. Mellia, User Patience and the Web:
a hands-on investigation, IEEE Globecom 2003, p1-5. 2003
[Salton1968] G. Salton, Automatic information organization and retrieval, McGraw-
Hill, New York, 18. 1968
[SaltonBuckley1988] G. Salton and C. Buckley. Term-Weighting Approaches In
Automatic Text Retrieval, Information Processing Management, 24(5):513—523.
1988
[Sankaran1995] Neeraja Sankaran. Speculation in the biomedical community
abounds over likely candidates for nobel. The Scientist 9(19). 1995
[SchneidermanByrdCroft1997] Schneiderman, D. Byrd and W.B. Croft. Clarifying
search: A user-interface framework for text searches. D-Lib Magazine. 1997
[SinghalKaszkiel2001] A. Singhal, M. Kaszkiel. A case study in Web Search using
TREC algorithms. In Proceedings of the Tenth International World Wide Web
Conference, pages 708-716. 2001
[Snowball2003] Snowball. Stemming algorithms for use in information retrieval,
2003. http://www.snowball.tartarus.org/
[Soboroff2002] I. Soboroff, Do TREC web collections look like the Web? SIGIR
Forum, 36 (2): p22-31, 2002
[TREC] Text Retrieval Conference, http://trec.nist.gov
[TRECWebTrack] TREC Web Track home page. http://www.nist.gov/cgi-
bin/exit_nist.cgi?url=http://es.cmis.csiro.au/TRECWeb/
[UniversityGlasgowIRDistribution] University of Glasgow Web Research Collections
home page. http://ir.dcs.gla.ac.uk/test_collections/
87
[vanRijsbergen1979] C.J. van Rijsbergen. Information Retrieval, 1979
[Vivisimo] http://clusty.com/about
[WuCrestani2003] S. Wu and F. Crestani. Methods for ranking information retrieval
systems without relevance judgments, In proceedings of the ACM Symposium on
Applied Computing Conference, (pp 811-816), 2003
[Yang2001] K. Yang. Combining Text and Link-Based Methods of Information
Retrieval. InThe Tenth Text REtrieval Conference (TREC 2001), 2001

88
Appendix A Empirical Correlations
A number of attributes and performance metrics pertaining to each run were collected
and formed into data sets. The data points within data sets correspond to the mean
average attribute or metric value over all of a run’s queries. Only runs from the
combined TREC-0000 task were considered.
The correlation figures quoted in Table 45 and Table 46 are produced by the
Microsoft Excel Analysis ToolPak [ExcelToolPak] and measure the covariance of a
pair of data sets divided by the product of their standard deviations.
∑
∑
=
=
−−=
−=
⋅=
n
iii
n
iiX
YX
yyxxn
YX
and
xxn
where
YXYXncorrelatio
1
2
1
))((1),cov(
)(1
),cov(),(
σ
σσ
Correlation values approach 1 when larger values of one set are associated with the
larger values of the other and approach -1 when larger values of one set are associated
with the smaller values of the other. A correlation value near 0 denotes no relation
between associated data set values.
Correlations between pairs of run attributes are tabulated in Table 45 and correlations
between run attributes and run performance metrics are tabulated in Table 46. The
term expand set used in several attributes refers to the set difference between the base
set and root set.

89
Table 45: Correlations in-between run-attribute pairs
Cor
rela
tion
Bet
wee
n A
ttrib
utes
BA
SE S
ET L
INK
DEN
SITY
RO
OT
SET
SIZE
BA
SE S
ET S
IZE
EXPA
ND
SET
SIZ
E
RO
OT
SET
PREC
ISIO
N
BA
SE S
ET P
REC
ISIO
N
EXPA
ND
SET
PR
ECIS
ION
RO
OT
SET
REC
ALL
BA
SE S
ET R
ECA
LL
EXPA
ND
SET
REC
ALL
RO
OT
SET
REL
EVA
NT
DO
CS
BA
SE S
ET R
ELEV
AN
T D
OC
S
TOPI
C R
ELEV
AN
T D
OC
S
BASE SET LINK DENSITY 1.00
ROOT SET SIZE -0.16 1.00
BASE SET SIZE 0.03 0.96 1.00
EXPAND SET SIZE 0.69 -0.07 0.20 1.00
ROOT SET PRECISION 0.07 -0.31 -0.34 -0.13 1.00
BASE SET PRECISION -0.39 -0.24 -0.35 -0.39 0.79 1.00 EXPAND SET PRECISION 0.37 -0.20 -0.20 -0.01 0.26 0.08 1.00
ROOT SET RECALL -0.01 0.77 0.82 0.22 -0.32 -0.27 -0.33 1.00
BASE SET RECALL 0.12 0.73 0.80 0.31 -0.34 -0.32 -0.22 0.98 1.00 EXPAND SET RECALL 0.64 -0.12 0.00 0.45 -0.16 -0.30 0.53 -0.01 0.19 1.00
ROOT SET RELEVANT DOCS 0.00 0.74 0.77 0.18 -0.08 -0.08 -0.21 0.83 0.81 -0.05 1.00 BASE SET RELEVANT DOCS 0.12 0.70 0.76 0.26 -0.07 -0.11 -0.12 0.82 0.82 0.09 0.98 1.00 TOPIC RELEVANT DOCS 0.11 0.00 0.02 0.08 0.70 0.54 0.17 0.02 0.00 -0.09 0.41 0.42 1.00

90
Table 46: Correlation between attributes and performance metrics
Cor
rela
tion
Bet
wee
n A
ttrib
utes
an
d Pe
rfor
man
ce M
etric
s
BA
SE S
ET L
INK
DEN
SITY
RO
OT
SET
SIZE
BA
SE S
ET S
IZE
EXPA
ND
SET
SIZ
E
RO
OT
SET
PREC
ISIO
N
BA
SE S
ET P
REC
ISIO
N
EXPA
ND
SET
PR
ECIS
ION
RO
OT
SET
REC
ALL
BA
SE S
ET R
ECA
LL
EXPA
ND
SET
REC
ALL
RO
OT
SET
REL
EVA
NT
DO
CS.
BA
SE S
ET R
ELEV
AN
T D
OC
S.
TOPI
C R
ELEV
AN
T D
OC
S.
AVERAGE PRECISION -0.20 0.62 0.57 -0.16 0.13 0.27 -0.10 0.65 0.63 -0.05 0.72 0.70 0.29
R-PRECISION -0.21 0.41 0.33 -0.24 0.40 0.51 0.05 0.40 0.37 -0.09 0.58 0.57 0.50
PRECISION@5 -0.25 0.24 0.17 -0.25 0.49 0.66 0.00 0.22 0.19 -0.14 0.40 0.38 0.52
PRECISION@10 -0.37 0.17 0.08 -0.33 0.58 0.81 -0.02 0.09 0.04 -0.23 0.30 0.27 0.52
PRECISION@20 -0.21 0.27 0.19 -0.29 0.58 0.65 0.09 0.24 0.20 -0.15 0.48 0.46 0.63
*Fusion and content-only baseline runs excluded

91
Appendix B Algorithm Optimal Run Performance Reports
In this appendix 20 SQL reports are presented. The reports are extracted from the
Oracle relational database set up to house data on algorithm runs. They detail the
parameter combinations and run ids of the best scoring run(s) produced by each
algorithm for all pairs of evaluation metrics and tasks. The metrics assessed are:
precision at 5 (referred to in reports as precision_5), precision at 10 (precision_10),
precision at 20 (precision_20), average precision (precision_A) and r-precision
(precision_R) and the tasks are 0000 (for the synthesized combined-task), 2002, 2003
and 2004 for the three official TREC tasks.
The reports are largely self-explanatory although a number of points may need some
clarification. Firstly, the value ‘topology’ under the ‘weighting’ column denotes a
non-fusion run, the values ct73, ct82 and ct91 are used for fusion runs with content
weightings of 0.7, 0.8 and 0.9 respectively. Secondly, a ‘d’ parameter value of ‘I’
denotes infinite and appears for runs in which root set expansion is uncapped.
Finally, where a row value is blank, the previous specified value in the column should
be taken.
Optimized-Algorithm Rankings: precision_10
==========================================
TREC Topic Distillation Task: 0000
PRECISION_10 ALGORITHM CONTENT_TYPE T D WEIGHTING RUN_ID
------------ ------------ -------------- ---- ---- ---------- ----------------------
.1644 rid lnu 50 50 ct73 UAlnurid5050F7
ct82 UAlnurid5050F8
.1638 id lnu 50 0 ct73 UAlnuid500F7
ct82 UAlnuid500F8
.1603 sd lnu 50 0 ct73 UAlnusd500F7
.1592 hspa lnu 50 I ct73 UAlnuh50IspaF7
.1540 ha lnu 50 50 ct82 UAlnuh5050aF8
.1534 hhda lnu 50 50 ct82 UAlnuh5050hdaF8
hlda lnu 50 50 ct82 UAlnuh5050ldaF8
.1506 hra lnu 50 I ct73 UAlnuh50IraF7
rsd lnu 50 0 ct82 UAlnursd500F8
rspd lnu 50 0 ct82 UAlnurspd500F8
.1500 R3s lnu 0 0 ct82 UAlnuR3sF8
.1494 hsa lnu 50 0 ct73 UAlnuh500saF7
ct82 UAlnuh500saF8
.1483 R2s lnu 0 0 topology UAlnuR2sT
.1477 Rs lnu 0 0 topology UAlnuRsT
.1454 hrxa lnu 50 10 ct91 UAlnuh5010rxaF9

92
50 ct91 UAlnuh5050rxaF9
I ct91 UAlnuh50IrxaF9
.1443 lnu lnu 0 0 content UAlnuC
.1351 okapi okapi 0 0 content UAokapiC
.0828 lm lm 0 0 content UAlmC
Optimized-Algorithm Rankings: precision_10
==========================================
TREC Topic Distillation Task: 2002
PRECISION_10 ALGORITHM CONTENT_TYPE T D WEIGHTING RUN_ID
------------ ------------ -------------- ---- ---- ---------- ----------------------
.2531 id okapi 10 10 ct82 UAokapiid1010F8
ct91 UAokapiid1010F9
50 ct91 UAokapiid1050F9
I ct91 UAokapiid10IF9
.2510 R2s okapi 0 0 ct73 UAokapiR2sF7
ct82 UAokapiR2sF8
R3s okapi 0 0 ct82 UAokapiR3sF8
Rs okapi 0 0 ct73 UAokapiRsF7
ct82 UAokapiRsF8
ha okapi 10 0 topology UAokapih100aT
hhda okapi 10 0 topology UAokapih100hdaT
hlda okapi 10 0 topology UAokapih100ldaT
hra okapi 10 0 ct73 UAokapih100raF7
ct82 UAokapih100raF8
ct91 UAokapih100raF9
topology UAokapih100raT
50 0 ct73 UAokapih500raF7
ct82 UAokapih500raF8
ct91 UAokapih500raF9
50 ct91 UAokapih5050raF9
I ct91 UAokapih50IraF9
hrxa okapi 10 0 ct73 UAokapih100rxaF7
ct82 UAokapih100rxaF8
ct91 UAokapih100rxaF9
topology UAokapih100rxaT
50 0 ct73 UAokapih500rxaF7
ct82 UAokapih500rxaF8
ct91 UAokapih500rxaF9
hsa okapi 10 0 topology UAokapih100saT
hspa okapi 10 0 topology UAokapih100spaT
okapi okapi 0 0 content UAokapiC
rid okapi 10 0 topology UAokapirid100T
rsd okapi 10 0 topology UAokapirsd100T
rspd okapi 10 0 topology UAokapirspd100T
sd okapi 10 0 topology UAokapisd100T
.2224 lnu lnu 0 0 content UAlnuC
.1735 lm lm 0 0 content UAlmC
Optimized-Algorithm Rankings: precision_10
==========================================
TREC Topic Distillation Task: 2003
PRECISION_10 ALGORITHM CONTENT_TYPE T D WEIGHTING RUN_ID
------------ ------------ -------------- ---- ---- ---------- ----------------------
.1040 rid lnu 50 10 ct82 UAlnurid5010F8

93
50 ct82 UAlnurid5050F8
.1020 id lnu 50 0 ct82 UAlnuid500F8
.1000 hspa lnu 50 50 ct73 UAlnuh5050spaF7
I ct73 UAlnuh50IspaF7
.0980 ha lnu 50 0 ct73 UAlnuh500aF7
hhda lnu 50 0 ct73 UAlnuh500hdaF7
hlda lnu 50 0 ct73 UAlnuh500ldaF7
hra lnu 50 10 ct73 UAlnuh5010raF7
hsa lnu 50 0 ct73 UAlnuh500saF7
sd lnu 50 0 ct73 UAlnusd500F7
ct82 UAlnusd500F8
.0920 Rs lnu 0 0 topology UAlnuRsT
.0900 R2s lnu 0 0 topology UAlnuR2sT
hrxa lnu 50 10 ct73 UAlnuh5010rxaF7
50 ct73 UAlnuh5050rxaF7
I ct73 UAlnuh50IrxaF7
.0880 R3s lnu 0 0 ct91 UAlnuR3sF9
rsd lnu 50 0 ct82 UAlnursd500F8
ct91 UAlnursd500F9
rspd lnu 50 0 ct82 UAlnurspd500F8
ct91 UAlnurspd500F9
.0860 lnu lnu 0 0 content UAlnuC
.0740 okapi okapi 0 0 content UAokapiC
.0440 lm lm 0 0 content UAlmC
Optimized-Algorithm Rankings: precision_10
==========================================
TREC Topic Distillation Task: 2004
PRECISION_10 ALGORITHM CONTENT_TYPE T D WEIGHTING RUN_ID
------------ ------------ -------------- ---- ---- ---------- ----------------------
.1693 rid lnu 50 50 ct73 UAlnurid5050F7
.1653 id lnu 50 0 ct73 UAlnuid500F7
.1587 sd lnu 50 0 ct73 UAlnusd500F7
ct82 UAlnusd500F8
.1573 hspa lnu 50 50 ct73 UAlnuh5050spaF7
I ct73 UAlnuh50IspaF7
.1533 R3s lnu 0 0 ct73 UAlnuR3sF7
.1507 ha lnu 50 10 ct73 UAlnuh5010aF7
50 ct82 UAlnuh5050aF8
.1493 hhda lnu 50 50 ct73 UAlnuh5050hdaF7
ct82 UAlnuh5050hdaF8
I ct73 UAlnuh50IhdaF7
hlda lnu 50 I ct73 UAlnuh50IldaF7
.1480 rspd lnu 50 10 ct82 UAlnurspd5010F8
.1467 rsd lnu 50 0 ct73 UAlnursd500F7
ct82 UAlnursd500F8
.1427 R2s lnu 0 0 topology UAlnuR2sT
.1387 Rs lnu 0 0 topology UAlnuRsT
.1373 hra lnu 50 50 ct73 UAlnuh5050raF7
I ct73 UAlnuh50IraF7
hsa lnu 50 0 ct73 UAlnuh500saF7
ct82 UAlnuh500saF8
.1347 hrxa lnu 50 10 ct82 UAlnuh5010rxaF8
50 ct82 UAlnuh5050rxaF8
I ct82 UAlnuh50IrxaF8
.1320 lnu lnu 0 0 content UAlnuC
.1000 okapi okapi 0 0 content UAokapiC

94
.0493 lm lm 0 0 content UAlmC
NB: ct-n-x=fusion run with content weight 0.n
Optimized-Algorithm Rankings: precision_5
==========================================
TREC Topic Distillation Task: 0000
PRECISION_5 ALGORITHM CONTENT_TYPE T D WEIGHTING RUN_ID
----------- ------------ -------------- ---- ---- ---------- ----------------------
.2011 rid lnu 50 50 ct73 UAlnurid5050F7
.1943 id lnu 50 0 ct73 UAlnuid500F7
.1908 sd lnu 50 0 ct73 UAlnusd500F7
.1862 hspa lnu 50 10 ct73 UAlnuh5010spaF7
50 ct73 UAlnuh5050spaF7
.1828 ha lnu 50 I ct73 UAlnuh50IaF7
hhda lnu 50 I ct73 UAlnuh50IhdaF7
hlda lnu 50 I ct73 UAlnuh50IldaF7
.1805 R3s lnu 0 0 ct73 UAlnuR3sF7
.1793 hsa lnu 50 0 ct73 UAlnuh500saF7
.1782 rsd lnu 50 0 ct73 UAlnursd500F7
rspd lnu 50 0 ct73 UAlnurspd500F7
.1747 R2s lnu 0 0 topology UAlnuR2sT
.1724 Rs lnu 0 0 topology UAlnuRsT
.1701 hra lnu 10 0 ct73 UAlnuh100raF7
ct82 UAlnuh100raF8
ct91 UAlnuh100raF9
50 0 ct82 UAlnuh500raF8
ct91 UAlnuh500raF9
10 ct82 UAlnuh5010raF8
50 ct82 UAlnuh5050raF8
ct91 UAlnuh5050raF9
I ct82 UAlnuh50IraF8
ct91 UAlnuh50IraF9
hrxa lnu 10 0 ct73 UAlnuh100rxaF7
ct82 UAlnuh100rxaF8
ct91 UAlnuh100rxaF9
10 ct91 UAlnuh1010rxaF9
50 ct91 UAlnuh1050rxaF9
I ct91 UAlnuh10IrxaF9
50 0 ct73 UAlnuh500rxaF7
ct82 UAlnuh500rxaF8
ct91 UAlnuh500rxaF9
10 ct82 UAlnuh5010rxaF8
ct91 UAlnuh5010rxaF9
50 ct82 UAlnuh5050rxaF8
ct91 UAlnuh5050rxaF9
I ct82 UAlnuh50IrxaF8
ct91 UAlnuh50IrxaF9
lnu lnu 0 0 content UAlnuC
.1563 okapi okapi 0 0 content UAokapiC
.0966 lm lm 0 0 content UAlmC
Optimized-Algorithm Rankings: precision_5
==========================================

95
TREC Topic Distillation Task: 2002
PRECISION_5 ALGORITHM CONTENT_TYPE T D WEIGHTING RUN_ID
----------- ------------ -------------- ---- ---- ---------- ----------------------
.2898 hra okapi 50 50 ct73 UAokapih5050raF7
I ct73 UAokapih50IraF7
.2816 R3s okapi 0 0 ct82 UAokapiR3sF8
hrxa okapi 10 10 ct82 UAokapih1010rxaF8
ct91 UAokapih1010rxaF9
50 ct82 UAokapih1050rxaF8
ct91 UAokapih1050rxaF9
I ct82 UAokapih10IrxaF8
ct91 UAokapih10IrxaF9
50 10 ct82 UAokapih5010rxaF8
50 ct82 UAokapih5050rxaF8
I ct82 UAokapih50IrxaF8
id okapi 10 10 ct73 UAokapiid1010F7
ct82 UAokapiid1010F8
ct91 UAokapiid1010F9
50 ct73 UAokapiid1050F7
ct82 UAokapiid1050F8
ct91 UAokapiid1050F9
I ct73 UAokapiid10IF7
ct82 UAokapiid10IF8
ct91 UAokapiid10IF9
50 10 ct73 UAokapiid5010F7
ct82 UAokapiid5010F8
ct91 UAokapiid5010F9
50 ct73 UAokapiid5050F7
ct82 UAokapiid5050F8
ct91 UAokapiid5050F9
I ct73 UAokapiid50IF7
ct82 UAokapiid50IF8
ct91 UAokapiid50IF9
.2776 R2s okapi 0 0 ct91 UAokapiR2sF9
Rs okapi 0 0 ct73 UAokapiRsF7
ct91 UAokapiRsF9
hspa lnu 50 10 ct73 UAlnuh5010spaF7
okapi okapi 0 0 content UAokapiC
rid lnu 50 50 ct73 UAlnurid5050F7
I ct73 UAlnurid50IF7
ct82 UAlnurid50IF8
.2694 ha lnu 10 10 ct73 UAlnuh1010aF7
50 0 ct73 UAlnuh500aF7
10 ct73 UAlnuh5010aF7
I ct73 UAlnuh50IaF7
hhda lnu 10 50 ct73 UAlnuh1050hdaF7
50 0 ct73 UAlnuh500hdaF7
I ct73 UAlnuh50IhdaF7
hlda lnu 50 0 ct73 UAlnuh500ldaF7
50 ct73 UAlnuh5050ldaF7
I ct73 UAlnuh50IldaF7
hsa lnu 50 0 ct73 UAlnuh500saF7
10 ct73 UAlnuh5010saF7
50 ct73 UAlnuh5050saF7
I ct73 UAlnuh50IsaF7
sd lnu 10 0 ct73 UAlnusd100F7
.2612 lnu lnu 0 0 content UAlnuC

96
rsd lnu 10 0 ct73 UAlnursd100F7
ct82 UAlnursd100F8
ct91 UAlnursd100F9
rspd lnu 10 0 ct73 UAlnurspd100F7
ct82 UAlnurspd100F8
ct91 UAlnurspd100F9
.2041 lm lm 0 0 content UAlmC
Optimized-Algorithm Rankings: precision_5
==========================================
TREC Topic Distillation Task: 2003
PRECISION_5 ALGORITHM CONTENT_TYPE T D WEIGHTING RUN_ID
----------- ------------ -------------- ---- ---- ---------- ----------------------
.1280 rid lnu 50 10 ct82 UAlnurid5010F8
.1240 hspa lnu 50 50 ct82 UAlnuh5050spaF8
I ct82 UAlnuh50IspaF8
id lnu 50 0 ct82 UAlnuid500F8
.1200 ha lnu 50 10 ct82 UAlnuh5010aF8
ct91 UAlnuh5010aF9
sd lnu 50 0 ct73 UAlnusd500F7
.1160 Rs lnu 0 0 topology UAlnuRsT
hhda lnu 50 0 ct82 UAlnuh500hdaF8
10 ct73 UAlnuh5010hdaF7
hlda lnu 50 0 ct82 UAlnuh500ldaF8
hra lnu 50 10 ct82 UAlnuh5010raF8
hsa lnu 50 0 ct82 UAlnuh500saF8
.1120 R2s lnu 0 0 topology UAlnuR2sT
R3s lnu 0 0 ct82 UAlnuR3sF8
rsd lnu 50 0 ct82 UAlnursd500F8
ct91 UAlnursd500F9
rspd lnu 50 0 ct82 UAlnurspd500F8
ct91 UAlnurspd500F9
.1080 hrxa lnu 10 0 ct73 UAlnuh100rxaF7
ct82 UAlnuh100rxaF8
ct91 UAlnuh100rxaF9
10 ct91 UAlnuh1010rxaF9
50 ct91 UAlnuh1050rxaF9
I ct91 UAlnuh10IrxaF9
50 0 ct73 UAlnuh500rxaF7
ct82 UAlnuh500rxaF8
ct91 UAlnuh500rxaF9
10 ct73 UAlnuh5010rxaF7
ct82 UAlnuh5010rxaF8
50 ct73 UAlnuh5050rxaF7
ct82 UAlnuh5050rxaF8
I ct73 UAlnuh50IrxaF7
ct82 UAlnuh50IrxaF8
lnu lnu 0 0 content UAlnuC
.0960 okapi okapi 0 0 content UAokapiC
.0480 lm lm 0 0 content UAlmC
Optimized-Algorithm Rankings: precision_5
==========================================
TREC Topic Distillation Task: 2004
PRECISION_5 ALGORITHM CONTENT_TYPE T D WEIGHTING RUN_ID

97
----------- ------------ -------------- ---- ---- ---------- ----------------------
.2053 rid lnu 50 50 ct73 UAlnurid5050F7
.1973 sd lnu 50 0 ct73 UAlnusd500F7
.1920 id lnu 50 0 ct73 UAlnuid500F7
.1787 R3s lnu 0 0 ct73 UAlnuR3sF7
ha lnu 50 50 ct73 UAlnuh5050aF7
I ct73 UAlnuh50IaF7
hhda lnu 50 I ct73 UAlnuh50IhdaF7
hlda lnu 50 I ct73 UAlnuh50IldaF7
hspa lnu 50 10 ct73 UAlnuh5010spaF7
.1760 rsd lnu 50 0 ct73 UAlnursd500F7
rspd lnu 50 0 ct73 UAlnurspd500F7
.1653 hsa lnu 50 0 ct73 UAlnuh500saF7
.1627 R2s lnu 0 0 topology UAlnuR2sT
.1547 hrxa lnu 50 10 ct91 UAlnuh5010rxaF9
50 ct91 UAlnuh5050rxaF9
I ct91 UAlnuh50IrxaF9
.1520 Rs lnu 0 0 topology UAlnuRsT
okapi 0 0 topology UAokapiRsT
hra lnu 10 0 ct73 UAlnuh100raF7
ct82 UAlnuh100raF8
ct91 UAlnuh100raF9
50 0 ct82 UAlnuh500raF8
ct91 UAlnuh500raF9
10 ct73 UAlnuh5010raF7
50 ct91 UAlnuh5050raF9
I ct91 UAlnuh50IraF9
lnu lnu 0 0 content UAlnuC
.1173 okapi okapi 0 0 content UAokapiC
.0587 lm lm 0 0 content UAlmC
NB: ct-n-x=fusion run with content weight 0.n
Optimized-Algorithm Rankings: precision_20
==========================================
TREC Topic Distillation Task: 0000
PRECISION_20 ALGORITHM CONTENT_TYPE T D WEIGHTING RUN_ID
------------ ------------ -------------- ---- ---- ---------- ----------------------
.1276 rid lnu 50 10 ct73 UAlnurid5010F7
.1261 id lnu 50 0 ct73 UAlnuid500F7
.1227 sd lnu 50 0 ct73 UAlnusd500F7
.1210 hspa lnu 50 10 ct73 UAlnuh5010spaF7
ct82 UAlnuh5010spaF8
.1207 R3s lnu 0 0 ct73 UAlnuR3sF7
ha lnu 50 10 ct73 UAlnuh5010aF7
50 ct73 UAlnuh5050aF7
I ct73 UAlnuh50IaF7
hhda lnu 50 50 ct73 UAlnuh5050hdaF7
I ct73 UAlnuh50IhdaF7
hlda lnu 50 I ct73 UAlnuh50IldaF7
.1181 rsd lnu 50 0 ct91 UAlnursd500F9
rspd lnu 50 0 ct91 UAlnurspd500F9
.1178 R2s lnu 0 0 topology UAlnuR2sT
.1175 hsa lnu 50 0 ct73 UAlnuh500saF7
ct82 UAlnuh500saF8

98
.1172 Rs lnu 0 0 ct73 UAlnuRsF7
topology UAlnuRsT
.1170 hra lnu 50 50 ct82 UAlnuh5050raF8
I ct82 UAlnuh50IraF8
.1152 hrxa lnu 50 0 ct73 UAlnuh500rxaF7
ct82 UAlnuh500rxaF8
ct91 UAlnuh500rxaF9
lnu lnu 0 0 content UAlnuC
.1075 okapi okapi 0 0 content UAokapiC
.0730 lm lm 0 0 content UAlmC
Optimized-Algorithm Rankings: precision_20
==========================================
TREC Topic Distillation Task: 2002
PRECISION_20 ALGORITHM CONTENT_TYPE T D WEIGHTING RUN_ID
------------ ------------ -------------- ---- ---- ---------- ----------------------
.1939 R3s okapi 0 0 ct73 UAokapiR3sF7
.1918 Rs okapi 0 0 ct73 UAokapiRsF7
.1908 R2s okapi 0 0 ct73 UAokapiR2sF7
hra okapi 50 0 ct73 UAokapih500raF7
ct82 UAokapih500raF8
ct91 UAokapih500raF9
10 ct91 UAokapih5010raF9
50 ct91 UAokapih5050raF9
I ct91 UAokapih50IraF9
hrxa okapi 50 0 ct73 UAokapih500rxaF7
ct82 UAokapih500rxaF8
ct91 UAokapih500rxaF9
id okapi 10 10 ct73 UAokapiid1010F7
ct82 UAokapiid1010F8
ct91 UAokapiid1010F9
50 ct73 UAokapiid1050F7
ct82 UAokapiid1050F8
ct91 UAokapiid1050F9
I ct73 UAokapiid10IF7
ct82 UAokapiid10IF8
ct91 UAokapiid10IF9
50 10 ct73 UAokapiid5010F7
ct82 UAokapiid5010F8
ct91 UAokapiid5010F9
50 ct73 UAokapiid5050F7
ct82 UAokapiid5050F8
ct91 UAokapiid5050F9
I ct73 UAokapiid50IF7
ct82 UAokapiid50IF8
ct91 UAokapiid50IF9
okapi okapi 0 0 content UAokapiC
.1816 rid lnu 50 10 ct73 UAlnurid5010F7
.1776 hlda lnu 50 50 ct91 UAlnuh5050ldaF9
hspa lnu 50 10 ct73 UAlnuh5010spaF7
ct82 UAlnuh5010spaF8
.1765 ha lnu 50 10 ct73 UAlnuh5010aF7
ct91 UAlnuh5010aF9
50 ct91 UAlnuh5050aF9
I ct73 UAlnuh50IaF7
ct91 UAlnuh50IaF9
hhda lnu 50 50 ct91 UAlnuh5050hdaF9

99
I ct73 UAlnuh50IhdaF7
ct91 UAlnuh50IhdaF9
sd lnu 50 0 ct73 UAlnusd500F7
ct82 UAlnusd500F8
.1755 rsd lnu 50 0 ct91 UAlnursd500F9
rspd lnu 50 0 ct91 UAlnurspd500F9
.1745 hsa lnu 50 0 ct91 UAlnuh500saF9
.1724 lnu lnu 0 0 content UAlnuC
.1480 lm lm 0 0 content UAlmC
Optimized-Algorithm Rankings: precision_20
==========================================
TREC Topic Distillation Task: 2003
PRECISION_20 ALGORITHM CONTENT_TYPE T D WEIGHTING RUN_ID
------------ ------------ -------------- ---- ---- ---------- ----------------------
.0790 rid lnu 50 10 ct73 UAlnurid5010F7
.0770 id lnu 50 0 ct73 UAlnuid500F7
.0730 hspa lnu 50 50 ct73 UAlnuh5050spaF7
ct82 UAlnuh5050spaF8
I ct73 UAlnuh50IspaF7
ct82 UAlnuh50IspaF8
.0720 hlda lnu 50 10 ct73 UAlnuh5010ldaF7
ct82 UAlnuh5010ldaF8
ct91 UAlnuh5010ldaF9
50 ct73 UAlnuh5050ldaF7
ct91 UAlnuh5050ldaF9
hrxa lnu 50 10 ct82 UAlnuh5010rxaF8
50 ct82 UAlnuh5050rxaF8
I ct82 UAlnuh50IrxaF8
.0710 R3s lnu 0 0 ct73 UAlnuR3sF7
ha lnu 50 0 ct73 UAlnuh500aF7
ct82 UAlnuh500aF8
50 ct73 UAlnuh5050aF7
ct91 UAlnuh5050aF9
I ct73 UAlnuh50IaF7
ct91 UAlnuh50IaF9
hhda lnu 50 0 ct73 UAlnuh500hdaF7
ct82 UAlnuh500hdaF8
50 ct73 UAlnuh5050hdaF7
ct91 UAlnuh5050hdaF9
I ct73 UAlnuh50IhdaF7
ct91 UAlnuh50IhdaF9
hsa lnu 50 0 ct73 UAlnuh500saF7
ct82 UAlnuh500saF8
sd lnu 50 0 ct73 UAlnusd500F7
ct82 UAlnusd500F8
ct91 UAlnusd500F9
.0700 Rs lnu 0 0 topology UAlnuRsT
hra lnu 50 10 ct73 UAlnuh5010raF7
50 ct91 UAlnuh5050raF9
I ct91 UAlnuh50IraF9
rsd lnu 50 10 ct91 UAlnursd5010F9
50 ct91 UAlnursd5050F9
.0690 R2s lnu 0 0 ct73 UAlnuR2sF7
ct82 UAlnuR2sF8
ct91 UAlnuR2sF9
topology UAlnuR2sT

100
lnu lnu 0 0 content UAlnuC
rspd lnu 10 0 ct73 UAlnurspd100F7
ct82 UAlnurspd100F8
ct91 UAlnurspd100F9
50 0 ct91 UAlnurspd500F9
50 ct91 UAlnurspd5050F9
I ct91 UAlnurspd50IF9
.0580 okapi okapi 0 0 content UAokapiC
.0370 lm lm 0 0 content UAlmC
Optimized-Algorithm Rankings: precision_20
==========================================
TREC Topic Distillation Task: 2004
PRECISION_20 ALGORITHM CONTENT_TYPE T D WEIGHTING RUN_ID
------------ ------------ -------------- ---- ---- ---------- ----------------------
.1247 rid lnu 50 10 ct73 UAlnurid5010F7
.1220 sd lnu 50 0 ct73 UAlnusd500F7
.1213 id lnu 50 0 ct73 UAlnuid500F7
ct82 UAlnuid500F8
.1207 R3s lnu 0 0 ct73 UAlnuR3sF7
.1180 ha lnu 50 10 ct73 UAlnuh5010aF7
50 ct73 UAlnuh5050aF7
hhda lnu 50 50 ct73 UAlnuh5050hdaF7
.1173 R2s lnu 0 0 topology UAlnuR2sT
hlda lnu 50 50 ct73 UAlnuh5050ldaF7
I ct73 UAlnuh50IldaF7
hspa lnu 50 10 ct73 UAlnuh5010spaF7
ct82 UAlnuh5010spaF8
.1153 Rs lnu 0 0 topology UAlnuRsT
.1140 rsd lnu 50 0 ct82 UAlnursd500F8
rspd lnu 50 0 ct82 UAlnurspd500F8
.1120 hsa lnu 50 0 ct73 UAlnuh500saF7
ct82 UAlnuh500saF8
.1113 hra lnu 50 50 ct82 UAlnuh5050raF8
I ct82 UAlnuh50IraF8
.1087 hrxa lnu 50 0 ct73 UAlnuh500rxaF7
ct82 UAlnuh500rxaF8
ct91 UAlnuh500rxaF9
lnu lnu 0 0 content UAlnuC
.0860 okapi okapi 0 0 content UAokapiC
.0480 lm lm 0 0 content UAlmC
NB: ct-n-x=fusion run with content weight 0.n
Optimized-Algorithm Rankings: precision_A
==========================================
TREC Topic Distillation Task: 0000
PRECISION_A ALGORITHM CONTENT_TYPE T D WEIGHTING RUN_ID
----------- ------------ -------------- ---- ---- ---------- ----------------------
.1233 ha lnu 50 10 ct73 UAlnuh5010aF7
.1224 rid lnu 50 50 ct82 UAlnurid5050F8
.1223 hhda lnu 50 50 ct73 UAlnuh5050hdaF7
I ct73 UAlnuh50IhdaF7

101
hlda lnu 50 I ct73 UAlnuh50IldaF7
.1218 R3s lnu 0 0 ct82 UAlnuR3sF8
.1216 R2s lnu 0 0 topology UAlnuR2sT
.1213 id lnu 50 0 ct82 UAlnuid500F8
.1212 hspa lnu 50 50 ct73 UAlnuh5050spaF7
.1208 sd lnu 50 0 ct73 UAlnusd500F7
.1205 Rs lnu 0 0 topology UAlnuRsT
.1200 rspd lnu 50 50 ct82 UAlnurspd5050F8
.1198 rsd lnu 50 50 ct82 UAlnursd5050F8
I ct82 UAlnursd50IF8
.1195 hsa lnu 50 0 ct73 UAlnuh500saF7
.1191 lnu lnu 0 0 content UAlnuC
.1139 okapi okapi 0 0 content UAokapiC
.0967 hra lnu 50 50 ct82 UAlnuh5050raF8
.0965 hrxa lnu 50 0 ct73 UAlnuh500rxaF7
ct82 UAlnuh500rxaF8
ct91 UAlnuh500rxaF9
.0670 lm lm 0 0 content UAlmC
Optimized-Algorithm Rankings: precision_A
==========================================
TREC Topic Distillation Task: 2002
PRECISION_A ALGORITHM CONTENT_TYPE T D WEIGHTING RUN_ID
----------- ------------ -------------- ---- ---- ---------- ----------------------
.1930 id okapi 10 50 ct73 UAokapiid1050F7
I ct73 UAokapiid10IF7
.1924 R2s okapi 0 0 ct91 UAokapiR2sF9
Rs okapi 0 0 ct82 UAokapiRsF8
ct91 UAokapiRsF9
.1922 okapi okapi 0 0 content UAokapiC
.1911 R3s okapi 0 0 ct91 UAokapiR3sF9
.1598 hspa lnu 10 10 ct82 UAlnuh1010spaF8
.1594 hlda lnu 50 50 ct73 UAlnuh5050ldaF7
ct82 UAlnuh5050ldaF8
.1593 ha lnu 50 I ct73 UAlnuh50IaF7
hhda lnu 50 I ct73 UAlnuh50IhdaF7
.1587 rid lnu 50 10 ct91 UAlnurid5010F9
.1583 sd lnu 10 0 ct73 UAlnusd100F7
.1579 hsa lnu 50 50 ct82 UAlnuh5050saF8
.1559 lnu lnu 0 0 content UAlnuC
rsd lnu 10 0 ct73 UAlnursd100F7
ct91 UAlnursd100F9
rspd lnu 10 0 ct73 UAlnurspd100F7
ct91 UAlnurspd100F9
.1509 hra okapi 50 0 ct73 UAokapih500raF7
ct82 UAokapih500raF8
ct91 UAokapih500raF9
hrxa okapi 50 0 ct73 UAokapih500rxaF7
ct82 UAokapih500rxaF8
ct91 UAokapih500rxaF9
.1221 lm lm 0 0 content UAlmC
Optimized-Algorithm Rankings: precision_A
==========================================
TREC Topic Distillation Task: 2003

102
PRECISION_A ALGORITHM CONTENT_TYPE T D WEIGHTING RUN_ID
----------- ------------ -------------- ---- ---- ---------- ----------------------
.1225 ha lnu 50 10 ct73 UAlnuh5010aF7
.1176 hlda lnu 50 10 ct82 UAlnuh5010ldaF8
.1169 hspa lnu 50 50 ct73 UAlnuh5050spaF7
.1167 hhda lnu 50 50 ct73 UAlnuh5050hdaF7
.1146 sd lnu 50 0 ct73 UAlnusd500F7
.1123 Rs lnu 0 0 topology UAlnuRsT
.1116 rid lnu 50 I ct82 UAlnurid50IF8
.1107 R2s lnu 0 0 topology UAlnuR2sT
id lnu 50 0 ct91 UAlnuid500F9
.1099 R3s lnu 0 0 ct82 UAlnuR3sF8
.1088 rsd lnu 10 0 ct73 UAlnursd100F7
rspd lnu 10 0 ct73 UAlnurspd100F7
.1087 lnu lnu 0 0 content UAlnuC
.1024 hsa lnu 50 0 ct73 UAlnuh500saF7
.0955 hra lnu 50 I ct82 UAlnuh50IraF8
.0951 hrxa lnu 50 10 ct82 UAlnuh5010rxaF8
50 ct82 UAlnuh5050rxaF8
I ct82 UAlnuh50IrxaF8
.0901 okapi okapi 0 0 content UAokapiC
.0417 lm lm 0 0 content UAlmC
Optimized-Algorithm Rankings: precision_A
==========================================
TREC Topic Distillation Task: 2004
PRECISION_A ALGORITHM CONTENT_TYPE T D WEIGHTING RUN_ID
----------- ------------ -------------- ---- ---- ---------- ----------------------
.1111 rid lnu 50 10 ct73 UAlnurid5010F7
.1098 R3s lnu 0 0 ct73 UAlnuR3sF7
.1079 rspd lnu 50 50 ct82 UAlnurspd5050F8
.1077 rsd lnu 50 I ct82 UAlnursd50IF8
.1071 R2s lnu 0 0 topology UAlnuR2sT
.1069 ha lnu 50 0 ct73 UAlnuh500aF7
hhda lnu 50 0 ct73 UAlnuh500hdaF7
hlda lnu 50 0 ct73 UAlnuh500ldaF7
hsa lnu 50 0 ct73 UAlnuh500saF7
hspa lnu 50 0 ct73 UAlnuh500spaF7
.1063 id lnu 50 0 ct73 UAlnuid500F7
.1046 sd lnu 10 50 ct73 UAlnusd1050F7
.1040 Rs lnu 0 0 ct73 UAlnuRsF7
.1019 lnu lnu 0 0 content UAlnuC
.0811 hra lnu 50 0 ct91 UAlnuh500raF9
10 ct82 UAlnuh5010raF8
50 ct91 UAlnuh5050raF9
hrxa lnu 50 0 ct73 UAlnuh500rxaF7
ct82 UAlnuh500rxaF8
ct91 UAlnuh500rxaF9
.0785 okapi okapi 0 0 content UAokapiC
.0479 lm lm 0 0 content UAlmC
NB: ct-n-x=fusion run with content weight 0.n
Optimized-Algorithm Rankings: precision_R
==========================================

103
TREC Topic Distillation Task: 0000
PRECISION_R ALGORITHM CONTENT_TYPE T D WEIGHTING RUN_ID
----------- ------------ -------------- ---- ---- ---------- ----------------------
.1406 rid lnu 50 50 ct91 UAlnurid5050F9
.1405 id lnu 50 0 ct91 UAlnuid500F9
.1393 Rs lnu 0 0 topology UAlnuRsT
.1388 R2s lnu 0 0 topology UAlnuR2sT
.1380 R3s lnu 0 0 ct73 UAlnuR3sF7
ct82 UAlnuR3sF8
.1368 hlda lnu 50 10 ct82 UAlnuh5010ldaF8
.1364 rspd lnu 50 10 ct82 UAlnurspd5010F8
.1358 sd lnu 50 10 ct73 UAlnusd5010F7
.1353 rsd lnu 50 10 ct91 UAlnursd5010F9
50 ct91 UAlnursd5050F9
I ct91 UAlnursd50IF9
.1348 lnu lnu 0 0 content UAlnuC
.1342 ha lnu 50 10 ct82 UAlnuh5010aF8
.1339 hhda lnu 50 50 ct73 UAlnuh5050hdaF7
ct82 UAlnuh5050hdaF8
.1332 hspa lnu 50 I ct82 UAlnuh50IspaF8
.1305 hrxa lnu 50 10 ct82 UAlnuh5010rxaF8
50 ct82 UAlnuh5050rxaF8
I ct82 UAlnuh50IrxaF8
.1300 hra lnu 50 0 ct73 UAlnuh500raF7
ct82 UAlnuh500raF8
ct91 UAlnuh500raF9
.1279 hsa lnu 50 0 ct91 UAlnuh500saF9
.1227 okapi okapi 0 0 content UAokapiC
.0816 lm lm 0 0 content UAlmC
Optimized-Algorithm Rankings: precision_R
==========================================
TREC Topic Distillation Task: 2002
PRECISION_R ALGORITHM CONTENT_TYPE T D WEIGHTING RUN_ID
----------- ------------ -------------- ---- ---- ---------- ----------------------
.2122 R2s okapi 0 0 ct91 UAokapiR2sF9
Rs okapi 0 0 ct91 UAokapiRsF9
.2113 R3s okapi 0 0 ct91 UAokapiR3sF9
.2111 id okapi 10 10 ct82 UAokapiid1010F8
ct91 UAokapiid1010F9
50 ct82 UAokapiid1050F8
ct91 UAokapiid1050F9
I ct82 UAokapiid10IF8
ct91 UAokapiid10IF9
50 10 ct82 UAokapiid5010F8
ct91 UAokapiid5010F9
50 ct82 UAokapiid5050F8
ct91 UAokapiid5050F9
I ct82 UAokapiid50IF8
ct91 UAokapiid50IF9
okapi okapi 0 0 content UAokapiC
.1944 hra okapi 50 50 ct73 UAokapih5050raF7
I ct73 UAokapih50IraF7
.1935 hrxa okapi 50 0 ct73 UAokapih500rxaF7
ct82 UAokapih500rxaF8

104
ct91 UAokapih500rxaF9
.1891 rid lnu 50 10 ct73 UAlnurid5010F7
.1852 hlda lnu 50 50 ct91 UAlnuh5050ldaF9
.1851 hspa lnu 50 10 ct73 UAlnuh5010spaF7
50 ct73 UAlnuh5050spaF7
I ct73 UAlnuh50IspaF7
.1841 ha lnu 50 50 ct73 UAlnuh5050aF7
I ct73 UAlnuh50IaF7
hhda lnu 50 50 ct73 UAlnuh5050hdaF7
I ct73 UAlnuh50IhdaF7
.1825 sd lnu 10 0 ct73 UAlnusd100F7
.1801 hsa lnu 10 10 ct73 UAlnuh1010saF7
.1799 lnu lnu 0 0 content UAlnuC
rsd lnu 10 0 ct82 UAlnursd100F8
ct91 UAlnursd100F9
rspd lnu 10 0 ct82 UAlnurspd100F8
ct91 UAlnurspd100F9
.1569 lm lm 0 0 content UAlmC
Optimized-Algorithm Rankings: precision_R
==========================================
TREC Topic Distillation Task: 2003
PRECISION_R ALGORITHM CONTENT_TYPE T D WEIGHTING RUN_ID
----------- ------------ -------------- ---- ---- ---------- ----------------------
.1239 hlda lnu 50 10 ct82 UAlnuh5010ldaF8
.1217 Rs lnu 0 0 topology UAlnuRsT
.1183 hrxa lnu 50 10 ct82 UAlnuh5010rxaF8
50 ct82 UAlnuh5050rxaF8
I ct82 UAlnuh50IrxaF8
.1174 id lnu 50 0 ct91 UAlnuid500F9
rid lnu 50 50 ct91 UAlnurid5050F9
I ct91 UAlnurid50IF9
.1158 sd lnu 50 10 ct73 UAlnusd5010F7
ct82 UAlnusd5010F8
ct91 UAlnusd5010F9
50 ct73 UAlnusd5050F7
ct82 UAlnusd5050F8
ct91 UAlnusd5050F9
I ct73 UAlnusd50IF7
ct82 UAlnusd50IF8
ct91 UAlnusd50IF9
.1157 R3s lnu 0 0 ct82 UAlnuR3sF8
.1149 hra lnu 50 50 ct82 UAlnuh5050raF8
ct91 UAlnuh5050raF9
I ct82 UAlnuh50IraF8
ct91 UAlnuh50IraF9
.1143 R2s lnu 0 0 ct73 UAlnuR2sF7
ct82 UAlnuR2sF8
ct91 UAlnuR2sF9
topology UAlnuR2sT
lnu lnu 0 0 content UAlnuC
rsd lnu 10 0 ct73 UAlnursd100F7
ct82 UAlnursd100F8
ct91 UAlnursd100F9
50 10 ct91 UAlnursd5010F9
50 ct91 UAlnursd5050F9
I ct91 UAlnursd50IF9

105
rspd lnu 10 0 ct73 UAlnurspd100F7
ct82 UAlnurspd100F8
ct91 UAlnurspd100F9
50 10 ct91 UAlnurspd5010F9
50 ct91 UAlnurspd5050F9
I ct91 UAlnurspd50IF9
.1108 ha lnu 50 10 ct82 UAlnuh5010aF8
.1058 hhda lnu 50 50 ct82 UAlnuh5050hdaF8
I ct82 UAlnuh50IhdaF8
.1040 hspa lnu 50 50 ct82 UAlnuh5050spaF8
I ct82 UAlnuh50IspaF8
.0909 hsa lnu 50 0 ct82 UAlnuh500saF8
.0845 okapi okapi 0 0 content UAokapiC
.0530 lm lm 0 0 content UAlmC
Optimized-Algorithm Rankings: precision_R
==========================================
TREC Topic Distillation Task: 2004
PRECISION_R ALGORITHM CONTENT_TYPE T D WEIGHTING RUN_ID
----------- ------------ -------------- ---- ---- ---------- ----------------------
.1371 rid lnu 50 10 ct73 UAlnurid5010F7
.1334 id lnu 50 0 ct73 UAlnuid500F7
.1301 sd lnu 50 0 ct73 UAlnusd500F7
.1274 rsd lnu 50 0 ct82 UAlnursd500F8
rspd lnu 50 0 ct82 UAlnurspd500F8
.1270 R2s lnu 0 0 topology UAlnuR2sT
.1265 R3s lnu 0 0 ct73 UAlnuR3sF7
.1235 hlda lnu 50 10 ct91 UAlnuh5010ldaF9
.1232 Rs lnu 0 0 topology UAlnuRsT
.1225 ha lnu 50 10 ct73 UAlnuh5010aF7
.1223 hsa lnu 10 10 ct73 UAlnuh1010saF7
.1219 hhda lnu 50 50 ct73 UAlnuh5050hdaF7
.1217 hspa lnu 50 0 ct91 UAlnuh500spaF9
50 ct91 UAlnuh5050spaF9
.1189 lnu lnu 0 0 content UAlnuC
.1157 hra lnu 50 10 ct82 UAlnuh5010raF8
.1149 hrxa lnu 50 0 ct73 UAlnuh500rxaF7
ct82 UAlnuh500rxaF8
ct91 UAlnuh500rxaF9
.0903 okapi okapi 0 0 content UAokapiC
.0514 lm lm 0 0 content UAlmC