Embed Size (px)
Citation preview

Link Analysis of Life Science Linked Data
Wei Hu1, Honglei Qiu1, and Michel Dumontier2
1 State Key Laboratory for Novel Software Technology, Nanjing University, [email protected], [email protected]
2 Stanford Center for Biomedical Informatics Research, Stanford University, [email protected]
Abstract. Semantic Web technologies offer a promising mechanism forthe representation and integration of thousands of biomedical databases.Many of these databases provide cross-references to other data sources,but they are generally incomplete and error-prone. In this paper, we con-duct an empirical link analysis of the life science Linked Data, obtainedfrom the Bio2RDF project. Three different link graphs for datasets, enti-ties and terms are characterized using degree distribution, connectivity,and clustering metrics, and their correlation is measured as well. Further-more, we analyze the symmetry and transitivity of entity links to build abenchmark and preliminarily evaluate several entity matching methods.Our findings indicate that the life science data network can help identifyhidden links, can be used to validate links, and may offer the mechanismto integrate a wider set of resources for biomedical knowledge discovery.
Keywords: Link Analysis, Bio2RDF, Life Sciences, Linked Data
1 Introduction
Semantic Web (SW) technologies such as Linked Data provide a salient mecha-nism by which human and machine can navigate across large and heterogeneousdata sources [6]. Links in distributed datasets [14] usually occur between enti-ties (a.k.a. instances) or terms (i.e. classes and properties), and can be not onlymanually curated but also automatically generated [27]. Due to their complexityand descriptive nature, the life science and health care domains have long beenused to assess the feasibility of advanced knowledge management systems. Withover 1,500 published biomedical databases, numerous efforts have been directedtowards establishing Linked Data for the life sciences, including Bio2RDF [5,8],Chem2Bio2RDF [9], Neurocommons [24], the EBI RDF Platform [21], and W3CHCLS Linked Open Drug Data.3 They contain millions of links (e.g. owl:sameAsrelations) over hundreds of datasets that partially overlap in content. Such richnetworks can yield insights into the basic structures demanded to express datatypes, facilitate large-scale data integration, and help improve the overall qual-ity of biomedical data. To the best of our knowledge, however, there is no suchstudy at present.
3 http://www.w3.org/wiki/HCLSIG/LODD

In this paper, we conduct an empirical link analysis of the life science LinkedData, obtained from the Bio2RDF project, in three perspectives:
– Dataset link analysis, which provides the statistics of datasets and their linksto other datasets based on the RDF data model;
– Entity link analysis, which captures the status and intended semantics oflinks between entities using a special kind of cross-references in Bio2RDF;
– Term link analysis, which measures the overlap of topics between terms byontology matching.
For each perspective, we investigate the graph features of Bio2RDF vis-a-viswhat has been previously reported, e.g. [12,18]. Specifically, we represent datasets(entities and terms respectively) and their links by a graph, and measure the de-gree distribution, connectivity and clustering metrics. Furthermore, we examinethe symmetry and transitivity of entity links, and establish a benchmark to pre-liminarily evaluate several entity matching approaches. In addition to study eachperspective alone, we also analyze their correlation. The data and results shownin this paper are available at http://ws.nju.edu.cn/bio2rdf-analysis/.
Our analytical results and findings are expected to be useful in many areas.For biomedical data exploration [4], our entity link analysis can help create mul-tiple sets of links according to different equivalence criteria and interpretations,e.g. “truly identical” or “close match”. Our dataset link analysis can help iden-tify hidden links between hundreds of biomedical datasets and enable federatedSPARQL query processing. Our analysis can also be used to identify error linksand poorly annotated datasets, which require more manual or automated cura-tion. Moreover, our empirical analysis of Bio2RDF may reveal some widespreadtrends in the life sciences and even in the SW, which provide evidences for ap-plications using Linked Data and guide future research.
The rest of this paper is organized as follows. Section 2 provides the prelim-inaries used in the paper. In Section 3, we introduce the dataset link analysis.In Section 4, we describe the entity link analysis and evaluate entity matchingapproaches. In Section 5, we present the term link analysis. Section 6 measuresthe correlation between the three different link structures. We introduce relatedwork in Section 7 and discuss our findings in Section 8. Finally, we conclude thispaper with future work in Section 9.
2 Preliminaries
Let U be the set of URIs, L be the set of literals, and B be the set of blanknodes. A triple 〈s, p, o〉 ∈ (U ∪B) ×U × (U ∪ L ∪B) is called an RDF triple.Following VoID [2], an RDF dataset is a set of RDF triples that are published,maintained or aggregated by a single provider. Typically, a dataset is accessibleon the Web, for example through resolvable HTTP URIs or through a SPARQLendpoint, and is identified by a namespace.
In a dataset, named classes, properties and instances are uniquely identifiedusing URIs. Classes and properties together are referred to as terms, and terms

sharing a common namespace constitute a vocabulary. In this paper, instancesare particularly referred to as entities.
A graph comprises nodes and edges, and edges can be either ordered (a.k.a.arcs) for a directed graph or unordered for an undirected graph. The degree of anode is the number of edges incident to it. For a directed graph, we distinguishbetween the outgoing degree and incoming degree of a node. The outgoing degreeof a node is the number of edges directed from it, while the incoming degree of anode is the number of edges directed to it. A sink node is a node with outgoingdegree equal to 0, while a source node has its incoming degree equal to 0. Thedegree of a node in a directed graph is the sum of its outgoing and incomingdegrees. A node with a degree of 0 is called an isolated node.
A random variable x is distributed according to a power law when its prob-ability density function p(x) is in the form of p(x) ∝ x−α, where α is a positiveconstant called power law exponent. Power law functions are scale-free, in thesense that if x is rescaled by multiplying it by a constant, p(x) would still be pro-portional to x−α. Clauset et al. [11] designed a well-known maximum-likelihoodmethod to estimate α for both discrete and continuous values.
A weakly connected component (WCC) for a directed graph is a subgraph inwhich any two nodes can reach each other through some undirected path and towhich no more nodes or edges can be added while still preserving its reachability.The number of nodes in a connected component is called its size.
The average distance for a WCC is the average shortest path length betweenall nodes in the WCC. The clustering coefficient for a node in a WCC quantifieshow close its neighbors are to be a clique (complete graph), while the clusteringcoefficient for the WCC is the average of the clustering coefficients of all nodes.A graph demonstrates the small world phenomenon, if its clustering coefficientis significantly higher than that of a random graph on the same node set, and ifthe graph has a shorter average distance. Degree distribution, average distanceand clustering coefficient are considered as the three most robust measures ofnetwork analysis.
3 Dataset Link Analysis
Bio2RDF [8] is an open source project that uses SW technologies to build andprovide the largest network of life science Linked Data. Particularly, Bio2RDFdefines a set of convention scripts to create RDFS compatible Linked Data froma diverse collection of heterogeneously formatted sources obtained from multipledata providers. In this analysis, we use Bio2RDF Release 3 (July 2014), whichis the latest version of Bio2RDF and contains about 11 billion RDF triples, 1billion entities, 2 thousand classes and 4 thousand properties from 35 datasets.For more information, please visit http://download.bio2rdf.org/release/3/release.html. To conduct the dataset link analysis of Bio2RDF, we define thedataset link graph as follows:
Definition 1 (dataset link graph) A dataset link graph, denoted by (D,A),is a directed graph, where D is the node set, and each node Di ∈ D denotes a

dataset; A is the arc set, and each arc (Di, Dj) ∈ A exists iff there are at leastk RDF triples 〈s, p, o〉 ∈ Di, where s, o are two URIs in Di and Dj respectively.k is a non-negative integer to adjust the sparseness of arcs in the graph.
Since Bio2RDF has assigned unique names to the data lacking a source iden-tifier, blank nodes are not existent in the datasets. The original dataset of a URIis obtained by dereferencing the URI, because Bio2RDF includes a few datasets,e.g. BioPortal and iRefIndex, which are themselves aggregates of other datasets[8]. Also, meta-level URIs in RDF(S) and OWL are excluded as every Bio2RDFdataset has RDF triples involving them.
Fig. 1(a) shows the generated dataset link graph for Bio2RDF. We observethat the majority of the datasets is well linked and the largest connected compo-nent contains 28 Bio2RDF datasets and 81 external datasets that have not beenconverted in Bio2RDF. The upper right corner depicts seven isolated Bio2RDFdatasets that have not linked with others yet, while the upper left corner showsthree isolated external datasets linked by less than five triples. In considerationof at least thousands of URIs in each dataset, we regard this little number as amistake. The lower right corner lists four connected datasets.
Due to most externally linked datasets do not support SPARQL queries, itmay be more fair to not consider the directionality of dataset links. The averagedistance of the largest WCC in the figure is 2.77 and the clustering coefficientis 0.22. The average distance and clustering coefficient for a random graph withthe same numbers of nodes and edges are 6.6 and 0.013, respectively. Thus, itindicates very good connectivity among the datasets and reveals the small worldphenomenon. Additionally, Fig. 1(a) gives us several hints about the externaldatasets that are direly needed in the next release of Bio2RDF, such as UniProtand Ensembl, due to many Bio2RDF datasets linking to them (a.k.a. authoritieson the Web [7]).
More specifically, Fig. 1(b) illustrates that entities in the Bio2RDF datasetsare approximately normally distributed, where 23 datasets have hundred thou-sands to millions of entities. We also show in this figure the datasets with mostor least entities.
Fig. 1(c) illustrates the link distribution between the Bio2RDF datasets only,where OMIM has the most links with the other datasets (including 6 outgoinglinks and 7 incoming links), followed by NCBI Gene (12 links) and KEGG (11links). If we took the external datasets into account, the three datasets with mostout-going links (a.k.a. hubs [7]) would be KEGG (42 outlinks), PharmGKB (36outlinks) and DrugBank (24 outlinks).
Fig. 1(d) shows the size variation of the largest WCC by keep removing thedatasets holding most links. The sequence of removal is KEGG, PharmGKB,OMIM, DrugBank, InterPro and iProClass. We find that the size of the largestWCC decreases slowly, which demonstrates good resilience among the datasets.
In overall, this analysis characterizes a landscape of the current Bio2RDFdatasets and provides the basis for analyzing entity and term links in the nexttwo sections.

Pajek
affymetrix
biomodels
bioportal
chembl
clin
icaltrials
ctd
dbsnp
dru
gbank
genage
gendr
goa
hgnc
homologene
interpro
iproclass
irefindex
kegg
linkedspl
lsr
mesh
mgincbigene
ndc
omim
orphanet
pathwaycommons
pharm
gkb
pubmed
reactome
sabiork
sgd
sider
taxonomy
wikipathways
wormbase
3dmet
ahfs
alfred
atc
bindingdb
biodbcore
biosystems
blocks
cas
cath
cazy
ccd
ccds
ccsd
chebi
chemspider
come
dailymed
datahub
do
dpd
ec
eom
flybase
genatlas
genbank
genecards
gi
glycomedb
go
gtp
hp
hprd
huge
humancyc
icd10
icd9
icdo
img
imgt
inchi
ipi
issn
iuphar
jcggdb
knapsack
ligandbox
lipidbank
lipidmaps
meddra
medlineplusmerops
metacyc
mirbase
miriam
modbase
msd
mutdb
mwsh
ndfrt
nikkaji
ordr
pandit
pdb
pfam
pirsf
priamprosite
pubch
em
refseq
rgd
scop
snomedct
tair
tcdb
trembl
ttd
ucsc
umbbd
umls
unigeneuniparc
unip
rot
unists
vega
wikipedia
zfin
ensembl
(a) Bio2RDF dataset link graph: (i) the cycles denote the datasets in Bio2RDF Release3, while the squares represent the externally linked datasets (including BioPortal hosteddatasets such as GO). The size of each cycle indicates the number of entities containedin the dataset; and (ii) the arcs constituted by at least five RDF triples are drawn inthe figure. The thickness of each arc indicates the number of RDF triples linking onedataset to the other.
0 2 4 6 8 10 12
1.E+3
1.E+4
1.E+5
1.E+6
1.E+7
1.E+8
Number of datasets
Range o
f dis
tinct entities
PubMed (412,593,720), iProClass (364,255,265)
GenAge (6,995), LSR (5,032),GenDR (1,129)
(b) Entity distribution
0 2 4 6 8 10
0
1
2−3
4−5
6−7
8−10
> 10
Number of datasets
Range o
f lin
kin
g d
egre
es
OMIM (13), NCBI Gene (12),KEGG (11)
(c) Link distribution betw.Bio2RDF datasets only
0 1 2 3 4 5 60
20
40
60
80
100
120
Number of removed datasets
Siz
e o
f la
rgest W
CC
(d) WCC size variationby keep removing datasetswith most links
Fig. 1. Bio2RDF datasets and their links

4 Entity Link Analysis
During the dataset link analysis, we observe that the majority of dataset linksis generated from a special kind of RDF triples in the form of 〈s, x-relation, o〉.4X-relations contribute to more than 76% entity links, followed by article (12%),gene (4.3%) and disease (1.8%), but they have under-specified semantics.
As an example, kegg:x-drugbank links a KEGG entity (e.g. kegg:D03455) to aDrugBank entity (e.g. drugbank:DB00002) and its intended meaning is to specifythat these two entities are “truly identical” (e.g. both refer to the same drug “Ce-tuximab”), but kegg:x-drugbank is not defined as a sub-property of owl:sameAs.In another case, kegg:x-pubmed signifies a reference to a scientific article that isindexed in the PubMed dataset. Other meanings that we observed include “partof” and “close match”. Actually, due to the design principles of Bio2RDF [18],owl:sameAs would be only used when the URI is precisely another name for anentity in the original dataset, for instance, where Bio2RDF URIs for DrugBankentries coincide with URIs assigned by DrugBank itself.
Since x-relations are key to link entities in Bio2RDF, we seek to examine itsrole in link structure and determine the extent to which we can use x-relationsto create entity links. We define the entity link graph using x-relations:
Definition 2 (entity link graph) An entity link graph, denoted by (E,X), isa directed graph, where E is the node set, and each node ei ∈ E represents anentity; X is the arc set, and each arc (ei, ej) ∈ X exists iff there is an x-relationlinking ei to ej, in other words, there exists an RDF triple 〈ei, x-relation, ej〉.
4.1 Degree Distribution
We generate the entity link graph for Bio2RDF. In Fig. 2, we depict the linkdistributions (incoming and outgoing) and related statistics for three differenttypes of entities from three datasets: OMIM, NCBI Gene, and KEGG. Thesethree datasets exhibit the most links with the other Bio2RDF datasets (as shownin Fig. 1(c)). The selected types, namely Gene, Phenotype and Drug, have thelargest numbers of entities in the corresponding datasets.
We observe that the outgoing/incoming degree distributions of entity links inthe three datasets do not exhibit the power law pattern characteristic of scale-free networks (except the outgoing degree distribution for ncbigene:Gene). Wefind that there are fewer entities with an outgoing/incoming degree of 10 thanone would expect from a power law distribution. This may be a consequence ofoverlap among the Bio2RDF datasets such that entities in one dataset are likelyto link with at least a certain number of entities in the remaining datasets. Also,the exponents are large (close to 5) and p-values are very small (close to 0).5 Inparticular, only four datasets link to KEGG and there is no many-to-one links
4 These cross-references are created by the original data owners, while Bio2RDF justuniformly converts them to x-relations.
5 The power law hypothesis should be rejected for p-values below 0.01 [11].

between their entities, thus the incoming degree distribution for kegg:Drug issparse. Our results therefore differ from the calculated in-degree distribution ofowl:sameAs on the 2010 Billion Triples Challenge (BTC) dataset [12]. We arguethat this may be the result of link bias from the life science data providers.
In Table 1, we observe that a few entities link to hundreds of other entities,and most of them are widely studied genes and have many related publicationsor images. Due to the size of NCBI Gene, many entities are not linked by otherentities, resulting in a large number (162,018) of source nodes. A direct outcomeof our analysis is that we identified one super-connected node (linked to 75,000nodes), which turned out to be the result of wrong parsing. This bug was fixedimmediately by the authors and an updated dataset was released.
100
101
102
103
104
100
101
102
103
Outgoing degrees
Num
ber
of entities
omim:Gene
100
101
102
103
100
101
102
103
104
Incoming degrees
Num
ber
of entities
omim:Gene
100
101
102
100
101
102
103
104
Outgoing degrees
Num
ber
of entities
omim:Phenotype
100
101
102
103
100
101
102
103
Incoming degrees
Num
ber
of entities
omim:Phenotype
100
101
102
103
104
100
101
102
103
104
105
106
Outgoing degrees
Num
ber
of entities
ncbigene:Gene
α = 2.36
100
101
102
103
104
100
101
102
103
104
105
Incoming degrees
Num
ber
of entities
ncbigene:Gene
100
101
102
103
100
101
102
103
104
Outgoing degrees
Num
ber
of entities
kegg:Drug
100
101
100
101
102
103
104
Incoming degrees
Num
ber
of entities
kegg:Drug
Fig. 2. Bio2RDF entity link distribution: (i) the figures are presented in log-log scale;and (ii) only the datasets in Bio2RDF are considered for computing incoming degrees.
Table 1. Degree analysis of entity links
Entity Entity Avg. Avg. Max. Isolated Sink Sourcetypes number outdegree indegree degree nodes nodes nodes
omim:Gene 14,609 50.3 12.8 3,409 12 15 118omim:Phenotype 5,825 5.2 10.5 414 34 38 1,027ncbigene:Gene 394,479 10.8 2.9 6,798 0 0 162,018kegg:Drug 10,082 4.5 0.2 139 0 0 8,785
4.2 Symmetry and Transitivity of Entity Links
As the entity link graph is directed, we seek to examine the symmetry of entitylinks. We find that only four pairs of datasets link to each other bi-directionallyin Bio2RDF, which are DrugBank—KEGG, DrugBank—PharmGKB, OMIM—HGNC and OMIM—Orphanet.
Table 2 lists the results on the symmetry of entity links in the four datasetpairs, where a reciprocal link indicates that two entities ei, ej are linked fromboth directions, a malposed link represents that ei, ej are linked in one direction(e.g. ei → ej) but in the other direction ej links to someone else (e.g. eh ← ej),and a missing link implies that either of the two directions is missing.
We observe that the symmetry of entity links varies between different pairs ofdatasets. For DrugBank—PharmGKB and OMIM—HGNC, a large proportion(99%) of entity links are reciprocal. A possible explanation is that one datasetjust borrows the links from the other dataset and simply reverses them. On theother hand, DrugBank—KEGG and OMIM—Orphanet have different numbersof entity links from different directions and are mainly caused by their modelingdivergence. For example, OMIM only creates the class omim:Phenotype insteadof “Disease” and use it to link to orphanet:Disorder, which causes many links lostin the other direction, since a disorder may have many different phenotypes.
Also, we analyze the transitivity of entity links, which means that a directentity link ei → ej may also be inferred from a transitive path through entitylinks ei → ek → . . . → ej . We find three transitive examples in the Bio2RDFdatasets and show them in Fig. 3, where an identical (or different) ending entityindicates that the same entity (different entities) can be achieved through a directlink and a transitive path from the same beginning entity. If the ending entityfrom the direct link is missing, it is called “missing direct”, while the endingentity from the transitive path is missing, it is called “missing transitive”.
Table 2. Symmetry analysis of entity links
Forward Backward Reciprocal Malposed Missing Total
DrugBank—KEGG 1,289 2,155 1,964 485 995 3,444DrugBank—PharmGKB 1,624 1,619 3,210 4 29 3,243OMIM—HGNC 14,274 14,423 28,514 6 177 28,697OMIM—Orphanet 6,137 2,600 4,464 2,523 1,750 8,737

DrugBank (7,678)
PharmGKB (3,123)
KEGG(10,082)
962
1,289
1,624
(a) Drugs
KEGG (30,680)
HGNC (41,789)
OMIM (14,609)
14,423
14,276
24,208
(b) Human genes
KEGG (1,322)
Orphanet (6,930)
MeSH (27,149)
6,137
2,916
216
OMIM (5,825)
657
(c) Diseases
Direct Transitive Identical Different Missing MissingTotal
links paths ending entities direct transitive
Drugs 1,289 954 946 6 2 343 1,297Human genes 14,276 14,250 14,236 5 9 40 14,290Diseases 657 33 8 18 7 649 682
Fig. 3. Transitivity analysis of entity links: (i) the value in each parenthesis denotesthe number of entities given a specified topic; and (ii) the solid arcs represent directlinks between entities while the dashed arcs form transitive paths. The value on eacharc denotes the number of entity links from one dataset to the other.
Our analysis reveals that most links are confirmed through transitivity amongthe human gene link network only. In the other two examples, there are someintermediate datasets, such as Orphanet, which affect the transitivity. To im-prove connectivity in the future, these datasets should be enhanced. Also, thenumber of links may decrease significantly with the increase of transitive pathlength. Therefore, the transitivity of entity links is often topic-dependent, andits accuracy varies in different contexts.
We take a deeper look at these transitive entity links. Fig. 4 exemplifies twodifferent ending entities from DrugBank to KEGG, where one is from a direct linkand the other is from a transitive path. The two drugs have different names buthighly similar chemical structures (a.k.a. isomers), and their medical functionsare similar as well. The DrugBank provider thinks that the two drugs are thesame, while the KEGG provider uses different URIs to identify them withoutany equivalence relation. This example illustrates the difficulty of linking entitiesin the life sciences, caused by modeling divergence.
4.3 Evaluation of Entity Matching Approaches
According to our analysis above, we observe that an x-relation probably repre-sents the owl:sameAs relation between two entities if they have the same or verysimilar types. Furthermore, although owl:sameAs is not a necessarily symmetric

(a) Levonorgestrel (kegg:D00950)using direct link
(b) Norgestrel (kegg:D00954) usingtransitive path
Fig. 4. Different ending entities from starting entity drugbank:DB00367
property [12], it is considered strongly equivalent only when reciprocal links exist.These observations guide us to use the reciprocal links between similarly-typedentities to build a benchmark and evaluate entity matching approaches.
For this purpose, we reuse the four pairs of datasets in Table 2. A commonly-used approach to entity matching in the life sciences is by comparing the labelsof entities [17]. We develop four different string comparison algorithms based onLevenshtein, Jaro-Winkler, N-gram (N = 2) and Jaccard distances respectivelyto compute the similarity of labels. For each algorithm, we change the similaritythreshold from 0.1 to 0.95 (step by 0.05) to achieve the highest F1-score, where
F1-score = 2×Precision×RecallPrecision+Recall
. In overall, the best threshold for each algorithm
falls into [0.5, 0.8]. For instance, the best threshold for Jaro-Winkler is achievedat 0.75 when matching DrugBank and KEGG.
Linear regression and logistic regression are often employed to make use ofmore properties in entities. We re-implement the approach in [28] to identifyfive matched property pairs by 10-fold cross-validation and combine them usinglinear or logistic regression for similarity computation. The threshold is set to0.25, which achieves the best F1-score.
Our experimental results are shown in Fig. 5. We observe that N-gram andJaro-Winkler algorithms obtain the best F1-score among the string comparisonalgorithms. But their results are far from perfect, because there are many otheruseful properties. For example, by considering the property “chemical formula”,the F1-scores achieved by logistic regression consistently rise up on all the drugdatasets. For OMIM—Orphanet, the low F1-scores are caused by many-to-onelinks between the entities in omim:Phenotype and orphanet:Disorder.
Moreover, four small-scale drug datasets are provided in OAEI2010 and twoentity matching systems participated in the test [15]. However, due to the reli-ability of reference links, the test did not make clear conclusions. We publishedour benchmark on our website and expect that it can help both researchers andpractitioners in biomedicine and the SW verify their entity linking approachesand tools in future.
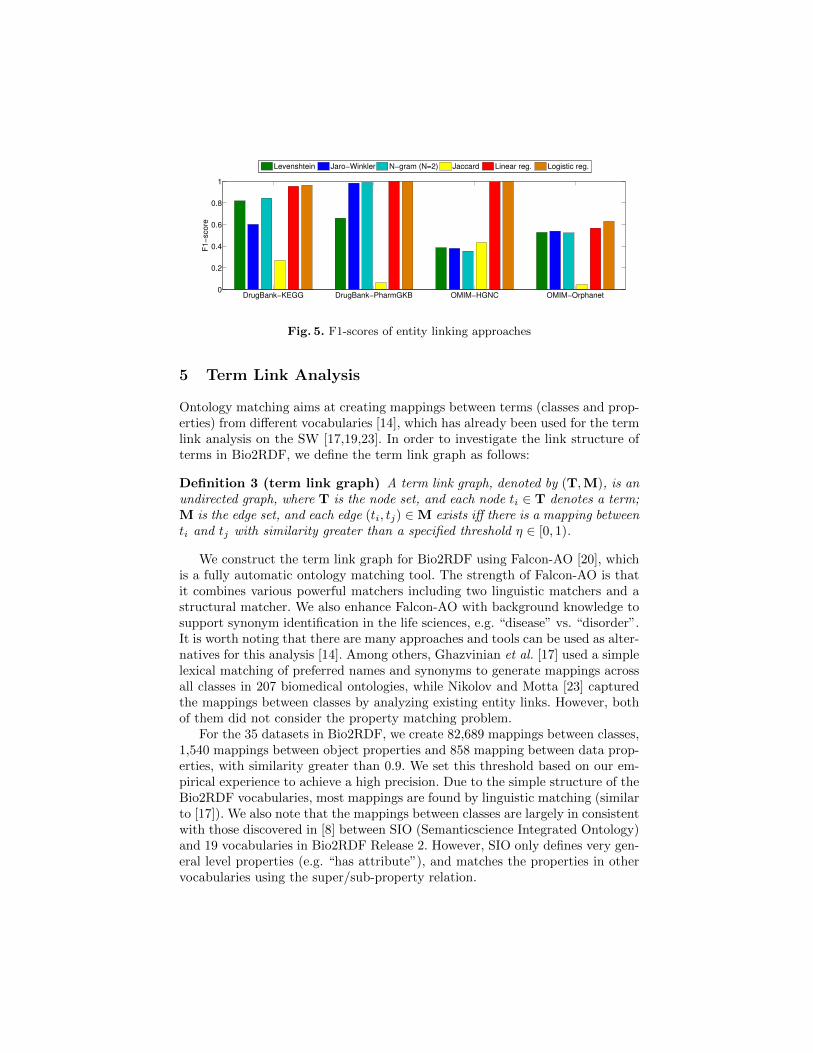
DrugBank−KEGG DrugBank−PharmGKB OMIM−HGNC OMIM−Orphanet0
0.2
0.4
0.6
0.8
1
F1
−sco
re
Levenshtein Jaro−Winkler N−gram (N=2) Jaccard Linear reg. Logistic reg.
Fig. 5. F1-scores of entity linking approaches
5 Term Link Analysis
Ontology matching aims at creating mappings between terms (classes and prop-erties) from different vocabularies [14], which has already been used for the termlink analysis on the SW [17,19,23]. In order to investigate the link structure ofterms in Bio2RDF, we define the term link graph as follows:
Definition 3 (term link graph) A term link graph, denoted by (T,M), is anundirected graph, where T is the node set, and each node ti ∈ T denotes a term;M is the edge set, and each edge (ti, tj) ∈M exists iff there is a mapping betweenti and tj with similarity greater than a specified threshold η ∈ [0, 1).
We construct the term link graph for Bio2RDF using Falcon-AO [20], whichis a fully automatic ontology matching tool. The strength of Falcon-AO is thatit combines various powerful matchers including two linguistic matchers and astructural matcher. We also enhance Falcon-AO with background knowledge tosupport synonym identification in the life sciences, e.g. “disease” vs. “disorder”.It is worth noting that there are many approaches and tools can be used as alter-natives for this analysis [14]. Among others, Ghazvinian et al. [17] used a simplelexical matching of preferred names and synonyms to generate mappings acrossall classes in 207 biomedical ontologies, while Nikolov and Motta [23] capturedthe mappings between classes by analyzing existing entity links. However, bothof them did not consider the property matching problem.
For the 35 datasets in Bio2RDF, we create 82,689 mappings between classes,1,540 mappings between object properties and 858 mapping between data prop-erties, with similarity greater than 0.9. We set this threshold based on our em-pirical experience to achieve a high precision. Due to the simple structure of theBio2RDF vocabularies, most mappings are found by linguistic matching (similarto [17]). We also note that the mappings between classes are largely in consistentwith those discovered in [8] between SIO (Semanticscience Integrated Ontology)and 19 vocabularies in Bio2RDF Release 2. However, SIO only defines very gen-eral level properties (e.g. “has attribute”), and matches the properties in othervocabularies using the super/sub-property relation.

Table 3. Top-5 popular labels for classes and properties
(a) Classes
LabelsDistinct
URIs
Resource 35Gene 10Drug 6Enzyme 5Pathway 5
(b) Object properties
LabelsDistinct
URIs
x-uniprot 11x-ncbigene 10article 8gene 8source 8
(c) Data properties
LabelsDistinct
URIs
synonym 25definition 22comment 9chromosome 8name 8
We extract the label of each term in these mappings and count the times ofeach label appearing in different terms (by ignoring their string cases). The fivemost frequently-occurred labels for classes, object and data properties are list inTable 3, where “Resource” is used in all the Bio2RDF datasets to define entities.However, unlike the findings in [17,19], the degree distribution of term links doesnot obey the power law, because there is a significant overlap between terms indifferent vocabularies, indicating that most biomedical data providers have verysimilar topic interests like genes and drugs. Besides, the created mappings canbe used to support query rewriting in applications.
6 Correlation of Different Link Graphs
Earlier in this paper, we have showed our link analysis of datasets, entities andterms respectively. It is also natural for us to ask whether the three types of linkgraphs are correlated or independent. The Spearman’s rank correlation coefficient(denoted by ρ ∈ [−1, 1]) measures the agreement degree between two rankings[22], which is suitable for answering our question. The sign of ρ indicates positiveor negative correlation, while its absolute value assesses relative degree, with alarger absolute value being stronger correlation.
We abstract the entity and term link graphs to the dataset level and orderthe Bio2RDF dataset pairs based on their correlation values. For the entity linkgraph, the correlation value between two datasetsDi, Dj is defined as the numberof direct entity links between Di, Dj divided by the total number of entities inDi, Dj . Note that both directions are involved, i.e. Di → Dj and Dj → Di.
Inspired by [19], the correlation value of two datasets derived from the termlink graph is defined as the ratio of the number of term mappings between thetwo datasets to the total number of their terms. Note that term mappings areundirected according to our definition.
For the dataset link graph in Fig. 1(a), the correlation value of two Bio2RDFdatasets is obtained by finding the shortest path between them, with a shorterlength being more strongly correlated. This measure has also been used in [10].Therefore, we generate three rankings of all pairs of Bio2RDF datasets from theentity, term and dataset link graphs.
Table 4. Spearman’s rank correlation coefficients among link graphs
Dataset link graph Entity link graph
Entity link graph 0.51Term link graph 0.42 0.16
Table 4 lists the correlation coefficients among the entity, term and datasetlink graphs. The signs reflect that all the three graphs are positively correlated,where the dataset link graph has strong correlation with the entity link graph(ρ = 0.53) as well as the term link graph (ρ = 0.42). It can be explained as closerdatasets in distance predicting more linked entities along with more matchedclasses and properties.
On the other hand, the correlation coefficient between the entity link graphand the term link graph is not strong (ρ = 0.16), which demonstrates that thenumber of linked entities contributes little to the overlap of vocabularies, sincelinked entities may centralize in a few classes, while entities under other classeshave not been interlinked yet.
7 Related Work
Network analysis has long been used to study link structures in biomedicine andthe Web. The small world phenomenon and the scale-free characteristic are oftenobserved [1,3,7,11]. Recently, it has been conducted on the SW. Theoharis et al.[26] investigated the graph features of 250 ontologies and found that a major-ity of ontologies with a significant number of properties approximate powers forthe total degree, while each ontology owns a few focal classes with considerableproperties and subclasses. Ell et al. [13] introduced a set of label-related metricsincluding completeness, accessibility, unambiguity and multi-linguality to mea-sure the current state of labeling the Web of Data. These works did not addressthe relations across different datasets.
To examine entity links, Ding et al. [12] carried out an empirical experimentof the owl:sameAs deployment status and used the statistics to focus discussionon the usage of owl:sameAs in the BTC2010 dataset. Our findings in Bio2RDF donot match their results in some aspects. Halpin et al. [18] found that owl:sameAsis widely misused to capture different degrees of equivalence, and its practicaluse is not limited to the case where two entities are truly identical but insteadincludes application scenarios where they can be treated as being operationallyequivalent. Our investigation on the x-relations in Bio2RDF well confirms theirobservation. For a more general notion of links, Ge et al. [16] defined the objectlink graph according to the RDF data model and compared the graph featuresof two object link graphs crawled by the Falcons search engine in 2008 and 2009respectively, containing some incomplete biomedical data.
Analysis of term links has also been performed. Ghazvinian et al. [17] ana-lyzed the morphology of term mappings between 207 vocabularies in BioPortaland UMLS, while Hu et al. [19] extended this idea to a larger scale containing

four thousand Web ontologies. Nikolov and Motta [23] created term mappingsfrom declared coreference association (e.g. owl:sameAs) and co-typing, where aterm mapping can hold either the equivalence or subsumption relation. Tordaiet al. [26] empirically studied the quality of chains of (almost) equivalent termsin the domains of biomedicine, cultural heritage and library subject headingswith multiple languages (English, Dutch, German and French). More generally,Cheng et al. [10] presented the declarative, topical and distributional relatednessbetween three thousand vocabularies and the correlation of these relatedness.Unlike these works, we holistically analyzed the life science Linked Data on thelevels of datasets, entities and terms.
8 Discussion of Findings
The analytical results that we have presented in the previous sections allow usto make the following observations:
– Bio2RDF offers the biggest network of the life science Linked Data and alsois a significant portion of Linked Open Data, which ensures the significanceof our empirical study. Although our hypothesis is that the life science datanetwork should be in consistence with that of the SW, we are surprised thatsome results turn out to be different than previously reported, e.g. the degreedistribution of entity links does not strictly follow the power law.
– A dominated part of entities in Bio2RDF have been linked using x-relations,but the intended semantics of these entity links differs. When the meaningsof two classes are identical or equivalent and their belonging datasets alsohave close topics, the entity links are likely to represent logical equivalence.Additionally, the classes and properties in different Bio2RDF datasets havelarge overlap and can be identified mainly by linguistic matching.
– Symmetric and transitive entity links exist in Bio2RDF, which can reinforcethe correctness of these links, but their effectiveness is currently weakeneddue to the relatively small number. Adding more symmetric and transitivelinks should be an important future work for the life science data providersand aggregators (e.g. OpenLifeData6). Besides, the meanings of entity linksmay be shifted during transitive. In consideration of the quality and coverageof the entities and terms in Bio2RDF, we suggest to use KEGG, DrugBankand OMIM as the most prominent knowledge bases for applications in thelife sciences.
– Previous work has demonstrated the effectiveness of using string matchingto find linked entities or terms [15]. However, according to our benchmark,only considering the labels of entities may fail in some cases, e.g. comparingshort-form abbreviations of gene names, while combining different propertiesand using simple machine learning algorithms like logistic regression achievea good accuracy. However, discovering many-to-one links between entities isstill a difficult problem that needs to be carefully studied.
6 http://www.openlifedata.org/

9 Conclusion
In this paper, we described our analytical results of the life science Linked Data,obtained from the Bio2RDF project, so as to better inform the development ofnovel methods for exploring, querying and analyzing this wealth of knowledge.Our link analysis coupled with a benchmark give a first glimpse concerning thestructure of the life science Linked Data, and offer new results by which we andothers may utilize in future. A question raised from our study is how to make useof the findings to improve applications in the life sciences. Another future workis to repeat analysis on other linked biomedical data and compare the findings.
Acknowledgments. This work was supported in part by the National NaturalScience Foundation of China (Nos. 61370019 and 61223003), and in part by theNational Social Science Foundation of China (No. 11AZD121). Wei Hu thanksthe Stanford Center for Biomedical Informatics Research for hosting his visit.
References
1. Adamic, L.A., Huberman, B.A.: Power-Law Distribution of the World Wide Web.Science 287(5461), 2115 (2000)
2. Alexander, K., Cyganiak, R., Hausenblas, M., Zhao, J.: Describing Linked Datasetswith the VoID Vocabulary. W3C Interest Group Note (2011)
3. Barabasi, A.-L., Gulbahce, N., Loscalzo, J.: Network Medicine: A Network-BasedApproach to Human Disease. Nature Reviews Genetics 12, 56–68 (2011)
4. Batchelor, C., Brenninkmeijer, C.Y.A., Chichester, C., Davies, M., Digles, D., Dun-lop, I., Evelo, C.T., Gaulton, A., Goble, C., Gray, A.J.G., Groth, P., Harland, L.,Karapetyan, K., Loizou, A., Overington, J.P., Pettifer, S., Steele, J., Stevens, R.,Tkachenko, V., Waagmeester, A., Williams, A., Willighagen, E.L.: Scientific Lensesto Support Multiple Views over Linked Chemistry Data. In: Mika, P., et al. (eds.)ISWC 2014, Part I. LNCS, vol. 8796, pp. 98–113. Springer (2014)
5. Belleau, F., Nolin, M.-A., Tourigny, N., Rigault P., Morissette, J.: Bio2RDF: To-wards a Mashup to Build Bioinformatics Knowledge Systems. Journal of Biomed-ical Informatics 41(5), 706–716 (2008)
6. Bizer, C., Heath, T., Berners-Lee, T.: Linked Data - The Story So Far. InternationalJournal on Semantic Web and Information Systems 5(3), 1–22 (2009)
7. Broder, A., Kumar, R., Maghoul, F., Raghavan, P., Rajagopalan, S., Stata, R.,Tomkins, A., Wiener, J.: Graph Structure in the Web. Computer Networks 33(1–6), 309–320 (2000)
8. Callahan, A., Cruz-Toledo, J., Ansell, P., Dumontier, M.: Bio2RDF Release 2:Improved Coverage, Interoperability and Provenance of Life Science Linked Data.In: Cimiano, P., et al. (eds.) ESWC 2013. LNCS, vol. 7882, pp. 200–212. Springer(2013)
9. Chen, B., Dong. X., Jiao, D., Wang, H., Zhu, Q., Ding, Y., Wild, D.J.:Chem2Bio2RDF: A Semantic Framework for Linking and Data Mining Chemoge-nomic and Systems Chemical Biology Data. BMC Bioinformatics 11, 255 (2010)
10. Cheng, G., Qu, Y.: Relatedness between Vocabularies on the Web of Data: ATaxonomy and an Empirical Study. Journal of Web Semantics 20, 1–17 (2013)

11. Clauset, A., Shalizi, C.R., Newman, M.E.J.: Power-Law Distributions in EmpiricalData. SIAM Review 51(4), 661–703 (2009)
12. Ding, L., Shinavier, J., Shangguan, Z., McGuinness, D.L.: SameAs Networks andBeyond: Analyzing Deployment Status and Implications of owl:sameAs in LinkedData. In: Pater-Schneider, P.F., et al. (eds.) ISWC 2010, Part I. LNCS, vol. 6496,pp. 145–160. Springer (2010)
13. Ell, B., Vrandecic, D., Simperl, E.: Labels in the Web of Data. In: Aroyo, L., et al.(eds.) ISWC 2011, Part I. LNCS, vol. 7031, pp. 162–176. Springer (2011)
14. Euzenat, J., Shvaiko, P.: Ontology Matching (2nd Edition). Springer (2013)15. Ferrara, A., Nikolov, A., Noessner, J., Scharffe, F.: Evaluation of Instance Matching
Tools: The Experience of OAEI. Journal of Web Semantics 21, 49–60 (2013)16. Ge, W., Chen, J., Hu, W., Qu, Y.: Object Link Structure in the Semantic Web.
In: Aroyo, L., et al. (eds.) ESWC 2010, Part II. LNCS, vol. 6089, pp. 257–271.Springer (2010)
17. Ghazvinian, A., Noy. N.F., Jonquet, C., Shah, N., Musen, M.A.: What Four MillionMappings Can Tell You about Two Hundred Ontologies. In: Bernstein, A., et al.(eds.) ISWC 2009. LNCS, vol. 5823, pp. 229–242. Springer (2009)
18. Halpin, H., Hayes, P.J., McCusker, J.P., McGuinness, D.L., Thompson, H.S.: Whenowl:sameAs Isn’t the Same: An Analysis of Identity in Linked Data. In: Pater-Schneider, P.F., et al. (eds.) ISWC 2010, Part I. LNCS, vol. 6496, pp. 305–320.Springer (2010)
19. Hu, W., Chen, J., Zhang, H., Qu, Y.: How Matchable Are Four Thousand On-tologies on the Semantic Web. In: Antoniou, G., et al. (eds.) ESWC 2011, Part I.LNCS, vol. 6643, pp. 290–304. Springer (2011)
20. Hu, W., Qu, Y.: Falcon-AO: A Practical Ontology Matching System. Journal ofWeb Semantics 6(3), 237–239 (2008)
21. Jupp, S., Malone, J., Bolleman, J., Brandizi, M., Davies, M., Garcia, L., Gaulton,A., Gehant, S., Laibe, C., Redaschi, N., Wimalaratne, S.M., Martin, M., Le Novere,N., Parkinson, H., Birney, E., Jenkinson, A.M.: The EBI RDF Platform: LinkedOpen Data for the Life Sciences. Bioinformatics 30(9), 1338–1339 (2014)
22. Myers, J.L., Well, A.D., Lorch Jr, R.F.: Research Design and Statistical Analysis(3rd Edition). Routledge (2010)
23. Nikolov, A., Motta, E.: Capturing Emerging Relations between Schema Ontologieson the Web of Data. In: International Workshop on Consuming Linked Data (2010)
24. Ruttenberg, A., Rees, J.A., Samwald, M., Marshall, M.S.: Life Sciences on theSemantic Web: The Neurocommons and Beyond. Briefings in Bioinformatics 10(2),193–204 (2009)
25. Theoharis, Y., Tzitzikas, Y., Kotzinos, D., Christophides, V.: On Graph Features ofSemantic Web Schemas. IEEE Transactions on Knowledge and Data Engineering20(5), 692–702 (2008)
26. Tordai, A., Ghazvinian, A., van Ossenbruggen, J., Musen, M.A., Noy, N.F.: Lost inTranslation? Empirical Analysis of Mapping Compositions for Large Ontologies.In: International Workshop on Ontology Matching (2010)
27. Volz, J., Bizer, C., Gaedke, M., Kobilarov, G.: Discovering and Maintaining Linkson the Web of Data. In: In: Bernstein, A., et al. (eds.) ISWC 2009. LNCS, vol.5823, pp. 650–665. Springer (2009)
28. Xu, M., Wang, Z., Bie, R., Li, J., Zheng, C., Ke, W., Zhou, M.: Discovering MissingSemantic Relations between Entities in Wikipedia. In: Alani, H., et al. (eds.) ISWC2013, Part I. LNCS, vol. 8218, pp. 673–686. Springer (2013)


![SANAPHOR: Ontology-Based Coreference Resolutioniswc2015.semanticweb.org/sites/iswc2015.semanticweb.org/files/93660417.pdf · 2.4 Coreference and Anaphora According to Ng [25], practically](https://img.dokumen.tips/doc/110x75/5e1ce397f236156b493987c4/sanaphor-ontology-based-coreference-24-coreference-and-anaphora-according-to-ng.jpg)