Embed Size (px)
Citation preview

Linear Techniques for Regression and Classification on Functional Data
Gilbert SaportaChaire de Statistique Appliquée & CEDRICConservatoire National des Arts et Métiers292 rue Saint Martin F 75141 Paris Cedex [email protected]://cedric.cnam.fr/~saporta
Joint work with D. Costanzo (U.Calabria) & C.Preda (U.Lille2)

Open University, Milton Keynes, May 17, 2007
2
Outline
1. Introduction 2. OLS regression on functional data3. PLS functional regression4. Clusterwise regression5. Discrimination6. Anticipated prediction7. Conclusion and perspectives

Open University, Milton Keynes, May 17, 2007
3
1.Introduction
Very high dimensional data: an infinite number of variables Regression on functional data
Example 1: Y= amount of crop Xt = temperature curves
p=
R.A.Fisher « The Influence of Rainfall on the Yield of Wheat at Rothamsted » Philosophical Transactions of the Royal Society, B: 213: 89-142 (1924)

Open University, Milton Keynes, May 17, 2007
4
Example 2 : Growth index of 84 shares at Paris stock exchange during 60 minutes
How to predict X55 till X60, for a new share, knowing Xfrom t=0 till t=55?

Open University, Milton Keynes, May 17, 2007
5
• Discrimination on functional data
Example 3: Kneading curves for cookies (Danone Vitapole)

Open University, Milton Keynes, May 17, 2007
6
After smoothing with cubic B-splines (Lévéder & al, 2004)
How to predict the quality of the cookies?

Open University, Milton Keynes, May 17, 2007
7
Linear combination
« Integral regression » (Fisher 1924)
instead of a finite sum 0
ˆ ( )T
tY t X dt
1
ˆp
j jj
Y X
Open University, Milton Keynes, May 17, 2007
8
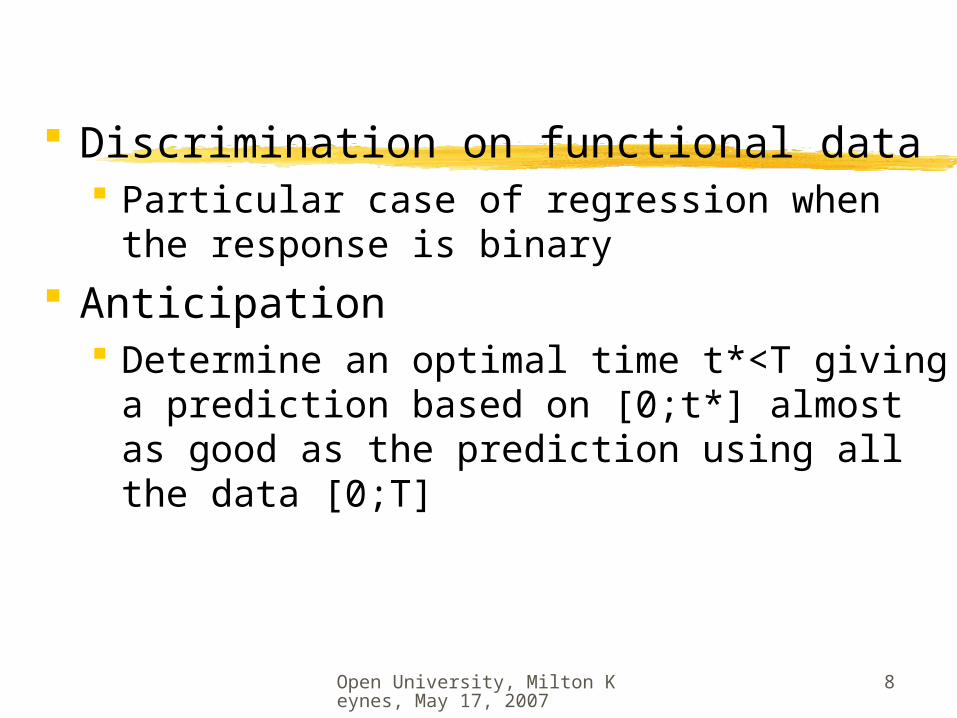
Discrimination on functional data Particular case of regression when the
response is binary Anticipation
Determine an optimal time t*<T giving a prediction based on [0;t*] almost as good as the prediction using all the data [0;T]

Open University, Milton Keynes, May 17, 2007
9
2. OLS regression on functional data
Y ; Xt (with zero mean)
2.1 The OLS problem Minimizing
leads to normal, or Wiener-Hopf, equations:
where C(t,s)= cov(Xt, Xs)=E(XtXs)
0cov( , ) ( , ) ( )
T
tX Y C t s s ds
2
0( )
T
tE Y t X dt

Open University, Milton Keynes, May 17, 2007
10
2.2 Karhunen-Loeve decomposition (functional PCA)
factor loadings:
principal components:
1
( )t i ii
X f t
0( , ) ( ) ( )
T
i i iC t s f s ds f t
0( )
T
i i tf t X dt

Open University, Milton Keynes, May 17, 2007
11
Picard’s theorem: is unique if and only if:
Generally not true…especially when n is finite: since p >n. Perfect fit when minimizing:
2
21
i
i i
c
2
01
1( ) ( )
n T
i ii
y t x t dtn
0 0cov( , ) cov( , ( ) ) ( ) ( )
T T
i i i t t ic Y Y f t X dt E X Y f t dt

Open University, Milton Keynes, May 17, 2007
12
Even if is unique, Wiener-Hopf equation is not an ordinary integral equation: the solution is more frequently a distribution than a function
Constrained solutions are needed. (cf Green & Silverman 1994, Ramsay & Silverman 1997).

Open University, Milton Keynes, May 17, 2007
13
2.3 Regression on principal components
Rank q approximation:
1 1
cov( , )ˆ i ii i
i ii i
Y cY
2
2 2
1 1
ˆ( , ) ( , ) ii
i i i
cR Y Y R Y
( ) ( )
1 1
cov( ; ) cov( ; )ˆˆ ( ) ( )q q
q qi ii i
i ii i
Y YY t f t

Open University, Milton Keynes, May 17, 2007
14
Numerical computations Solve integral equations in the
general case for step functions: finite number of
variables and of units: operators are matrices, but with a very high size
Approximations by discretisation of time

Open University, Milton Keynes, May 17, 2007
15
Which principal components? First q? q best correlated with Y?
Principal components are computed irrespective of the response…

Open University, Milton Keynes, May 17, 2007
16
3. Functional PLS regression
Use PLS components instead of principal components.
first PLS component :
further PLS components as usual
2
0max cov ( , ( ) )w tY w t X dt
2
1w
2
0
cov( , )( )
cov ( , )
t
t
X Yw t
X Y dt
1 0( ) tt w t X dt
Open University, Milton Keynes, May 17, 2007
17
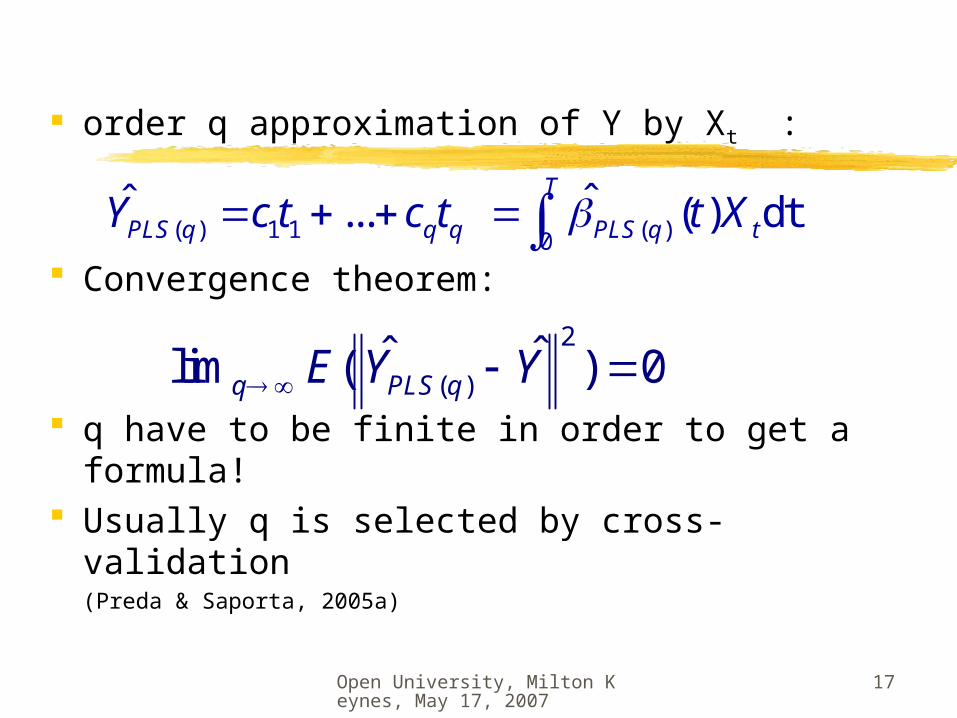
order q approximation of Y by Xt :
Convergence theorem:
q have to be finite in order to get a formula!
Usually q is selected by cross-validation(Preda & Saporta, 2005a)
( ) 1 1 ( )0
ˆˆ ... ( ) dt T
PLS q q q PLS q tY c t c t t X
2
( )ˆ ˆlim ( ) 0q PLS qE Y Y

Open University, Milton Keynes, May 17, 2007
18
First PLS component easily interpretable: coefficients with the same sign as r(y;xt)
No integral equation PLS fits better than PCR:
Same proof as in De Jong, 1993
2 2( ) ( )
ˆ ˆ( ; ) ( ; )PLS q PCR qR Y Y R Y Y

Open University, Milton Keynes, May 17, 2007
19
4. Clusterwise regression
4.1 Model: G , variable with K categories (sub-
populations)
2
( )
( )
i i
i
E Y x G i x
V Y x G i
X
X

Open University, Milton Keynes, May 17, 2007
20
4.2 OLS and clusterwise
regression
Residual variance of global regression= within cluster residual variance + variance due to the difference between local (clusterwise) and global regression (OLS)
ˆ ˆ LY Y OLS global estimate versus clusterwise "local" estimate

Open University, Milton Keynes, May 17, 2007
21
4.3 Estimation (Charles, 1977)
number of clusters k needs to be known Alternated least squares
For a given partition: estimate linear regressions for each cluster
Reallocate each point to the closest regression line (or surface)
Equivalent to ML for fixed regressors, fixed
partition model (Hennig, 2000)
4.4 Optimal k AIC, BIC, crossvalidation
2
{1 }
ˆ ˆ( ) arg min ( ( ))ˆii
j ji …KG j y x

Open University, Milton Keynes, May 17, 2007
22
4.5 Clusterwise functional PLS regression
OLS functional regression not adequate to give estimations in each cluster
Our proposal: estimate local models with functional PLS regression
Is the clusterwise algorithm still consistent?
Proof in Preda & Saporta, 2005b
Open University, Milton Keynes, May 17, 2007
23
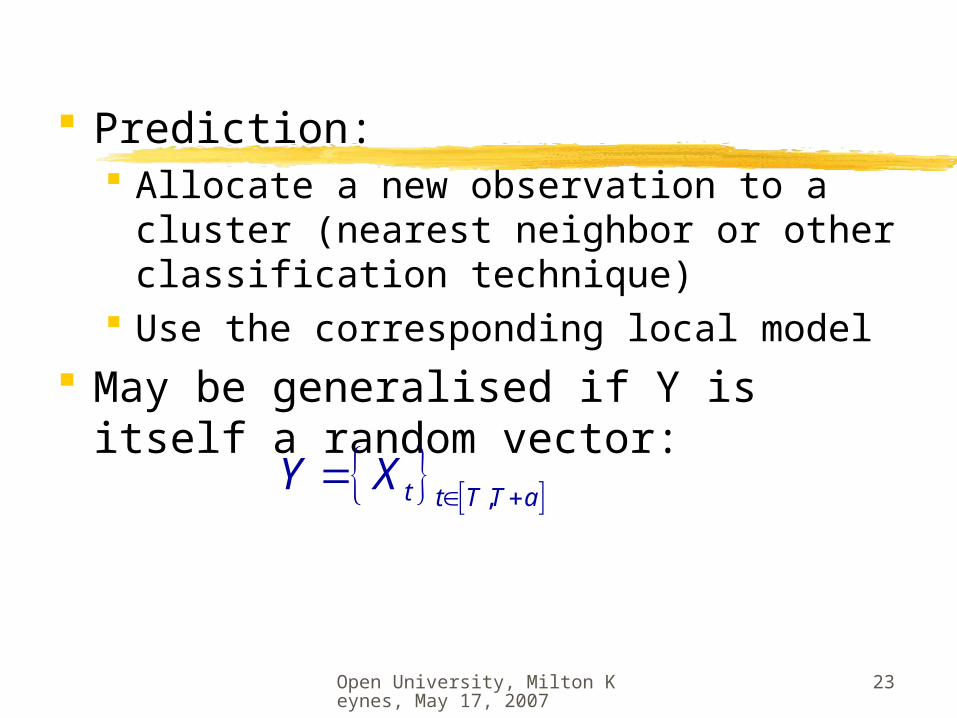
Prediction: Allocate a new observation to a cluster
(nearest neighbor or other classification technique)
Use the corresponding local model May be generalised if Y is itself a
random vector: ,t t T T a
Y X

Open University, Milton Keynes, May 17, 2007
24
4.6 Application to stock market data
Growth index during 1 hour (between 10h and 11h) of 84 shares at Paris Stock Exchange
Goal : predict a new share between 10h55 and 11h using data between 10h and 10h55

Open University, Milton Keynes, May 17, 2007
25
Exact computations need 1366
variables (number of intervals where the 85 curves are constant)
Discretisation in 60 intervals. Comparison between PCR and PLS:

Open University, Milton Keynes, May 17, 2007
26
Crash of share 85 not detected!

Open University, Milton Keynes, May 17, 2007
27
Clusterwise PLS Four clusters (17;32;10;25) Number of PLS component for each cluster:
1; 3; 2 ; 2 (cross-validation)

Open University, Milton Keynes, May 17, 2007
28
Share 85 classified into cluster 1

Open University, Milton Keynes, May 17, 2007
29
3. Functional linear discrimination
LDA : linear combinations maximizing the ratio
Between group variance /Within group variance
For 2 groups Fisher’s LDF via a regression between coded Y and Xt
eg(Preda & Saporta, 2005a)
0( )
T
tt X dt
01
0 1
and pp
p p

Open University, Milton Keynes, May 17, 2007
30
PLS regression with q components gives an approximation of β(t) and of the score
For more than 2 groups: PLS2 regression between k-1 indicators of Y and Xt First PLS component given by the first
eigenvector of the product of Escoufier operators WxWY
Preda & Saporta, 2002 and Barker & Rayens , 2003
T 0
ˆd ( ) ( )T
PLS PLS tX t X dt

Open University, Milton Keynes, May 17, 2007
31
Quality measures
For k=2 : ROC curve and AUC For a specific threshold, x is classified into
G1if dT(x)>s Sensitivity or true positive rate:
P(dT(x)>s/Y=1)=1-β 1- specificity or 1- true negative rate:
P(dT(x)>s/Y=0)=

Open University, Milton Keynes, May 17, 2007
32
ROC curve
• Perfect discrimination : ROC curve is confounded with the edges of unit square• For identical conditional distributions ROC curve is confounded with the diagonal
Open University, Milton Keynes, May 17, 2007
33
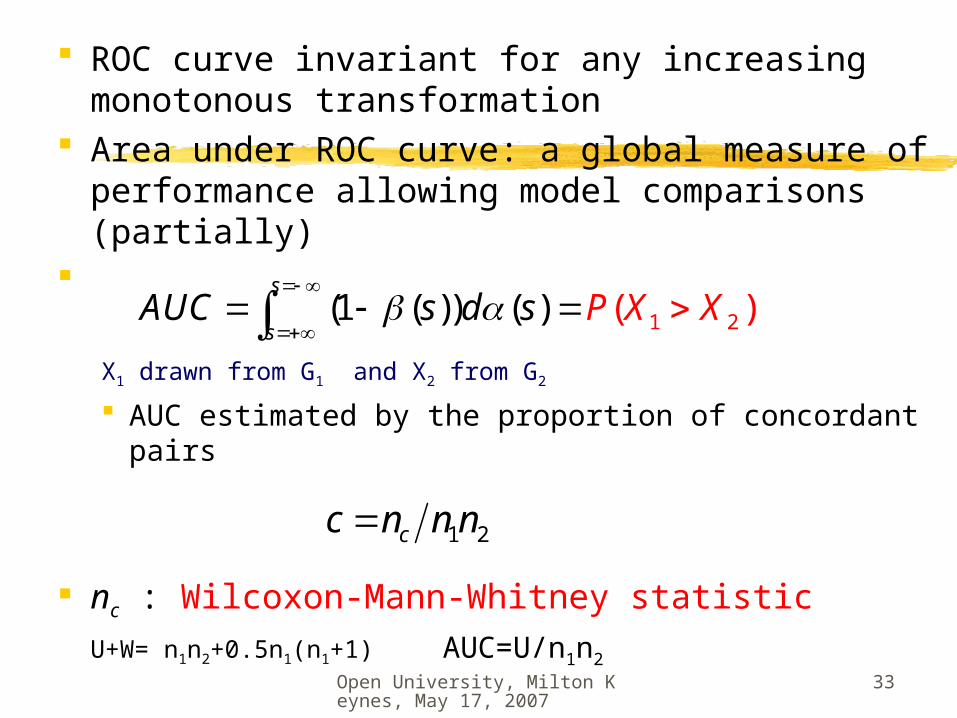
ROC curve invariant for any increasing monotonous transformation
Area under ROC curve: a global measure of performance allowing model comparisons (partially)
X1 drawn from G1 and X2 from G2
AUC estimated by the proportion of concordant pairs
nc : Wilcoxon-Mann-Whitney statisticU+W= n1n2+0.5n1(n1+1) AUC=U/n1n2
1 2((1 ) ( )( ) )s
sAUC Xd s P Xs
1 2cc n n n

Open University, Milton Keynes, May 17, 2007
34
4. Anticipated prediction
t*<T such that the analysis on [0;t*] give donne predictions almost as good as with [0;T]
Solution: When increasing s from 0 to T, look for
the first value such that AUC(s) does not differ significantly from AUC(T)

Open University, Milton Keynes, May 17, 2007
35
A bootstrap procedure Stratified resampling of the data For each replication b, AUCb(s) and
AUCb(T) are computed Student’s T test or Wilcoxon on the B
paired differences b=AUCb(s)- AUCb(T)
Open University, Milton Keynes, May 17, 2007
36
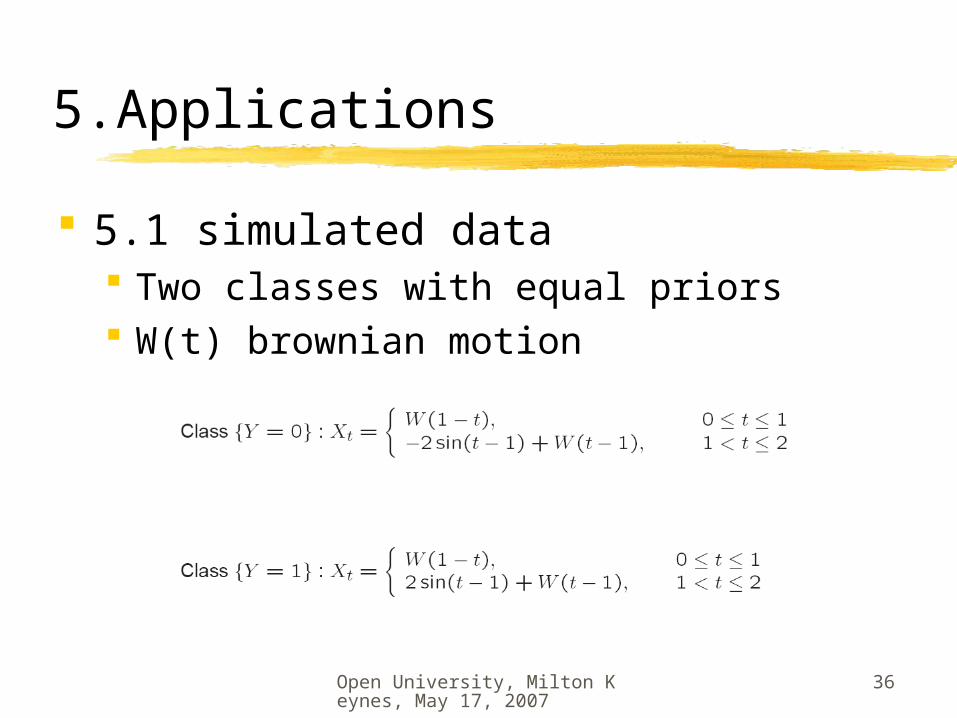
5.Applications
5.1 simulated data Two classes with equal priors W(t) brownian motion

Open University, Milton Keynes, May 17, 2007
37

Open University, Milton Keynes, May 17, 2007
38
With B=50

Open University, Milton Keynes, May 17, 2007
39
5.2 Kneading curves After T= 480s of kneading one gets
cookies where quality is Y 115 observations: 50 « good », 40 «bad
» et 25 « adjustable » 241 equally spaced measurements Smoothing with cubic B-splines , 16
knots

Open University, Milton Keynes, May 17, 2007
40
Performance for Y={good,bad} Repeat 100 times the split into learning and
test samples of size (60, 30) Average error rate
0.142 with principal components 0.112 with PLS components
Average AUC = 0.746
β(t)

Open University, Milton Keynes, May 17, 2007
41
Anticipated prediction B=50 t*=186
The recording period of the resistance dough can be reduced to less than half of the current one

Open University, Milton Keynes, May 17, 2007
42
6.Conclusions and perspectives
PLS regression is an efficient and simple way to get linear prediction for functional data
We have proposed a bootstrap procedure for the problem of anticipated prediction

Open University, Milton Keynes, May 17, 2007
43
Works in progress: « on-line » forecasting: instead of
using the same anticipated decision time t* for all data, we could adapt t* to each new trajectory given its incoming measurements.
Clusterwise discrimination Comparison with functional logistic
regressionAguilera et al, 2006

Open University, Milton Keynes, May 17, 2007
44
References Aguilera A.M., Escabias, M. & Valderrama M.J. (2006) Using principal
components for estimating logistic regression with high-dimensional multicollinear data, Computational Statistics & Data Analysis, 50, 1905-1924
Barker M., Rayens W. (2003) Partial least squares for discrimination. J Chemomet 17:166–173
Charles, C., 1977. Régression typologique et reconnaissance des formes. Ph.D., Université Paris IX.
D. Costanzo, C. Preda et G. Saporta (2006). Anticipated prediction in discriminant analysis on functional data for binary response . In COMPSTAT2006, p. 821-828, Physica-Verlag
Hennig, C., (2000). Identifiability of models for clusterwise linear regression. J. Classification 17, 273–296.
Lévéder C., Abraham C., Cornillon P. A., Matzner-Lober E., Molinari N. (2004): Discrimination de courbes de pétrissage. Chimiometrie 2004, 37–43.
Preda C. , Saporta G. (2005a): PLS regression on a stochastic process, Computational Statistics and Data Analysis, 48, 149-158.
Preda C. , Saporta G. (2005b): Clusterwise PLS regression on a stochastic process, Computational Statistics and Data Analysis, 49, 99-108.
Preda C., Saporta G. & Lévéder C., (2007) PLS classification of functional data, Computational Statistics
Ramsay & Silverman (1997) Functional data analysis, Springer

![Les panels - [Cedric]cedric.cnam.fr/~saporta/20120106 OM-GS-PP Les panels.pdfLes Retail Index – RI - Rapide portrait Permet de connaître les volumes, prix de vente et PDM des produits](https://img.dokumen.tips/doc/110x75/5b0a5fc77f8b9abe5d8e1a06/les-panels-cedric-saporta20120106-om-gs-pp-les-panelspdfles-retail-index-.jpg)