Embed Size (px)
Citation preview

Limnological and Water QualityAssessment of Lake Mainit
Limnological and Water QualityAssessment of Lake Mainit
MarcelinoI.Tumanda,Jr.,ElnorC. Roa,Jessie G. Gorospe, Milan T. Daitia,
Sonia M.Dejarme, Ruth D. GaidMindanao StateUniversityatNaawan
1961
STATE
NAAWAN,MIS.OR.
Limnological and Water Quality Assessment of Lake Mainit
Marcelino I. Tumanda, Jr., Elnor C. Roa, Jessie G. Gorospe, Milan T. Daitia, Sonia M. Dejarme, Ruth D. Gaid
Mindanao State University at Naawan Abstract
The physical, chemical, and biological characteristics of Lake Mainit were assessed as a step to understand the nature of the lake as an environment. The lake characteristics that were investigated include d morphology, bathymetry, visibility, vertical temperature-dissolved oxygen profile, bacterial load profile and the vertical variations of nutrients in the lake basin including those coming from river tributaries. Results from echo soundings and other processed data indicated that Lake Mainit has a surface area of 149.865 km2 and a water volume of 18.3556 km3. Maximum depth was estimated at 219.35 m with mean depth of about 122.48 m. Crytodepression of Lake Mainit was estimated at 198 m. Coastline length was estimated at 50 km. Results from vertical and surface temperature measurements indicate that Lake Mainit ranged between 26.60 – 30.60 oC. The temperature-depth profile defined the density stratification layers of Lake Mainit. The thermocline layer was observed between 10 – 35 m. Variations in vertical temperature have been observed at 0 m down to a depth of 30 m. Beyond this depth variations are minimal ranging between 0.03°C - 0.15°C. Water visibility of Lake Mainit expressed as Secchi depth ranged between 3.4 – 6.4 m with low visibility waters observed near rice fields and tributaries and highly transparent waters at the southern end of the lake. The dissolved oxygen concentration at the epilimnion ranges between 7.31 – 7.67 mgOL-1. Below the thermocline it rapidly decreases to <2 mgOL -1 from 50 m down to the 200-m depth. The oxycline has been observed between 10 m - 40 m. The vertical nutrient profile shows a uniform NH3-N concentration from 0 m - 60 m which significantly increases at 80 m to 200 m. A decreasing trend in the NO3-N profile has been observed between 0 m to 30 m which then increases at 60 m to 200 m. Phosphate concentrations are relatively low at 0 m - 40 m. Nutrient measurements from 11 river tributaries show high concentration levels with sources coming from predominantly agricultural lands and residential areas. Bacteriologic al analyses of water samples coming from 12 sampling stations show high total and fecal coliform (350 to 1600 MPN/100mL) in the three populated areas around the lake. Heavy metals and pesticidal residues were also detected in the lake but of no alarming concentrations. Plankton including chlorophyll a analyses are also presented.
The study indicates that Lake Mainit is an oligotrophic lake based on its physico-
chemical, natural productivity and optical properties and morphometric characteristics. Keywords: Lake Mainit, bathymetry, nutrient profile, bacterial load, thermocline, oxycline,
Caraga Region

2
I. Introduction
Lake Mainit, the fourth largest lake in the Philippines, is geographically located
between the Provinces of Surigao del Norte and Agusan del Norte, in the Island of Mindanao
(9020.32”-9031.98” N Latitude and 125028.50” E Longitude). It is also the deepest with a
maximum depth of about 223 m and a mean depth of about 128 m. It is one of the most
productive lakes in the country ranking only third to Laguna de Bay (Balayut, 1983).
The lake is the haven of several commercial species of fish that are a source of
livelihood of fishermen around the lakeshore. There are about 12 species of fish identified in
the lake (Lewis, 1973), seven of whic h are commercially exploited by fishermen (Gracia,
1981). Some of them are either migratory or were introduced by the Bureau of Fisheries and
Aquatic Resources (BFAR) or by some private individuals to augment the fish stocks in the
lake. The most dominant fish in the lake in terms of fish catch are the gobies (pidianga)
which constitute about 63.3% of the total daily catch (Gracia, 1981). The rest of the catches
are distributed among the other groups such as tilapia, mudfish, catfish, common carp, eel
and some miscellaneous species. The most dominant species of phytoplankton are the blue
green and green algae and some diatoms. The zooplankton species are dominated by
copepods and rotifers.
The plan to develop a hydroelectric generating plant that would tap Lake Mainit for
its water source would certainly have a far-reaching impact on the biology and ecology of
some important aquatic plant and animal species thriving in the lake. In fisheries, for
example, the construction of a dam that would regulate the flow of water for the operation of
a hydroelectric plant may have drastic effects on the biology and life history cycles of
migratory species. Experiences of other countries have shown that where they have lake fish
species that migrate over long distances to breed in the sea or vice-versa, the construction of
dams along their path of migration has usually wrought havoc to their fish stocks. Moreover,
the construction of a dam that would allow an excessive fluctuation of the water level in the
lake would also have drastic impacts on the ecology of some lakeshore habitats and may end
up seriously damaging important lake fisheries.
The need to obtain some baseline limnological information on Lake Mainit therefore
becomes an imperative in the light of the recent developments in the area. Such assessment
may be used to recommend remedial measures to preclude adverse ecological disturbances
that may happen in the event that the plan to operate a hydroelectric power plant would push

3
through. Moreover, the existence of the Lake Mainit Development Alliance (LMDA), a
consortium of local government units (LGUs), non-government organizations (NGOs) and
concerned educational institutions whose goals and objectives are for the sustainable
development of the lake, may have useful need for this type of baseline information for
policy formulation. The study therefore aims to generate baseline information on the
bathymetry and water quality of the lake prior to the possible operation of the hydroelectric
plant. Monitoring is needed to assess water quality such as the nutrients, levels of coliform
bacteria in the water and information on the siltation rates of sediments coming from river
tributaries. Determination of primary productivity will be done to assess the natural carrying
capacity of the lake. Hydrological parameters will be determined and correlated with other
biological and chemical factors obtaining in the area.
II. Objectives
The physical, chemical and biological assessment of Lake Mainit has been aimed to
accomplish the following:
1. To determine the bathymetric profile of Lake Mainit. 2. To determine the surface temperature and depth-temperature profile of the lake;
and 3. To determine the Secchi disk visibility of the lake. 4. To determine the quality of water in the lake in terms of its nutrients (nitrates,
ammonia and phosphates), dissolved oxygen, and pH and 5. To determine the total bacterial counts and the most probable numbers (MPNs) of
fecal and non-fecal coliforms in selected areas of the lake; 6. To determine the pollution levels of the lake provided in terms of pesticidal
residues and heavy metals; 7. To determine the sediment load of major river tributaries and sedimentation rates
of Lake Mainit; 8. To determine the planktonic flora and fauna and the natural productivity of the
lake; and 9. To recommend possible management measures aimed at maintaining the
ecological sustainability of the lake as a natural resource.
III. Review of Literature
Lake Mainit is a tectonic type of lake of which the basin is formed by movements of
the earths crust. The periodic horizontal land displacement along left-stepping left lateral
faults produced the pull-apart basin of Lake Mainit that is characterized generally by
elongated shape and deep bathymetric contour profile (Punongbayan, 2003). The formation

4
of Lake Mainit was aided by the growth of Kapalaian Volcano that now defines its northern
boundary (Punongbayan, 2003).
A limnological survey of Lake Mainit was conducted in 1971 by Lewis (1973) and
published the first bathymetric map of Lake Mainit although Woltereck (1941) as cited by
Lewis (1973) measured depth at one site and reported a depth of 167 m. Gracia (1981) and
Balayut (1983) published limited data on physical properties of the lake. Compiled
secondary data on the physical limnology and some revisions on watershed areas of Lake
Mainit are reported by PMO-LMDA (2004) in its environmental management plan.
IV. Materials and Methods
Bathymetry
Most limnological phenomena, distribution of biota, and productivity are directly
related to the morphological features of the lake basin. The absence of such information
would hamper the gathering of other benchmark data aimed at understanding the dynamics of
the lake as an aquatic ecosystem. Thus, there is the need to characterize the general
topography of the lake basin and come with a profile of its depth and the characteristics of its
bottom substrate.
Subsurface physical configuration of Lake Mainit was investigated using echo
sounding and line sounding method. The lake was subdivided into horizontal and vertical
grid lines whose coordinates were used as guides during the conduct of the echo and line
sounding. The echo sounding method employed a Furuno (Model FE 4300) Echo Sounder
mounted on a motorized boat. A compass mounted on the boat guided the steady traverse of
the boat during echo sounding. All echo sounding activities were conducted when the state of
lake surface water is at Beaufort wind scale of 0-1. Line sounding method was employed in
areas that are very shallow and where echo-sounding method was rendered impractical. A
modified clinometer attached to the sounding line was employed to correct vertical
departures and errors. The geographical positions of all sampling stations and transects of
echo sounding in the study were determined using a GPS (Global Positioning System).
Echosounder paper prints and line sounding records were translated into depths and a
bathymetric map was created from the interpreted data sets using a surface mapping software
Surfer 7 (Golden Software Inc).

5
Measurement for surface area of lake was made using a digital polar planimeter
Approximation for lake volume was obtained by calculating and summing the volumes of
conical segments (frustra) with upper and lower surfaces delimited by the areas of sequential
depth contours (Welch, 1948):
Lake Volume = ? Frustrum volumes
Where :
Frustrum volume = h / 3 (a1 + a2 + v¯a1 a2 )
h = Depth of frustrum a1 = area of frustrum surface a2 = area of frustrum bottom
The shoreline development (SLD) is an index of the regularity of the shoreline. It is
determined by the following equation (Lind, 1979):
SLD = S / 2v¯a p Where S = length of shoreline A = area of Lake Water Temperature
Horizontal and vertical temperature profile of the lake was investigated with the
surface horizonta l temperature being measured by a bucket thermometer. The vertical
temperature profile was investigated using a reversing thermometer mounted on a Nansen
reversing sampling bottle. Water samples collected from the Nansen bottle were also used for
pH, dissolved oxygen and nutrient analyses in the water quality studies. Temperature data
collected were interpreted and translated into a distribution map for temperature. Vertical
profiles identifying layers of temperature were then constructed.
Visibility
Secchi disk visibility is a measure of the water clarity and it is related to the photic
depth. Light transparency was investigated in the lake using a standard freshwater Secchi
disk. The disappearance and reappearance of the disk as it was lowered and raised up were
noted and recorded. Depth corrections were integrated using measurement from a clinometer
attached to the line. Data collected were processed in Surfer 7 software and transparency
profile of the lake is presented as a distribution map.

6
Physico-chemical parameters
Water samples were collected using a water sampler and were used for pH, dissolved
oxygen (DO) and nutrient analyses. Data collected were interpreted and translated into
thematic profile maps for dissolved oxygen. Vertical profiles identifying layers of these
parameters were also generated from these data sets.
The collection and analyses of water samples for NO3-N, NH3-N, PO4-P and
dissolved oxygen followed the Standard Methods for the Examination of Water and
Wastewater (APHA, 1995) while water temperature and pH were determined using a
reversing thermometer and pH meter, respectively. The collected water samples were kept in
styropore boxes with ice and were brought to MSU-Naawan Chemistry Laboratory for
analyses.
Coliform bacteria
Twelve sampling stations were identified in Lake Mainit for the coliform study. The
selection of the sampling sites was based on the following criteria: populated areas, beach
resorts, fishing villages, drainage coming from poultry and other livestocks and away from
populated areas. The middle of the lake which was far from the populated areas served as the
control.
The collection of water samples for bacteriological analyses followed the Standard
Methods for the Examination of Water and Wastewater (APHA, 1995). The collected water
samples were kept in styropore boxes with ice cubes and brought to MSU-Naawan Pathology
Laboratory for analyses.
Pesticides
The pollution levels of organochlorines and organophosphates from pesticide
residues were determined through gas chromatography. Seven sampling stations were
identified for the pesticide study. Included in these sampling stations were the bigger river
tributaries of the lake, namely: Baleguian River, San Roque, Mamkas, Magtiaco,
Magpayang, Mainit and Mayag River. Samples of bottom sediments from these established
sampling stations were collected.
The procedures for the extraction of pesticide residues were those recommended in
the Environmental Protection Agency (EPA) Manual for sediment and biological samples.
7
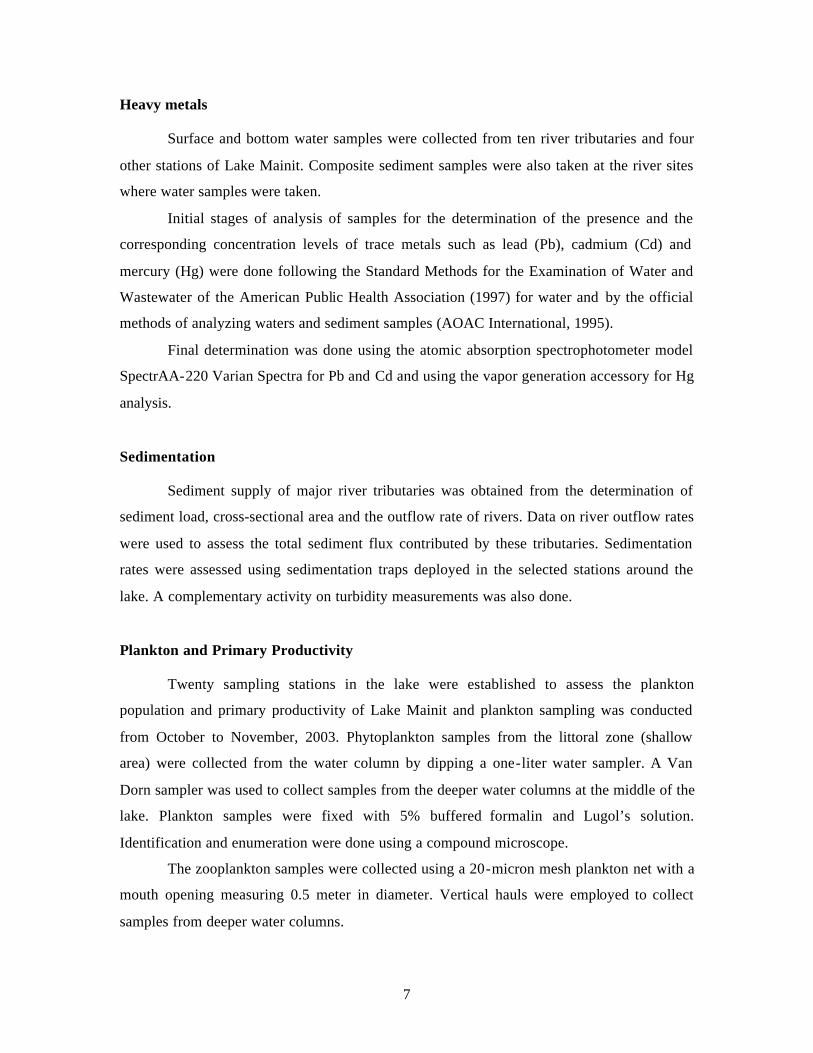
Heavy metals
Surface and bottom water samples were collected from ten river tributaries and four
other stations of Lake Mainit. Composite sediment samples were also taken at the river sites
where water samples were taken.
Initial stages of analysis of samples for the determination of the presence and the
corresponding concentration levels of trace metals such as lead (Pb), cadmium (Cd) and
mercury (Hg) were done following the Standard Methods for the Examination of Water and
Wastewater of the American Public Health Association (1997) for water and by the official
methods of analyzing waters and sediment samples (AOAC International, 1995).
Final determination was done using the atomic absorption spectrophotometer model
SpectrAA-220 Varian Spectra for Pb and Cd and using the vapor generation accessory for Hg
analysis.
Sedimentation
Sediment supply of major river tributaries was obtained from the determination of
sediment load, cross-sectional area and the outflow rate of rivers. Data on river outflow rates
were used to assess the total sediment flux contributed by these tributaries. Sedimentation
rates were assessed using sedimentation traps deployed in the selected stations around the
lake. A complementary activity on turbidity measurements was also done.
Plankton and Primary Productivity
Twenty sampling stations in the lake were established to assess the plankton
population and primary productivity of Lake Mainit and plankton sampling was conducted
from October to November, 2003. Phytoplankton samples from the littoral zone (shallow
area) were collected from the water column by dipping a one-liter water sampler. A Van
Dorn sampler was used to collect samples from the deeper water columns at the middle of the
lake. Plankton samples were fixed with 5% buffered formalin and Lugol’s solution.
Identification and enumeration were done using a compound microscope.
The zooplankton samples were collected using a 20-micron mesh plankton net with a
mouth opening measuring 0.5 meter in diameter. Vertical hauls were employed to collect
samples from deeper water columns.

8
Primary productivity measurements were done in selected stations applying the
chlorophyll a method following the Standard Methods for the Examination of Water and
Wastewater (APHA, 1995).
V. Results and Discussion Bathymetry
A total of 183 echosounding tracks were made and 777 coastline points were marked
by GPS (Global Positioning System) and used in the construction of a surface map (Fig. 1)
and bathymetric map of Lake Mainit. Data sets were then processed in a spreadsheet
program and subsequently used in a surface mapping software Surfer V 7.0 (Golden Software
Inc.).
The surface area of Lake Mainit was determined using polar planimetry. Surface
calculations and cumulative distributions are presented in Table 1. The surface area of Lake
Mainit was estimated at 149.86 km2.
The coastline length of Lake Mainit (Fig. 1) based on GPS readings and interpreted
using a surface mapping software was measured using cartometer method. The coastline was
estimated at approximately 50 km, which was similar to the reported coastline of Lake Mainit
by PMO-LMDA (2004). The coastline of Lake Mainit is irregular as an outcome of its
tectonic origin and deltaic buildup of about 28 tributaries that drain water from about 608
km2 of watershed area. The watershed of Lake Mainit was formerly 313 km2 (Lewis, 1973)
but because of the merger and change of path and divergence of Puyo River to Toliago
Creek, the watershed of the lake has widened to its present state as a consequence of these
two events. Deltaic build-ups were notable in Mayag River, Magpayang River, Tagbuyawan
River, Baleguian River, Alimpatayan River and Puyo River.

9
Table 1. Distribution of surface area, relative and cumulative surface area at corresponding depths and cumulative depths of Lake Mainit, Philippines.
Depth Cumulative Depth (%)
Surface Area (km3)
Surface Area (%)
Cumulative Surface Area (%)
0 0.0 149.87 100.00 100 0.1-5 2.3 9.30 6.20 93.80
5.1-25 11.4 14.86 9.91 83.88 25.1-50 22.8 14.98 10.00 73.88 50.1-75 34.2 11.03 7.36 66.52
75.1-100 45.6 9.54 6.37 60.16 100.1-125 57.0 10.67 7.12 53.04 125.1-150 68.4 11.18 7.46 45.58 150.1-175 79.8 13.73 9.16 36.42 175.1-200 91.2 18.72 12.49 23.93 200.1-210 95.7 12.55 8.37 15.55 210.1-215 98.0 7.51 5.01 10.54
215.1-219.35 100.0 15.80 10.54 0.00
Elevation readings were made at the surface of the lake at different atmospheric
pressures. Necessary corrections were made by observing elevation at sea level at different
atmospheric pressures. The elevation measurements indicated that Lake Mainit surface
elevation was 21.34 m above sea level. The lake surface is subjected to large fluctuations in
elevation at different times of the year. The climate type prevailing in Lake Mainit and its
watershed area is classified as Type II being characteristic of the southeastern coastal areas of
the country that shows a clear trend toward heavy rainfall and low temperature from
November through March and a combination of drier weather and higher mean temperature
during other months, particularly June through September. During maximum rain period the
lake level is raised by as much as 1 m however, during episodic storms the lake level is raised
to as high as 2-3 m. During the course of the study, water marks of lake level surface as high
as 2.2 m were observed imprinted in the rocks along the coast.
The bathymetric map output (Fig. 1) using the software Surfer 7 (Golden Software
Inc.) shows that the lake coastline is irregular and elongated that is characteristic of pull-apart
basins of tectonic origin (Punongbayan, 2003). A tectonic activity in Lake Mainit was
observed in a report on July 1, 1879 by Fr. Luengo to the Governor General of the
Philippines which stated in the account that hills and portions of the coast have slid down to
the lake as a result of a very powerful earthquake that rocked Lake Mainit
(http://www.philvocs.dost.gov.ph/Earthquakes/1999BayuganEQ/bayugan99.html).
10
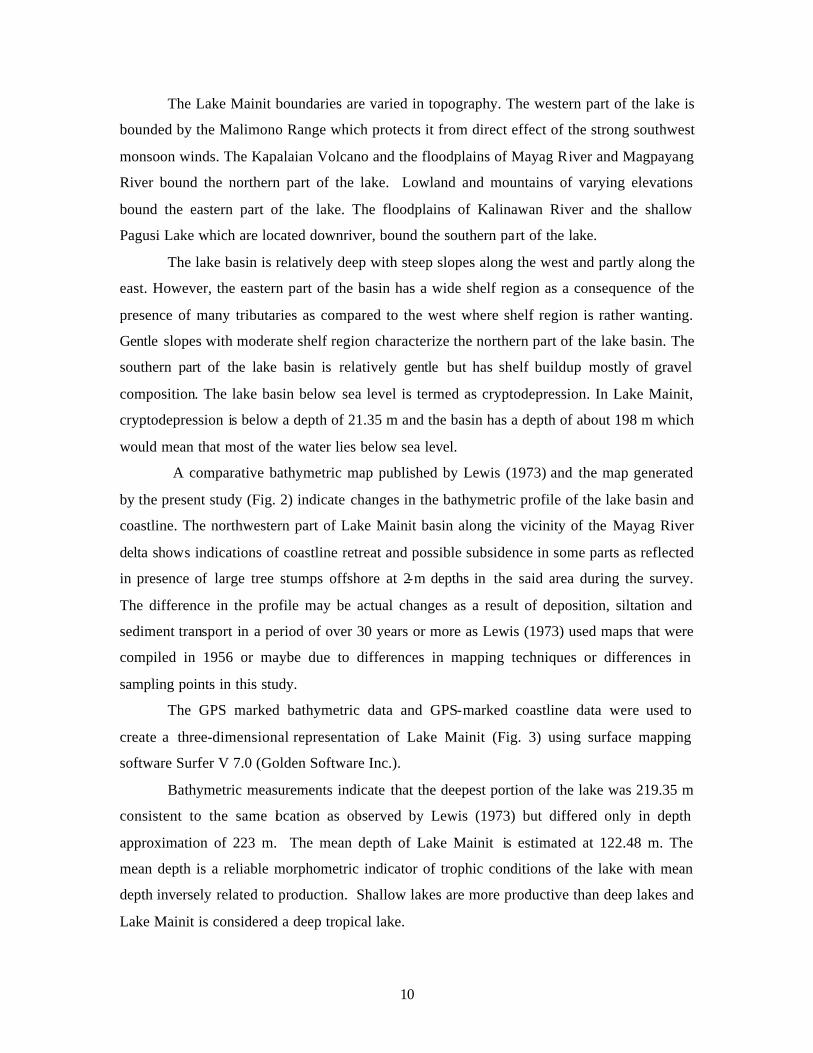
The Lake Mainit boundaries are varied in topography. The western part of the lake is
bounded by the Malimono Range which protects it from direct effect of the strong southwest
monsoon winds. The Kapalaian Volcano and the floodplains of Mayag River and Magpayang
River bound the northern part of the lake. Lowland and mountains of varying elevations
bound the eastern part of the lake. The floodplains of Kalinawan River and the shallow
Pagusi Lake which are located downriver, bound the southern part of the lake.
The lake basin is relatively deep with steep slopes along the west and partly along the
east. However, the eastern part of the basin has a wide shelf region as a consequence of the
presence of many tributaries as compared to the west where shelf region is rather wanting.
Gentle slopes with moderate shelf region characterize the northern part of the lake basin. The
southern part of the lake basin is relatively gentle but has shelf buildup mostly of gravel
composition. The lake basin below sea level is termed as cryptodepression. In Lake Mainit,
cryptodepression is below a depth of 21.35 m and the basin has a depth of about 198 m which
would mean that most of the water lies below sea level.
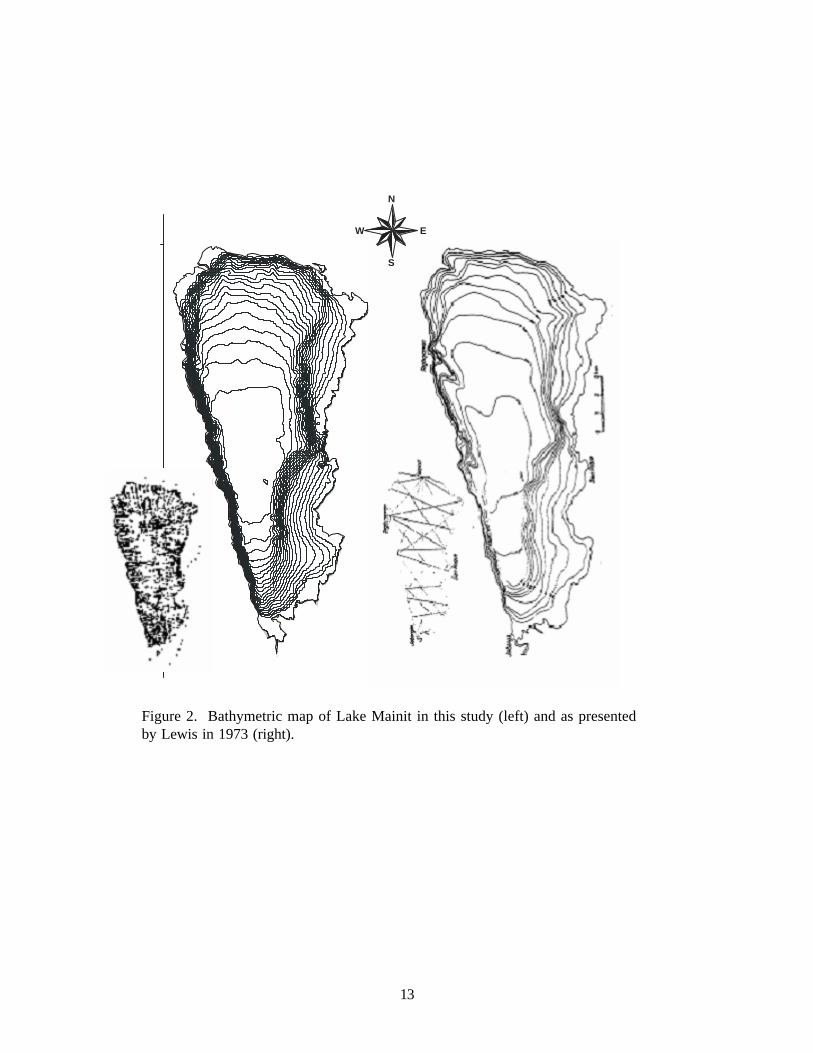
A comparative bathymetric map published by Lewis (1973) and the map generated
by the present study (Fig. 2) indicate changes in the bathymetric profile of the lake basin and
coastline. The northwestern part of Lake Mainit basin along the vicinity of the Mayag River
delta shows indications of coastline retreat and possible subsidence in some parts as reflected
in presence of large tree stumps offshore at 2-m depths in the said area during the survey.
The difference in the profile may be actual changes as a result of deposition, siltation and
sediment transport in a period of over 30 years or more as Lewis (1973) used maps that were
compiled in 1956 or maybe due to differences in mapping techniques or differences in
sampling points in this study.
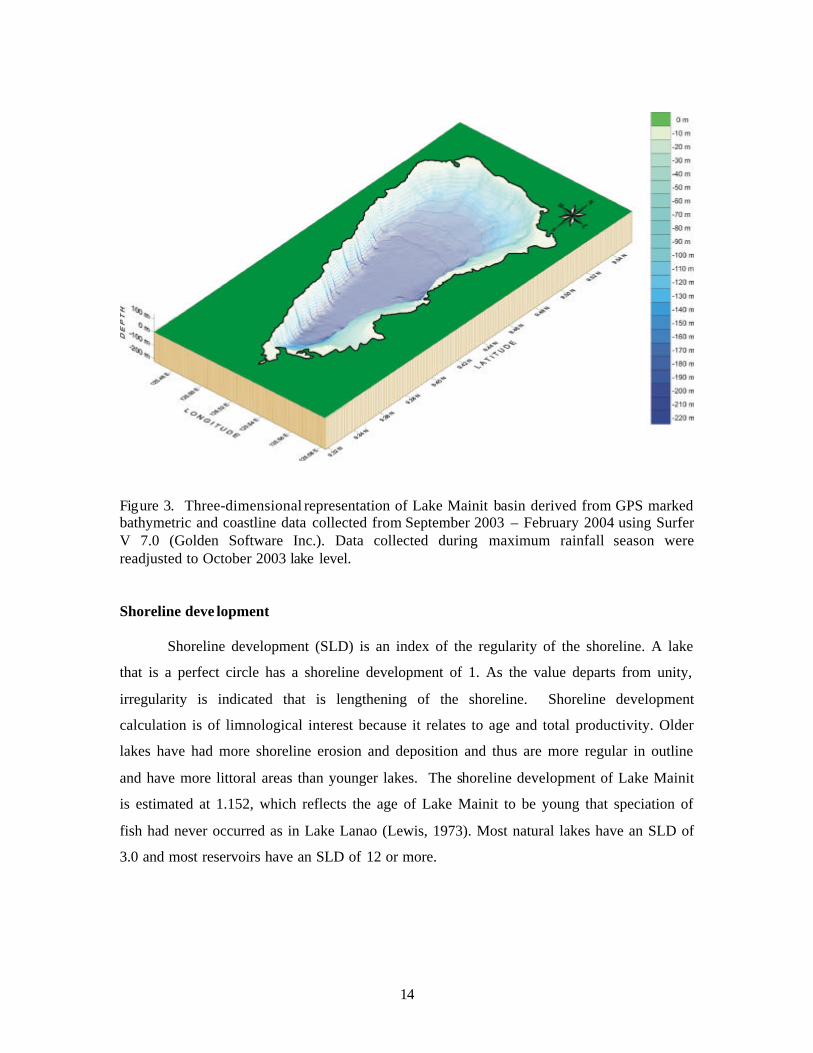
The GPS marked bathymetric data and GPS-marked coastline data were used to
create a three-dimensional representation of Lake Mainit (Fig. 3) using surface mapping
software Surfer V 7.0 (Golden Software Inc.).
Bathymetric measurements indicate that the deepest portion of the lake was 219.35 m
consistent to the same location as observed by Lewis (1973) but differed only in depth
approximation of 223 m. The mean depth of Lake Mainit is estimated at 122.48 m. The
mean depth is a reliable morphometric indicator of trophic conditions of the lake with mean
depth inversely related to production. Shallow lakes are more productive than deep lakes and
Lake Mainit is considered a deep tropical lake.
11
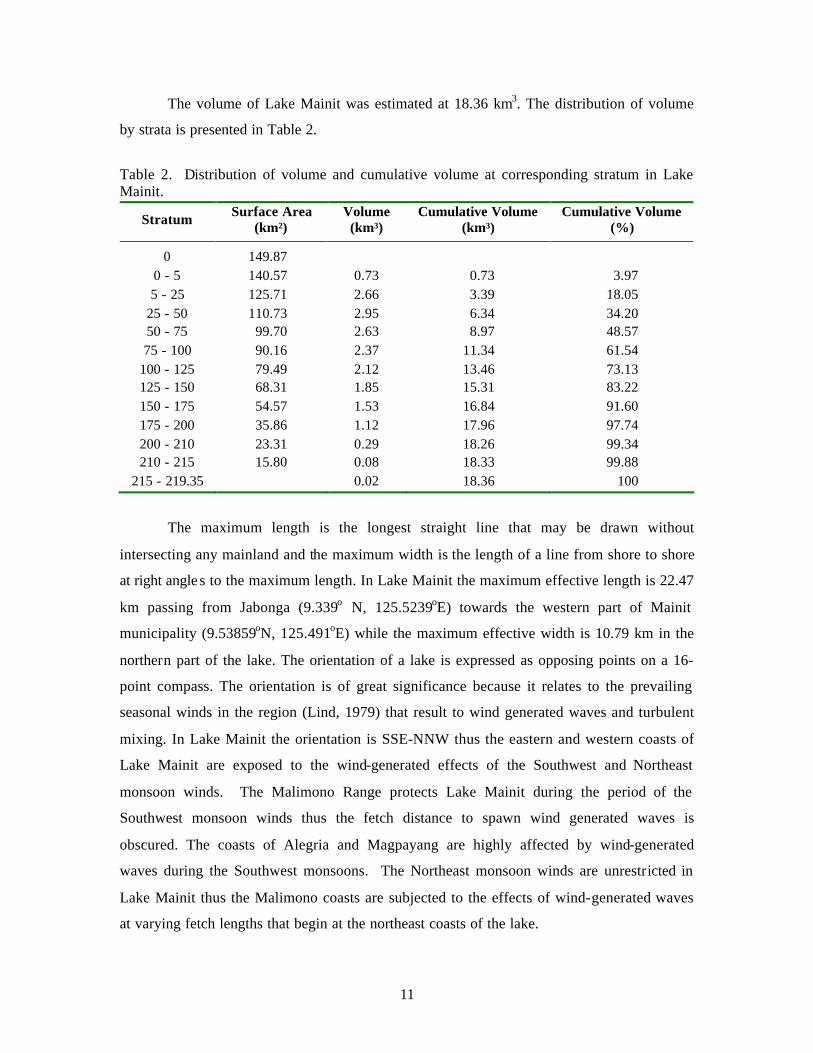
The volume of Lake Mainit was estimated at 18.36 km3. The distribution of volume
by strata is presented in Table 2.
Table 2. Distribution of volume and cumulative volume at corresponding stratum in Lake Mainit.
Stratum Surface Area (km²)
Volume (km³)
Cumulative Volume (km³)
Cumulative Volume (%)
0 149.87 0 - 5 140.57 0.73 0.73 3.97 5 - 25 125.71 2.66 3.39 18.05
25 - 50 110.73 2.95 6.34 34.20 50 - 75 99.70 2.63 8.97 48.57 75 - 100 90.16 2.37 11.34 61.54
100 - 125 79.49 2.12 13.46 73.13 125 - 150 68.31 1.85 15.31 83.22 150 - 175 54.57 1.53 16.84 91.60 175 - 200 35.86 1.12 17.96 97.74 200 - 210 23.31 0.29 18.26 99.34 210 - 215 15.80 0.08 18.33 99.88
215 - 219.35 0.02 18.36 100
The maximum length is the longest straight line that may be drawn without
intersecting any mainland and the maximum width is the length of a line from shore to shore
at right angle s to the maximum length. In Lake Mainit the maximum effective length is 22.47
km passing from Jabonga (9.339o N, 125.5239oE) towards the western part of Mainit
municipality (9.53859oN, 125.491oE) while the maximum effective width is 10.79 km in the
northern part of the lake. The orientation of a lake is expressed as opposing points on a 16-
point compass. The orientation is of great significance because it relates to the prevailing
seasonal winds in the region (Lind, 1979) that result to wind generated waves and turbulent
mixing. In Lake Mainit the orientation is SSE-NNW thus the eastern and western coasts of
Lake Mainit are exposed to the wind-generated effects of the Southwest and Northeast
monsoon winds. The Malimono Range protects Lake Mainit during the period of the
Southwest monsoon winds thus the fetch distance to spawn wind generated waves is
obscured. The coasts of Alegria and Magpayang are highly affected by wind-generated
waves during the Southwest monsoons. The Northeast monsoon winds are unrestricted in
Lake Mainit thus the Malimono coasts are subjected to the effects of wind-generated waves
at varying fetch lengths that begin at the northeast coasts of the lake.

12
Figure 1. Bathymetric map of Lake Mainit showing 10-m isobath interval. The last isobath polygon found at the middle of the lake has a depth of 219 m.
125.48 E 125.50 E 125.52 E 125.54 E 125.56 E 125.58 E
L O N G I T U D E
9.32 N
9.34 N
9.36 N
9.38 N
9.40 N
9.42 N
9.44 N
9.46 N
9.48 N
9.50 N
9.52 N
9.54 N
L A
T I
T U
D E
N
S
EW
13
S
EW
N
S
EW
Figure 2. Bathymetric map of Lake Mainit in this study (left) and as presented by Lewis in 1973 (right).
14
Figure 3. Three-dimensional representation of Lake Mainit basin derived from GPS marked bathymetric and coastline data collected from September 2003 – February 2004 using Surfer V 7.0 (Golden Software Inc.). Data collected during maximum rainfall season were readjusted to October 2003 lake level. Shoreline deve lopment
Shoreline development (SLD) is an index of the regularity of the shoreline. A lake
that is a perfect circle has a shoreline development of 1. As the value departs from unity,
irregularity is indicated that is lengthening of the shoreline. Shoreline development
calculation is of limnological interest because it relates to age and total productivity. Older
lakes have had more shoreline erosion and deposition and thus are more regular in outline
and have more littoral areas than younger lakes. The shoreline development of Lake Mainit
is estimated at 1.152, which reflects the age of Lake Mainit to be young that speciation of
fish had never occurred as in Lake Lanao (Lewis, 1973). Most natural lakes have an SLD of
3.0 and most reservoirs have an SLD of 12 or more.
15
Hypsographic curve
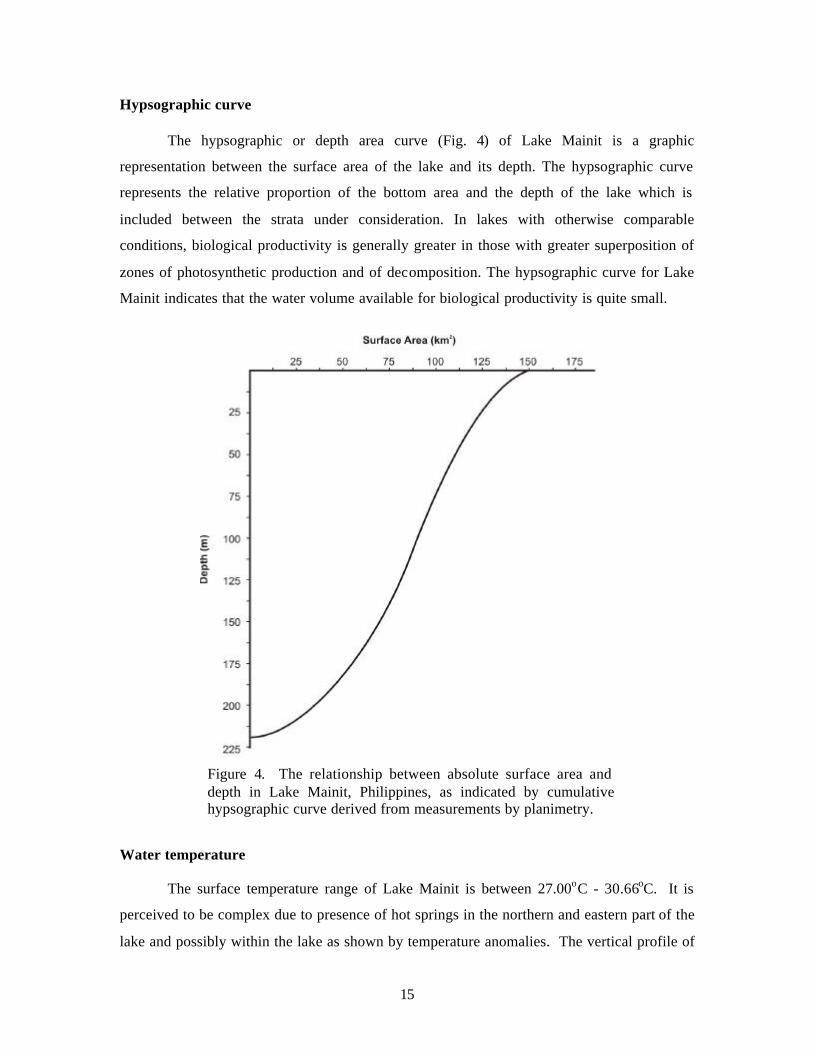
The hypsographic or depth area curve (Fig. 4) of Lake Mainit is a graphic
representation between the surface area of the lake and its depth. The hypsographic curve
represents the relative proportion of the bottom area and the depth of the lake which is
included between the strata under consideration. In lakes with otherwise comparable
conditions, biological productivity is generally greater in those with greater superposition of
zones of photosynthetic production and of decomposition. The hypsographic curve for Lake
Mainit indicates that the water volume available for biological productivity is quite small.
Figure 4. The relationship between absolute surface area and depth in Lake Mainit, Philippines, as indicated by cumulative hypsographic curve derived from measurements by planimetry.
Water temperature
The surface temperature range of Lake Mainit is between 27.00oC - 30.66oC. It is
perceived to be complex due to presence of hot springs in the northern and eastern part of the
lake and possibly within the lake as shown by temperature anomalies. The vertical profile of
16
temperature distribution expressed as depth-temperature profile is presented in Fig. 5. The
vertical water temperature range in Lake Mainit is between 26. 60oC - 30.66oC. Depth-
temperature data indicated that Lake Mainit is stratified. The epilimnion or the mixed layer is
found at the upper 10 m although observations by Lewis (1973) at a different time indicated
12 m. The thermocline layer of Lake Mainit in this study during sampling was observed
between 10 - 35 m and the hypolimnion was beyond 35 m. The depth-temperature profile
(Fig. 6) was an observation at the height of strong NE monsoon winds thus variation was
observed at the surface down to 30 m. This observed variation indicated that turbulent mixing
could reach down to 30 m.
Water visibility
Secchi disk visibility is a measure of the water clarity and it is related to the photic
depth. Secchi depth measurements ranged between 3.20 - 6.65 m (Fig. 7). It is prominent
that Mainit municipality area close to rice fields has very low visibility including
municipalities of Kitcharao and Alegria. Areas away from tributaries have higher visibility
including Jabonga and areas close to Malimono range. A new Philippine record of 6.65 m
Secchi depth for the most transparent lake was observed at the vicinity of Jabonga. Lake
Lanao had a maximum Secchi depth reading of 6.0 m in 1932 (Frey, 1974) which made it the
most transparent lake in the Philippines until January 2004.
The 1% PAR (photosynthetically active radiation) of Lake Mainit as observed by
Lewis (1973) at a Secchi depth of 2.6 m was noted in this study at 13 m. The result would
mean that the 1% PAR in Lake Mainit was 5 times the Secchi depth although in natural
waters the 1% PAR was generally between 2-5 times the Secchi depths (Lind, 1979). The
1% PAR of Lake Lanao was observed at 11- 25 m (Frey, 1974). The apparent similarity of
Lake Lanao and Lake Mainit in terms of Secchi depth readings indicates that the Lake Mainit
waters, having a more transparent characteristic, must have more than 25 m as its depth
maximum for the 1% PAR.

17
L o n g i t u d e
L a
t i t
u d
eN
S
EW
Figure 5. Distribution of surface temperature on January 2004 in Lake Mainit, Philippines.

18
Figure 6. Depth-temperature profile of Lake Mainit showing extent of variation at the upper layer as a result of turbulent mixing. Thermal stratification is pronounced in most parts. The thermocline layer of Lake Mainit is approximately between 10 – 35 m.

19
Figure 7. Distribution of water visibility based on Secchi depth measurements (meters) on January 2004 in Lake Mainit, Philippines.

20
Temperature, dissolved oxygen and pH
The observed temperature profile of Lake Mainit ranges between 26.55oC - 30.60oC.
The surface temperature ranges between 29.20oC - 30.60oC while the vertical temperature
profile indicates a mixed layer at a depth of 10 m during calm weather conditions and
extending to 30 m during intense weather conditions (Fig. 8). The thermocline layer ranges
between 10 m to 35 m.
Dissolved oxygen is an important regulator of chemical processes and biological
activity. It is the most fundamental parameter essential to all aerobic organisms. However,
the levels often differ greatly because mixing is seldom complete. In addition, biological
reactions in the lake consume or release oxygen. The vertical distribution of dissolved
oxygen (Fig. 8) shows that the oxycline of the lake has been observed to be between 10 m to
35 m at about 27.50oC to 30.00oC. The DO concentration is more or less uniform in the
epilimnion or upper water layer (7.31 - 7.67 mgOL -1) where there is mixing of water due to
wind action. The DO level rapidly decreases below the thermocline (~10 - 35 m) to less than
2 mgOL-1 at 50 m and down to the bottom at about 200 m depth.
The lowering of DO with depth may be due to the existence of a thermal stratification
of the lake where the hypolimnion becomes isolated from the sources of oxygen at the upper
layer. Dissolved oxygen is widely observed to decrease progressively in the hypolimnion
over a period of stratification because the demand for oxygen associated with respiration and
decay exceeds the sources. Moreover, oxygen consumption is greatest near the bottom of the
lake where settled organic matter is continually being decomposed (Frick et al., 1990). Its
concentration also decreases progressively with depth at the hypolimnion and towards the
sediments because of localized biological and chemical oxygen demand at the bottom and the
limited vertical mixing at these depths.
The lowest DO level (4.04 mgO.L -1) was observed in the vicinity of Magpayang to
Alegria and parts of Puyo (Fig. 9). Most areas of the lake have DO levels between 6.0 - 8.05
mgOL-1.

21
Figure 8. Depth-temperature and dissolved oxygen profiles of Lake Mainit.
22
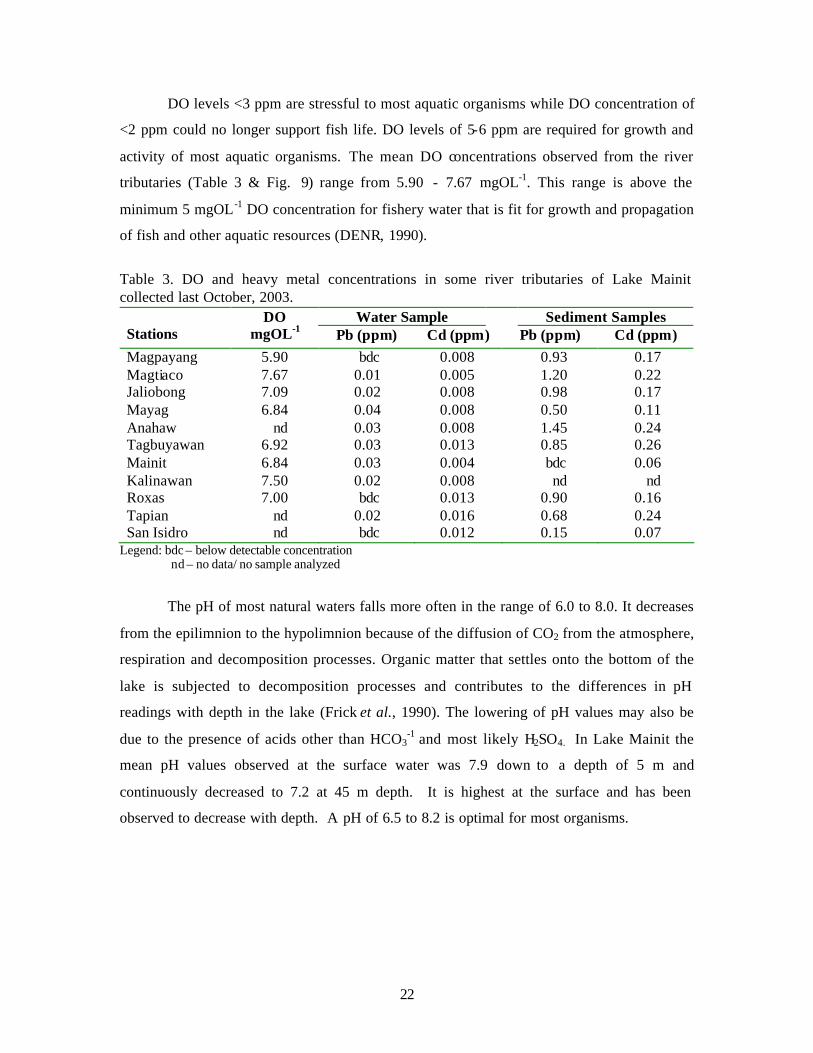
DO levels <3 ppm are stressful to most aquatic organisms while DO concentration of
<2 ppm could no longer support fish life. DO levels of 5-6 ppm are required for growth and
activity of most aquatic organisms. The mean DO concentrations observed from the river
tributaries (Table 3 & Fig. 9) range from 5.90 - 7.67 mgOL-1. This range is above the
minimum 5 mgOL-1 DO concentration for fishery water that is fit for growth and propagation
of fish and other aquatic resources (DENR, 1990).
Table 3. DO and heavy metal concentrations in some river tributaries of Lake Mainit collected last October, 2003.
Water Sample Sediment Samples Stations
DO mgOL-1 Pb (ppm) Cd (ppm) Pb (ppm) Cd (ppm)
Magpayang 5.90 bdc 0.008 0.93 0.17 Magtiaco 7.67 0.01 0.005 1.20 0.22 Jaliobong 7.09 0.02 0.008 0.98 0.17 Mayag 6.84 0.04 0.008 0.50 0.11 Anahaw nd 0.03 0.008 1.45 0.24 Tagbuyawan 6.92 0.03 0.013 0.85 0.26 Mainit 6.84 0.03 0.004 bdc 0.06 Kalinawan 7.50 0.02 0.008 nd nd Roxas 7.00 bdc 0.013 0.90 0.16 Tapian nd 0.02 0.016 0.68 0.24 San Isidro nd bdc 0.012 0.15 0.07
Legend: bdc – below detectable concentration nd – no data/ no sample analyzed
The pH of most natural waters falls more often in the range of 6.0 to 8.0. It decreases
from the epilimnion to the hypolimnion because of the diffusion of CO2 from the atmosphere,
respiration and decomposition processes. Organic matter that settles onto the bottom of the
lake is subjected to decomposition processes and contributes to the differences in pH
readings with depth in the lake (Frick et al., 1990). The lowering of pH values may also be
due to the presence of acids other than HCO3-1 and most likely H2SO4. In Lake Mainit the
mean pH values observed at the surface water was 7.9 down to a depth of 5 m and
continuously decreased to 7.2 at 45 m depth. It is highest at the surface and has been
observed to decrease with depth. A pH of 6.5 to 8.2 is optimal for most organisms.

23
L o n g i t u d e
L a
t i t
u d
eN
S
EW
Figure 9. Dissolved oxygen profile of Lake Mainit.

24
Nutrients
Aquatic organisms influence and are influenced by the chemistry of the surrounding
environment. Essential nutrients such as the bioavailable forms of phosphorous and nitrogen
(dissolved phosphate, nitrate and ammonium) typically decrease at the epilimnion during
stratification as nutrients are taken up by the algae and eventually transported to the
hypolimnion when the algae die and settle down. Stratification affects dissolved oxygen and
other nutrient concentrations in the water column (Lebo et al. , 2002). Nutrient concentrations
in Lake Mainit show a strong vertical gradient (Fig. 10) with mean NO3-N varying from
0.099 mgNL-1 at 35 m to 0.507 mgNL-1 at the surface water. The mean NH3-N concentration
is uniform from the surface water to 60 m and gradually increases with depth. It ranges from
0.004 to 0.037 mgNL-1 (Fig. 10). The mean PO4-P concentrations ranges from a below
detectable concentration at the surface water to 0.20 mgPL-1 at 200 m (Fig. 10). Relatively
lower nutrient values have been observed at 20 - 50 m which are within or at the vicinity of
the oxycline. The oxycline is around 10 - 35 m, thus inhibiting many macroorganisms from
living at the bottom of the lake. With lower number of organisms fewer nutrients are used.
Thus, deep waters te nd to be nutrient rich. Higher nutrient values below the thermocline may
probably be caused by the regeneration of particulate matter sedimenting from the
epilimnion.

25
Figure 10. Vertical profiles of nutrient (NO3-N, NH3-N and PO4-P) in Lake Mainit. Date of sampling: October 2003.

26
Generally, the epilimnion shows lower nutrient concentration due to the uptake by
photosynthetic organisms. However, the results of nitrate analyses show that NO3-N values
are higher at the surface waters. It has been note d that heavy rains occurred the night before
water sampling was done. The water coming from the agricultural lands and residential areas
brought by river tributaries may have contributed to the increase in NO3-N levels.
Nutrients like phosphorous and nitrogen can enter a lake from surface runoff, ground
water, streams and by atmospheric deposition as well as recycled from bottom lake
sediments. Eleven river tributaries and one river outlet (Kalinawan River) were considered
for nutrient analyses.
Sewage is the main source of nitrate added by humans into rivers and lakes. Nitrate is
also used widely in inorganic fertilizers, in explosives and as raw chemical in industrial
processes. The nitrate concentration in groundwater and surface water is normally low, but
can reach high levels from agricultural runoff or from contamination by human and livestock
wastes and farm manure.
The NO3-N concentration observed in the river tributaries ranged between 0.26 mgL-1
and 1.21 mgL-1 in Agong-ongan and Jaliobong River, respectively, during the first sampling
period in October 2003, while it was below detectable concentration in Mainit, Tagbuyawan
and Magtiaco River during the second sampling period in April 2004 (Fig. 11). During the
same sampling period Baleguian River had a concentration of 0.76 mgL-1. Due to sampling
difficulties, water samples were not collected from Baleguian and Puyo Rivers during the
first sampling period.
The excreta of aquatic organisms are very high in ammonia. Through the
decomposition of dead pla nts, animals and excreta, nitrogen that has been previously ‘locked
up’ is released in the water (Weaver, 1997). Water samples collected from Agong-ongan
River were observed to have the highest ammonia concentration (0.052 mgL-1) during the
first sampling period and Baleguian River of 0.04 mgNL -1 during the next sampling (Fig. 12).
It was noted that several carabaos were wallowing in both rivers during sampling and the
catchment area of these rivers are agricultural lands. These may have contributed to the
elevated nitrate-N and ammonia -N concentrations.

27
00.20.40.60.8
11.21.4
Puyo
Balen
guian
Jaliob
ong
Magtiac
o
Magpa
yang
Agon
g-ong
on
Tigba
wan
Mainit
Mayag
Tagbuya
wan
Kalina
wan
Rivers
mg
N/L
Oct 2003 sampling Apr 2004 sampling
Figure. 11. NO3-N concentrations from the river tributaries of Lake Mainit and Kalinawan River during the October, 2003 and April, 2004, sampling.
Figure. 12. NH3-N concentrations from the river tributaries of Lake Mainit and Kalinawan River during the October, 2003 and April, 2004, sampling.
00.01
0.020.03
0.040.05
0.06
Puyo
Balen
guian
Jaliob
ong
Magtiaco
Magpa
yang
Agon
g-ong
on
Tigba
wan
Mainit
Mayag
Tagb
uyaw
an
Kalina
wan
River
mg
N/L
Oct 2003 sampling Apr 2004 sampling

28
Phosphorous in phosphate form has the largest commercial applications. It is present
in most types of fertilizers, synthetic detergents and tooth pastes. It is also present in almost
all volcanic and sedimentary rocks. The highest PO4-P concentration was observed in
Jaliobong (0.089 mgPL-1) followed by Mainit (0.088 mgPL-1) and Tigbawan River (0.087
mgPL-1) during the first sampling period while Tigbawan (0.069 mgL -1) followed by
Magpayang River (0.067 mgL-1) were observed to have the highest PO4-P concentration
levels during the second sampling (Fig. 13). The river tributaries that were observed to have
high PO4-P concentration are either surrounded by agricultural lands or those coming from
Lake Mahukdam that drains from Mt. Kapayahan and Malimono Range or both. Thus, no
specific pattern was observed in nutrient concentrations in these river tributaries.
Natural concentrations of NO3-N rarely exceed 10 mgNL -1 and are frequently less
than 1 mgNL-1. Oligotrophic lakes have NO3-N of up to 0.3 mgL-1 while eutrophic lakes
range from 0.5 mgNL-1 to 1.5 mgL-1 (Wetzel, 1983). The nitrate concentration levels (0.099 -
0.507 mgNL -1) observed in this study were lower than the nitrate levels (1.00 - 2.6 mgNL-1)
observed in Lake Duminagat of Mt. Malindang (Hansel, 2002). The PO4-P values in the
oligotrophic Mirror Lake is less than 5 gPO4-P per liter while the eutrophic Lake Erie has 30-
50 gPO4-P per liter (Likens, 1985). The nitrate-N and PO4-P concentrations in the lake and
river tributaries do not exceed the 1.00 mgNL-1 and 0.1 mgPL-1 maximum permissible
NO3-N and PO4-P concentrations for waters fit for fish growth and propagation set by the
US-EPA and DENR-DAO, 1990.
0
0.02
0.04
0.06
0.08
0.1
Puyo
Balen
guian
Jaliob
ong
Magtiac
o
Magpa
yang
Agon
g-ong
on
Tigba
wanMain
it
Mayag
Tagb
uyawa
n
Kalina
wan
River
mgP
/L
Oct 2003 sampling Apr 2004 sampling
Figure 13. PO4-P concentrations from the river tributaries of Lake Mainit and Kalinawan River during the October, 2003 and April, 2004, sampling.

29
Heavy Metals
The considerable interest and apprehension about the role and fate of toxic metals in
aquatic environments are the result of several catastrophic events that have happened in the
country and elsewhere (e.g., Marinduque mines in the country; mercury poisoning in Japan).
The heavy metals considered in the study included lead (Pb), and cadmium (Cd).
Lead appears to be uniquitous in aquatic ecosystems and generally does not
bioaccumulate in aquatic organisms. Lead as a pollutant has assumed particular importance
due to its relatively high toxicity to humans, especially on the retardation of brain
development in children (Sadiq, 1992).
Lead was not detected in most parts of the lake, but a concentration of 0.04 ppm was
observed in the lake area near the municipality of Mainit (Table 3). The presence of Pb in the
area may be due to the active navigational activities in the municipality. Several boats were
observed to dock in this area, some are owned by the local fishermen of Mainit while others
are commercial boats that ferry passengers from the municipality of Mainit to Jabonga.
The amount of Pb detected from selected river tributaries of Lake Mainit ranged
between below detectable concentration to 0.04 mgL-1. Mayag River was observed to have
the highest Pb concentration.
Table 4. Heavy metal concentration in the water at different parts of Lake Mainit.
Geographical Location
9.4959 N 125 E
(Mainit)
9.4691 N 125 E
(Magpayang)
9.4406 N 125 E
(Alegria)
9.4136 N 125 E
(Jaliobong)
9.3843 N 125 E (Puyo)
EMB Caraga data
Cd,mgL-1 0.002 0.004 0.001 0.001 0.001 nd-.023
Pb,mgL-1 0.04 bdc bdc 0.01 0.03 nd-0.097
Hg, µgL-1 bdc bdc bdc bdc bdc bdc Legend : bdc - below detection concentration nd-not detected
The highest observed Pb concentration in water from the various river tributaries
(Table 3) is lower than the reported 0.2 mgL-1 Pb that can cause adverse effects in aquatic
biota (Wong et al., 1978) and also lower than the maximum permissible Pb concentration of
0.05 mgL-1 for water that is fit for fish growth and propagation (DENR-DAO, 1990).
Similarly, the concentration of Pb in the lake is far below the maximum permissible
concentration.
30
Anthropogenic or man-induced activities are responsible for most of the Pb pollution
(Sadiq, 1992). Several numbers of motorized boats were observed either navigating or
docking in the lake area. Thus, its presence in Lake Mainit is probably attributed by
continuous use of leaded gasoline in combustion engines. Also, the elevated lead
concentration levels in the atmosphere may consequently find its way into the lake.
Cadmium is reportedly present in pesticides and fertilizers, e.g., common super-
phosphate fertilizers contain 50-170 ppm Cd (Sadiq, 1992). Fertilizers and pesticides may be
important sources of Cd pollution since they are intentionally introduced in the natural
environment in fairly high amounts.
Cadmium was also detected in the water samples collected from several points in the
lake (Table 4). It ranges from 0.001 to 0.004 ppm. Cd must have been brought to the lake via
river tributaries.
Lake Mainit is surrounded by rice fields with intensive farming activities. Among the
twelve river tributaries, Tapian River (0.016 ppm) was observed to have the highest Cd
concentration followed by Roxas River (0.013 mgL-1), and Tagbuyawan River (0.013 mgL-1).
The stations observed to contain high cadmium concentration levels were also reported to
have high nutrient concentrations, which may suggest that agriculture related activities might
have contributed to high Cd concentration. Ocular observations also suggest that majority of
the total land use surrounding the lake is agricultural in nature.
Mercury (Hg) was purposely analyzed from the water and sediment samples because
gold mining activities were previously reported to be happening in the upstream areas of river
tributaries emptying into the lake. However, Hg was not detected in the water samples and a
minute level of 208 ppb was detected in the sediment samples collected in Magpayang River
and 139 ppb from Agong-ongan River. These Hg concentration values are very much lower
than the 1000-ppb total Hg load for polluted sediments (Sadiq, 1992).
The heavy metal concentrations (Cd, Pb and Hg) obtained in the monthly monitoring
of the Environment Management Bureau-DENR, Caraga Region, were approximately similar
to the values obtained in this study. However, they cannot be compared from site to site since
the exact locations of their sampling sites were not available (Table s 4 and 5).

31
Table 5. Comparison of the concentrations of some physico-chemical parameters obtained by the EMB-DENR Cagara Region.
Parameters EMB-DENR Caraga Regiona Present Studyb DENR
Standard
NO3-N, mgN L-1 no data available 0.099-0.507 1.0 PO4-P, mgP L-1 no data available nd-0.2 0.10
Pb, ppm nd-0.097 nd-0.04 0.05 Cd, ppm nd-0.023 0.001-0.016 0.01 Hg, ppb No data nd 2.0ppb
TDS,mgL-1 96-99 63.3-138.5 96-100 Fecal
coliformMPN/100ml
2.0-240
<2 - ≥1600
nil a EMB monitoring as of March 2003 to Oct 2003 nd – not detected/below detectable concentration b Samples collected last October 2003
Sediment is the ultimate sink of all foreign substances in the aquatic environment
(Sadiq, 1992). A higher frequency of detection and generally higher concentrations of trace
metals were observed in sediments than those in the water of the 11 river tributaries.
Sediment samples from Anahaw River and Tagbuyawan River were observed to have the
highest Pb and Cd concentrations, respectively (Table 3). The ranges of Pb (below detectable
concentration (bdc) to 1.45 ppm and Cd (0.06 to 0.26 ppm) concentrations were both lower
than the 5-ppm Pb and 1 ppm Cd for sediments categorized as polluted areas (Sadiq, 1992).
However, permanent deposition and accumulation of these substances may lead to long term
problems affecting benthic organisms.
Pesticides
Sediment samples that were collected from some river tributaries of Lake Mainit for
pesticide determination were brought to the MSU-IIT Chemistry Laboratory in Iligan City for
analyses. Standards for these types of pesticides are required in the analyses. Since
organochlorine standards were the only ones available in the chemistry laboratory, the
analyses were thus limited to organochlorine pesticides. If there were organophosphate
pesticides present in the samples, these were not detected due to this limitation.
The analyses of the sediment samples showed that among the 17 types of pesticides
only β-BHC, heptachlor and heptachlor epoxidenone were present (Table 6). It is surprising
why these types of pesticides were detected in the analyses since these are already banned in
the market. The detection of β-BHC, heptachlor and heptachlor epoxidenone in the sediments
may indicate the continuous use of these pesticides despite the ban. It is also possible that the

32
farmers may not be using these pesticides at present but have used them in the previous years
and their residues have settled in the sediments without being degraded.
Table 6. Pesticides levels µgL-1 in selected river tributaries of Lake Mainit.
OCP Kitcharao Magpayang Mayag Mamkas Jaliobong Mainit Magtiaco
α- BHC bdc bdc bdc bdc bdc bdc bdc
β- BHC 2.93 3.61 bdc bdc 2.55 2.54 3.46
γ- BHC bdc bdc bdc bdc bdc bdc bdc
Heptachlor 8.09 7.07 6.30 7.58 6.33 7.91 9.27
δ- BHC bdc bdc bdc bdc bdc bdc bdc
Aldrin bdc bdc bdc bdc bdc bdc bdc
Heptachlor epoxide 3.98 bdc bdc bdc bdc bdc bdc
Endosulfan I bdc bdc bdc bdc bdc bdc bdc
4,4’- DDE bdc bdc bdc bdc bdc bdc bdc
Dieldrin bdc bdc bdc bdc bdc bdc bdc
Endrin bdc bdc bdc bdc bdc bdc bdc
4,4’- DDD bdc bdc bdc bdc bdc bdc bdc
Endosulfan II bdc bdc bdc bdc bdc bdc bdc
4,4’- DDT bdc bdc bdc bdc bdc bdc bdc
Endrin aldehyde bdc bdc bdc bdc bdc bdc bdc
Endosulfan sulfate bdc bdc bdc bdc bdc bdc bdc
Methoxychlor bdc bdc bdc bdc bdc bdc bdc
Date of sampling: October 2003 bdc – below detectable concentration
The negligible pesticide levels in other river stations may be due to the limited
frequency of sampling. Whether or not there were discharges from other possible sources
during the sampling were not noted but their detection could have been influenced by the
occasional drainage from agricultural lands. It is also possible that certain pesticides present
in these rivers were not among those included in the analysis.
The absence of pesticides from the sediment samples may also be attributed to the
people’s awareness of the effects of pesticides to the aquatic environment. Observing better
management practices such as using alternative pesticides that could easily be degraded into
harmless substances could be possible reason for the absence of these pesticides.
In the absence of the data on the types of pesticides used by the farmers and the
limited pesticide standards as well as the limited frequency of sampling, a conclusion on
whether the detected pesticides are the only pesticides present in area can not be drawn. β-

33
BHC, heptachlor and heptachlor epoxidenone were detected in some areas, however, their
concentrations are low to cause adverse effects to the aquatic biota.
Total dissolved solids
Total dissolved solids (TDS) are the total amount of ions present in the water. Both
the concentration of TDS and the relative amounts or ratios of different ions influence the
species of organisms that can best survive in the lake. The total dissolved solids in the
various rivers surrounding the lake range between 67.33 mg L-1 to 138.5 mg L-1 in Kalinawan
and Tagbuyawan River, respectively (Fig. 14). The highest and lowest TDS values obtained
in this study are relatively higher and lower, respectively, than the TDS concentrations
reported by DENR-EMB Caraga Region (96-100 mgL-1). The sites where the samples were
collected may not be the same which may explain the differences in readings that were
obtained.
020
40
60
80
100
120140
160
Jalio
bong
Baleng
uian
Puyo
Kitsa
rao
Magtia
ko
Roxas
Mabini
Mainit
Tagbu
yawan
Magpay
ang
Mayag
Kalina
wan
Rivers
mg/
L
Magtiac
o
Kitch
arao
Figure 14. Total dissolved solids from the river tributaries of Lake Mainit and Kalinawan River during the April, 2004, sampling.
Sedimentation
Sedimentation study in Lake Mainit was conducted in October and November, 2003
in order to obtain a rapid overview of deposition occurring in the lake and sediment supply of
tributaries. This was implemented by determining the sedimentation rates in situ and
measuring the suspended solids and the discharge rates of rivers. Water turbidity was also
included as a parameter related to sedimentation.

34
The lake is supplied by streams and run-offs of 28 rivers and creeks from the eight
municipalities of Surigao del Norte and Agusan del Norte (Environmental Management Plan,
April, 1999). Out of these 28 tributaries, only fourteen have streams of water flowing during
the observation and sampling period as shown in Fig. 14 and Table 7. Those with higher
water discharge rates are Mayag, Puyo, Baleguian and Magpayang River. Others with
smaller drainages have intermediate stream flow while a few can be classified as brooks.
Volume estimates based on one time sampling showed that the total water input from the 14
tributaries is approximately 1.8 million m3.d-1 while the water output through Kalinawan
River is almost 2 million m3.d-1. The disparity in volume between input and output can be
attributed to other sources which were not accounted such as precipitation, coastal runoffs
and probably domestic wastewater.
Sediment supply
Rivers are responsible for most of the terrestrial inputs of materials entering the lakes
including silt and clay. They affect the clarity of the water and interfere with the natural
processes of a lake ecosystem. These particles are commonly referred to as total suspended
solids (TSS) and include colloidal and fine dispersions which are always present in natural
waters. They also include particles of coarse sizes which are common during flood
conditions. In Lake Mainit wastes coming from domestic activities of populated areas and
other similar operations may contribute to and augment the quantity of suspended solids.
However, no investigation has been done to support it. Despite this, most rivers in Lake
Mainit generally discharge clear water having suspended solid levels ranging from 1 to 38
mgL-1 (Table 7). DENR classifies them as Class AA (1 - 25 mgL-1) and A (not more than 50
mgL-1). Only Mayag River showed high solid content (74 mgL -1) because of the inf luence of
flood which has brought in large amount of silt materials.
35
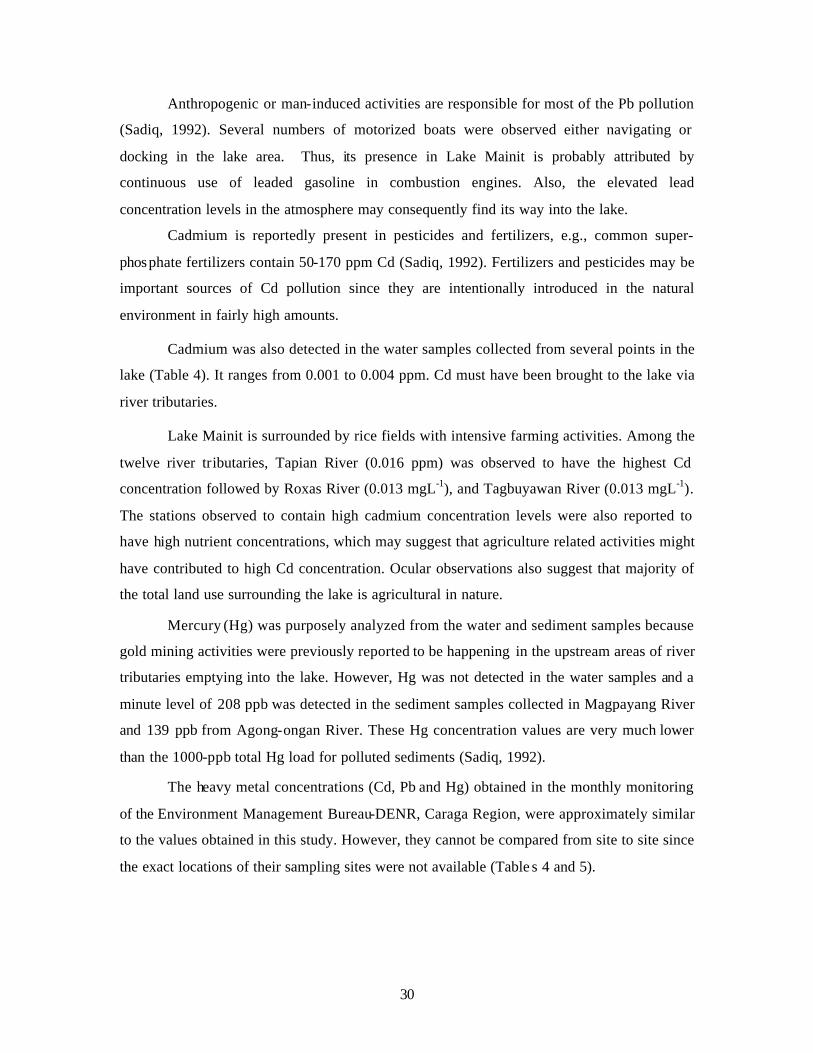
Table 7. Discharge rates and levels suspended solids of river tributaries in Lake Mainit including Kalinawan River
Name of River Volume (m3.day-1) Suspended solids (mgL-1)
New Camalig River 4,268 5 Alimpatayan River 7,677 10 Tugbongan River 7,925 27 Tigbawan River 7,983 2 Mainit River 13,608 7 Mamkas River 17,280 1 Agong-ongan River 17,574 25 San Isidro River 18,386 3 Jaliobong River 38,561 4 Magtiaco River 58,294 4 Magpayang River 138,931 7 Baleguian River 175,694 38 Puyo River 221,184 9 Mayag River 1,052,352 74
Total 1,779,717
Kalinawan River 1,969,229 2
The sediment contribution of river tributaries based on the discharge rates and
concentration of sus pended sediments is shown in Fig. 16. Mayag River which was heavily
flooded supplied a substantial quantity of silt (77.874 tons.d-1) or 87.66 % of the total load.
This is indicative of the high erosion rate occurring within the drainage areas and the
deterioration of land cover. Observation near the sampling site showed that the Mayag River
bank near the mouth of the lake is without cover and is vulnerable to more erosion during
flood thus contributing to siltation. This could be also true to other river banks. Baleguian
River only provided 6.676 tons.d-1 while Puyo River with higher discharge rate but low
suspended solids only contributed lower amount of silt at 1.992 tons.d-1. Minor rivers and
brooks accounted for the remaining load of 2.294 tons d-1. The total sediment supply of the
14 tributaries is 88.835 tons.d-1 out of which only 3.938 tons.d-1 are flushed out through
Kalinawan River, the only outlet of the lake. Although discharging large volume of water,
Kalinawan River is low in suspended solids (2 mg.L-1) that characterizes its quiet and often
clear water thus leaving behind about 95.6% of the sediment supply being deposited in the
lake floor. Continuous supply of silt results to shallowing causing backflows often
experienced by coastal residents during heavy rains.

36

37
0102030405060708090
Puyo Others Baleguian Mayag Kalinawan
Name of River
Ton
s/da
y
Figure 16. Sediment supply of rivers in Lake Mainit including Kalinawan River.
Sedimentation rate
Sedimentation rate refers to the settling down of suspended materials brought by run-
offs from rivers and coastline for a certain period of time. Measurements in seven lakeshore
areas (Fig. 17) showed high deposition particularly in the eastern portion such as those in
Kitcharao (134.5 mg.cm-2.d-1), Magtiaco (86.96 mg.cm-2.d-1), Jaliobong (73.82 mg.cm-2.d-1)
and significantly lower in Puyo (26.82 mg.cm-2.d-1). Consequently, a large part of this side of
the lake has a sandy muddy substrate which shows murky water when turbulent waves
resuspend its benthic deposits. Likewise, the heavy deposition observed in Mayag River
(909.46 mg.cm-2.d-1) during flood condition has an apparent influence on the sandy-muddy
substrate in its vicinity at the northern portion. On the other hand, very low deposition was
observed in Tagbuyawan (4.01 mg.cm-2.d-1) and Bunga (1.38 mg. Cm-2.d-1), two sites of the
lake that seldom receive heavy amount of suspended solids having a narrow watershed area
along the Malimono Ridge. The deeper bottom profile, low deposition and the characteristic
rocky substrate make this western portion of the lake provide a generally clear water. Lake
Mainit has higher sedimentation rates than the marine environment because the latter has
higher water density and allows more movement to transport suspended materials elsewhere
by tides and currents. Such processes are lacking in lakes allowing particles to settle faster.

38
0100200300400500600700800900
1000
others Puyo Jaliobong Magtiaco Kitcharao Mayag
Sampling sites
mg/
cm2/
day
Figure 17. Sedimentation rates from various lakeshore areas of Lake Mainit.
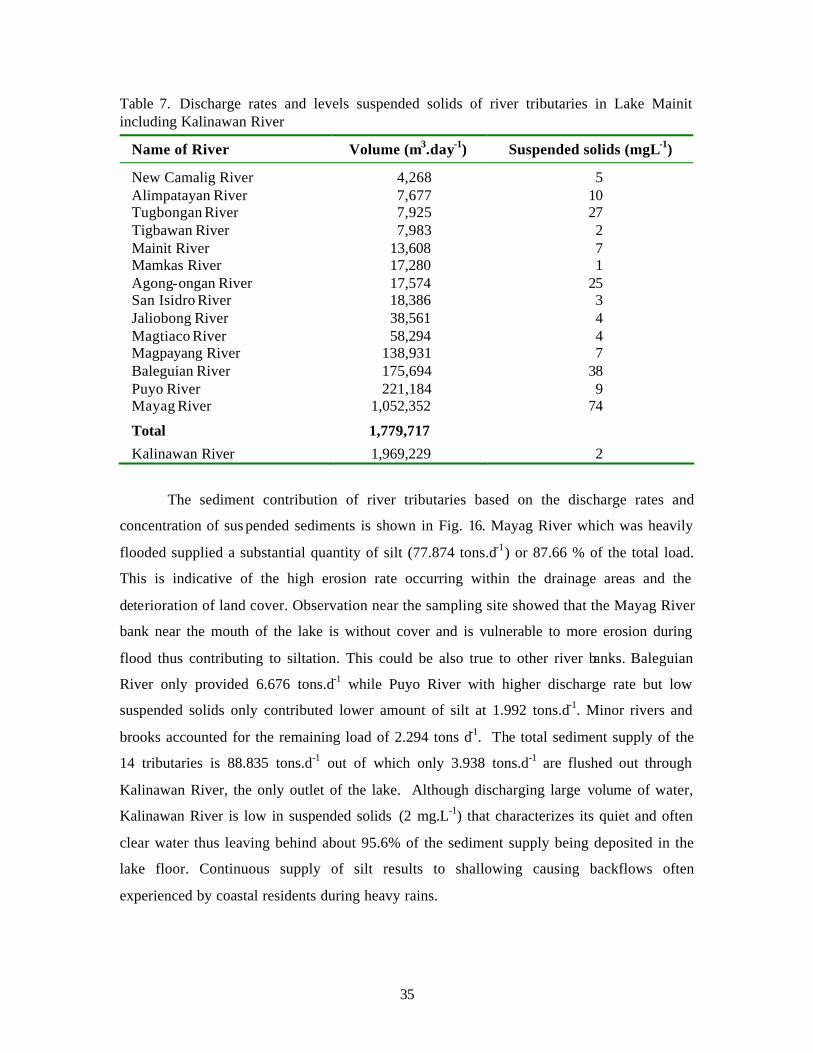
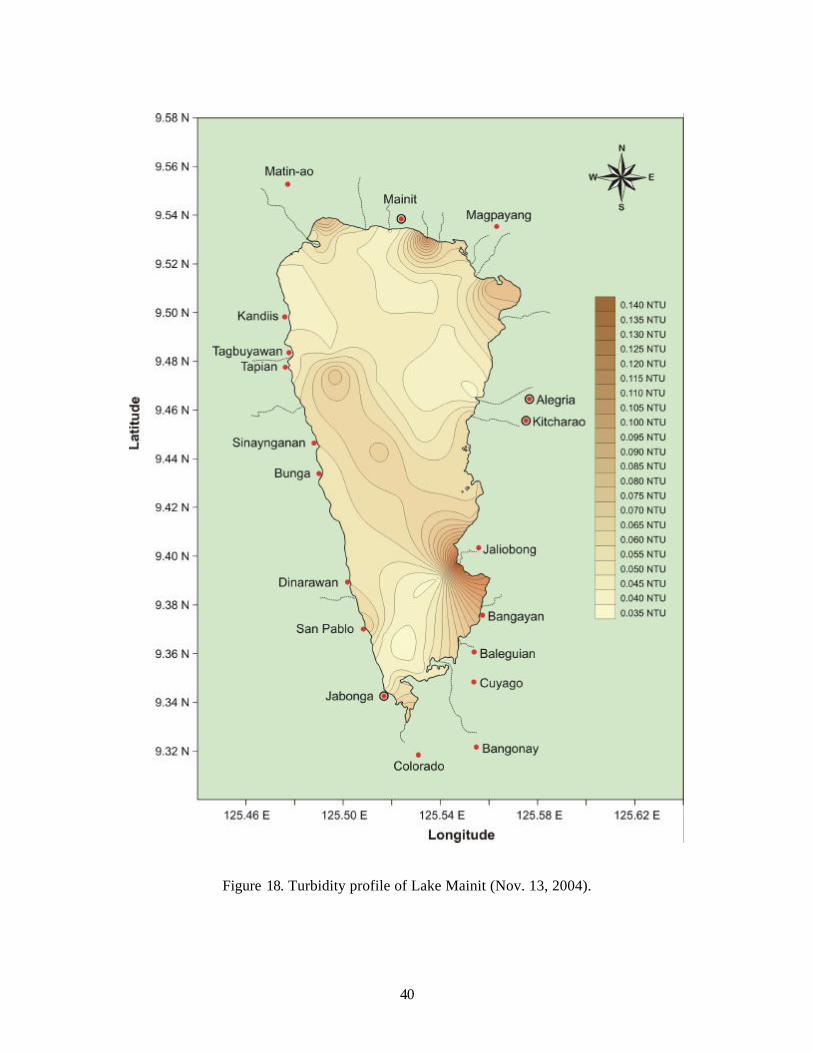
Turbidity
Turbidity measurements were made as an estimate of total suspended solids (TSS) to
describe the entire lake body including the open water zone. Analytical method for TSS is not
sensitive to low concentration particularly in the middle area of the lake. As a parameter it
does not only measure particulates due to silt and clay but also organic materials due to
wastewater discharges and phytoplankton. When present in high concentrations, these
suspended particulates interfere with light penetration in the water column. Aquatic
organisms, particularly fish, are generally affected by high levels of turbidity caused by
sediments and manifesting a wide range of responses such as stress to more deleterious ones
depending upon the time of exposure.
Turbidity readings obtained in a clear day ranged from 0.35 to 1.45 nephelometric
turbidity units (NTU) indicating that water in Lake Mainit is very clear meeting turbidity
standards that would qualify it as source of water supply for drinking and domestic use. The
general turbidity profile of the lake in Figure 18 shows the effect of suspended particulate
matter from each river tributary as it forms a decreasing concentration gradient towards the
middle portion of the lake. The more prominent one is the TSS discharge from Jaliobong
River which contained higher concentration of suspended solids at the river mouth and
dispersing toward the Tapian portion of the lake. This observation coincides with the mass
transport caused by the prevailing Northeast monsoon winds during time of sampling.

39
Because of time limitation no measurements were made during the time when there was
water disturbance due to strong winds.
Impacts of sedimentation Sediments are a major pollutant of lakes and have always had adverse effects on
aquatic organisms and the lake environment. Continuous heavy flow of silts from rivers and
lakeshores eventually form deposits on the lake floor. On a large scale basis, the build up of
sediments may result in the formation of delta that will gradually change the bottom feature
of the lake basin. Slackening of the outflow of water from the lake during heavy precipitation
is one of the disastrous consequences of sedimentation and as it may cause flooding of the
lakeshore villages.
The effect of sedimentation on water quality is exhibited in the reduction of the level
of dissolved oxygen, the most fundamental life-sustaining parameter of lake waters. Murky
water reduces light penetration in the water column curtailing photosynthetic process and
making it difficult for light to reach organisms at the deeper layers. It also interferes in the
interaction between air and water at the interface, a natural process involved in the formation
of dissolved oxygen. Mud accumulation always leads to anoxic and unstable conditions unfit
for many aquatic organisms.
Silt materials are also harmful to aquatic plants and animal dwellers. Fine particulate
materials easily suffocate newly-hatched larvae and clog or damage the gill structures of
fishes, decrease their resistance to diseases, prevent proper egg and larval development and
interfere with particle feeding activities. In plants silt particles prevent natural processes to
take place by filling and covering their pores and preventing the uptake of nutrients and
necessary gases. The effect of reduced light penetration would in turn impact on organisms
dependent upon them for food and cover. Loss of standing vegetative structure generally
makes lake less productive of invertebrates.
40
Figure 18. Turbidity profile of Lake Mainit (Nov. 13, 2004).

41
Bacteriological Analyses
Bacteriological analyses of water samples from twelve sampling sites in Lake Mainit
vary with sites, particularly for heterotrophic plate counts (bacterial density), total coliforms,
and fecal coliforms (Table 8 & Fig. 19). The values for bacterial density range from <30 up
to 41,333 cfu.mL -1. For total and fecal coliforms the differences in values from the highest to
the lowest are not as wide and range from <2- =1600MPN.mL-100.
The sites with highest total bacterial densities of 41,333 cfu.mL -1 and 14,329 cfu.mL -1
have been observed in Mainit and Jaliobong, respectively. Bacterial densities are values
representing the entire bacterial flora of the aquatic environment and consisting of various
groups and species coming from different sources.
Total coliform count is also highest in the town of Mainit (=1600MPN.mL -100). A
very close value for total coliforms has been noted in San Roque (1600MPN.mL-100). For
fecal coliforms, the same pattern has been observed in Mainit and San Roque ranking them
highly (=1600 MPN.mL -100, 1600 MPN.mL-100, respectively) among the sampling areas.
Mainit and San Roque are coastal places that are visibly populated. Runoff waters from these
places could have contributed as sources of bacterial contamination of the lake.
The remaining areas have far lesser densities for total bacteria, total coliforms and
fecal coliforms. The lowest bacterial densities (<30 cfu.mL -1), total coliforms (2 & <2
MPN.mL -100), and fecal coliforms (<2 MPN.mL -100) have been observed in samples collected
from the surface and in mid-water at the central part of the lake. These findings are not
surprising considering that the sampling site is located offshore and quite far from potential
sources of recontamination.
By DENR standards the quality of water in the middle of the lake and the coastal
water of Magpayang are relatively good. As such, the water requires only approved
disinfection protocols to meet the national standards for drinking water. In contrast, the
coastal waters in Mainit, San Roque, and Bunga are comparably of lower quality. This
means that its beneficial use would be limited for bathing, swimming and skin diving. In
Jaliobong, San Pablo, Bangayan, Jabonga, the lake water requires complete treatment
(coagulation, sedimentation, filtration and disinfection) in order to meet the national
standards for drinking water.

42
Table 8. Total bacterial density, total coliforms, fecal coliforms (Escherichia coli) and water classification of some areas of Lake Mainit, Surigao del Norte.
Sampling site
Bacterial density (cfu.mL-1)
Total Coliforms (MPN.mL-100)
Fecal Coliforms (MPN.mL-100)
Tentative Classification of water based
on Fecal Coliforms
Mainit 41,333 =1600 =1600 Class B Jaliobong 14,329 130 79 Class A San Pablo 5,833 24 24 Class A San Roque 503 1600 1600 Class B Bangayan 498 79 79 Class A Magpayang 388 27 17 Class AA Bunga 106 350 350 Class B San Pablo (near poultry)
52 49 49 Class A
Jabonga (fishing Village)
50 49 22 Class A
Jabonga beach 32 33 33 Class A Middle portion of lake (surface)
<30
2
<2
Class AA
(middle) <30 <2 <2 Class AA Legend: Class AA Class A Class B Class C Class D Total Coliforms(MPN. mL-100) 50(m) 1,000(m) 1,000(m) 5,000(m) - Fecal Coliforms(MPN.mL-100) 20(m) 100(m) 200(m) - - Coliform bacteria - are rod-shaped bacteria found in soil and the intestinal tract of warm blooded animals including humans Fecal Coliforms(Escherichia coli) – are bacteria entirely of fecal origin and are used as indicator organisms of fecal pollution. MPN – Most Probable Number (a statistical estimate of the concentration of the total and fecal coliforms that are present in the water sample. M - refers to the geometric mean of the MPN of coliform organisms during a 3-month period and that the limit indicated shall not be exceeded in 20 percent of the samples taken during the same period. - means the standards of these are not considered necessary for the present time, considering the stage of the country’s
development and DENR capabilities, equipment and resources Classification Beneficial Use
Class AA Public Water Supply Class I. This class is intended primarily for waters having watersheds which are uninhabited and otherwise protected and which require
only approved disinfection in order to meet the National Standards for Drinking Water (NSDW) of the Philippines.
Class A Public Water Supply Class II. For sources of water supply that will require complete treatment (coagulation, sedimentation, filtration and disinfection) in order to meet the NSDW.
Class B Recreational Water Class I. For primary contact recreation such as bathing, swimming, skin diving, etc. (particularly those designated for tourism purposes).
Class C 1) Fishery Water for the propagation and growth of fish and other aquatic resources; 2) Recreational Water Class II (Boatings, etc). 3) Industrial Water Supply Class I (For manufacturing processes after Treatment).
Class D 1) For agriculture, irrigation, livestock watering, etc. 2) Industrial Water Supply Class II (e.g. cooling, etc.); 3) Other inland waters, by their quality, belong to this classification.

43
Figure 19. Bacterial load profile of various sampling stations in Lake Mainit with their comparative beneficial uses.

44
Plankton
Plankton are minute components of aquatic plants and animals whose movement is
dependent on the strength and direction of the water current. Phytoplanktonic organisms
contribute largely to the primary productivity of the aquatic environment. As primary
producers in lake ecosystems, they play an important role of supporting the myriad of
zooplankton population and a host of fauna belonging to other trophic levels. The production
in terms of fish yield would depend on the rates of primary and secondary production carried
out by these planktonic organisms.
Phytoplankton
About 53 species of phytoplankton have been identified in Lake Mainit. They are
represented by the four groups, namely, the Bacillarophytes (diatoms), Chlorophytes (green
algae), Cyanophytes (cyanobacteria or blue-green alga) and the Pyrrophytes (dinoflagellates).
Lewis (1973) has identified 33 species belonging to the four phytoplankton groups although
some species were different from what were identified in the present study. Although the four
groups were represented in the samples only the chlorophytes and the diatoms dominated the
phytoplankton population of the lake. The two groups were represented by Oedogonium and
Staurastrum with relative abundance values of 68.89% and 20.65%, respectively. The mean
population count was 2,483 cells.L -1 with the lowest (1,399 cells.L-1) being observed in
Bunga and the highest in Mainit (4,751 cells.L-1) (Table 9).
The members of the Bacillarophytes are commonly referred to as the diatoms with a
large number of unicellular and colonial genera. The cell wall is highly silicified and
composed of two overlapping halves or frustules which fit together.
The important species of diatoms existing in the lake are the Nitzchia, Diatoma,
Fragillaria and Melosira. All of the genera belong to pinnate groups except Melosira, which
belongs to the centric group. This important diatom constitutes about 82% of the
phytoplankton population.
Chlorophytes were also observed in the samples. They obtained the highest
percentage of abundance (94.05%) of the phytoplankton population. They comprise the
major group of green algae that exhibit tolerance for a wide range of environmental
conditions. They include the unicellular, colonial, filamentous, membranous and tubular

45
forms which were very common in the collected samples. Among them were Apiocystis,
Bactrachospernum, Chlamidomonads, Chlorosarcina, and Golenkenia .
The cyanophytes were also commonly observed in the samples. These are called the
blue-green algae and are distinct from the other algae because they do not have true nucleus
and their chromatin material is not enclosed by a distinct nuclear envelope. The pigments are
not localized in definite chromatophores or in definite plastids. Species belonging to
Gomphosphaera, Anabaena, Anacystis and Lyngbia comprise the cyanophyte group and
constituted 4.28% of the total phytoplankton population.
The dinoflagellates were also observed in minimal numbers in the lake. They were
composed of the Gonyaulax, Glenodinium, Ceratium and Peridinium. These are flagellated
phytoplankters which have pigments localized in chromatophores and usually greenish tan to
golden brown in color. This group constituted 0.84% of the total phytoplankton population.
Chlorophyll a
Chlorophyll a readings range from 0.14 – 2.56 mg Chla.m-3 with the lowest reading
being obtained from Magtiaco and the highest from Puyo (Table 10). The average
chlorophyll a reading is 1.20 mg Chl a.m-3 from the littoral zone and 0.29 mg Chl a.m-3 from
the middle portion of the lake.
The chlorophyll a increasing readings were observed as the water column goes
deeper up to a depth of 15 m. These could be explained by the light penetrating to the water
column (Fig. 20).

46
Table 9. Phytoplankton densities and relative abundance.
Phytoplankton Cells/
sample Cells.L-1 Relative
Abundance
Bacillarophyta Asterionella 4 21.00 Coscinodiscus 1 0.03 Denticula elegans 166 8.29 Diatoma 11 0.54 Meridion 37 1.83 Navicula 2 0.10 Nitzschia 143 7.14 Surirella spp 16 0.79 0.82 Chlorophyta Apiocystis 1 0.03 Bactraspermum 1 0.06 Chlamydomonas 1 0.06 Chlorococcus lemniticus 26 1.30 Chlorosarcina consociata 1 0.03 Golenkenia radiata 971 48.50 Kirchneriella lunaris 133 6.63 Oocystis borgei 3 0.14 Oedogonium 41374 2069 Sphaerocystis 1172 58.60 Spirogyra 6 0.32 Volvox auseaus 11 0.539 94.05 Chryptophyceae Rhodomonas 3 0.14 0.65 Cyanophyceae Anabaena spp 315 15.78 Anabaenopsis 402 20.10 Anacystis 1 0.03 Aphanothece stagnina 4 0.19 Aphanocapsa gravilleli 491 24.50 Coelospherium kuitzingianu 1 0.06 Gomphosphaera 61 3.01 Lyngbia 3 0.16 Marssaniella elegans 17 0.86 Oocystis 112 5.29 Phormidium 5 0.26 Planktosphaera 574 28.50 Spirulina 4 0.22 4.28 Dinophyceae Ceratium sp 84 4.18 Gonyaulax 300 15.00 Glenodinium 5 0.27 Gymnodinium 1 0.056 0.84

47
Table 10. Chlorophyll a readings and plankton densities in Lake Mainit.
Station
Chlorophyll a (mgChl a m-3)
Phytoplankton (cells L-1)
Zooplankton (indiv.L-1)
Ichthyoplankton (indiv.haul-1)
1 Center 0.29 1610 23 0 2 Mabini 1.53 2325 127 13 3 Puyo 2.56 4019 578 3 4 Magpayang 0.55 1416 54 3 5 Mainit 1.71 3751 768 5 6 Jabonga 1.66 3527 110 4 7 Bangunay 1.54 1937 67 8 8 Roxas 1.31 3566 122 2 9 Mansayao 1.56 1648 232 5 10 San Isidro 0.61 1659 162 2 11 Bunga 0.50 1399 75 4 12 Tapian 0.60 1539 219 15 13 San Pablo 1.53 2683 226 17 14 Anahao 1.29 2202 111 10 15 Tagbuyawan 1.64 1788 92 1 16 Mayag 1.55 2125 198 1 17 Magtiaco 1.4 4230 92 1 18 Jaliobong 1.13 1692 186 1 19 San Roque 1.16 3983 221 6 20 Pakuyab 1.55 1542 22 1
Zooplankton
Four groups of zooplankton dominated Lake Mainit, namely: copepods, rotifers,
cladocerans, tintinnids, ostracods and insect (Table 12). The average population density is
184 indiv.L-1 with the highest population (578 indiv.L -1) being observed in Puyo and the
lowest was observed in Pakuyab (22 indiv.L-1). The mean population density was 184 indiv.
L-1 which categorized the la ke as oligotrophic. Up to 500 individuals per liter may be found
in eutrophic lakes (Goldman and Horne, 1983 as cited by Hansel et al. , 2002)
The eggs, nauplii and the adult stages comprised the population of the copepod group
while Brachionus spp, Keratella and Proales comprise the rotifers. The cladocerans were
represented by the Diaphanosoma sp.
The abundance of zooplankton in the lake does not mean that they are grazing solely
on phytoplankton. Bacteria apparently represent a large portion of the diet of some
zooplankton species (Hwang et al., 2003). Bacterivory in rotifers is the significant channel
through which these species become abundant. It was observed that copepods outnumbered
the cladoceran population which may be an index of an unproductive community.

48
Almost all of the identified plankton groups and species were also found in the 1975
survey of Lewis but since the method used were not the same with what Lewis had used in
the assessment, the number expressed in the population density cannot be differentiated.
Figure 20. Chlorophyll a readings at different depths in Lake Mainit.
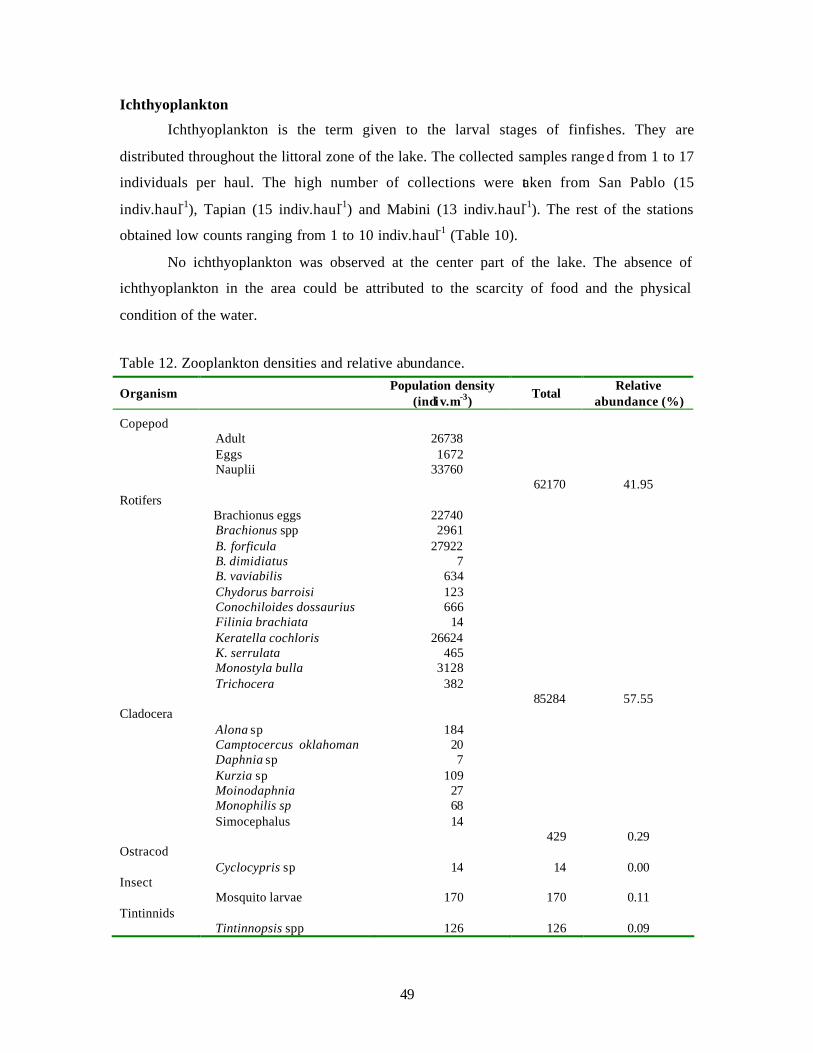
49
Ichthyoplankton
Ichthyoplankton is the term given to the larval stages of finfishes. They are
distributed throughout the littoral zone of the lake. The collected samples range d from 1 to 17
individuals per haul. The high number of collections were taken from San Pablo (15
indiv.haul-1), Tapian (15 indiv.haul-1) and Mabini (13 indiv.haul-1). The rest of the stations
obtained low counts ranging from 1 to 10 indiv.haul-1 (Table 10).
No ichthyoplankton was observed at the center part of the lake. The absence of
ichthyoplankton in the area could be attributed to the scarcity of food and the physical
condition of the water.
Table 12. Zooplankton densities and relative abundance.
Organism Population density
(indiv.m-3) Total
Relative abundance (%)
Copepod Adult 26738 Eggs 1672 Nauplii 33760 62170 41.95 Rotifers Brachionus eggs 22740 Brachionus spp 2961 B. forficula 27922 B. dimidiatus 7 B. vaviabilis 634 Chydorus barroisi 123 Conochiloides dossaurius 666 Filinia brachiata 14 Keratella cochloris 26624 K. serrulata 465 Monostyla bulla 3128 Trichocera 382 85284 57.55 Cladocera Alona sp 184 Camptocercus oklahoman 20 Daphnia sp 7 Kurzia sp 109 Moinodaphnia 27 Monophilis sp 68 Simocephalus 14 429 0.29 Ostracod Cyclocypris sp 14 14 0.00 Insect Mosquito larvae 170 170 0.11 Tintinnids Tintinnopsis spp 126 126 0.09
50
VI. Summary, Conclusion and Recommendations
The ecological integrity of the Lake Mainit ecosystem, as a productive reservoir, is
influenced by both its physical environment and water quality conditions. Lake Mainit is the
receptacle of heavy siltation coming from its catchment areas, from agricultural lands and
domestic activities which are carried down through its river tributaries. One of the main
concerns of lake management is the continuous and fast deposition of silt. This study may not
provide complete picture of sedimentation in the lake because it has not identified other
potential sediment sources due to the limited observation period. Many residents around the
lake are however aware that rivers in the lake watershed have high sediment loads that
indicate a disturbed ecosystem. Some management strategies that would reduce sediment
inputs are presented.
The uncontrolled introduction and accumulation of fine materials into the lake which
cannot drain outside is already a threat to the integrity of the lake. This should be an
immediate concern for policy makers as it can result to a situation where it would be very
difficult to manage. The prevention of floods that reach higher grounds and inundating the
lakeshore areas can be accomplished by dredging the areas where silt has accumulated. This
scheme would allow faster flow of water to its outlet. Avoiding further entry of silt into the
lake would require the cooperation of land users in the highlands and should inc lude soil
conservation to minimize soil erosion. Appropriate slope farming technologies are now
available that can be adopted by farmers to mitigate rapid soil erosion. Other measures which
can be employed to reduce siltation in Lake Mainit are the reduction of quarrying, mining,
illegal logging activities. Improvement of vegetative cover through reforestation in the
watershed areas and along the river banks, proper disposal of domestic wastes including its
treatment should be part of the lake management plan.
Future management effort should also include information drive to farmers regarding
the use of pesticides and fertilizers. The right amount and the timing of application and
draining must be stressed so that Cd and pesticide pollution in the lake will be prevented.
The study also indicated that biological pollution in Lake Mainit is not serious and
confined only within a small part of the water body. It should be emphasized, however, that
the bacteriological analysis of water conducted in the Lake is very limited in terms of
temporal and spatial coverage.

51
The results obtained by the DENR-EMB, Caraga Region, have already shown
exceedance of the maximum allowable Cd concentrations in some parts of the lake. This is
consistent to the results obtained in this study. It is therefore recommended that monitoring
should be done not only in water but also in the sediments, plants and aquatic organisms.
Lake Mainit has rich aquatic resource potentials that can be developed and bring
about economic benefits for the lakeshore residents. It has been the source of income for
many fishermen and food for many residents in the area but its utilization can be enhanced by
creating projects such as tourism and recreation activities and tapping it as a source of water
supply. The improvement of the lake productivity would include establishment of sanctuaries
where sedimentation should be an important consideration. Identification of appropriate
suitable places for such activities would require careful planning.
Information on the fishery resources are also necessary in coming up of a
management strategy to prevent depletion and exploitation of aquatic resources. In the
absence of these data fish stock assessment is also recommended.
The ecological condition of Lake Mainit needs to be monitored in the context of
maintaining its diverse fishery resources while exploiting their commercial uses. The limited
monitoring of the nutrient conditions of the lake during the two sampling periods indicates
that nutrient loading into Lake Mainit is sufficient to maintain its oligotrophic condition
while the corresponding chlorophyll a data indicate an optimum level of productivity.
Further, lake transparency, as measured by Secchi depth, is high and consistent with
chlorophyll a data. The positive correlation between Secchi depth and chlorophyll a would
likely reflect the low turbidity in most parts of the lake basin. An examination of the algal
population would however also indicate that the oligotrophic level of lake productivity is
supported by the amount of nutrient inflow into the lake.
Finally, a thorough water quality monitoring should be done to understand fully the
effects of sediment loading, possible pollutant and nutrient delivery through the tributaries to
the lake. This should include in depth studies on water clarity, water retention time, nutrients,
macro-invertebrates and other biological parameters, all of which may affect the biological
productivity and ecological health of Lake Mainit.
52
VII. Bibliography
Association of Official Analytical Chemists (AOAC). 1995. AOAC, 16th ed., Arlington, Virginia. Chapt. 9, pp. 21-22; Chapt. 11, pp. 17-18.
American Public Health Association (APHA). 1995. APHA, 19th ed., Washington, D.C.
Chapt. 3, pp. 3-18; Chapt. 4, pp. 75-112; Chapt. 9, pp. 31-38. Balayut, E. A. 1983. Stocking and introduction of fish in lakes and reservoirs in the ASEAN
countries. FAO Fish. Tech. Pap., (236):82 p. DENR-DAO, 1990. Revised Water Usage and Classification of Water Quality Criteria
Amending Section Nos. 68 & 69. Chapter III of the 1978 NPCC Rules & Regulations, Manila, Philippines. 15 pp.
Frey, D.G. 1974. A limnological reconnaissance of Lake Lanao. Mindanao Journal.
1(1):81-101. Frick, Elizabeth A., Gary R. Buell and Evelyn H. Hopkins. 1990. Nutrient sources and
analysis of nutrient water-quality data, Apalachicola-Chattahoochee-Flint River Basin, Georgia, Alabama, and Florida. U.S. Geological Survey Water-Resources Investigations Report 96-4101.
Gracia, D. M. 1981. Report on the hydrobiological survey and inventory of aquatic resources
of Lake Mainit, Mindanao Island. Terminal report. Hanzel, C. 2002. Participatory biodiversity inventory and assessment of Lake Duminagat,
Mt. Malindang natural park. Horne, A. J. and C. R. Goldman. 1994. Limnology. 2nd ed. McGraw-Hill. New York. 579 p. http://www.philvocs.dost.gov.ph/Earthquakes/1999BayuganEQ/bayugan99.html Lebo, Martin E. and William L. Tietjen, 2002. Water quality and trophic state of Lake
Blackshear. Lake Blackshear Watershed Association. P.O. Box 1218, Cordele, Georgia 31010.
Lewis, W. M., Jr. 1973. A limnological survey of Lake Mainit, Philippines. Int. Rev. Gesamt. Hydrobiol. 58(6): 801-18.
Likens, G.E., ed. 1985. An ecosystem approach to aquatic ecology: Mirror lake and its
environment. Springer-Verlag, New York. Lind, O. T. 1979. Handbook of common methods in limnology. 2nd ed. The C. V. Mosby
Co., London. 199 p. PMO-LMDA. 2004. Environmental Management Plan. Final Draft. Lake Mainit
Development Alliance.

53
Punongbayan, R.S. 2003. Origin of Philippine lakes. First National Congress on Philippine Lakes 25-28 Nov 2003, Tagaytay City, Philippines
Sadiq, Mohammad. 1992. Toxic Metal Chemistry in Marine Environments. Marcel Dekker,
Inc. New York. 10016 Strickland, J. D. H. and T. R. Parsons. 1972. Practical Handbook of Seawater Analysis.
Fisheries Research Board of Canada. Ottawa, Canada. Umali, R. C. and M. A. Cuvin. 1988. Limnology: Laboratory and field guide physico-
chemical factors, biological factors. Phil. Nat'l. Bookstore. 322 p. Weaver, Jan. 1997. MU Environmental Network News. October 1997. Vol. 3 No. 10. 220.
Gentry, MU. Columbia MO65211. Welch, P.S. 1948. Limnological methods. McGraw-Hill Book Co., New York. 381 pp. Wetzel, R.G. 1983. Limnology. 2nd ed. Saunders College Publishing, Philadelphia. Wong, P.T.S., Silverberg, B.A., Chau, Y.K., and Hodson, P.V. 1978. Lead and Aquatic
Biota. In Nriagu, J.O. (ed). The Biogeochemistry of Lead in the Environment. Elsevier/North Holland, Amsterdam. P 279.
VIII. Acknowledgement
This study is a Flagship Commodity Research Project of the PCAMRD Zone Center for Northern Mindanao (Zone IV) and made possible with funding assistance from PCAMRD, Lake Mainit Development Alliance (LMDA), NEDA Caraga Region, MSU-Naawan, the LGUs around Lake Mainit , Surigao del Norte College of Agriculture and Technology and Mainit National High School. Acknowledgement is also due to the Research Assistants of the various research components of the project whose help in the data collection and analyses made the conduct of the research bearable for the senior researchers. Special thanks to Mr. Rustan C. Eballe, Zonal Center Science Research Specialist, for facilitating all administrative work related to the Project and for his technical help in the electronic preparation of this Technical Terminal Report.