Embed Size (px)
Citation preview

Limitations and Uncertainty of Risk Assessment
(a.k.a. “All models are wrong, some are useful”)
Jay Davis - U.S. Fish & Wildlife ServiceECS 3119 – Pesticides and Fish & Wildlife ResourcesSkamania Lodge, Stevenson, WAJune 27-July1, 2011

Risk Assessment & Characterization
US EPA Watershed Ecological Risk Assessment Module
Ecological Risk Assessment
What is risk?The probability of an adverse effect to an ecological entity
What is ecological risk assessment?The determination of the probability that an adverse effect will result from a defined exposure (NRC 1993)
Variability refers to observed differencesattributable to true heterogeneity or diversity in a population or exposure parameter.
Examples of variability:- physiological variation- genetic differences- nutritional status- size- feeding rates- environmental conditions
Variability is usually not reducible by further measurement or study (but can be better characterized).

Uncertainty refers to a lack of information about specific factors, parameters, or models.
Uncertainty includes:- parameter uncertainty (measurement errors, sampling errors, systematic errors),- model uncertainty (uncertainty due to necessary simplification of real-world processes, miss-specification of the model structure, model misuse, use of inappropriate surrogates)- scenario uncertainty (descriptive errors, aggregation errors, errors in professional judgment, incomplete analysis)
Example of uncertainty:- concentration in the environment (“dose”)- duration of the “dose”

Ignorance
Ignorance refers to being destitute of knowledge or the lack of knowledge.
The Screening Level AssessmentAdvantages
“The principal advantages of the quotient method are that it is simple and quick to use and risk assessors and managers are familiar with its application. It provides an efficient, inexpensivemeans of identifying high- or low-risk situations that can allow risk management decisions to be made without the need for further information.”(U.S. EPA, 1998 Guidelines for Ecological Risk Assessment)

Current Method of Addressing Uncertainty in Ecological Risk
Assessments
• Many of the uncertainties associated with effects analysis are not addressed in a typical section 3 registration package– Formulated product, mixtures, and degradates
(all)
• EPA uses a screening process that utilizes upper bound estimates for exposure as well as uncertainty factors in the ERA process

History of Uncertainty Factors
• Originally established in 1945• Convenient to use in the absence of data• Have changed little over time• Designed to be used until data were
generated• Have become a crutch

Use of Uncertainty Factors/Levels of Concern in Risk Assessments
• Proposed UF for endangered/non-endangered species:– Species w/n genus: 10– Genus w/n family: 30– Families w/n order: 60– Orders w/n class: 100– Classes w/n phylum: 1000– T&E species: 20
Source: Calabrese and Baldwin, 1993. Performing Ecological Risk Assessments

UF Applied to Pesticide Risk Assessments
• Using currently recommended UF results in impractical applications for pesticide risk assessments with T/E species (bull trout)– Ex. Standard fish species (rainbow trout acute)
• Different genus w/n same family 30• Acute lethality to chronic NOAEL 100• T&E species 20 • Cumulative UF 60,000

Summary
• Risk assessment is ripe with both variability and associated uncertainty
• ERA must go beyond the use of uncertainty factors and generate the data necessary to achieve T/E species conservation, population level effects, etc.

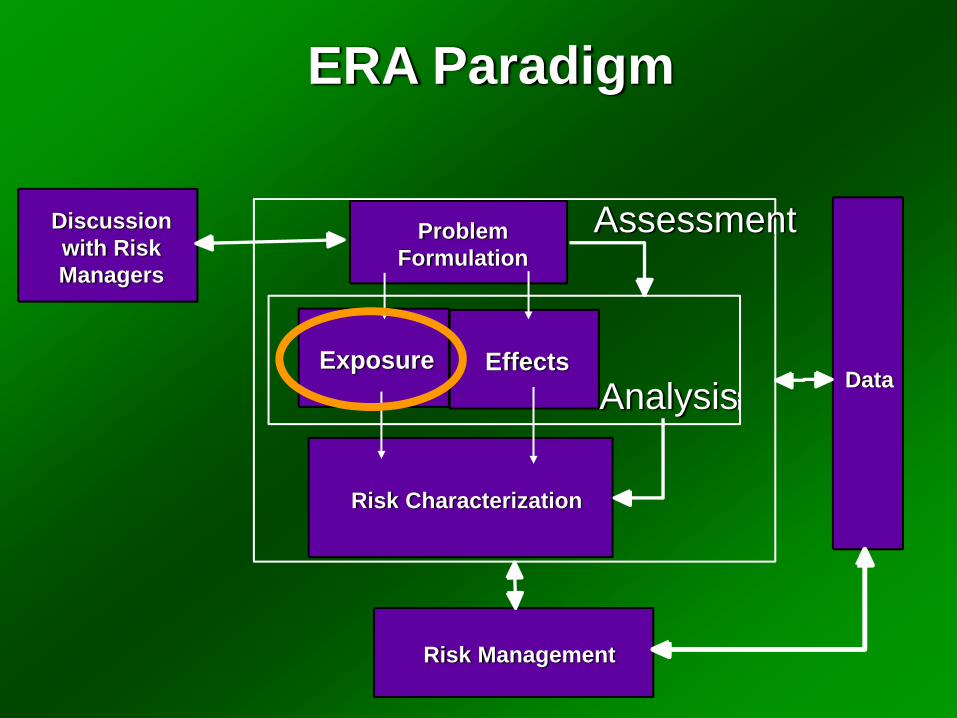
ERA Paradigm
Problem Formulation
Exposure Effects
Risk Characterization
Risk Management
Discussion with Risk Managers
Analysis Data
Assessment

Toxicity Data RequirementsTests required to evaluate effects on non-target (surrogate) organisms are arranged in hierarchical or tier system.
Mysid Shrimp
Mallard
Quail Eastern Oyster
Water Flea
Sheepshead Minnow
Fathead Minnow
Bluegill Sunfish
Rainbow Trout
Glass Shrimp
Scud
Rat
Honey bee
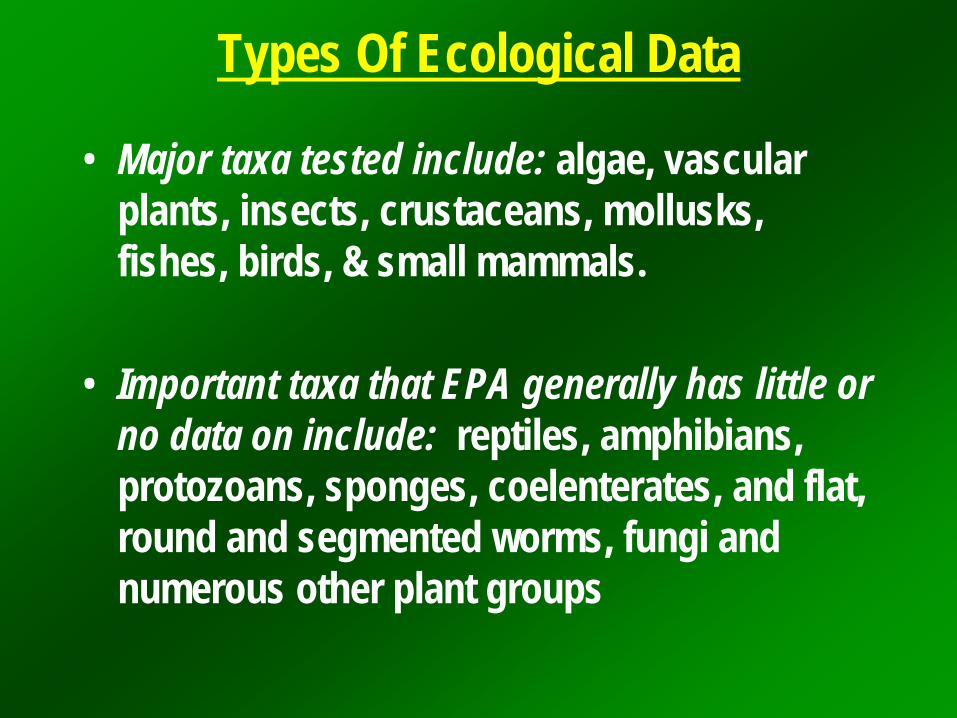
Types Of Ecological Data
• Major taxa tested include: algae, vascular plants, insects, crustaceans, mollusks, fishes, birds, & small mammals.
• Important taxa that EPA generally has little or no data on include: reptiles, amphibians, protozoans, sponges, coelenterates, and flat, round and segmented worms, fungi and numerous other plant groups

Number of Species TestedOf the more than 1.3 million animal species known in
the world, EPA generally has acute toxicity data on perhaps 15 species for new chemicals and perhaps 50 species for older chemicals. For herbicides, EPA may only have 15 tested species of plants.
This limited amount of data is used to predict toxicity levels (mortality generally) to a much larger number of potentially exposed species in a pesticide use site.

Some General Assumptions– 15 species of plants are used to indicate
sensitivity of entire plant kingdom– 3 or 4 species of invertebrates are used to
indicate sensitivity of 1 million species– 1 insect specie to represent over 80,000 – 2 – 3 species of fish represent 22,000 fish and
4000 species of amphibians– 2 species of bird represent 9000 species of
birds and 6500 species of reptiles
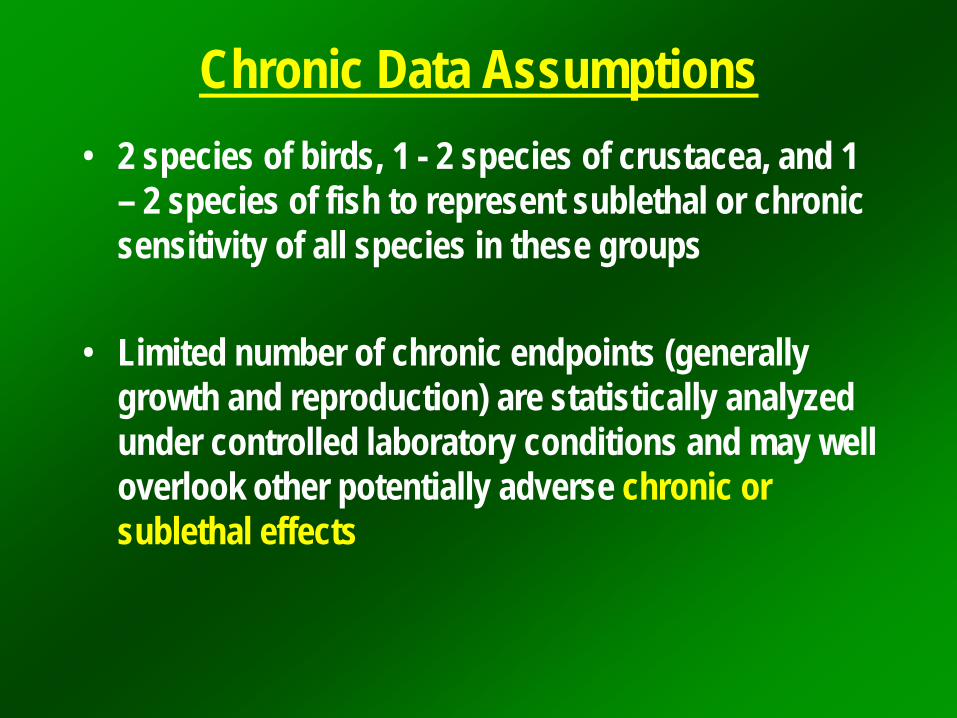
Chronic Data Assumptions• 2 species of birds, 1 - 2 species of crustacea, and 1
– 2 species of fish to represent sublethal or chronic sensitivity of all species in these groups
• Limited number of chronic endpoints (generally growth and reproduction) are statistically analyzed under controlled laboratory conditions and may well overlook other potentially adverse chronic or sublethal effects

Data-related Uncertainty• Interspecies extrapolations• Extrapolation to listed/other species• Simplification of food chain models• Life history information• Natural variability in ecosystems
ERA Paradigm
Problem Formulation
Exposure Effects
Risk Characterization
Risk Management
Discussion with Risk Managers
Analysis Data
Assessment

Application of Exposure Models– Mathematical representation that
corresponds to the understanding of the ecological system under review and the transport of pesticides to those systems
• various types of process models used to characterize risk

Application of Exposure Models cont…
– Caution with the use of these models • Assumption driven• Robustness of the input data • Validation of output • May suggest a higher degree of certainty than is fitting
• Remember…..All models are wrong; some are useful!!
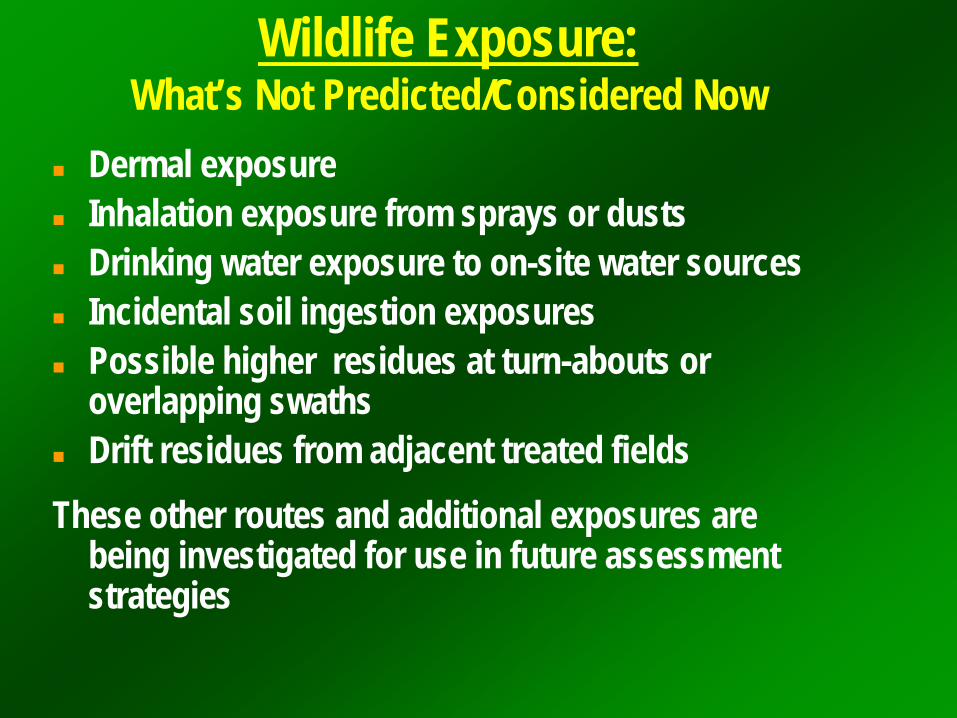
Wildlife Exposure:What’s Not Predicted/Considered Now
Dermal exposureInhalation exposure from sprays or dustsDrinking water exposure to on-site water sourcesIncidental soil ingestion exposuresPossible higher residues at turn-abouts or overlapping swaths Drift residues from adjacent treated fields
These other routes and additional exposures are being investigated for use in future assessment strategies
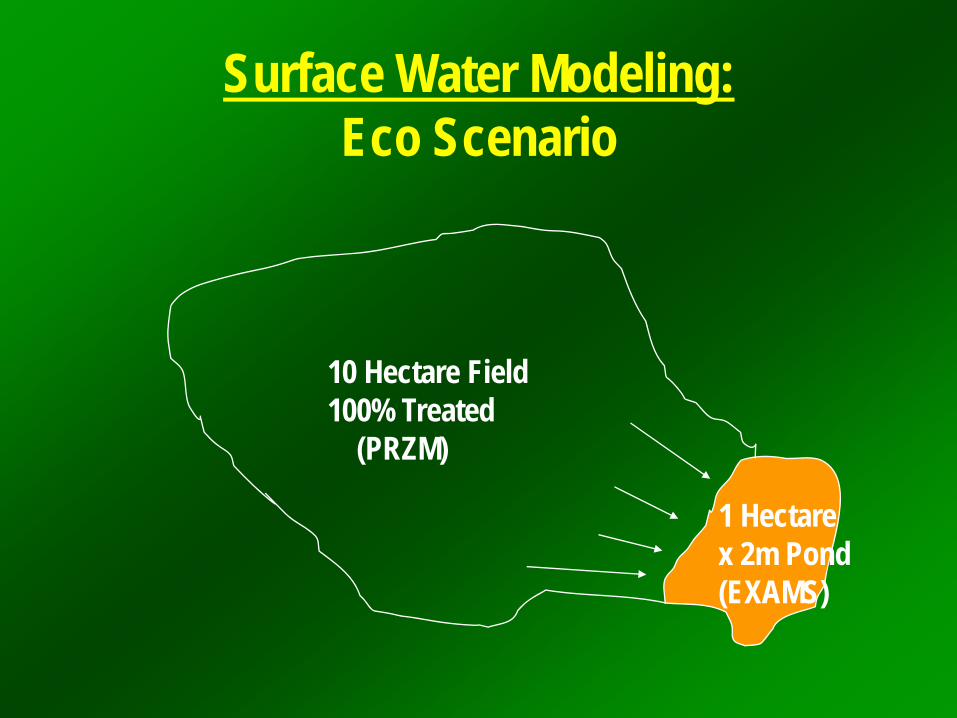
Surface Water Modeling:Eco Scenario
10 Hectare Field100% Treated
(PRZM)
1 Hectarex 2m Pond(EXAMS)
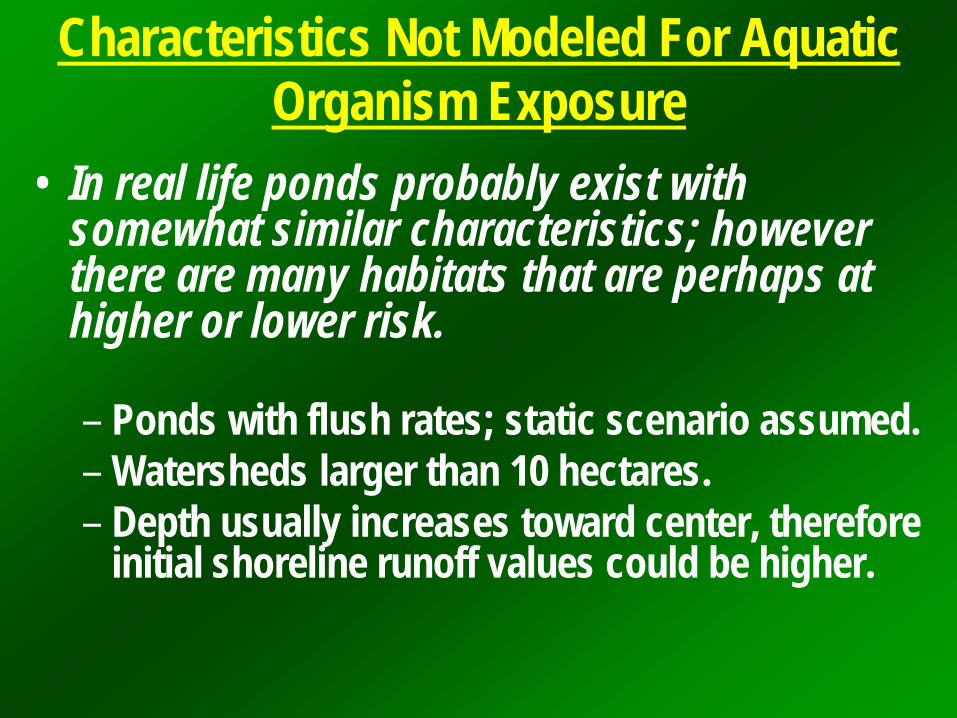
Characteristics Not Modeled For Aquatic Organism Exposure
• In real life ponds probably exist with somewhat similar characteristics; however there are many habitats that are perhaps at higher or lower risk.
– Ponds with flush rates; static scenario assumed.– Watersheds larger than 10 hectares.– Depth usually increases toward center, therefore
initial shoreline runoff values could be higher.
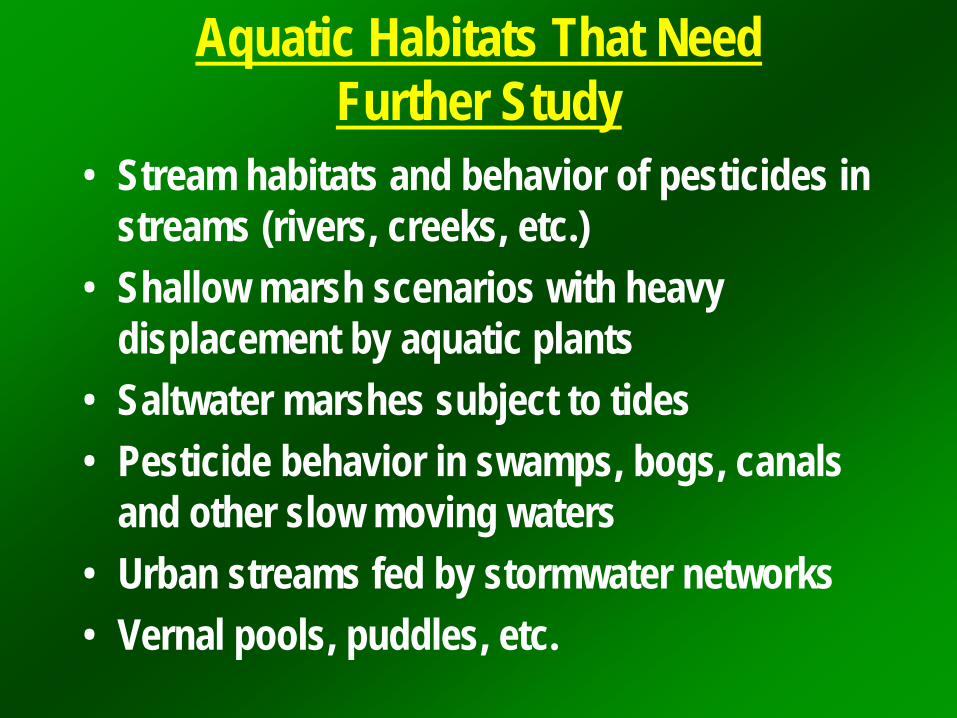
Aquatic Habitats That Need Further Study
• Stream habitats and behavior of pesticides in streams (rivers, creeks, etc.)
• Shallow marsh scenarios with heavy displacement by aquatic plants
• Saltwater marshes subject to tides• Pesticide behavior in swamps, bogs, canals
and other slow moving waters• Urban streams fed by stormwater networks• Vernal pools, puddles, etc.
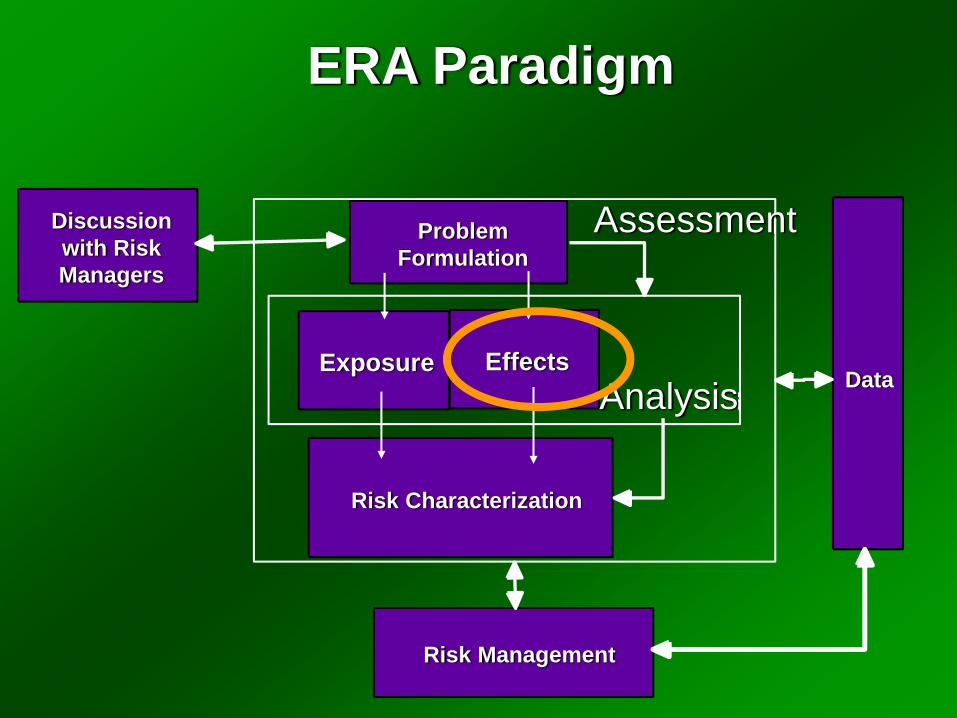
ERA Paradigm
Problem Formulation
Exposure Effects
Risk Characterization
Risk Management
Discussion with Risk Managers
Analysis Data
Assessment
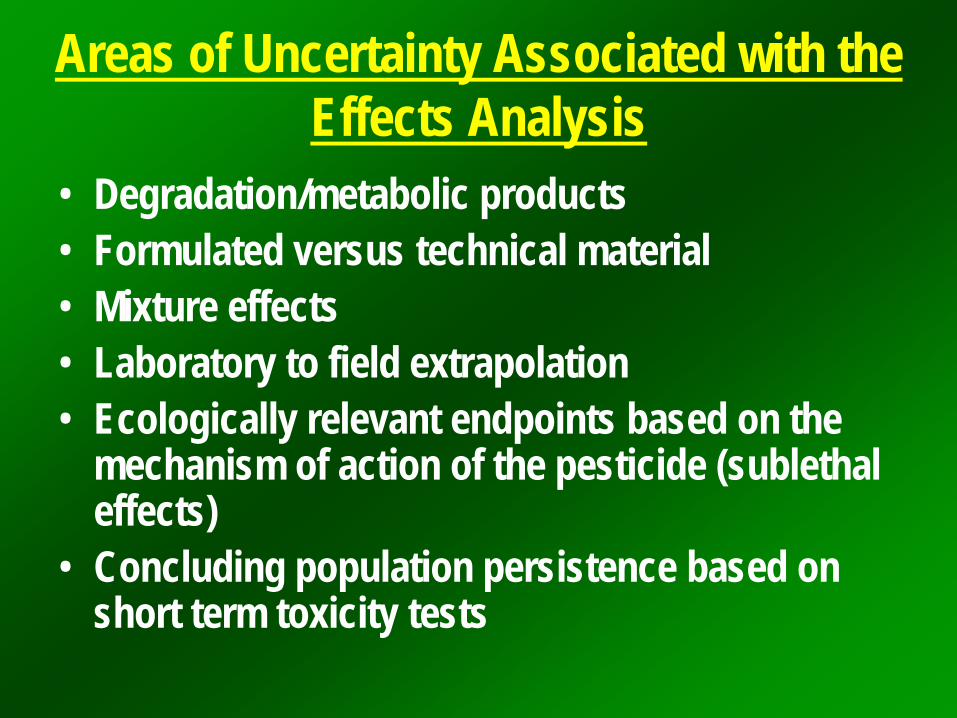
Areas of Uncertainty Associated with the Effects Analysis
• Degradation/metabolic products• Formulated versus technical material• Mixture effects• Laboratory to field extrapolation• Ecologically relevant endpoints based on the
mechanism of action of the pesticide (sublethal effects)
• Concluding population persistence based on short term toxicity tests

Various Legal Authority StandardsESA CWA FIFRA
-Preclude jeopardy-Minimize “take”-Conserve the species & their ecosystem
-Protection of 95% of the taxa…- Risk based approach
-No unreasonable adverse effects on the environment- Risk based
-Best Scientific & Commercial Data Available (benefit of the doubt to species)
-Promulgated standards and criteria
-Standard acute and chronic tox. tests & environmental fate data
-No destruction or adverse modification of critical habitat that affects the species
-No toxic chemicals in toxic amounts
-Prevent unreasonable effects on non/off-target species/sites

FIFRA Regulatory Decisions: Balancing Risks & Benefits

Major Sources of Scientific Uncertainty (Data Gaps)
Exposure/EffectsSurfactants, Adjuvants, Inerts and DyesMetabolites, Degradates & Mixtures
Additivity/Synergism/AntagonismVolatilesPulsesOther Exposure Pathways
Groundwater, Sediment, Dietary, etc.T/E Specific Toxicological Data
Surrogacy and Sub-lethal Endpoints

Uncertainty Example #1 Salmonid Issues in the
Pacific Northwest
• Sublethal Effects –LOC Evaluation

LOC Evaluation when using lethality data for sub-lethal effects
EndpointToxicity EEC Quotient Risk =
Assumptions:
EXPOSURETYPE
SPECIESRQ CRITERIA
VALUE
Acute
Acute
non-T/E
T/E
<0.1
<0.05*
Chronic non-T/E & T/E <1.0

LOC Evaluation• Diazinon LC50 for cutthroat trout = 1,700 μg/L• Toxicological thresholds for diazinon in salmonids
– 0.3 μg/L for reproductive dysfunction - Waring & Moore in Atlantic Salmon– 1.0 μg/L for olfactory diminution (predator avoidance, homing behavior,
reproductive priming, etc.) – Scholz in Pacific Salmon
g/L(LC50)1,700EEC 0.05 (RQ)μ
=
EEC = 85μg/L
Thus, water concentrations would be 283 to 85 fold above sub-lethal thresholds for salmonids before
BMPs would be implemented.

Uncertainty Example #2Typical Problem - Mixtures
The disconnect between single-chemical aquatic life criteria and/or toxicological thresholds and actual ecological conditions in salmonid habitat.
The USGS’ NAWQA program found that >50% of all surface water samples contain mixtures of five or more pesticides (USGS Circular 1225).
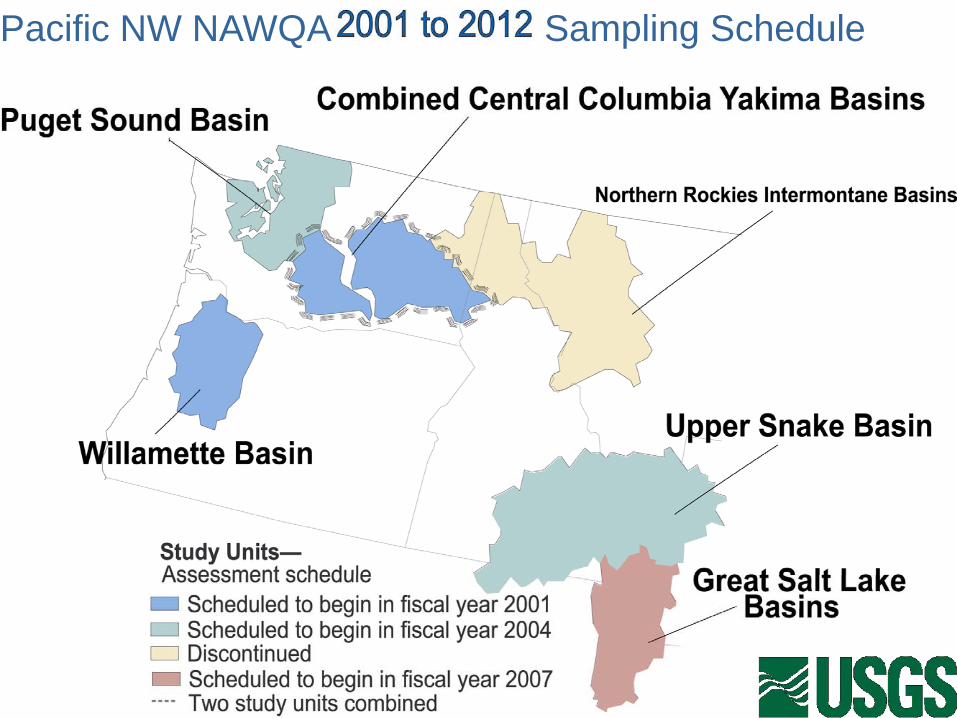
Sampling SchedulePacific NW NAWQA

Pesticide Classification
Total Number of Pesticides Detected
Number of Pesticides Detected in Each Basin
Columbia Plateau*
Yakima* Puget Sound*
Herbicides 56 38 22 26
Insecticides 41 18 35 7
Fungicides 1 1
Pesticide Detections in Washington State Surface Waters
*National Water Quality Assessment Program Basins


CN Mo CL Co Do
CN
Mo
CL
Co
Do
AChE
inhi
bitio
ncarbofuran
diazinon-oxon
chlorpyrifos-oxon
malathion-oxon
carbaryl
Hypothetical physiological effect threshold
exposure to single pesticides exposure to a mixture
Potential Neurobehavioral Toxicity of Mixtures

Other Limitations in Risk AssessmentIntraspecific variability:
Variability between individuals (sensitivity)Age and developmental stage (life history)Variation between studies with the same spp.Variation between species (surrogacy)
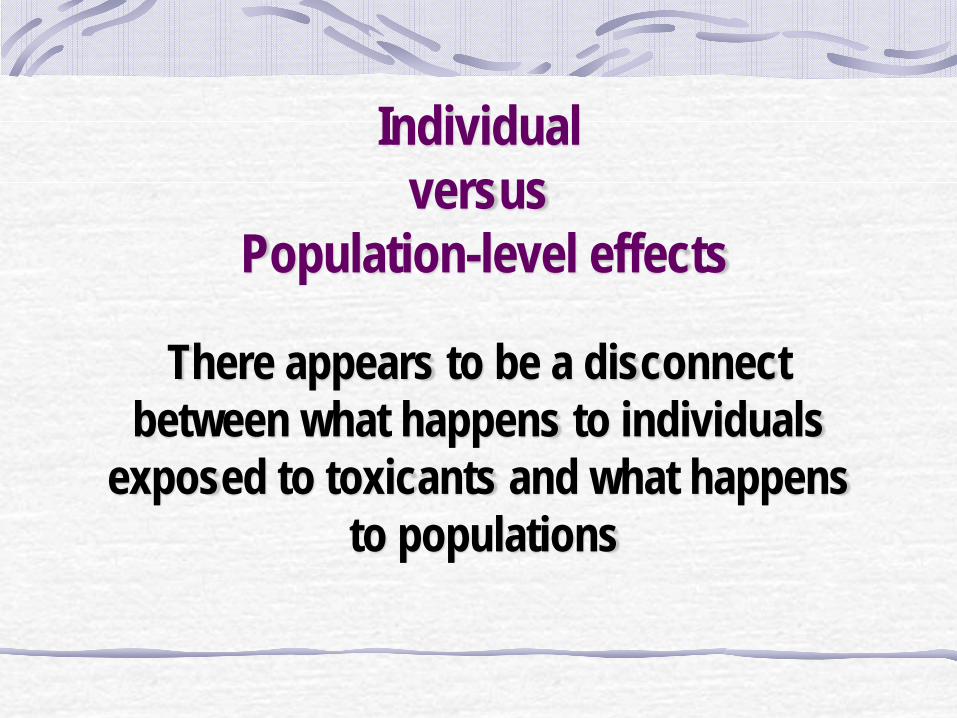
There appears to be a disconnectbetween what happens to individuals
exposed to toxicants and what happensto populations
Individualversus
Population-level effects
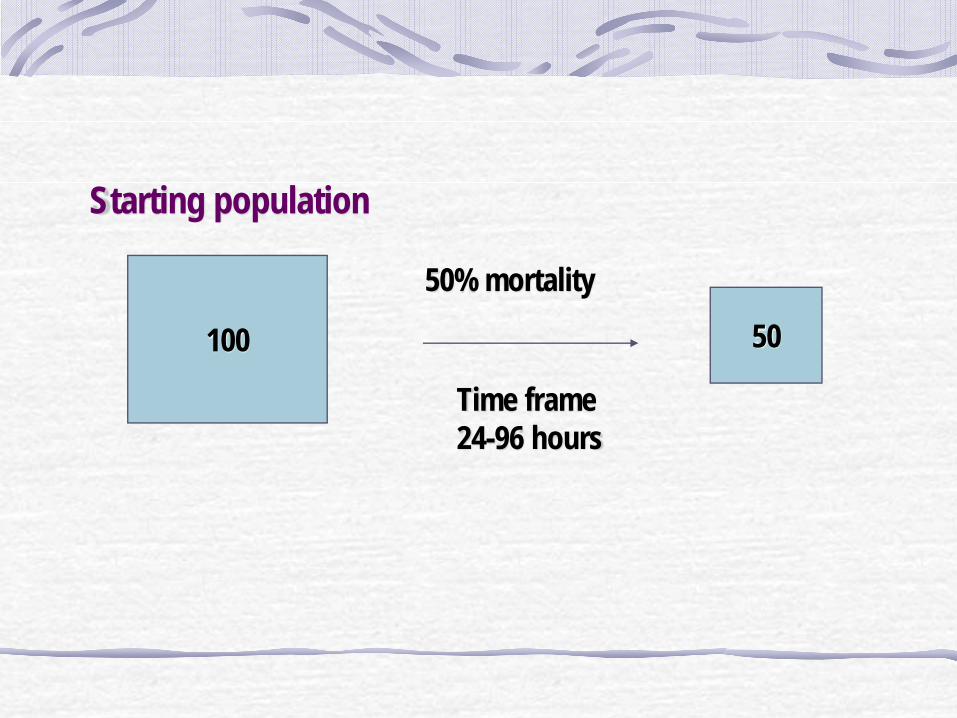
100 50
Time frame24-96 hours
50% mortality
Starting population

100 300Time frame
(long enough for reproduction to occur)
ControlStarting population
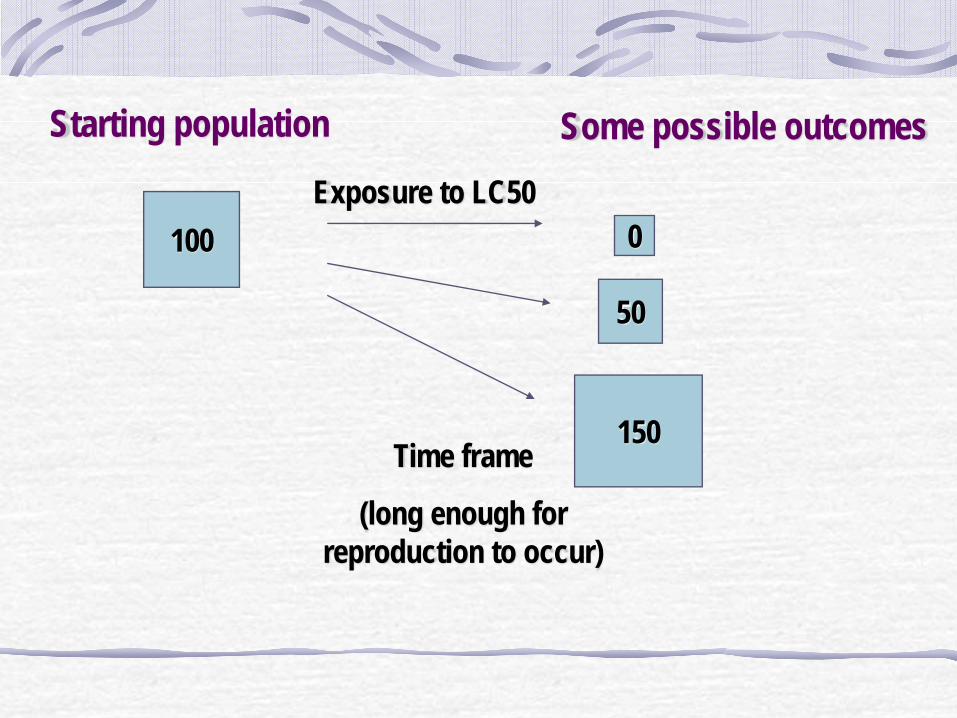
100
50
Time frame
(long enough for reproduction to occur)
Exposure to LC50
Some possible outcomes
0
150
Starting population

How can such different outcomes occur?
-Sublethal effects-Population compensation

Types of sublethal effects
• Reduction in offspring• Weight loss • Reduction of life span• Cancer• Mutations• Behavioral changes• Sterility
Population Compensation
After a catastrophic event such as amajor die-off, the survivors have more
resources available to themand thus can produce more offspring

Problems withthe use of the LC50
as a toxicity endpointin risk assessment

C o n c e n tr a t io n0 .0 0 1 0 .0 1 0 .1 1 1 0 1 0 0 1 0 0 0
% m
orta
lity
1
1 0
3 0
5 0
7 0
9 0
9 9
B CA
Differences in slopes

Examples of population outcomes after exposure to the nominal acute
LC50
John Stark, PhDWashington State University

C-7 Lady beetle exposed to Neemix
Popu
latio
n si
ze (%
)
0
10
20
30
40
50
60
70
80
90
100Control
Model Predicted50% mortality
Actual exposure to LC50
Sublethal Effects

Population CompensationTwo spotted spider mites exposed to Avermectin for 16 days
Popu
latio
n si
ze (%
)
0
10
20
30
40
50
60
70
80
90
100Control
Model Predicted
50% mortality
Exposure to LC50

Population size of Population size of Daphnia Daphnia pulexpulex 10 days after 10 days after static nonstatic non--renewal exposure to the 48 hour renewal exposure to the 48 hour
acute LCacute LC5050 for several insecticides.for several insecticides.
TreatmentTreatment Mean number of Mean number of % of % of individuals individuals ++ SESE controlcontrol
ControlControl 285 285 ++ 2525 --ActaraActara 1.5 1.5 ++ 11 0.5 0.5 AphistarAphistar 82 82 ++ 44 2929DiazinonDiazinon 259 259 ++ 2828 9191FipronilFipronil 118 118 ++ 7 7 4242FulfillFulfill 0 0 ++ 00 00NeemixNeemix 0 0 ++ 00 00SpinosadSpinosad 0 0 ++ 00 00

Most toxicological evaluationsinvolve measurements of one
or maybe two effects
However, exposure to chemicals can result in lethal and multiple
sublethal effects

How do you measurethe total effect
of a chemical exposure?

Demographic Toxicology
Estimating effects of toxicantsthrough the use of life tables
Demography
The study of populationsand the processes that
shape them (Pressat 1985)

Animal populations in nature oftenexist as a mixture of life stages and ages.
For example, there might be adults,newborns, juveniles, and elderly
individuals in a population.
Population structure
What influence, if any,does population structure
play in terms ofsusceptibility of
population to toxicants
Studies with pea aphidsand neem

Inst
anta
neou
s rat
e of
incr
ease
( r i
)/da
y
-0 .4
-0 .2
0 .0
0 .2
0 .4
0 .6
im m atu ress tab le ag e
ad u lts
T im e (d )0 2 4 6 8 1 0 1 2 1 4 1 6 1 8
-0 .4
-0 .2
0 .0
0 .2
0 .4
0 .6
aa
b
N o p e s tic id e e xp o su re
P e s tic id e e xp o su re

Studies with mitesand dicofol

-0 .1 0
0 .0 0
0 .1 0
0 .2 0
0 .3 0
0 .4 0
eg g ss tab le ag e
ad u lts
T im e (d )0 2 4 6 8 1 0 1 2 1 4 1 6
Inst
anta
neou
s rat
e of
incr
ease
(ri)/d
ay
-0 .1 0
0 .0 0
0 .1 0
0 .2 0
0 .3 0
0 .4 0
a
ab
b
N o p e s tic id e e xp o s u re
P e s tic id e e x p o s u re
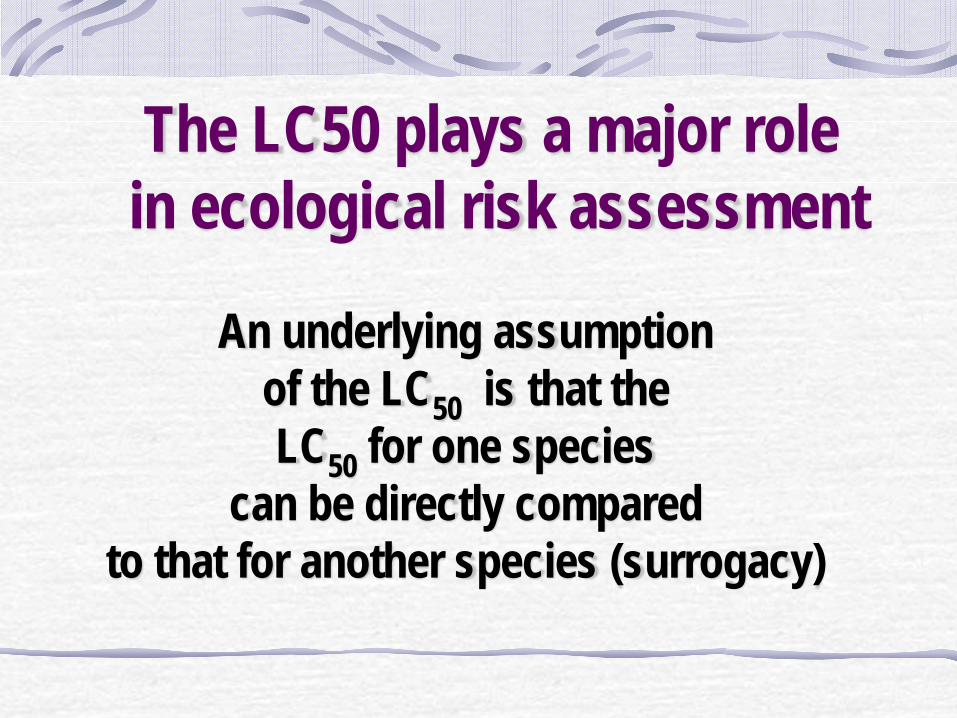
An underlying assumptionof the LC50 is that the LC50 for one species
can be directly compared to that for another species (surrogacy)
The LC50 plays a major rolein ecological risk assessment

However, this assumption overlooks the fact that different species have different life history strategies
and variables such as life span, time to first reproduction and number of offspring produced over a
life-time.
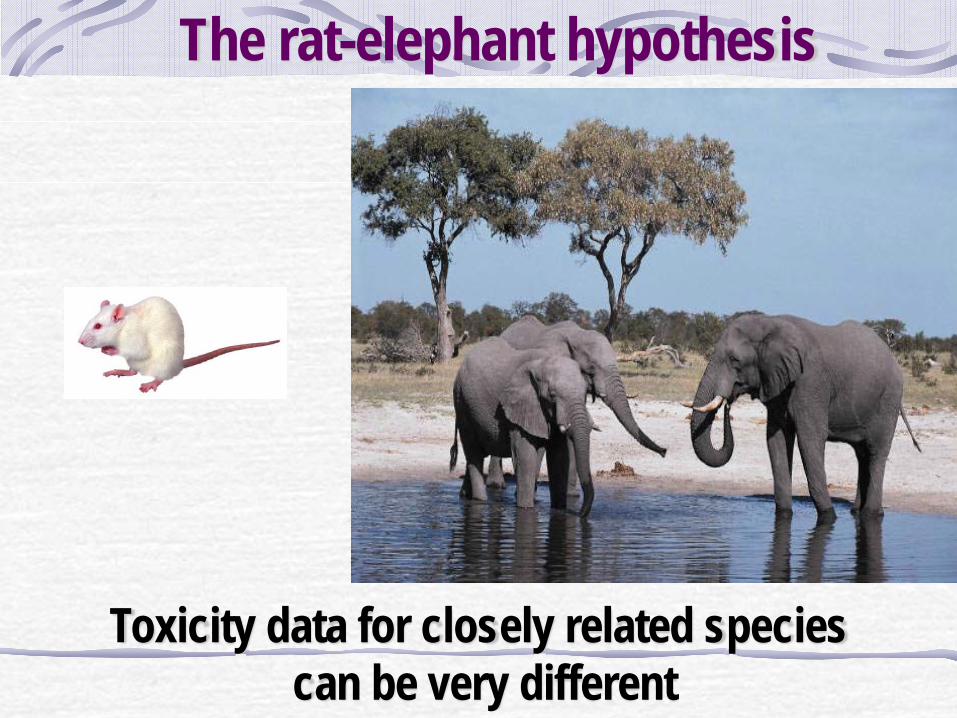
The rat-elephant hypothesis
Toxicity data for closely related speciescan be very different

Hypothesis: all species react to the same stress in the same way regardless of their life history strategies – i.e.,
50% mortality or 50% reduction in offspring has the same effect on all species.
Conclusion: LC50 estimates are not comparableamong species over longer periodsof time than a few days because of
differences in life history parameters
Simplistic measures of toxicity likethe LC50 don’t tell us enough aboutthe potential impacts that pesticides and other pollutants might have on
non target organisms. To make progresswe need to adopt more ecologically
relevant measures of effect.

Pesticide formulation X indirectly affects salmonids by altering the prey availability at a critical life stage transition, juvenile smolt. Smoltification is critical to seaward survival.

Questions?