Embed Size (px)
Citation preview

Lighting Justification Report Segments 3 & 4: East of SR 434 to East of SR 472 (Seminole County: Section 77160 - MP 4.050 to MP 14.135 & Volusia County: Section 79110 - MP 0.000 to MP 10.227)
HNTB Corporation 610 Crescent Executive Court Suite 400 Lake Mary, FL 32746

Lighting Justification Report – SR 400 (I-4) PD&E Segments 3 & 4 (SR 434 to SR 472)
TABLE OF CONTENTS
1.0 Summary ................................................................................................................. 22.0 Introduction ............................................................................................................. 33.0 Lighting Justification Analysis ................................................................................... 3
3.1 Existing Lighting .................................................................................................... 4
3.2 AASHTO Warrants ................................................................................................ 5
LIST OF FIGURES Figure 1 – Project Location Map ........................................................................................................... 4
LIST OF TABLES Table 1: Existing Lighting Summary ..................................................................................................... 5 Table 2: Existing and Future Traffic Volumes ...................................................................................... 6 Table 3: Existing Interchange Spacing .................................................................................................. 7 Table 4: AASHTO Warrant CFL-3 Summary .......................................................................................... 8 Table 5: Night to Day Crash Rate Summary ......................................................................................... 9 Table 6: AASHTO Continuous Freeway Lighting (CFL) Warrant Summary .......................................... 9
SR 400 (I-4) Project Development and Environment (PD&E) Study | FM No.: 432100-1-22-01 i
DRAFT.............................................
.............................................................Volumeso u ..............................
acingacing...........................................L--3 Summary3 Summary..........................
sh Rate Summarye Summ .......inuous Freeway Lightininuous Freeway Lig

Lighting Justification Report – SR 400 (I-4) PD&E Segments 3 & 4 (SR 434 to SR 472)
1.0 Summary The Florida Department of Transportation (FDOT) has contracted with HNTB Corporation to reevaluate the Project Development and Environment (PD&E) studies for the extension of express lanes for State Road 400 (SR 400)/Interstate 4 (I-4): Section 1, from Polk County Line to SR 528 and Section 2, from SR 528 to SR 472.
HNTB Corporation conducted a Lighting Justification Study for SR 400/I-4 from east of SR 434 in Seminole County to east of SR 472 in Volusia County, Florida. Based on the results of the analysis, field reviews and engineering judgment, the following recommendations and conclusions were developed:
The analysis of traffic volumes, interchange spacing, land development, existing lighting and local area conditions shows that at least three of four lighting warrant conditions are met for the I-4 segments evaluated. The night-to-day crash rates for the study corridor exceed 2.0 times the statewide average crash rate. Additionally, continuous lighting is currently provided along SR 400 from the Lake Mary Boulevard interchange to north of SR 46. Other segments of the PD&E study, south of the I-4 Ultimate project, were also identified for meeting lighting justification warrants. Based on the warrants criteria and to maintain continuity throughout the overall I-4 corridor, continuous roadway lighting is recommended for I-4, Segments 3 and 4, from east of SR 434 to east of SR 472.
2
DRAFTfour four
htht-to--to-day cre crae crash rate. Addh rate
m the Lake Mary Boulem the Lake Mary BD&E study, south of thD&E study, south of th
ng justification warrantstificatioty throughout the ovey throughout th
ed for r I-I-4, Segments 3 a4, Segments 3

Lighting Justification Report – SR 400 (I-4) PD&E Segments 3 & 4 (SR 434 to SR 472)
2.0 Introduction FDOT is proposing to reconstruct and widen I-4 as part of the I-4 Ultimate concept. This involves the build-out of I-4 to its ultimate condition through Central Florida, including segments in Polk, Osceola, Orange, Seminole, and Volusia Counties. The concept design proposes the addition of two (2) new express lanes in each direction, resulting in the widening of the existing six lane divided urban interstate to a ten lane divided highway.
The SR 400 (I-4) Project Development and Environment (PD&E) Study is a reevaluation project which addresses the revision from the original design concept showing two (2) High Occupancy Vehicle (HOV) lanes, as recommended in the Environmental Impact Statement (EIS) for I-4 from SR 528 to SR 472, to the current proposed design concept of four (4) Express Lanes. The Express Lanes are tolled lanes and will extend the full length of the project. The proposed typical section will include three general use lanes, two express lanes, an auxiliary lane (in some areas) and shoulder in each direction. The express lanes and general use lanes will be separated by two 10- or 12-foot shoulders, with a barrier wall in between the shoulders.
The SR 400 (I-4) PD&E project limits include a total of approximately 41 miles of roadway sections east and west of the 21-mile, I-4 Ultimate project. The approximate limits of improvement for the west section are from US 27 in Polk County to west of SR 435 (Kirkman Road) in Orange County and for the east section, from east of SR 434 in Seminole County to east of SR 472 in Volusia County.
As part of the SR 400 (I-4) PD&E Study, HNTB has completed an evaluation of the need for freeway lighting and interchange lighting within the following PD&E segments of I-4:
Segment 3 - E. of SR 434 to E. of US 17/92, from Milepost 4.050 to 14.221 in Seminole County
Segment 4 - E. of US 17/92 to E. of SR 472, from Milepost 0.000 to 10.227 in Volusia County
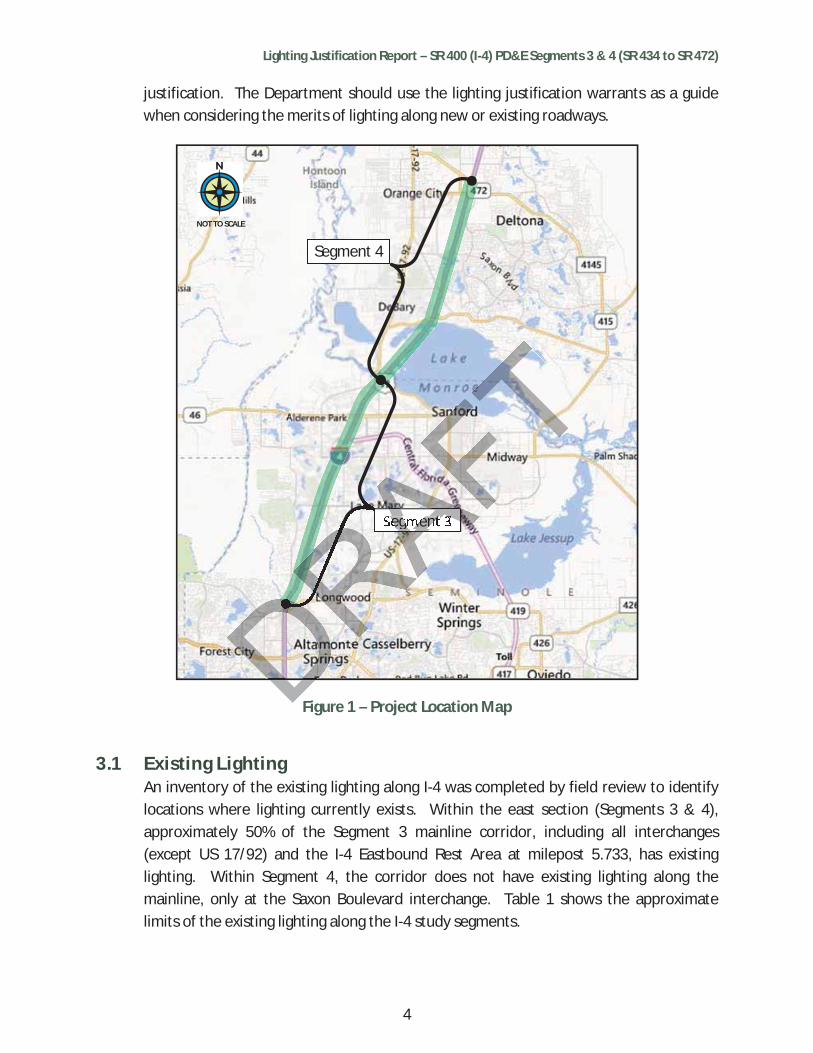
3.0 Lighting Justification Analysis This lighting justification study is prepared in accordance with Chapter 15 (Highway Lighting Justification Procedure) of the Florida Department of Transportation’s (FDOT) Manual on Uniform Traffic Studies (MUTS-2000 Edition). The general project location map is illustrated in Figure 1.
A lighting justification analysis which evaluates warranting conditions, as specified in the American Association of State Highway and Transportation Officials (AASHTO) Roadway Lighting Design Guide was prepared for the study corridor. These warrants represent guidelines for consideration of roadway lighting and do not necessarily dictate
3
DRAFTude thrude t
nd nd shoulder ishoarated by twoarated by two 10- o
s include a total of aude a tthe 21the 2 -mile, Ie, I--4 Ulti4 m
west section are from Usection are from Uge County and for the ge County and for the
of of SR 472 in Volusia CoSR 472 in Volus
00 (I-4) PD&E Study, HN4) PD&E Study, HNting and interchange ligting and intercha
E. of SR 434 to E434 to ESeminole CoSeminole C
of US of US
Lighting Justification Report – SR 400 (I-4) PD&E Segments 3 & 4 (SR 434 to SR 472)
justification. The Department should use the lighting justification warrants as a guide when considering the merits of lighting along new or existing roadways.
Figure 1 – Project Location Map
3.1 Existing Lighting An inventory of the existing lighting along I-4 was completed by field review to identify locations where lighting currently exists. Within the east section (Segments 3 & 4), approximately 50% of the Segment 3 mainline corridor, including all interchanges(except US 17/92) and the I-4 Eastbound Rest Area at milepost 5.733, has existing lighting. Within Segment 4, the corridor does not have existing lighting along the mainline, only at the Saxon Boulevard interchange. Table 1 shows the approximate limits of the existing lighting along the I-4 study segments.
NOT TO SCALE
Segment 4
Segment 3
4
DDRARAFegment 3
DRAD

Lighting Justification Report – SR 400 (I-4) PD&E Segments 3 & 4 (SR 434 to SR 472)
Table 1: Existing Lighting Summary Segment Limits Existing Lighting Limits
Segment Begin
MP End MP
Segment length County
Begin MP
End MP Length
3 4.050 14.221 10.171 Seminole 7.650 12.880 5.230
4 0.000 10.227 10.227 Volusia 5.585 6.920 1.335
3.2 AASHTO Warrants AASHTO warrants provide a set of minimum conditions which must be met in order tojustify lighting installation. Within the AASHTO warrants, there are separate warrants for continuous freeway lighting, complete interchange lighting and partial interchange lighting. The following is a description of the AASHTO warrants for continuous freeway lighting, as described in the Roadway Lighting Design Guide and the evaluation of each warrant for the I-4 east section.
Continuous Freeway Lighting
A continuous lighting system provides relatively uniform lighting on all main lanes and direct connections, and complete interchange lighting of all interchanges within the section. Frontage roads are not normally continuously lighted. The lighting units may be conventional luminaires or high mast assemblies or both. Continuous lighting may be warranted under one of the following conditions.
CFL-1: Sections in and near cities where the current average daily traffic (ADT) is 30,000 or greater.
Evaluation of CFL-1
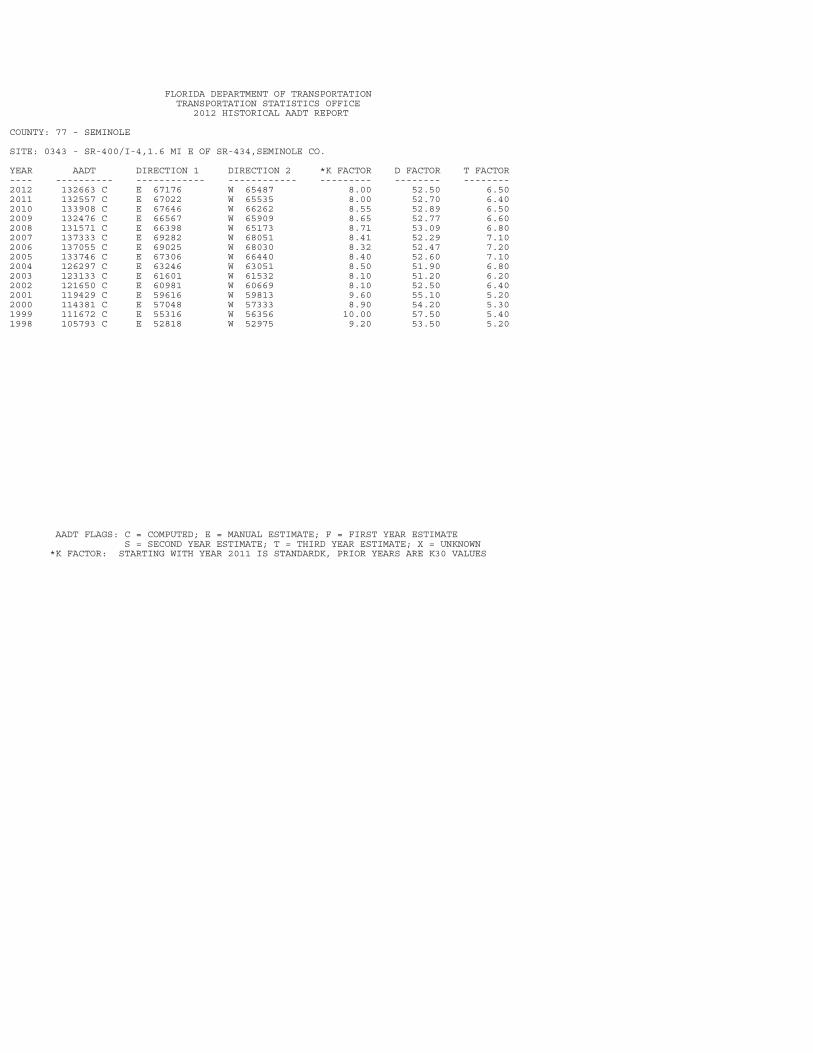
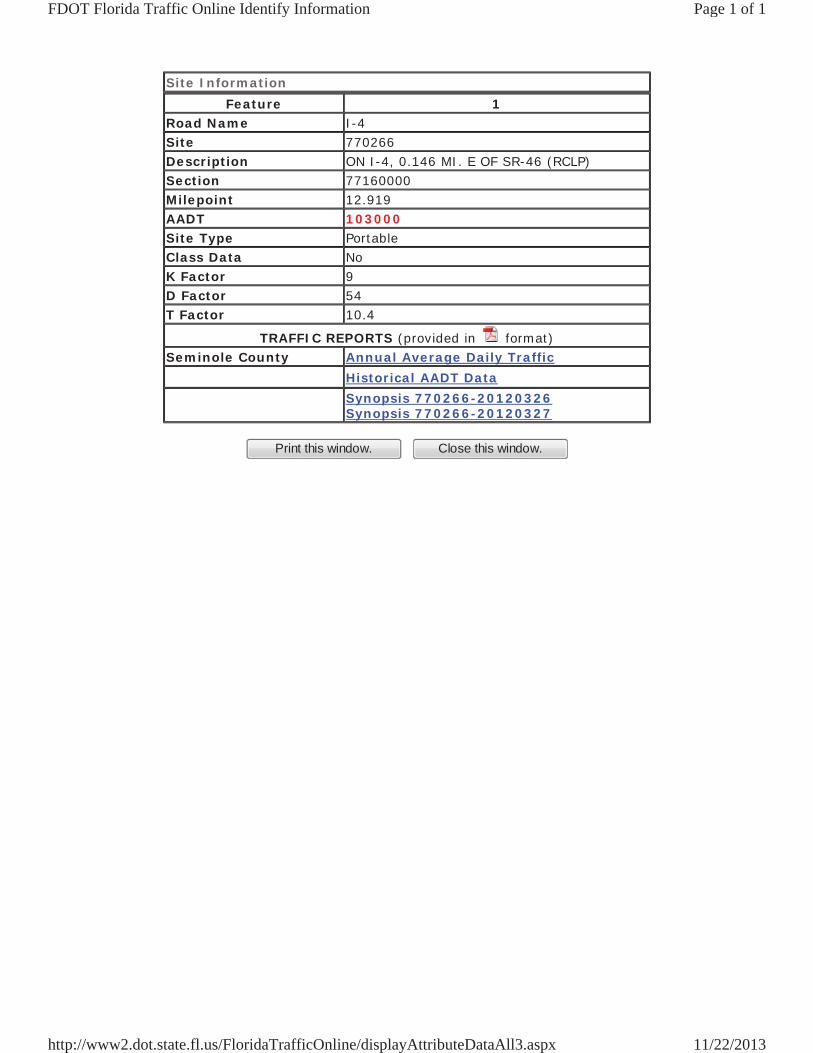
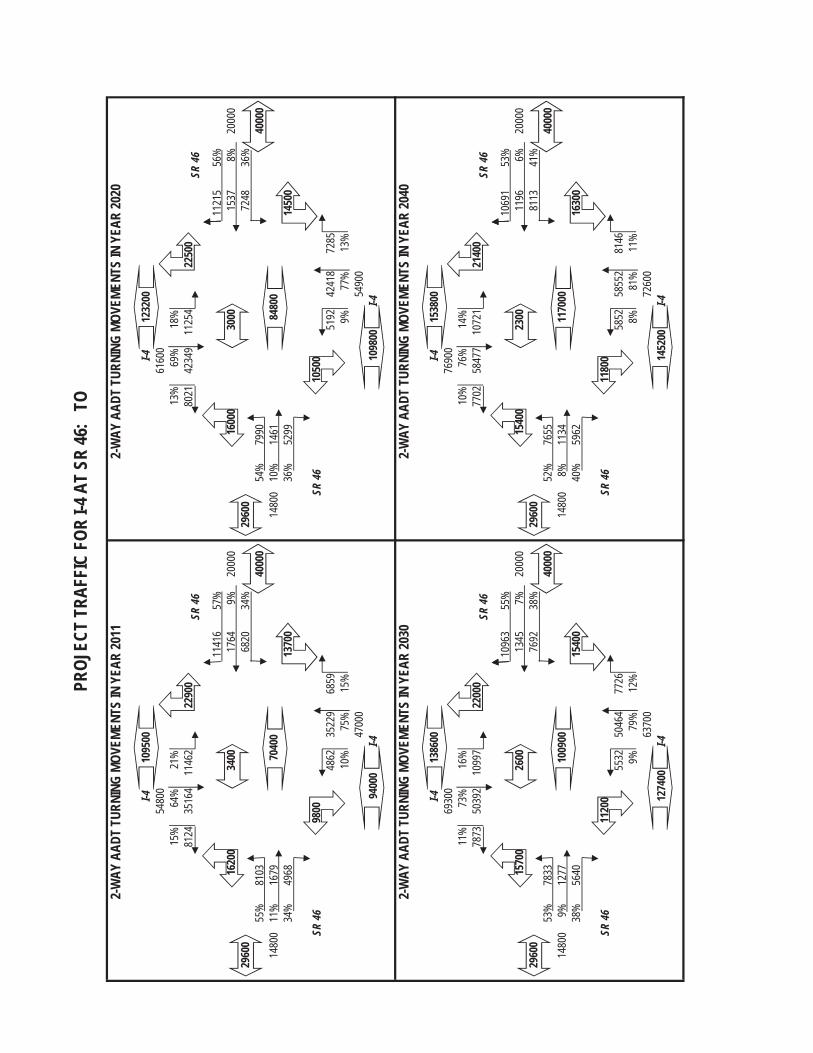
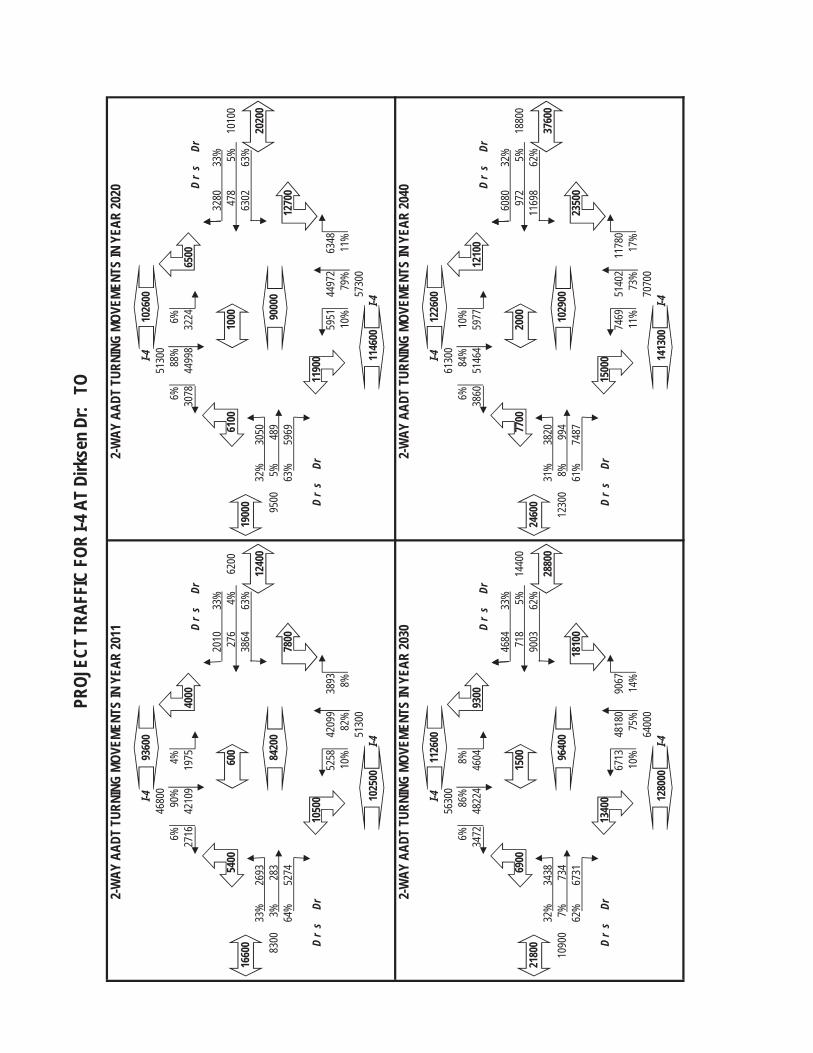
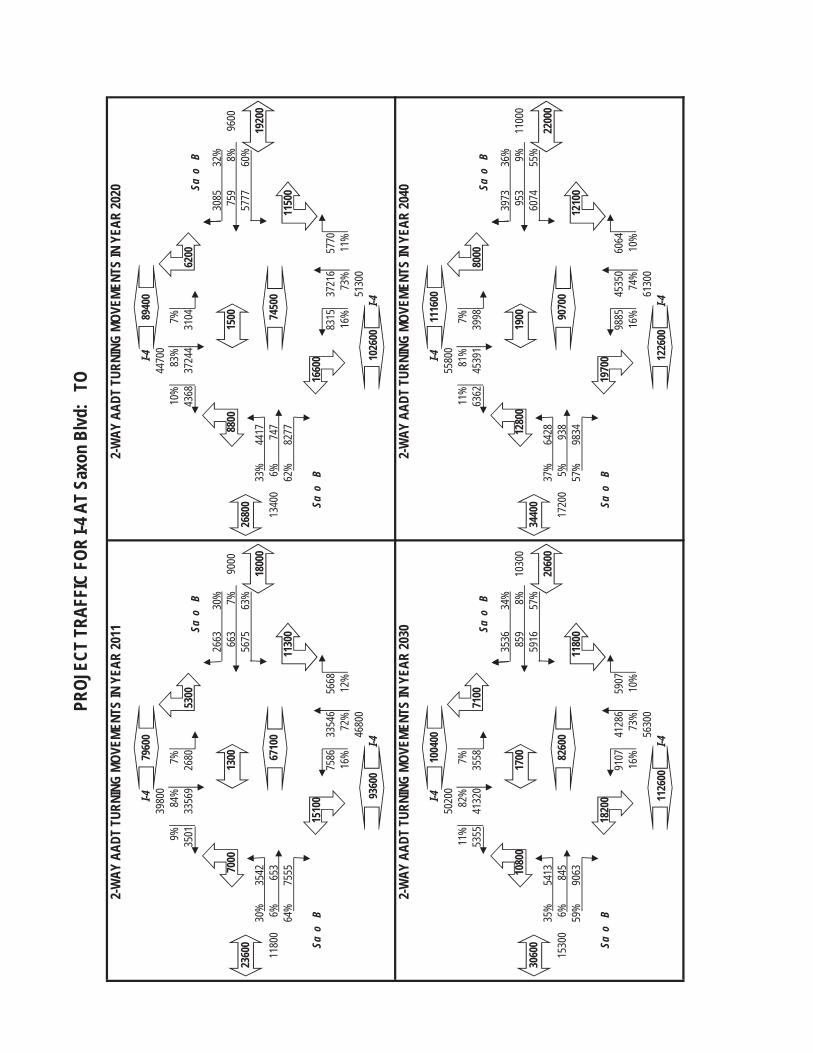
The 2012 Annual Average Daily Traffic (AADT) for I-4 is available from FDOT’s Florida Traffic Online database. Existing daily traffic along I-4 varies throughout the corridor, as shown in Table 2. Traffic projections for Directional Design Hour Volumes for future years 2020 (opening year) and 2040 were determined in the I-4 SAMR Update: Design Traffic Technical Memorandum. The future 2040 AADT is estimated to be in the range of 111,600 to nearly 154,000 vehicles per day along the I-4 segments within the limits of proposed improvements. The existing and future AADT exceed the minimum freeway volume requirements, therefore the conditions of CFL-1 warrant are met for I-4, Segments 3 & 4.
5
DRAFTs, s,
ge lightinge ligHTO warrants foHTO warr
Design GuideDesign Guide and thean
FTovides relatively unifordes relatively unifo
plete interchange lighplete interchange lighare not normally continare not normally
naires or high mast assaires or high mast aer one of the followingof the following
ns in and near cities whns in and near cities w
11

Lighting Justification Report – SR 400 (I-4) PD&E Segments 3 & 4 (SR 434 to SR 472)
Table 2: Existing and Future Traffic Volumes
I-4 Segment2012
AADT*
Future No Build AADT*
2020 AADT 2040 AADT
SR 434 to Lake Mary Boulevard 132,663 139,000 153,100
SR 46 to US 17/92 103,000 123,200 153,800
US 17/92 to Dirksen Drive 106,500 93,400 144,200
Dirksen Drive to Saxon Boulevard 93,854 102,600 122,600
Saxon Boulevard to SR 472 88,000 89,400 111,600
*Sources: FDOT Florida Traffic Online (2012) I-4 SAMR Update Design Traffic Technical Memorandum
CFL-2: Sections where three or more successive interchanges are located with an average spacing of 1.5 miles or less, and adjacent areas outside the right-of-way are substantially urban in character.
Evaluation of CFL-2
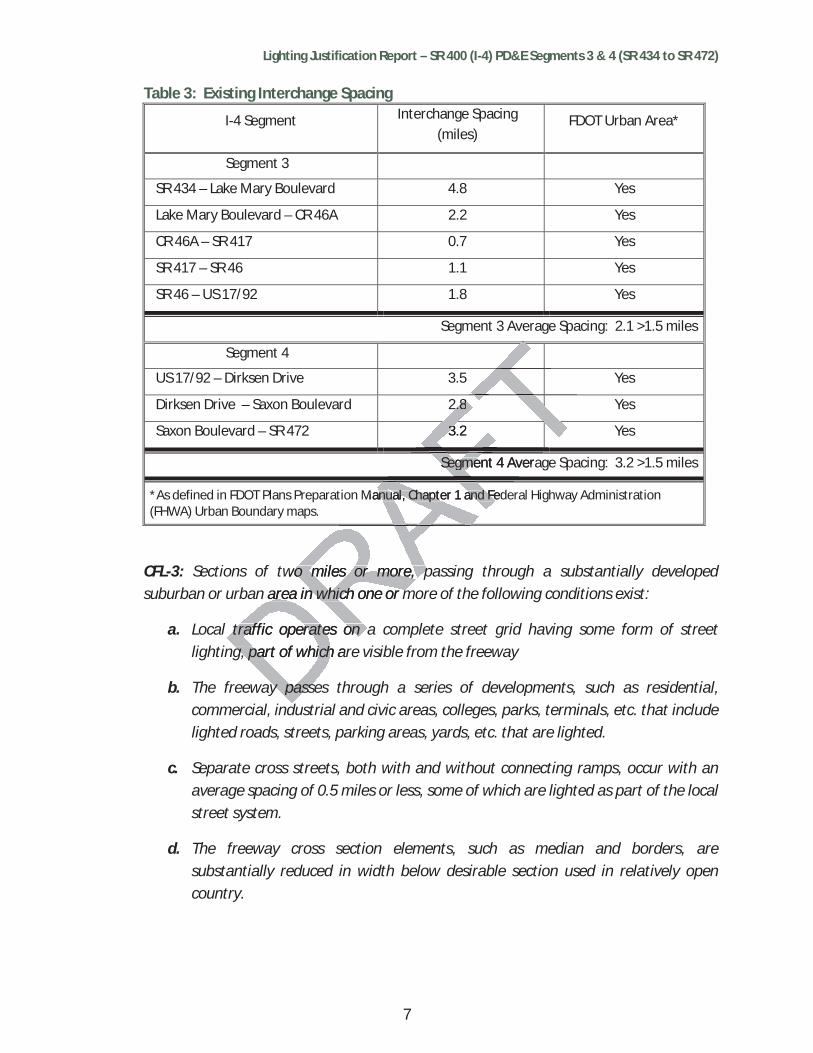
The interchange location and spacing within the I-4 study segments were evaluated;Table 3 provides a summary of the data. There are six (6) interchanges with an average spacing of 2.1 miles within Segment 3 of the I-4 study corridor. Within Segment 4, there are four (4) interchanges with an average spacing of 3.2 miles. Based on the number of interchanges and their average spacing, the conditions of CFL-2 warrant are not met for I-4, Segments 3 & 4. It should be noted that the average spacing between successive interchanges was determined based on the existing interchange locations. Under future build-out conditions, the I-4 study corridor will have multiple access points between the general use and managed lanes. It is expected that some of these accesses will be at-grade access points (slip ramps) that will create additional merging, diverging and weaving areas in between successive interchanges. These locations may be similar to entrance/exit ramp areas where a greater potential for vehicle conflicts exists.
6
DRAFT88
chnical Memoranduchnical MemoTFTFTre successive interchanccessive ss, and adjacent areasss, and adjacent
ation and spacing withon and spacing witha summary of the data. summary of
miles within Segment 3miles within Segmennterchanges with an nterchanges with an
nd their averand their aver3 & 43 & 4
Lighting Justification Report – SR 400 (I-4) PD&E Segments 3 & 4 (SR 434 to SR 472)
Table 3: Existing Interchange Spacing
I-4 Segment Interchange Spacing (miles)
FDOT Urban Area*
Segment 3
SR 434 – Lake Mary Boulevard 4.8 Yes
Lake Mary Boulevard – CR 46A 2.2 Yes
CR 46A – SR 417 0.7 Yes
SR 417 – SR 46 1.1 Yes
SR 46 – US 17/92 1.8 Yes
Segment 3 Average Spacing: 2.1 >1.5 miles
Segment 4
US 17/92 – Dirksen Drive 3.5 Yes
Dirksen Drive – Saxon Boulevard 2.8 Yes
Saxon Boulevard – SR 472 3.2 Yes
Segment 4 Average Spacing: 3.2 >1.5 miles
*As defined in FDOT Plans Preparation Manual, Chapter 1 and Federal Highway Administration (FHWA) Urban Boundary maps.
CFL-3: Sections of two miles or more, passing through a substantially developed suburban or urban area in which one or more of the following conditions exist:
a. Local traffic operates on a complete street grid having some form of street lighting, part of which are visible from the freeway
b. The freeway passes through a series of developments, such as residential, commercial, industrial and civic areas, colleges, parks, terminals, etc. that include lighted roads, streets, parking areas, yards, etc. that are lighted.
c. Separate cross streets, both with and without connecting ramps, occur with an average spacing of 0.5 miles or less, some of which are lighted as part of the local street system.
d. The freeway cross section elements, such as median and borders, are substantially reduced in width below desirable section used in relatively open country.
7
TTTTTTT.8.8 TTTT3.23 FTTTTSegment 4 AveraSegme
AFTAFTT
Manual, Chapter 1 and Fednual, Chapter 1 and FeAFAFRARAwo miles or more, pwo miles or more, p
n area in which one or marea in which one or m
traffic operates on atraffic operates on g, part of which arg, part of which
y passy pass

Lighting Justification Report – SR 400 (I-4) PD&E Segments 3 & 4 (SR 434 to SR 472)
Evaluation of CFL-3
The area surrounding the I-4 corridor segments was evaluated based on the CFL-3 warrant criteria. The entire I-4 study area corridor passes through an area that is designated as a substantially developed suburban or urban area. Within I-4, Segment 4, there is 3.5-mile segment between US 17/92 and the Dirksen Drive interchange where the Interstate crosses the St. John’s River in the Lake Monroe Conservation Area Sub Basin. Local traffic conditions including the street network characteristics, types of developments, existing lighting and freeway cross section elements were reviewed for this warrant and are summarized in Table 4. Based on the CFL-3 criteria, conditions CFL-3b and 3d are met for both Segments 3 and 4.
Table 4: AASHTO Warrant CFL-3 Summary I-4 Segment CFL – 3a CFL – 3b CFL – 3c CFL – 3d1
Segment 3: SR 434 to E. of US 17/92 x x Segment 4: E. of US 17/92 to E. of SR 472 x x
= condition is met X = condition not met
1 This condition is met for some portions within the segments under existing conditions. Under future conditions with construction of the managed lanes, this condition is expected to be met for both segments.
CFL-4: Sections where the ratio of night to day crash rate is at least 2.0 times the statewide average for all unlighted similar sections, and a study indicates that lighting may be expected to result in a significant reduction in the night crash rate. Where crash data are not available, rate comparison maybe used as a general guideline for crash severity.
Evaluation of CFL-4
The night to day crash rate is based on the percentage of traffic that occurs during dark hours (percent night AADT). For each segment evaluated, the hours used in determining the percent night AADT were based on the time of the year for which traffic data was available. The dark hours were typically between the hours of 8:00 p.m. to 7:00 a.m.
Day and night crash rates (in million vehicle miles) were calculated for each of the I-4 segments using the following equation:
Crash Rate = Number of Crashes x 1,000,000 AADT x 365 days/year x Number Years x Segment Length
8
DRAFAFAFTaa CFL C –
TTTTTTxx TTTTTTTFTxx
FTFTFTTFTTFTFTFTAFns within the segments unwithin the segments
managed lanes, this conged lanes, this con
e the ratio of night tothe ratio of night te for all unlighted similfor all unlighted simil
ed to result in a significed to result in a sigt available, rate compt available, rate comp

Lighting Justification Report – SR 400 (I-4) PD&E Segments 3 & 4 (SR 434 to SR 472)
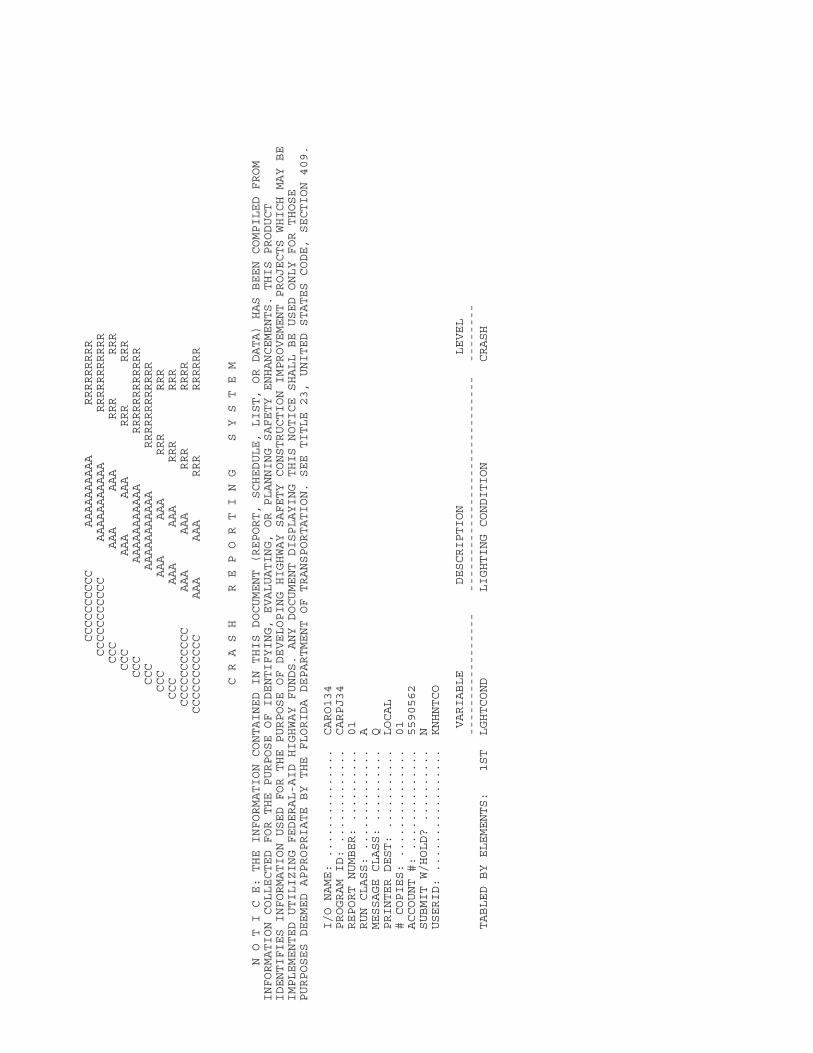
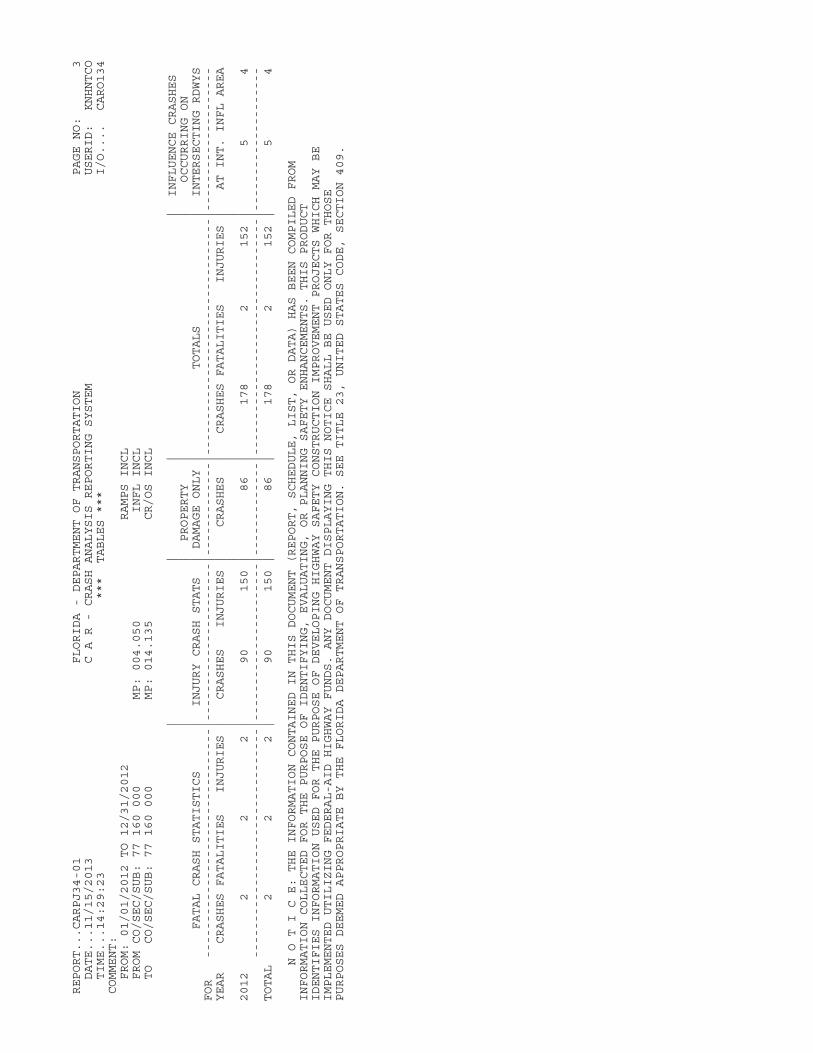
Collision data was obtained from the FDOT Crash Analysis Reporting System (CARS) for the 12 month period from January 1, 2012 to December 31, 2012. Subsequently, the night to day crash rate was calculated by dividing the nighttime crash rate by the daytime crash rate. The night to day crash rate for I-4 is shown in Table 5. Crash rate calculations and collision data are included in the Appendix.
Table 5: Night to Day Crash Rate Summary
I-4 Segment
Segment Limits
Night to Day Crash
Rate
Statewide Average Crash Rate x 2
Statewide Average Crash
Rate1,2
Segment 3 E. of SR 434 to E. of Seminole/Volusia County Line
2.35 0.485 x 2 = 0.97 Yes
Segment 4 E. of Seminole/Volusia County Line to W. of Padgett Creek (MP 3.242)
7.00 0.379 x 2 = 0.758 Yes
Segment 4 W. of Padgett Creek to E. of SR 472 2.74 0.485 x 2 = 0.97 Yes
1 Statewide Average Crash Rates (provided by FDOT Safety Office): Interstate Urban = 0.485 crashes per million vehicle miles Interstate Rural = 0.379 crashes per million vehicle miles
2 Crash Rates provided by facility type without distinction between unlighted and lighted segments
Lighting Justification Summary
The AASHTO Roadway Lighting warrant criteria were evaluated for both I-4 Segments in the East Section of the I-4 PD&E; a summary of the warrants is provided in Table 6.
Table 6: AASHTO Continuous Freeway Lighting (CFL) Warrant SummaryI-4 Segment CFL – 1 CFL – 2 CFL – 3 CFL – 41
Segment 3: E. of SR 434 to E. of US 17/92 x
Segment 4: E. of US 17/92 to E. of SR 472 x
= warrant is met X = warrant not met
1 Crash Rates used to evaluate this warrant were provided by FDOT Safety Office for each facility type without distinction between unlighted and lighted segments
Locations where lighting currently exists along I-4 were previously identified in Table 1.Within the 10.17-mile Segment 3, approximately half the corridor (4.94 miles) is presently unlit, however all interchanges have lighting with the exception of US 17/92. Within the 10.23-mile Segment 4, the majority of the segment (8.81 miles) is unlit including three of
9
434434DRAFT0.3
TTT2.74.74 0.485 x 20TTTTTTTTTTFTFTFTFTFTFTFTFTFTOT Safety OfficeT Safety Office):million vehicle mileshicle m
r million vehicle milesmillion vehicle mileithout distinction betweenut distinction betwee
mmarymma
Rway Lighting warrant ghting warrant crcrof the Iof the I--4 PD&E; 4 PD&E; a sum
SHTO Continuous FreSHTO ContinuouDDD
Lighting Justification Report – SR 400 (I-4) PD&E Segments 3 & 4 (SR 434 to SR 472)
the four interchanges. Within Segment 4, interchange lighting is provided only at Saxon Boulevard.
The AASHTO Roadway Lighting warrant criteria to justify Continuous Freeway Lighting require only one of four conditions to be met. The preceding analysis of traffic volumes, interchange spacing, land development, existing lighting and local area conditions shows that at least three conditions are met for both of the segments evaluated. Based on the AASHTO Roadway Lighting warrant criteria, Continuous Freeway Lighting is recommended along the entire East Section of I-4 PD&E, which includes Segments 3 and 4.
10
DRAFT

Lighting Justification Report – SR 400 (I-4) PD&E Segments 3 & 4 (SR 434 to SR 472)
APPENDIX
11
DRAFT

CR
AS
H R
ATE
CA
LCU
LATI
ON
S
Sect
ion
7716
0000
CO
UN
T ST
ATI
ON
3/
26/1
2
7702
66:
EB: O
N I-
4, 0
.146
MI.
E O
F SR
46
(RC
LP)
7702
66:
WB
: ON
I-4,
0.1
46 M
I. E
OF
SR 4
6 (R
CLP
)
CO
UN
T ST
ATI
ON
3/
27/1
2
7702
66:
EB: O
N I-
4, 0
.146
MI.
E O
F SR
46
(RC
LP)
7702
66:
WB
: ON
I-4,
0.1
46 M
I. E
OF
SR 4
6 (R
CLP
)
Volu
me
(veh
)Vo
lum
e (v
eh)
Volu
me
(veh
)Vo
lum
e (v
eh)
TIM
ETI
ME
0000
-010
061
534
200
00-0
100
689
370
0100
-020
041
822
801
00-0
200
427
263
0200
-030
029
026
302
00-0
300
132
226
0300
-040
027
040
003
00-0
400
476
387
0400
-050
041
779
904
00-0
500
445
774
0500
-060
066
821
4505
00-0
600
776
2162
0600
-070
016
6347
3306
00-0
700
1755
4787
2000
-210
024
5415
6920
00-2
100
2419
1610
2100
-220
020
6412
1421
00-2
200
2241
1267
2200
-230
014
1584
122
00-2
300
1531
868
2300
-240
010
4154
523
00-2
400
1016
514
NIG
HTT
IME
TOTA
L11
,315
13,0
79N
IGH
TTIM
E TO
TAL
11,9
0713
,228
24-H
R T
OTA
L58
,965
57,5
3424
-HR
TO
TAL
60,1
5757
,336
NIG
HT
%19
%23
%N
IGH
T%
20%
23%
AVE
RA
GE
NIG
HT
%A
VER
AG
E N
IGH
T %
Sect
ion
7911
0000
CO
UN
T ST
ATI
ON
4/
18/1
2
7904
84:
EB: O
N I-
4,0.
337
MI E
O
F ST
. JO
HN
S R
IVER
BR
IDG
E (IT
S)
7904
84:
WB
: ON
I-4,
0.33
7 M
I E
OF
ST. J
OH
NS
RIV
ER B
RID
GE
(ITS)
CO
UN
T ST
ATI
ON
5/
16/1
2
7904
84:
EB: O
N I-
4,0.
337
MI E
O
F ST
. JO
HN
S R
IVER
BR
IDG
E (IT
S)
7904
84:
WB
: ON
I-4,
0.33
7 M
I E
OF
ST. J
OH
NS
RIV
ER B
RID
GE
(ITS)
CO
UN
T ST
ATI
ON
8/
15/1
2
7904
84:
EB: O
N I-
4,0.
337
MI E
O
F ST
. JO
HN
S R
IVER
BR
IDG
E (IT
S)
7904
84:
WB
: ON
I-4,
0.33
7 M
I E
OF
ST. J
OH
NS
RIV
ER B
RID
GE
(ITS)
Volu
me
(veh
)Vo
lum
e (v
eh)
Volu
me
(veh
)Vo
lum
e (v
eh)
Volu
me
(veh
)Vo
lum
e (v
eh)
TIM
ETI
ME
TIM
E00
00-0
100
699
316
0000
-010
064
134
700
00-0
100
682
357
0100
-020
038
325
701
00-0
200
409
219
0100
-020
027
553
0200
-030
033
023
702
00-0
300
303
231
0200
-030
043
429
903
00-0
400
261
387
0300
-040
028
935
303
00-0
400
292
343
0400
-050
042
571
004
00-0
500
380
783
0400
-050
035
470
005
00-0
600
726
1894
0500
-060
066
418
6005
00-0
600
673
1962
0600
-070
015
3443
7706
00-0
700
1532
4340
0600
-070
014
6343
0520
00-2
100
2251
1404
2000
-210
021
5712
8620
00-2
100
2424
1496
2100
-220
020
6011
7621
00-2
200
1847
1156
2100
-220
021
0813
0222
00-2
300
1391
864
2200
-230
013
5280
722
00-2
300
1404
916
2300
-240
011
0056
823
00-2
400
955
296
2300
-240
010
5468
1N
IGH
TTIM
E TO
TAL
11,1
6012
,190
NIG
HTT
IME
TOTA
L10
,529
11,6
78N
IGH
TTIM
E TO
TAL
11,1
6312
,414
24-H
R T
OTA
L54
,373
52,9
1124
-HR
TO
TAL
51,6
2851
,204
24-H
R T
OTA
L53
,950
55,2
08N
IGH
T%
21%
23%
NIG
HT
%20
%23
%N
IGH
T%
21%
22%
AVE
RA
GE
NIG
HT
%A
VER
AG
E N
IGH
T %
AVE
RA
GE
NIG
HT
%
CO
UN
T ST
ATI
ON
4/
18/1
2
7910
03:
EB: O
N I-
4, 1
.236
MI.
W O
F SR
-472
(ITS
)
7910
03:
WB
: ON
I-4,
1.2
36 M
I. W
OF
SR-4
72 (I
TS)
CO
UN
T ST
ATI
ON
8/
15/1
2
7910
03:
EB: O
N I-
4, 1
.236
MI.
W O
F SR
-472
(ITS
)
7910
03:
WB
: ON
I-4,
1.2
36 M
I. W
OF
SR-4
72 (I
TS)
Volu
me
(veh
)Vo
lum
e (v
eh)
Volu
me
(veh
)Vo
lum
e (v
eh)
TIM
ETI
ME
0000
-010
052
730
300
00-0
100
472
356
0100
-020
030
324
101
00-0
200
245
645
0200
-030
031
222
602
00-0
300
383
238
0300
-040
026
034
003
00-0
400
240
283
0400
-050
045
854
304
00-0
500
424
521
0500
-060
075
312
1405
00-0
600
735
1209
0600
-070
015
7426
6906
00-0
700
1580
2560
2000
-210
014
5513
1420
00-2
100
1583
1356
2100
-220
013
5111
0521
00-2
200
1349
1120
2200
-230
010
1182
922
00-2
300
1049
821
2300
-240
073
454
623
00-2
400
751
614
NIG
HTT
IME
TOTA
L8,
738
9,33
0N
IGH
TTIM
E TO
TAL
8,81
19,
723
24-H
R T
OTA
L42
,249
41,7
9224
-HR
TO
TAL
42,4
1944
,323
NIG
HT
%21
%22
%N
IGH
T%
21%
22%
AVE
RA
GE
NIG
HT
%A
VER
AG
E N
IGH
T %
AVE
RA
GE
NIG
HT
%:
21.6
%
22%
22%
HOURS OF NIGHT
21%
21%
HOURS OF NIGHT
21%
21%
HOURS OF NIGHT
22%

CR
AS
H R
ATE
CA
LCU
LATI
ON
S
SEG
MEN
T 3
CR
ASH
RAT
ESSE
CTI
ON
:77
1600
00SE
CTI
ON
:79
1100
00
STAT
E R
D:
SR
400
/I-4
E. o
f SR
434
to
Sem
inol
e/V
olus
ia
Cou
nty
Line
STAT
E R
D:
SR
400
/I-4
Sem
inol
e/V
olus
ia
Cou
nty
Line
to M
P
0.08
6C
OU
NTY
:S
EM
INO
LEC
OU
NTY
CO
UN
TY:
VO
LUS
IAC
OU
NTY
DAT
E:1/
1/20
12to
12/
31/2
012
DAT
E:1/
1/20
12to
12/
31/2
012
BEG
IN M
P4.
050
BEG
IN M
P0.
000
END
MP
14.1
35EN
D M
P0.
086
CR
ASH
SEG
MEN
T LE
NG
TH:
10.0
85M
ILE
S
CR
ASH
SEG
MEN
T LE
NG
TH:
0.08
6M
ILE
TOTA
L C
RAS
H S
EGM
ENT
LEN
GTH
:10
.171
MIL
ES
Seg
men
t 3%
AA
DT
CR
AS
H R
ATE
AD
JUS
TED
RA
TEN
o. o
f NIG
HTT
IME
CR
AS
HE
S68
21%
0.77
0.77
No.
of
DA
YTI
ME
CR
AS
HE
S10
979
%0.
330.
33A
AD
T11
3,23
3N
IGH
T LI
GH
TED
RA
TE A
DJU
STM
ENT
FAC
TOR
:N/A
ADJU
STED
NIG
HT
TO D
AY C
RAS
H R
ATE
=2.
35N
IGH
T TO
DA
Y C
RA
SH R
ATE
=2.
35S
TATE
WID
E A
VE
RA
GE
CR
AS
H R
ATE
=0.
485
2.0
X S
TATE
WID
E A
VE
RA
GE
CR
AS
H R
ATE
?Y
ES
SEG
MEN
T 4
CR
ASH
RAT
ESSE
CTI
ON
:79
1100
00
STAT
E R
D:
SR
400
/I-4
E. o
f S
emin
ole/
Vol
usia
C
ount
y Li
ne to
W.
of P
adge
tt C
reek
CO
UN
TY:
VO
LUS
IAC
OU
NTY
DAT
E:1/
1/20
12to
12/
31/2
012
BEG
IN M
P0.
086
END
MP
3.24
2C
RAS
H S
EGM
ENT
LEN
GTH
:3.
156
MIL
ES
Seg
men
t 4%
AA
DT
CR
AS
H R
ATE
AD
JUS
TED
RA
TEN
o. o
f NIG
HTT
IME
CR
AS
HE
S27
22%
1.02
1.02
No.
of
DA
YTI
ME
CR
AS
HE
S14
78%
0.15
0.15
AA
DT
106,
500
NIG
HT
LIG
HTE
D R
ATE
AD
JUST
MEN
T FA
CTO
R:N
/A
ADJU
STED
NIG
HT
TO D
AY C
RAS
H R
ATE
=7.
00N
IGH
T TO
DA
Y C
RA
SH R
ATE
=7.
00S
TATE
WID
E A
VE
RA
GE
CR
AS
H R
ATE
=0.
379
2.0
X S
TATE
WID
E A
VE
RA
GE
CR
AS
H R
ATE
?Y
ES
SEC
TIO
N:
7911
0000
STAT
E R
D:
SR
400
/I-4
W. o
f Pad
gett
Cre
ek (M
P 3
.242
) to
E. o
f SR
472
CO
UN
TY:
VO
LUS
IAC
OU
NTY
DAT
E:1/
1/20
12to
12/
31/2
012
BEG
IN M
P3.
242
END
MP
10.2
27C
RAS
H S
EGM
ENT
LEN
GTH
:6.
985
MIL
ES
Seg
men
t 4%
AA
DT
CR
AS
H R
ATE
AD
JUS
TED
RA
TEN
o. o
f NIG
HTT
IME
CR
AS
HE
S34
22%
0.71
0.71
No.
of
DA
YTI
ME
CR
AS
HE
S45
78%
0.26
0.26
AA
DT
86,4
51N
IGH
T LI
GH
TED
RA
TE A
DJU
STM
ENT
FAC
TOR
:N/A
ADJU
STED
NIG
HT
TO D
AY C
RAS
H R
ATE
=2.
74N
IGH
T TO
DA
Y C
RA
SH R
ATE
=2.
74S
TATE
WID
E A
VE
RA
GE
CR
AS
H R
ATE
=0.
485
2.0
X S
TATE
WID
E A
VE
RA
GE
CR
AS
H R
ATE
?Y
ES


CCCCCCCCCC AAAAAAAAAA RRRRRRRRR
CCCCCCCCCCC AAAAAAAAAAA RRRRRRRRRRR
CCC AAA AAA RRR RRR
CCC AAA AAA RRR RRR
CCC AAAAAAAAAAA RRRRRRRRRRRR
CCC AAAAAAAAAAA RRRRRRRRRRRR
CCC AAA AAA RRR RRR
CCC AAA AAA RRR RRR
CCCCCCCCCCC AAA AAA RRR RRRR
CCCCCCCCCCC AAA AAA RRR RRRRRR
C R A S H R E P O R T I N G S Y S T E M
N O T I C E: THE INFORMATION CONTAINED IN THIS DOCUMENT (REPORT, SCHEDULE, LIST, OR DATA) HAS BEEN COMPILED FROM
INFORMATION COLLECTED FOR THE PURPOSE OF IDENTIFYING, EVALUATING, OR PLANNING SAFETY ENHANCEMENTS. THIS PRODUCT
IDENTIFIES INFORMATION USED FOR THE PURPOSE OF DEVELOPING HIGHWAY SAFETY CONSTRUCTION IMPROVEMENT PROJECTS WHICH MAY BE
IMPLEMENTED UTILIZING FEDERAL-AID HIGHWAY FUNDS. ANY DOCUMENT DISPLAYING THIS NOTICE SHALL BE USED ONLY FOR THOSE
PURPOSES DEEMED APPROPRIATE BY THE FLORIDA DEPARTMENT OF TRANSPORTATION. SEE TITLE 23, UNITED STATES CODE, SECTION 409.
I/O NAME: ............... CARO134
PROGRAM ID: ............. CARPJ34
REPORT NUMBER: .......... 01
RUN CLASS: .............. A
MESSAGE CLASS: .......... Q
PRINTER DEST: ........... LOCAL
# COPIES: ............... 01
ACCOUNT #: .............. 5590562
SUBMIT W/HOLD? .......... N
USERID: ................. KNHNTCO
VARIABLE DESCRIPTION LEVEL
----------------- ------------------------------ --------
TABLED BY ELEMENTS: 1ST LGHTCOND LIGHTING CONDITION CRASH

REPORT..CARPJ34-1 FLORIDA - DEPARTMENT OF TRANSPORTATION PAGE NO 1
DATE....2013-11-15 C A R - TABLE OF CRASH STATISTICS *** TABLED BY ***
TIME....15:27:50:4 *** TABLES *** 1ST LGHTCOND LIGHTING CONDITION
COMMENT: *** 1ST LEVEL - CRASH LEVEL REPORT ***
FROM: 01/01/2012 TO 12/31/2012 RAMPS INCL
FROM CO/SEC/SUB: 79 110 000 MP: 000.000 INFL INCL
TO CO/SEC/SUB: 79 110 000 MP: 010.227 CR/OS INCL
VARIABLE DESCRIPTION CODE CODE DESCRIPTION
------------------ ------------------------------ ---- -----------------------------
1ST LGHTCOND LIGHTING CONDITION
FATAL CRASH STATISTICS INJURY CRASH STATS PROPERTY TOTALS
****************************** ****************** DAMAGE ONLY *****************************
CODE CODE DESCRIPTION CRASHES FATALITIES INJURIES CRASHES INJURIES CRASHES CRASHES FATALITIES INJURIES
---- ------------------------------ ------- ---------- -------- ------- -------- ------- ------- ---------- --------
01 DAYLIGHT 1 1 0 35 49 23 59 1 49
02 DUSK 0 0 0 2 2 5 7 0 2
03 DAWN 0 0 0 3 5 1 4 0 5
04 DARK (STREET LIGHT) 0 0 0 1 1 7 8 0 1
05 DARK (NO STREET LIGHT) 1 1 0 20 31 21 42 1 31
- - - - - - - - - - - - - - - - - - - - - - - - - - - - - - - - - - - - - - - - - - - - - - - - - - - - - - - - - - - - - - - - - -
SUB TOTAL: 2 2 0 61 88 57 120 2 88

REPORT..CARPJ34-1 FLORIDA - DEPARTMENT OF TRANSPORTATION PAGE NO 2
DATE....2013-11-15 C A R - TABLE OF CRASH STATISTICS *** TABLED BY ***
TIME....15:27:50:4 *** TABLES *** 1ST LGHTCOND LIGHTING CONDITION
COMMENT: *** REPORT TOTALS ***
FROM: 01/01/2012 TO 12/31/2012 RAMPS INCL
FROM CO/SEC/SUB: 79 110 000 MP: 000.000 INFL INCL
TO CO/SEC/SUB: 79 110 000 MP: 010.227 CR/OS INCL
FATAL CRASH STATISTICS INJURY CRASH STATS PROPERTY TOTALS
****************************** ****************** DAMAGE ONLY *****************************
CRASHES FATALITIES INJURIES CRASHES INJURIES CRASHES CRASHES FATALITIES INJURIES
------- ---------- -------- ------- -------- ------- ------- ---------- --------
TOTAL CRASHES: 2 2 0 61 88 57 120 2 88
FATAL CRASH STATISTICS INJURY CRASH STATS PROPERTY TOTALS
****************************** ****************** DAMAGE ONLY *****************************
VEH/PEDS FATALITIES INJURIES VEH/PEDS INJURIES VEH/PEDS VEH/PEDS FATALITIES INJURIES
-------- ---------- -------- -------- -------- -------- -------- ---------- --------
TOTAL VEHICLES: 2 2 0 68 88 112 182 2 88
TOTAL PEDESTRIANS: 0 0 0 0 0 0 0 0 0
FATAL CRASH STATISTICS INJURY CRASH STATS NON TOTALS
****************************** ****************** INJURED *****************************
FATAL PERSONS INJURED PERSONS PERSONS PERSONS FATALITIES INJURIES
------------- --------------- ------- ------- ---------- --------
TOTAL PERSONS: 2 88 178 268 2 88

REPORT...CARPJ34-01 FLORIDA - DEPARTMENT OF TRANSPORTATION PAGE NO: 3
DATE...11/15/2013 C A R - CRASH ANALYSIS REPORTING SYSTEM USERID: KNHNTCO
TIME...15:27:50 *** TABLES *** I/O.... CARO134
COMMENT:
FROM: 01/01/2012 TO 12/31/2012 RAMPS INCL
FROM CO/SEC/SUB: 79 110 000 MP: 000.000 INFL INCL
TO CO/SEC/SUB: 79 110 000 MP: 010.227 CR/OS INCL
| | | | INFLUENCE CRASHES
| | PROPERTY | | OCCURRING ON
FATAL CRASH STATISTICS | INJURY CRASH STATS | DAMAGE ONLY | TOTALS | INTERSECTING RDWYS
FOR --------------------------------|----------------------|-------------|---------------------------------|--------------------
YEAR CRASHES FATALITIES INJURIES | CRASHES INJURIES | CRASHES | CRASHES FATALITIES INJURIES | AT INT. INFL AREA
| | | |
2012 2 2 0 | 61 88 | 57 | 120 2 88 | 2 2
--------------------------------|----------------------|-------------|---------------------------------|--------------------
TOTAL 2 2 0 | 61 88 | 57 | 120 2 88 | 2 2
N O T I C E: THE INFORMATION CONTAINED IN THIS DOCUMENT (REPORT, SCHEDULE, LIST, OR DATA) HAS BEEN COMPILED FROM
INFORMATION COLLECTED FOR THE PURPOSE OF IDENTIFYING, EVALUATING, OR PLANNING SAFETY ENHANCEMENTS. THIS PRODUCT
IDENTIFIES INFORMATION USED FOR THE PURPOSE OF DEVELOPING HIGHWAY SAFETY CONSTRUCTION IMPROVEMENT PROJECTS WHICH MAY BE
IMPLEMENTED UTILIZING FEDERAL-AID HIGHWAY FUNDS. ANY DOCUMENT DISPLAYING THIS NOTICE SHALL BE USED ONLY FOR THOSE
PURPOSES DEEMED APPROPRIATE BY THE FLORIDA DEPARTMENT OF TRANSPORTATION. SEE TITLE 23, UNITED STATES CODE, SECTION 409.

REPORT...CARPJ34-01 FLORIDA - DEPARTMENT OF TRANSPORTATION PAGE NO: 1
DATE...11/15/2013 C A R - CRASH ANALYSIS REPORTING SYSTEM USERID: KNHNTCO
TIME...15:27:50 *** TABLES *** I/O.... CARO134
*** REPORT TOTALS ***
CUMULATIVE TOTALS FOR ALL LOCATIONS SUBMITTED - OVERLAPPING OR INTERSECTING LOCATIONS MAY RESULT IN CRASHES COUNTED MORE THAN ONCE
| | | | INFLUENCE CRASHES
| | PROPERTY | | OCCURRING ON
FATAL CRASH STATISTICS | INJURY CRASH STATS | DAMAGE ONLY | TOTALS | INTERSECTING RDWYS
FOR --------------------------------|----------------------|-------------|---------------------------------|--------------------
YEAR CRASHES FATALITIES INJURIES | CRASHES INJURIES | CRASHES | CRASHES FATALITIES INJURIES | AT INT. INFL AREA
| | | |
2012 2 2 0 | 61 88 | 57 | 120 2 88 | 2 2
--------------------------------|----------------------|-------------|---------------------------------|--------------------
TOTAL 2 2 0 | 61 88 | 57 | 120 2 88 | 2 2
N O T I C E: THE INFORMATION CONTAINED IN THIS DOCUMENT (REPORT, SCHEDULE, LIST, OR DATA) HAS BEEN COMPILED FROM
INFORMATION COLLECTED FOR THE PURPOSE OF IDENTIFYING, EVALUATING, OR PLANNING SAFETY ENHANCEMENTS. THIS PRODUCT
IDENTIFIES INFORMATION USED FOR THE PURPOSE OF DEVELOPING HIGHWAY SAFETY CONSTRUCTION IMPROVEMENT PROJECTS WHICH MAY BE
IMPLEMENTED UTILIZING FEDERAL-AID HIGHWAY FUNDS. ANY DOCUMENT DISPLAYING THIS NOTICE SHALL BE USED ONLY FOR THOSE
PURPOSES DEEMED APPROPRIATE BY THE FLORIDA DEPARTMENT OF TRANSPORTATION. SEE TITLE 23, UNITED STATES CODE, SECTION 409.
CCCCCCCCCC AAAAAAAAAA RRRRRRRRR
CCCCCCCCCCC AAAAAAAAAAA RRRRRRRRRRR
CCC AAA AAA RRR RRR
CCC AAA AAA RRR RRR
CCC AAAAAAAAAAA RRRRRRRRRRRR
CCC AAAAAAAAAAA RRRRRRRRRRRR
CCC AAA AAA RRR RRR
CCC AAA AAA RRR RRR
CCCCCCCCCCC AAA AAA RRR RRRR
CCCCCCCCCCC AAA AAA RRR RRRRRR
C R A S H R E P O R T I N G S Y S T E M
N O T I C E: THE INFORMATION CONTAINED IN THIS DOCUMENT (REPORT, SCHEDULE, LIST, OR DATA) HAS BEEN COMPILED FROM
INFORMATION COLLECTED FOR THE PURPOSE OF IDENTIFYING, EVALUATING, OR PLANNING SAFETY ENHANCEMENTS. THIS PRODUCT
IDENTIFIES INFORMATION USED FOR THE PURPOSE OF DEVELOPING HIGHWAY SAFETY CONSTRUCTION IMPROVEMENT PROJECTS WHICH MAY BE
IMPLEMENTED UTILIZING FEDERAL-AID HIGHWAY FUNDS. ANY DOCUMENT DISPLAYING THIS NOTICE SHALL BE USED ONLY FOR THOSE
PURPOSES DEEMED APPROPRIATE BY THE FLORIDA DEPARTMENT OF TRANSPORTATION. SEE TITLE 23, UNITED STATES CODE, SECTION 409.
I/O NAME: ............... CARO134
PROGRAM ID: ............. CARPJ34
REPORT NUMBER: .......... 01
RUN CLASS: .............. A
MESSAGE CLASS: .......... Q
PRINTER DEST: ........... LOCAL
# COPIES: ............... 01
ACCOUNT #: .............. 5590562
SUBMIT W/HOLD? .......... N
USERID: ................. KNHNTCO
VARIABLE DESCRIPTION LEVEL
----------------- ------------------------------ --------
TABLED BY ELEMENTS: 1ST LGHTCOND LIGHTING CONDITION CRASH

REPORT..CARPJ34-1 FLORIDA - DEPARTMENT OF TRANSPORTATION PAGE NO 1
DATE....2013-11-15 C A R - TABLE OF CRASH STATISTICS *** TABLED BY ***
TIME....14:29:22:3 *** TABLES *** 1ST LGHTCOND LIGHTING CONDITION
COMMENT: *** 1ST LEVEL - CRASH LEVEL REPORT ***
FROM: 01/01/2012 TO 12/31/2012 RAMPS INCL
FROM CO/SEC/SUB: 77 160 000 MP: 004.050 INFL INCL
TO CO/SEC/SUB: 77 160 000 MP: 014.135 CR/OS INCL
VARIABLE DESCRIPTION CODE CODE DESCRIPTION
------------------ ------------------------------ ---- -----------------------------
1ST LGHTCOND LIGHTING CONDITION
FATAL CRASH STATISTICS INJURY CRASH STATS PROPERTY TOTALS
****************************** ****************** DAMAGE ONLY *****************************
CODE CODE DESCRIPTION CRASHES FATALITIES INJURIES CRASHES INJURIES CRASHES CRASHES FATALITIES INJURIES
---- ------------------------------ ------- ---------- -------- ------- -------- ------- ------- ---------- --------
01 DAYLIGHT 0 0 0 58 100 51 109 0 100
02 DUSK 0 0 0 3 4 3 6 0 4
03 DAWN 0 0 0 2 2 1 3 0 2
04 DARK (STREET LIGHT) 2 2 2 15 28 14 31 2 30
05 DARK (NO STREET LIGHT) 0 0 0 12 16 16 28 0 16
88 UNKNOWN 0 0 0 0 0 1 1 0 0
- - - - - - - - - - - - - - - - - - - - - - - - - - - - - - - - - - - - - - - - - - - - - - - - - - - - - - - - - - - - - - - - - -
SUB TOTAL: 2 2 2 90 150 86 178 2 152

REPORT..CARPJ34-1 FLORIDA - DEPARTMENT OF TRANSPORTATION PAGE NO 2
DATE....2013-11-15 C A R - TABLE OF CRASH STATISTICS *** TABLED BY ***
TIME....14:29:22:3 *** TABLES *** 1ST LGHTCOND LIGHTING CONDITION
COMMENT: *** REPORT TOTALS ***
FROM: 01/01/2012 TO 12/31/2012 RAMPS INCL
FROM CO/SEC/SUB: 77 160 000 MP: 004.050 INFL INCL
TO CO/SEC/SUB: 77 160 000 MP: 014.135 CR/OS INCL
FATAL CRASH STATISTICS INJURY CRASH STATS PROPERTY TOTALS
****************************** ****************** DAMAGE ONLY *****************************
CRASHES FATALITIES INJURIES CRASHES INJURIES CRASHES CRASHES FATALITIES INJURIES
------- ---------- -------- ------- -------- ------- ------- ---------- --------
TOTAL CRASHES: 2 2 2 90 150 86 178 2 152
FATAL CRASH STATISTICS INJURY CRASH STATS PROPERTY TOTALS
****************************** ****************** DAMAGE ONLY *****************************
VEH/PEDS FATALITIES INJURIES VEH/PEDS INJURIES VEH/PEDS VEH/PEDS FATALITIES INJURIES
-------- ---------- -------- -------- -------- -------- -------- ---------- --------
TOTAL VEHICLES: 2 2 1 111 151 213 326 2 152
TOTAL PEDESTRIANS: 0 0 0 0 0 0 0 0 0
FATAL CRASH STATISTICS INJURY CRASH STATS NON TOTALS
****************************** ****************** INJURED *****************************
FATAL PERSONS INJURED PERSONS PERSONS PERSONS FATALITIES INJURIES
------------- --------------- ------- ------- ---------- --------
TOTAL PERSONS: 2 152 354 508 2 152
REPORT...CARPJ34-01 FLORIDA - DEPARTMENT OF TRANSPORTATION PAGE NO: 3
DATE...11/15/2013 C A R - CRASH ANALYSIS REPORTING SYSTEM USERID: KNHNTCO
TIME...14:29:23 *** TABLES *** I/O.... CARO134
COMMENT:
FROM: 01/01/2012 TO 12/31/2012 RAMPS INCL
FROM CO/SEC/SUB: 77 160 000 MP: 004.050 INFL INCL
TO CO/SEC/SUB: 77 160 000 MP: 014.135 CR/OS INCL
| | | | INFLUENCE CRASHES
| | PROPERTY | | OCCURRING ON
FATAL CRASH STATISTICS | INJURY CRASH STATS | DAMAGE ONLY | TOTALS | INTERSECTING RDWYS
FOR --------------------------------|----------------------|-------------|---------------------------------|--------------------
YEAR CRASHES FATALITIES INJURIES | CRASHES INJURIES | CRASHES | CRASHES FATALITIES INJURIES | AT INT. INFL AREA
| | | |
2012 2 2 2 | 90 150 | 86 | 178 2 152 | 5 4
--------------------------------|----------------------|-------------|---------------------------------|--------------------
TOTAL 2 2 2 | 90 150 | 86 | 178 2 152 | 5 4
N O T I C E: THE INFORMATION CONTAINED IN THIS DOCUMENT (REPORT, SCHEDULE, LIST, OR DATA) HAS BEEN COMPILED FROM
INFORMATION COLLECTED FOR THE PURPOSE OF IDENTIFYING, EVALUATING, OR PLANNING SAFETY ENHANCEMENTS. THIS PRODUCT
IDENTIFIES INFORMATION USED FOR THE PURPOSE OF DEVELOPING HIGHWAY SAFETY CONSTRUCTION IMPROVEMENT PROJECTS WHICH MAY BE
IMPLEMENTED UTILIZING FEDERAL-AID HIGHWAY FUNDS. ANY DOCUMENT DISPLAYING THIS NOTICE SHALL BE USED ONLY FOR THOSE
PURPOSES DEEMED APPROPRIATE BY THE FLORIDA DEPARTMENT OF TRANSPORTATION. SEE TITLE 23, UNITED STATES CODE, SECTION 409.

REPORT...CARPJ34-01 FLORIDA - DEPARTMENT OF TRANSPORTATION PAGE NO: 1
DATE...11/15/2013 C A R - CRASH ANALYSIS REPORTING SYSTEM USERID: KNHNTCO
TIME...14:29:23 *** TABLES *** I/O.... CARO134
*** REPORT TOTALS ***
CUMULATIVE TOTALS FOR ALL LOCATIONS SUBMITTED - OVERLAPPING OR INTERSECTING LOCATIONS MAY RESULT IN CRASHES COUNTED MORE THAN ONCE
| | | | INFLUENCE CRASHES
| | PROPERTY | | OCCURRING ON
FATAL CRASH STATISTICS | INJURY CRASH STATS | DAMAGE ONLY | TOTALS | INTERSECTING RDWYS
FOR --------------------------------|----------------------|-------------|---------------------------------|--------------------
YEAR CRASHES FATALITIES INJURIES | CRASHES INJURIES | CRASHES | CRASHES FATALITIES INJURIES | AT INT. INFL AREA
| | | |
2012 2 2 2 | 90 150 | 86 | 178 2 152 | 5 4
--------------------------------|----------------------|-------------|---------------------------------|--------------------
TOTAL 2 2 2 | 90 150 | 86 | 178 2 152 | 5 4
N O T I C E: THE INFORMATION CONTAINED IN THIS DOCUMENT (REPORT, SCHEDULE, LIST, OR DATA) HAS BEEN COMPILED FROM
INFORMATION COLLECTED FOR THE PURPOSE OF IDENTIFYING, EVALUATING, OR PLANNING SAFETY ENHANCEMENTS. THIS PRODUCT
IDENTIFIES INFORMATION USED FOR THE PURPOSE OF DEVELOPING HIGHWAY SAFETY CONSTRUCTION IMPROVEMENT PROJECTS WHICH MAY BE
IMPLEMENTED UTILIZING FEDERAL-AID HIGHWAY FUNDS. ANY DOCUMENT DISPLAYING THIS NOTICE SHALL BE USED ONLY FOR THOSE
PURPOSES DEEMED APPROPRIATE BY THE FLORIDA DEPARTMENT OF TRANSPORTATION. SEE TITLE 23, UNITED STATES CODE, SECTION 409.

REPORT..CARPJ85-
FLORIDA - DEPARTMENT OF TRANSPORTATION
PAGE NO
0 DATE....05/08/2013
C A R - CRASH ANALYSIS REPORTING SYSTEM
TIME....15:30:04
SEGMENT BASED CRASH RATE STATISTICS
AS OF: 2012-11-05
COMMENT: USERID: TO562AN
====================================================================================================================================
CC - CRASH RATE CATEGORY CODE DESCRIPTIONS AVG/YEAR $/CRASH@CRA C-NO-INJ C-POSSIBLE C-N-INCAP C-INCAP C-FATAL C-NT-FATAL
I/A CRASH CRASHES MV MILES CRASH RATE CL MILES $/CRASH@INJ P-NO-INJ P-POSSIBLE P-N-INCAP P-INCAP P-FATAL P-NT-FATAL
====================================================================================================================================
DETAIL PRINT LINE LEGEND - REFER TO SHORT TITLES IN THE HEADING LINES ABOVE
CC
- CRASH RATE CATEGORY CODE AND DESCRIPTION
CRASHES
- TOTAL NUMBER OF CRASHES
I/A CRASH - TOTAL NUMBER OF "INLUENCE AREA" CRASHES
MV MILES - MILLION VEHICLE MILES
CRASH RATE - AVERAGE SEGMENT CRASH RATE
CL MILES - ROADWAY CENTER LINE MILES
$ PER CRASH - AVERAGE ECONOMIC LOSS PER CRASH
C-NO-INJ - CRASHES WITH PROPERTY DAMAGE ONLY
C-POSSIBLE - CRASHES WITH POSSIBLE INJURIES
C-N-INCAP - CRASHES WITH NON-INCAPACITATE INJURIES
C-INCAP
- CRASHES WITH INCAPACITATE INJURIES
C-FATAL
- CRASHES WITH FATALITIES
C-NT-FATAL - CRASHES WITH NON-TRAFFIC FATALITIES
$ PER INJRY - AVERAGE ECONOMIC LOSS PER INJURY
P-NO-INJ - PEOPLE WITH NO INJURIES
P-POSS-INJ - PEOPLE WITH POSSIBLE INJURIES
P-N-INCAP - PEOPLE WITH NON-INCAPACITATING INJURIES
P-INCAP
- PEOPLE WITH INCAPACITATING INJURIES
P-FATAL
- FATALITIES
P-NT-FATAL - NON-TRAFFIC FATAILITES
CURRENT BASE CALENDAR YEAR:
2011
CARPJ81 CRASH EXTRACT DATE:
2012-11-05 21:00:12
CARPJ82 FREEZE BREAK EXTRACT DATE:
2012-11-05 21:11:48
CARPJ84 YEARLY ROLLUPS AND WEIGHTS DATE: 2012-11-05 21:12:31
CRASH DOLLAR VALUE WEIGHTS 1 THROUGH 6:
6,500
67,890
111,228 557,752 6,820,000
6,500
INJURY DOLLAR VALUE WEIGHTS 1 THROUGH 6:
0 45,260
85,560
429,040 6,200,000
0
AVAILABLE YEARS 2011 2010 2009 2008 2007
1 YEAR RATES
_ _ _ _ _
2 YEAR RATES
_ _ _ _
3 YEAR RATES
X _ _
4 YEAR RATES
_ _
5 YEAR RATES
_
STATE WIDE: _ STATE WIDE X BY DISTRICT _ BY COUNTY
DISTRICTS: 5 _ _ _ _ _ _ _ BY DISTRICT _ BY COUNTY
COUNTIES: __ __ __ __ __ __ __ __ __ __ __ __ __ __ __

REPORT..CARPJ85- FLORIDA - DEPARTMENT OF TRANSPORTATION PAGE NO 13
DATE....05/08/2013 C A R - CRASH ANALYSIS REPORTING SYSTEM
TIME....15:30:04 SEGMENT BASED CRASH RATE STATISTICS AS OF: 2012-11-05
DISTRICT: 05 COUNTY: ALL FOR 2009 - 2011
COMMENT: USERID: TO562AN
====================================================================================================================================
CC - CRASH RATE CATEGORY CODE DESCRIPTIONS AVG/YEAR $/CRASH@CRA C-NO-INJ C-POSSIBLE C-N-INCAP C-INCAP C-FATAL C-NT-FATAL
I/A CRASH CRASHES MV MILES CRASH RATE CL MILES $/CRASH@INJ P-NO-INJ P-POSSIBLE P-N-INCAP P-INCAP P-FATAL P-NT-FATAL
====================================================================================================================================
01 - INTERSTATE URBAN 177,694 3,559 1,922 1,503 467 112 7
24 7,546 15,596.137 0.485 183.504 190,291 15,843 3,706 2,243 684 127 10
------------------------------------------------------------------------------------------------------------------------------------
02 - INTERSTATE RURAL 219,705 791 347 356 204 29 2
5 1,724 4,559.945 0.379 95.706 259,182 3,182 795 621 331 35 2
------------------------------------------------------------------------------------------------------------------------------------
03 - TOLL ROAD URBAN 126,821 615 431 407 59 12 0
18 1,506 4,478.327 0.340 92.201 134,722 2,429 731 565 72 15 1
------------------------------------------------------------------------------------------------------------------------------------
04 - TOLL ROAD RURAL 123,711 151 80 97 23 2 0
4 349 1,121.889 0.314 29.656 134,464 724 186 156 31 2 1
------------------------------------------------------------------------------------------------------------------------------------
05 - URBAN OTHER LIMITED ACCESS 456,234 66 37 24 14 8 0
2 147 447.343 0.333 12.030 487,910 326 76 52 21 9 0
------------------------------------------------------------------------------------------------------------------------------------
06 - RURAL OTHER LIMITED ACCESS 0 0 0 0 0 0 0
0 0 0.000 0.000 0.000 0 0 0 0 0 0 0
------------------------------------------------------------------------------------------------------------------------------------
07 - RAMP URBAN 115,207 846 489 379 112 10 0
1,482 354 1.157 0.000 7.871 106,052 3,300 766 489 131 10 0
------------------------------------------------------------------------------------------------------------------------------------
08 - RAMP RURAL 123,022 3,149 1,903 1,403 354 50 3
4,478 2,384 466.299 0.000 195.092 125,200 14,131 3,267 1,916 452 57 6
------------------------------------------------------------------------------------------------------------------------------------
10 - URBAN 2-3LN 2WY DIVD RASD 112,850 74 23 17 5 1 0
31 89 58.569 2.048 3.992 112,204 273 45 26 7 1 0
------------------------------------------------------------------------------------------------------------------------------------
11 - URBAN 2-3LN 2WY DIVD PAVD 132,493 216 108 70 21 4 0
86 333 175.560 2.386 11.728 120,425 905 156 92 25 4 0
------------------------------------------------------------------------------------------------------------------------------------
12 - URBAN 2-3LN 2WY UNDIVD 142,041 201 96 89 25 4 0
179 236 184.137 2.253 23.035 135,345 867 142 116 35 4 0
------------------------------------------------------------------------------------------------------------------------------------
13 - SUBURBAN 2-3LN 2WY DIVD RASD 191,667 110 53 54 13 4 0
46 188 123.029 1.901 7.870 196,921 466 118 86 20 4 0
------------------------------------------------------------------------------------------------------------------------------------
14 - SUBURBAN 2-3LN 2WY DIVD PAVD 146,174 517 323 274 98 10 0
206 1,016 978.366 1.249 69.182 146,659 2,428 645 402 125 10 1
------------------------------------------------------------------------------------------------------------------------------------
15 - SUBURBAN 2-3LN 2WY UNDIVD 248,682 413 235 255 128 21 0
102 950 1,890.638 0.556 187.843 254,299 2,020 463 385 180 22 0
------------------------------------------------------------------------------------------------------------------------------------
16 - RURAL 2-3LN 2WY DIVD RASD 136,393 14 11 15 7 0 0
18 29 29.563 1.589 2.472 132,653 66 26 19 8 0 0
------------------------------------------------------------------------------------------------------------------------------------
0.485
0.379
INTERSTATE URBAN
INTERSTATE RURAL

FLORIDA DEPARTMENT OF TRANSPORTATION TRANSPORTATION STATISTICS OFFICE 2012 HISTORICAL AADT REPORT
COUNTY: 77 - SEMINOLE
SITE: 0343 - SR-400/I-4,1.6 MI E OF SR-434,SEMINOLE CO.
YEAR AADT DIRECTION 1 DIRECTION 2 *K FACTOR D FACTOR T FACTOR---- ---------- ------------ ------------ --------- -------- --------2012 132663 C E 67176 W 65487 8.00 52.50 6.502011 132557 C E 67022 W 65535 8.00 52.70 6.402010 133908 C E 67646 W 66262 8.55 52.89 6.502009 132476 C E 66567 W 65909 8.65 52.77 6.602008 131571 C E 66398 W 65173 8.71 53.09 6.802007 137333 C E 69282 W 68051 8.41 52.29 7.102006 137055 C E 69025 W 68030 8.32 52.47 7.202005 133746 C E 67306 W 66440 8.40 52.60 7.102004 126297 C E 63246 W 63051 8.50 51.90 6.802003 123133 C E 61601 W 61532 8.10 51.20 6.202002 121650 C E 60981 W 60669 8.10 52.50 6.402001 119429 C E 59616 W 59813 9.60 55.10 5.202000 114381 C E 57048 W 57333 8.90 54.20 5.301999 111672 C E 55316 W 56356 10.00 57.50 5.401998 105793 C E 52818 W 52975 9.20 53.50 5.20
AADT FLAGS: C = COMPUTED; E = MANUAL ESTIMATE; F = FIRST YEAR ESTIMATE S = SECOND YEAR ESTIMATE; T = THIRD YEAR ESTIMATE; X = UNKNOWN *K FACTOR: STARTING WITH YEAR 2011 IS STANDARDK, PRIOR YEARS ARE K30 VALUES

Site InformationFeature 1
Road Name I-4Site 790484
Description ON I-4, 0.337 MI E. OF ST. JOHNS RIVER BRIDGE (ITS)
Section 79110000Milepoint 2.5AADT 106500Site Type PortableClass Data NoK Factor 9D Factor 54T Factor 11.1
TRAFFIC REPORTS (provided in format)Volusia County Annual Average Daily Traffic
Historical AADT DataSynopsis 790484-20120418Synopsis 790484-20120516Synopsis 790484-20120815
Print this window. Close this window.
Page 1 of 1FDOT Florida Traffic Online Identify Information
12/10/2013http://www2.dot.state.fl.us/FloridaTrafficOnline/displayAttributeDataAll3.aspx
Site InformationFeature 1
Road Name I-4Site 770266Description ON I-4, 0.146 MI. E OF SR-46 (RCLP)Section 77160000Milepoint 12.919AADT 103000Site Type PortableClass Data NoK Factor 9D Factor 54T Factor 10.4
TRAFFIC REPORTS (provided in format)Seminole County Annual Average Daily Traffic
Historical AADT DataSynopsis 770266-20120326Synopsis 770266-20120327
Print this window. Close this window.
Page 1 of 1FDOT Florida Traffic Online Identify Information
11/22/2013http://www2.dot.state.fl.us/FloridaTrafficOnline/displayAttributeDataAll3.aspx

Site InformationFeature 1
Road Name I-4Site 799906
Description ON I-4,169' E OF ENTERPRISE RD O/P,VOLUSIA CO.
Section 79110000Milepoint 4.668AADT 93854Site Type TelemeteredClass Data YesK Factor 9D Factor 55.6T Factor 8
TRAFFIC REPORTS (provided in format)Volusia County Annual Average Daily Traffic
Annual Vehicle ClassificationSITE 799906 Directional AADTs
Highest 200 HoursHistorical AADT DataHourly Continuous CountsVehicle Class History
Print this window. Close this window.
Page 1 of 1FDOT Florida Traffic Online Identify Information
12/10/2013http://www2.dot.state.fl.us/FloridaTrafficOnline/displayAttributeDataAll3.aspx

Site InformationFeature 1
Road Name I-4Site 791003Description ON I-4, 1.236 MI. W OF SR-472 (ITS)Section 79110000Milepoint 8.28AADT 88000Site Type PortableClass Data NoK Factor 9D Factor 54T Factor 11.1
TRAFFIC REPORTS (provided in format)Volusia County Annual Average Daily Traffic
Historical AADT DataSynopsis 791003-20120418Synopsis 791003-20120815
Print this window. Close this window.
Page 1 of 1FDOT Florida Traffic Online Identify Information
12/10/2013http://www2.dot.state.fl.us/FloridaTrafficOnline/displayAttributeDataAll3.aspx

2-W
AY A
ADT
TURN
ING
MOVE
MENT
S IN
YEA
R 20
112-
WAY
AAD
T TU
RNIN
G MO
VEME
NTS
IN Y
EAR
2020
6630
069
500
16%
69%
15%
18%
66%
16%
1039
345
924
9983
1990
012
349
4617
010
962
2190
0
9962
43%
1094
245
%55
0027
4312
%23
400
6200
3107
13%
2430
048
500
1069
446
%54
000
1025
142
%43
%10
372
4680
046
%12
326
4860
024
300
11%
2743
2700
012
%31
0746
%11
135
2140
043
%11
548
2050
0
2220
023
100
1111
345
962
1067
411
525
4621
210
230
16%
68%
16%
17%
68%
15%
6780
068
000
2-W
AY A
ADT
TURN
ING
MOVE
MENT
S IN
YEA
R 20
302-
WAY
AAD
T TU
RNIN
G MO
VEME
NTS
IN Y
EAR
2040
7300
076
600
20%
64%
16%
22%
61%
17%
1459
046
432
1199
524
000
1688
846
681
1298
025
900
1197
447
%12
960
49%
7000
3499
14%
2530
078
0038
7915
%26
300
6000
098
2739
%66
200
9461
36%
49%
1456
450
600
51%
1686
152
600
3000
012
%34
9933
100
12%
3879
40%
1195
219
600
37%
1230
918
900
2390
024
600
1192
746
476
9806
1228
346
727
9440
17%
68%
14%
18%
68%
14%
6820
068
500
I-4
2470
0
9240
0
I-4
9190
0
1326
0013
9000
2080
0
PROJ
ECT
TRAF
FIC
FOR
I-4 A
T SR
434:
TO
1364
0013
7000
9290
093
400
2920
0
SR 43
4
I-4
I-4
SR 43
4
SR 43
4
I-413
6000
1460
0015
3100
1356
00
I-4I-4
SR 43
4
SR 43
4SR
434
SR 43
4
SR 43
4
I-4
3370
0
2-W
AY A
ADT
TURN
ING
MOVE
MENT
S IN
YEA
R 20
112-
WAY
AAD
T TU
RNIN
G MO
VEME
NTS
IN Y
EAR
2020
5480
061
600
15%
64%
21%
13%
69%
18%
8124
3516
411
462
2290
080
2142
349
1125
422
500
1141
657
%11
215
56%
3400
1764
9%20
000
3000
1537
8%20
000
2960
068
2034
%29
600
7248
36%
55%
8103
4000
054
%79
9040
000
1480
011
%16
7914
800
10%
1461
34%
4968
1370
036
%52
9914
500
9800
1050
048
6235
229
6859
5192
4241
872
8510
%75
%15
%9%
77%
13%
4700
054
900
2-W
AY A
ADT
TURN
ING
MOVE
MENT
S IN
YEA
R 20
302-
WAY
AAD
T TU
RNIN
G MO
VEME
NTS
IN Y
EAR
2040
6930
076
900
11%
73%
16%
10%
76%
14%
7873
5039
210
997
2200
077
0258
477
1072
121
400
1096
355
%10
691
53%
2600
1345
7%20
000
2300
1196
6%20
000
2960
076
9238
%29
600
8113
41%
53%
7833
4000
052
%76
5540
000
1480
09%
1277
1480
08%
1134
38%
5640
1540
040
%59
6216
300
1120
011
800
5532
5046
477
2658
5258
552
8146
9%79
%12
%8%
81%
11%
6370
072
600
I-4
1600
0
8480
0
I-4
7040
0
1095
0012
3200
1620
0
PROJ
ECT
TRAF
FIC
FOR
I-4 A
T SR
46:
TO
1274
0014
5200
1009
0011
7000
1570
0
SR 46
I-4
I-4
SR 46
SR 46
I-410
9800
1386
0015
3800
9400
0
I-4I-4
SR 46
SR 46
SR 46
SR 46
SR 46
I-4
1540
0

2-W
AY A
ADT
TURN
ING
MOVE
MENT
S IN
YEA
R 20
112-
WAY
AAD
T TU
RNIN
G MO
VEME
NTS
IN Y
EAR
2020
3530
046
700
25%
66%
10%
8%87
%5%
8747
2310
234
0261
0037
7640
707
2204
4400
2655
32%
2190
20%
2500
1684
20%
8300
1600
811
8%10
700
3740
039
1147
%35
400
7686
72%
36%
3598
1930
021
%36
7321
400
9900
9%86
317
700
4%77
155
%54
4010
600
75%
1323
015
400
2250
026
300
1703
931
021
6690
1308
840
825
7711
31%
57%
12%
21%
66%
13%
5480
061
600
2-W
AY A
ADT
TURN
ING
MOVE
MENT
S IN
YEA
R 20
302-
WAY
AAD
T TU
RNIN
G MO
VEME
NTS
IN Y
EAR
2040
5940
072
100
15%
77%
7%20
%71
%9%
9075
4600
143
1786
0014
688
5123
361
7812
300
4289
32%
6136
38%
3300
1668
12%
1340
048
0024
4915
%16
100
5260
074
3656
%69
900
7514
47%
34%
8890
2680
041
%14
442
3220
026
300
6%15
9935
000
7%23
5760
%15
823
1490
052
%18
151
1510
0
3140
036
000
1556
946
216
7477
1781
251
523
7564
22%
67%
11%
23%
67%
10%
6930
076
900
I-4
7400
8150
0
I-4
5410
0
7260
093
400
1230
0
PROJ
ECT
TRAF
FIC
FOR
I-4 A
T US
17/92
: T
O
1386
0015
3800
9220
010
2800
1800
0
S 17
9
I-4
I-4
S 17
9
S 17
9
I-412
3200
1188
0014
4200
8730
0
I-4I-4
S 17
9
S 17
9S
179
S 17
9
S 17
9
I-4
2910
0
2-W
AY A
ADT
TURN
ING
MOVE
MENT
S IN
YEA
R 20
112-
WAY
AAD
T TU
RNIN
G MO
VEME
NTS
IN Y
EAR
2020
4680
051
300
6%90
%4%
6%88
%6%
2716
4210
919
7540
0030
7844
998
3224
6500
2010
33%
3280
33%
600
276
4%62
0010
0047
85%
1010
016
600
3864
63%
1900
063
0263
%33
%26
9312
400
32%
3050
2020
083
003%
283
9500
5%48
964
%52
7478
0063
%59
6912
700
1050
011
900
5258
4209
938
9359
5144
972
6348
10%
82%
8%10
%79
%11
%51
300
5730
0
2-W
AY A
ADT
TURN
ING
MOVE
MENT
S IN
YEA
R 20
302-
WAY
AAD
T TU
RNIN
G MO
VEME
NTS
IN Y
EAR
2040
5630
061
300
6%86
%8%
6%84
%10
%34
7248
224
4604
9300
3860
5146
459
7712
100
4684
33%
6080
32%
1500
718
5%14
400
2000
972
5%18
800
2180
090
0362
%24
600
1169
862
%32
%34
3828
800
31%
3820
3760
010
900
7%73
412
300
8%99
462
%67
3118
100
61%
7487
2350
0
1340
015
000
6713
4818
090
6774
6951
402
1178
010
%75
%14
%11
%73
%17
%64
000
7070
0
I-4
6100
9000
0
I-4
8420
0
9360
010
2600
5400
PROJ
ECT
TRAF
FIC
FOR
I-4 A
T Di
rkse
n Dr
: T
O
1280
0014
1300
9640
010
2900
6900
Dr
s D
r
I-4
I-4
Dr
s D
r
Dr
s D
r
I-411
4600
1126
0012
2600
1025
00
I-4I-4
Dr
s D
r
Dr
s D
rD
rs
Dr
Dr
s D
r
Dr
s D
r
I-4
7700
2-W
AY A
ADT
TURN
ING
MOVE
MENT
S IN
YEA
R 20
112-
WAY
AAD
T TU
RNIN
G MO
VEME
NTS
IN Y
EAR
2020
3980
044
700
9%84
%7%
10%
83%
7%35
0133
569
2680
5300
4368
3724
431
0462
00
2663
30%
3085
32%
1300
663
7%90
0015
0075
98%
9600
2360
056
7563
%26
800
5777
60%
30%
3542
1800
033
%44
1719
200
1180
06%
653
1340
06%
747
64%
7555
1130
062
%82
7711
500
1510
016
600
7586
3354
656
6883
1537
216
5770
16%
72%
12%
16%
73%
11%
4680
051
300
2-W
AY A
ADT
TURN
ING
MOVE
MENT
S IN
YEA
R 20
302-
WAY
AAD
T TU
RNIN
G MO
VEME
NTS
IN Y
EAR
2040
5020
055
800
11%
82%
7%11
%81
%7%
5355
4132
035
5871
0063
6245
391
3998
8000
3536
34%
3973
36%
1700
859
8%10
300
1900
953
9%11
000
3060
059
1657
%34
400
6074
55%
35%
5413
2060
037
%64
2822
000
1530
06%
845
1720
05%
938
59%
9063
1180
057
%98
3412
100
1820
019
700
9107
4128
659
0798
8545
350
6064
16%
73%
10%
16%
74%
10%
5630
061
300
I-4
8800
7450
0
I-4
6710
0
7960
089
400
7000
PROJ
ECT
TRAF
FIC
FOR
I-4 A
T Sa
xon
Blvd
: T
O
1126
0012
2600
8260
090
700
1080
0
Sao
B
I-4
I-4
Sao
B
Sao
B
I-410
2600
1004
0011
1600
9360
0
I-4I-4
Sao
B
Sao
BSa
o B
Sao
B
Sao
B
I-4
1280
0

2-W
AY A
ADT
TURN
ING
MOVE
MENT
S IN
YEA
R 20
112-
WAY
AAD
T TU
RNIN
G MO
VEME
NTS
IN Y
EAR
2020
3530
041
400
13%
74%
13%
16%
71%
13%
4575
2599
146
8495
0064
7329
570
5383
1090
0
4772
36%
5477
39%
2700
1344
10%
1310
033
0016
5112
%14
000
2560
069
8553
%32
800
6903
49%
36%
4638
2620
040
%65
5628
000
1280
010
%13
3916
400
10%
1645
53%
6773
1410
050
%82
4213
900
1360
016
600
6831
2584
170
7883
1929
394
7002
17%
65%
18%
19%
66%
16%
3980
044
700
2-W
AY A
ADT
TURN
ING
MOVE
MENT
S IN
YEA
R 20
302-
WAY
AAD
T TU
RNIN
G MO
VEME
NTS
IN Y
EAR
2040
4830
055
200
18%
69%
13%
20%
68%
12%
8687
3351
160
8912
300
1097
237
431
6747
1360
0
6189
41%
6852
43%
3900
1959
13%
1510
045
0022
4314
%16
100
4100
069
1746
%49
300
7004
44%
43%
8792
3020
045
%11
097
3220
020
500
10%
1953
2470
09%
2237
48%
9802
1390
046
%11
316
1410
0
1970
022
800
9900
3330
970
2411
434
3719
971
1620
%66
%14
%21
%67
%13
%50
200
5580
0I-4
I-4
SR 47
SR 47
SR 47
SR 47
SR 47
I-4
2210
0
SR 47
I-4
I-4
SR 47
SR 47
I-489
400
9660
011
0300
7950
0
PROJ
ECT
TRAF
FIC
FOR
I-4 A
T SR
472:
TO
1004
0011
1600
6680
074
600
1750
0
I-4
1300
0
5900
0
I-4
5180
0
7060
082
800
9200

COUNTY: 77STATION: 0266DESCRIPTION: ON I-4, 0.146 MI. E OF SR-46 (RCLP) UC 2008START DATE: 03/27/2012START TIME: 1200--------------------------------------------------------------------------------------- DIRECTION: E DIRECTION: W COMBINEDTIME 1ST 2ND 3RD 4TH TOTAL 1ST 2ND 3RD 4TH TOTAL TOTAL---------------------------------------------------------------------------------------0000 212 195 158 124 689 | 133 95 85 57 370 | 10590100 120 108 105 94 427 | 57 64 73 69 263 | 6900200 92 34 5 1 132 | 53 46 64 63 226 | 3580300 235 77 98 66 476 | 77 100 90 120 387 | 8630400 81 102 120 142 445 | 139 175 212 246 772 | 12170500 147 185 200 244 776 | 368 509 580 705 2162 | 29380600 308 464 468 515 1755 | 949 1171 1296 1371 4787 | 65420700 592 668 742 692 2694 | 1448 1455 1561 1381 5845 | 85390800 666 750 717 680 2813 | 1416 1261 1147 1012 4836 | 76490900 707 774 819 767 3067 | 914 908 853 847 3522 | 65891000 744 759 812 840 3155 | 741 828 843 824 3236 | 63911100 805 884 840 817 3346 | 808 765 729 752 3054 | 64001200 809 821 766 789 3185 | 708 733 724 700 2865 | 60501300 837 813 809 821 3280 | 729 690 734 699 2852 | 61321400 888 847 895 900 3530 | 776 699 749 745 2969 | 64991500 991 1031 1129 1200 4351 | 788 787 823 785 3183 | 75341600 1234 1251 1390 1404 5279 | 771 764 901 873 3309 | 85881700 1591 1555 1342 1268 5756 | 1022 952 914 841 3729 | 94851800 1353 1278 1132 966 4729 | 773 759 672 553 2757 | 74861900 933 789 715 628 3065 | 525 478 512 438 1953 | 50182000 611 639 578 591 2419 | 444 397 395 374 1610 | 40292100 603 636 562 440 2241 | 377 298 304 288 1267 | 35082200 440 404 372 315 1531 | 233 241 229 165 868 | 23992300 296 278 230 212 1016 | 159 118 122 115 514 | 1530---------------------------------------------------------------------------------------24-HOUR TOTALS: 60157 57336 117493--------------------------------------------------------------------------------------- PEAK VOLUME INFORMATION DIRECTION: E DIRECTION: W COMBINED DIRECTIONS HOUR VOLUME HOUR VOLUME HOUR VOLUMEA.M. 845 2980 700 5845 715 8581P.M. 1630 5940 1645 3761 1630 9688DAILY 1630 5940 700 5845 1630 9688
GENERATED BY SPS 5.0.29
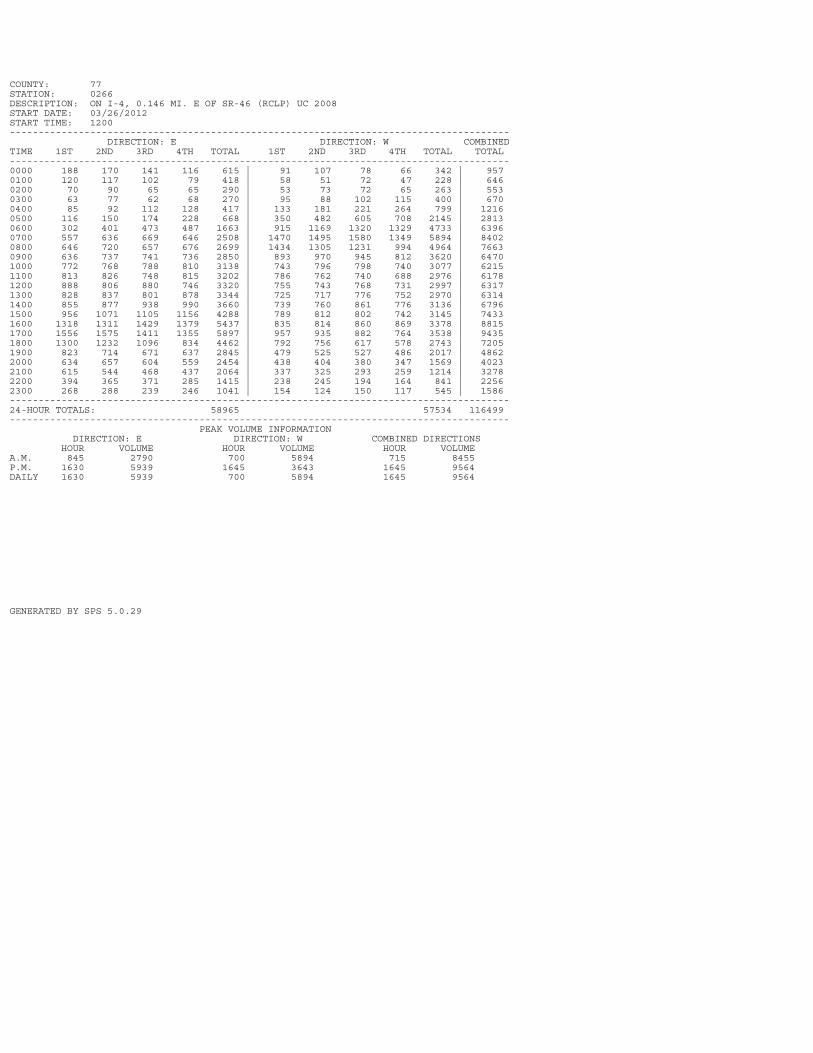
COUNTY: 77STATION: 0266DESCRIPTION: ON I-4, 0.146 MI. E OF SR-46 (RCLP) UC 2008START DATE: 03/26/2012START TIME: 1200--------------------------------------------------------------------------------------- DIRECTION: E DIRECTION: W COMBINEDTIME 1ST 2ND 3RD 4TH TOTAL 1ST 2ND 3RD 4TH TOTAL TOTAL---------------------------------------------------------------------------------------0000 188 170 141 116 615 | 91 107 78 66 342 | 9570100 120 117 102 79 418 | 58 51 72 47 228 | 6460200 70 90 65 65 290 | 53 73 72 65 263 | 5530300 63 77 62 68 270 | 95 88 102 115 400 | 6700400 85 92 112 128 417 | 133 181 221 264 799 | 12160500 116 150 174 228 668 | 350 482 605 708 2145 | 28130600 302 401 473 487 1663 | 915 1169 1320 1329 4733 | 63960700 557 636 669 646 2508 | 1470 1495 1580 1349 5894 | 84020800 646 720 657 676 2699 | 1434 1305 1231 994 4964 | 76630900 636 737 741 736 2850 | 893 970 945 812 3620 | 64701000 772 768 788 810 3138 | 743 796 798 740 3077 | 62151100 813 826 748 815 3202 | 786 762 740 688 2976 | 61781200 888 806 880 746 3320 | 755 743 768 731 2997 | 63171300 828 837 801 878 3344 | 725 717 776 752 2970 | 63141400 855 877 938 990 3660 | 739 760 861 776 3136 | 67961500 956 1071 1105 1156 4288 | 789 812 802 742 3145 | 74331600 1318 1311 1429 1379 5437 | 835 814 860 869 3378 | 88151700 1556 1575 1411 1355 5897 | 957 935 882 764 3538 | 94351800 1300 1232 1096 834 4462 | 792 756 617 578 2743 | 72051900 823 714 671 637 2845 | 479 525 527 486 2017 | 48622000 634 657 604 559 2454 | 438 404 380 347 1569 | 40232100 615 544 468 437 2064 | 337 325 293 259 1214 | 32782200 394 365 371 285 1415 | 238 245 194 164 841 | 22562300 268 288 239 246 1041 | 154 124 150 117 545 | 1586---------------------------------------------------------------------------------------24-HOUR TOTALS: 58965 57534 116499--------------------------------------------------------------------------------------- PEAK VOLUME INFORMATION DIRECTION: E DIRECTION: W COMBINED DIRECTIONS HOUR VOLUME HOUR VOLUME HOUR VOLUMEA.M. 845 2790 700 5894 715 8455P.M. 1630 5939 1645 3643 1645 9564DAILY 1630 5939 700 5894 1645 9564
GENERATED BY SPS 5.0.29

COUNTY: 79STATION: 0484DESCRIPTION: ON I-4, 0.337 MI E. OF ST. JOHNS RIVER BRIDGE (ITSSTART DATE: 08/15/2012START TIME: 0000--------------------------------------------------------------------------------------- DIRECTION: E DIRECTION: W COMBINEDTIME 1ST 2ND 3RD 4TH TOTAL 1ST 2ND 3RD 4TH TOTAL TOTAL---------------------------------------------------------------------------------------0000 194 191 161 136 682 | 97 104 85 71 357 | 10390100 106 62 53 54 275 | 52 1 0 0 53 | 3280200 34 42 284 74 434 | 0 162 67 70 299 | 7330300 79 85 42 86 292 | 62 86 98 97 343 | 6350400 82 76 79 117 354 | 121 156 191 232 700 | 10540500 102 169 186 216 673 | 288 430 554 690 1962 | 26350600 264 346 464 389 1463 | 720 1062 1201 1322 4305 | 57680700 535 638 748 629 2550 | 1257 1407 1475 1407 5546 | 80960800 614 599 646 613 2472 | 1165 1174 1062 1016 4417 | 68890900 570 697 626 632 2525 | 898 836 833 826 3393 | 59181000 630 645 672 676 2623 | 813 766 829 775 3183 | 58061100 640 680 737 705 2762 | 706 763 738 726 2933 | 56951200 744 718 712 702 2876 | 675 691 821 737 2924 | 58001300 746 726 701 516 2689 | 802 729 781 738 3050 | 57391400 732 948 983 924 3587 | 631 622 921 753 2927 | 65141500 903 974 1072 1085 4034 | 711 729 794 797 3031 | 70651600 756 684 810 851 3101 | 832 801 780 812 3225 | 63261700 1031 1175 1226 1332 4764 | 813 840 845 843 3341 | 81051800 1314 1263 1293 1284 5154 | 767 709 671 596 2743 | 78971900 1094 1017 788 751 3650 | 521 515 538 507 2081 | 57312000 692 641 554 537 2424 | 384 365 367 380 1496 | 39202100 558 543 526 481 2108 | 347 328 322 305 1302 | 34102200 400 381 322 301 1404 | 261 228 222 205 916 | 23202300 309 266 241 238 1054 | 191 172 174 144 681 | 1735---------------------------------------------------------------------------------------24-HOUR TOTALS: 53950 55208 109158--------------------------------------------------------------------------------------- PEAK VOLUME INFORMATION DIRECTION: E DIRECTION: W COMBINED DIRECTIONS HOUR VOLUME HOUR VOLUME HOUR VOLUMEA.M. 715 2629 700 5546 700 8096P.M. 1745 5202 1700 3341 1715 8342DAILY 1745 5202 700 5546 1715 8342
GENERATED BY SPS 5.0.29

COUNTY: 79STATION: 0484DESCRIPTION: ON I-4, 0.337 MI E. OF ST. JOHNS RIVER BRIDGE (ITSSTART DATE: 05/16/2012START TIME: 0000--------------------------------------------------------------------------------------- DIRECTION: E DIRECTION: W COMBINEDTIME 1ST 2ND 3RD 4TH TOTAL 1ST 2ND 3RD 4TH TOTAL TOTAL---------------------------------------------------------------------------------------0000 185 189 146 121 641 | 84 98 90 75 347 | 9880100 113 104 102 90 409 | 66 44 54 55 219 | 6280200 73 80 65 85 303 | 54 43 53 81 231 | 5340300 83 62 69 75 289 | 71 75 93 114 353 | 6420400 88 72 105 115 380 | 124 188 233 238 783 | 11630500 114 162 181 207 664 | 283 398 555 624 1860 | 25240600 265 346 446 475 1532 | 783 1026 1279 1252 4340 | 58720700 510 619 710 608 2447 | 1264 1412 1483 1309 5468 | 79150800 592 641 552 604 2389 | 1208 1144 1094 927 4373 | 67620900 547 580 724 626 2477 | 812 909 832 814 3367 | 58441000 611 612 603 660 2486 | 719 711 741 693 2864 | 53501100 631 645 610 613 2499 | 700 715 655 643 2713 | 52121200 667 685 694 686 2732 | 598 705 678 675 2656 | 53881300 711 673 723 711 2818 | 616 679 693 627 2615 | 54331400 701 790 826 848 3165 | 681 730 777 758 2946 | 61111500 864 815 985 1008 3672 | 672 681 725 714 2792 | 64641600 1077 1133 1175 1186 4571 | 654 676 703 696 2729 | 73001700 1142 1227 1221 1220 4810 | 739 768 827 767 3101 | 79111800 1098 914 962 886 3860 | 702 644 528 497 2371 | 62311900 876 893 774 630 3173 | 429 410 366 326 1531 | 47042000 584 556 557 460 2157 | 324 311 353 298 1286 | 34432100 545 503 428 371 1847 | 296 276 302 282 1156 | 30032200 351 407 284 310 1352 | 216 223 206 162 807 | 21592300 291 255 216 193 955 | 115 78 54 49 296 | 1251---------------------------------------------------------------------------------------24-HOUR TOTALS: 51628 51204 102832--------------------------------------------------------------------------------------- PEAK VOLUME INFORMATION DIRECTION: E DIRECTION: W COMBINED DIRECTIONS HOUR VOLUME HOUR VOLUME HOUR VOLUMEA.M. 730 2551 700 5468 715 7941P.M. 1700 4810 1700 3101 1700 7911DAILY 1700 4810 700 5468 715 7941
GENERATED BY SPS 5.0.29

COUNTY: 79STATION: 0484DESCRIPTION: ON I-4, 0.337 MI E. OF ST. JOHNS RIVER BRIDGE (ITSSTART DATE: 04/18/2012START TIME: 0000--------------------------------------------------------------------------------------- DIRECTION: E DIRECTION: W COMBINEDTIME 1ST 2ND 3RD 4TH TOTAL 1ST 2ND 3RD 4TH TOTAL TOTAL---------------------------------------------------------------------------------------0000 197 207 177 118 699 | 107 72 75 62 316 | 10150100 104 94 92 93 383 | 79 62 60 56 257 | 6400200 81 77 77 95 330 | 55 63 57 62 237 | 5670300 60 57 71 73 261 | 72 88 118 109 387 | 6480400 79 98 118 130 425 | 106 178 204 222 710 | 11350500 125 159 208 234 726 | 293 415 555 631 1894 | 26200600 259 333 433 509 1534 | 756 1035 1237 1349 4377 | 59110700 548 590 692 607 2437 | 1248 1370 1453 1369 5440 | 78770800 625 643 597 641 2506 | 1235 1191 1095 1022 4543 | 70490900 598 666 651 652 2567 | 898 873 877 811 3459 | 60261000 598 671 696 648 2613 | 743 731 775 705 2954 | 55671100 689 673 691 694 2747 | 673 665 644 708 2690 | 54371200 663 727 718 680 2788 | 641 687 676 696 2700 | 54881300 717 694 735 703 2849 | 677 658 645 637 2617 | 54661400 792 777 834 851 3254 | 642 729 726 739 2836 | 60901500 920 917 1025 1110 3972 | 715 755 798 672 2940 | 69121600 1143 1285 1285 1405 5118 | 719 703 747 758 2927 | 80451700 1352 1506 1361 1241 5460 | 759 907 839 834 3339 | 87991800 1075 1206 982 819 4082 | 725 675 623 483 2506 | 65881900 763 740 694 623 2820 | 477 488 404 401 1770 | 45902000 588 576 543 544 2251 | 338 385 365 316 1404 | 36552100 534 541 520 465 2060 | 317 299 298 262 1176 | 32362200 416 377 314 284 1391 | 241 218 193 212 864 | 22552300 310 303 239 248 1100 | 183 155 134 96 568 | 1668---------------------------------------------------------------------------------------24-HOUR TOTALS: 54373 52911 107284--------------------------------------------------------------------------------------- PEAK VOLUME INFORMATION DIRECTION: E DIRECTION: W COMBINED DIRECTIONS HOUR VOLUME HOUR VOLUME HOUR VOLUMEA.M. 730 2567 700 5440 715 7941P.M. 1645 5624 1700 3339 1645 8887DAILY 1645 5624 700 5440 1645 8887
GENERATED BY SPS 5.0.29

COUNTY: 79STATION: 1003DESCRIPTION: ON I-4, 1.236 MI. W OF SR-472 (ITS)START DATE: 08/15/2012START TIME: 0000--------------------------------------------------------------------------------------- DIRECTION: E DIRECTION: W COMBINEDTIME 1ST 2ND 3RD 4TH TOTAL 1ST 2ND 3RD 4TH TOTAL TOTAL---------------------------------------------------------------------------------------0000 128 121 116 107 472 | 102 95 93 66 356 | 8280100 92 77 37 39 245 | 32 437 127 49 645 | 8900200 34 37 232 80 383 | 55 46 68 69 238 | 6210300 79 79 59 23 240 | 53 76 76 78 283 | 5230400 124 93 89 118 424 | 93 121 147 160 521 | 9450500 130 177 214 214 735 | 215 265 328 401 1209 | 19440600 291 344 476 469 1580 | 488 626 703 743 2560 | 41400700 541 689 797 720 2747 | 761 836 922 850 3369 | 61160800 626 593 586 568 2373 | 828 731 728 731 3018 | 53910900 559 582 642 598 2381 | 656 665 621 621 2563 | 49441000 565 630 629 628 2452 | 630 596 682 633 2541 | 49931100 567 596 623 628 2414 | 602 620 627 552 2401 | 48151200 628 638 579 664 2509 | 587 601 654 620 2462 | 49711300 571 625 620 502 2318 | 624 623 609 671 2527 | 48451400 461 688 758 709 2616 | 615 617 649 607 2488 | 51041500 709 697 736 749 2891 | 641 686 687 721 2735 | 56261600 611 467 476 544 2098 | 722 666 772 765 2925 | 50231700 563 752 730 793 2838 | 835 850 826 840 3351 | 61891800 811 887 851 820 3369 | 661 639 607 508 2415 | 57841900 798 740 587 477 2602 | 435 498 462 410 1805 | 44072000 434 405 371 373 1583 | 367 351 318 320 1356 | 29392100 321 373 337 318 1349 | 307 292 276 245 1120 | 24692200 286 286 257 220 1049 | 241 204 212 164 821 | 18702300 210 189 174 178 751 | 165 173 153 123 614 | 1365---------------------------------------------------------------------------------------24-HOUR TOTALS: 42419 44323 86742--------------------------------------------------------------------------------------- PEAK VOLUME INFORMATION DIRECTION: E DIRECTION: W COMBINED DIRECTIONS HOUR VOLUME HOUR VOLUME HOUR VOLUMEA.M. 715 2832 715 3436 715 6268P.M. 1800 3369 1700 3351 1715 6263DAILY 1800 3369 715 3436 715 6268
GENERATED BY SPS 5.0.29

COUNTY: 79STATION: 1003DESCRIPTION: ON I-4, 1.236 MI. W OF SR-472 (ITS)START DATE: 04/18/2012START TIME: 0000--------------------------------------------------------------------------------------- DIRECTION: E DIRECTION: W COMBINEDTIME 1ST 2ND 3RD 4TH TOTAL 1ST 2ND 3RD 4TH TOTAL TOTAL---------------------------------------------------------------------------------------0000 152 134 137 104 527 | 85 78 61 79 303 | 8300100 86 78 61 78 303 | 59 65 63 54 241 | 5440200 78 69 88 77 312 | 47 62 72 45 226 | 5380300 63 53 67 77 260 | 73 89 85 93 340 | 6000400 80 94 149 135 458 | 108 137 136 162 543 | 10010500 150 173 195 235 753 | 197 266 354 397 1214 | 19670600 286 347 451 490 1574 | 476 717 730 746 2669 | 42430700 601 658 767 702 2728 | 792 773 916 808 3289 | 60170800 610 638 621 595 2464 | 766 726 725 687 2904 | 53680900 577 648 601 610 2436 | 661 643 646 611 2561 | 49971000 590 596 628 581 2395 | 560 633 599 554 2346 | 47411100 622 589 632 600 2443 | 566 548 594 575 2283 | 47261200 588 570 587 578 2323 | 538 586 601 546 2271 | 45941300 554 591 560 565 2270 | 541 532 562 576 2211 | 44811400 574 585 636 658 2453 | 569 637 635 615 2456 | 49091500 658 677 656 722 2713 | 640 665 699 610 2614 | 53271600 765 796 822 870 3253 | 639 673 651 689 2652 | 59051700 819 942 890 760 3411 | 749 803 833 754 3139 | 65501800 713 710 680 606 2709 | 614 610 499 448 2171 | 48801900 556 464 476 417 1913 | 425 409 389 342 1565 | 34782000 368 381 335 371 1455 | 352 365 315 282 1314 | 27692100 337 364 348 302 1351 | 291 267 309 238 1105 | 24562200 277 289 242 203 1011 | 234 200 189 206 829 | 18402300 201 202 182 149 734 | 154 159 133 100 546 | 1280---------------------------------------------------------------------------------------24-HOUR TOTALS: 42249 41792 84041--------------------------------------------------------------------------------------- PEAK VOLUME INFORMATION DIRECTION: E DIRECTION: W COMBINED DIRECTIONS HOUR VOLUME HOUR VOLUME HOUR VOLUMEA.M. 715 2737 700 3289 700 6017P.M. 1645 3521 1700 3139 1645 6595DAILY 1645 3521 700 3289 1645 6595
GENERATED BY SPS 5.0.29