Embed Size (px)
Citation preview

Light Adaptation of the Cyclic GMP Phosphodiesterase of Frog Photoreceptor Membranes Mediated by ATP and Calcium Ions
S A T O R U K A W A M U R A and M. D E R I C B O W N D S
From the Laboratory of Molecular Biology, the Department of Zoology, and the Neurosciences Training Program, University of Wisconsin, Madison, Wisconsin 53706
ABSTRACT The light-activated guanosine 3',5'-cyclic monophosphate (cyclic GMP) phosphodiesterase (PDE) of frog photoreceptor membranes has been assayed by measuring the evolution of protons that accompanies cyclic GMP hydrolysis. The validity of this assay has been confirmed by comparison with an isotope assay used in previous studies (Robinson et al. 1980. J. Gen. Physiol. 76: 631-645). The PDE activity elicited by either flash or continuous dim illumi- nation is reduced if ATP is added to outer segment suspensions. This desensiti- zation is most pronounced at low calcium levels. In 10 -9 M Ca ++, with 0.5 mM ATP and 0.5 mM GTP present, PDE activity remains almost constant as dim illumination and rhodopsin bleaching continue. At intermediate Ca ++ levels (10 -7-10 -5 M) the activity slowly increases during illumination. Finally, in 10 -4- 10 -3 M Ca ++ the sensitivity control exerted by ATP has almost disappeared, and PDE activity is more a reflection of the total number of rhodopsin molecules bleached than of the rate of the rhodopsin bleaching. At intermediate or low calcium levels a short-lived inhibitory process is revealed by observing a nonlin- ear summation of responses of the enzyme to closely spaced flashes of light. Each flash makes PDE activity less responsive to successive flashes, and a steady state is obtained in which activation and inactivation are balanced. It is suggested that calcium and ATP regulation of PDE play a role in the normal light adaptation processes of frog photoreceptor membranes.
I N T R O D U C T I O N
Increasing interest is focusing on the guanosine 3',5'-cyclic monophospha te (cyclic G M P ) phosphodiesterase (PDE) complex of vertebrate photoreceptor membranes , because several lines of evidence suggest that it plays a central role in visual t ransduct ion. In isolated and f ragmented rod outer segments act ivat ion of the enzyme occurs wi th in milliseconds of light absorpt ion (Yee and Liebman, 1978), and in intact isolated outer segments a correspondingly rapid drop in cyclic G M P levels is observed (Woodru f f e t al., 1977; W o o d r u f f and Bownds, 1979). Cyclic G M P levels o f isolated outer segments correlate
J. GEN. PHYSIOL. � 9 Rockefeller University Press �9 0022-1295/81/05/0571/21 $1.00 571
Volume 77 May 1981 571-591
on January 8, 2019jgp.rupress.org Downloaded from http://doi.org/10.1085/jgp.77.5.571Published Online: 1 May, 1981 | Supp Info:

572 T H E J O U R N A L O F G E N E R A L P H Y S I O L O G Y - V O L U M E 77 �9 1 9 8 1
with their ionic permeability (Woodruff et al., 1977), and Miller and Nicol (1979) have shown that intracellular injection of cyclic G M P into toad rods causes their depolarization. These and other studies (for a review, see Hubbell and Bownds [1979]; Pober and Bitensky, 1979) raise the possibility that cyclic GMP might act as an internal transmitter that controls plasma membrane permeability. One suggestion has been that this control might occur through the phosphorylation-dephosphorylation of two minor proteins (Polans et al., 1979).
The plausibility of these suggestions rests on demonstrating appropriate correlations between the kinetics of the phosphodiesterase, cyclic GMP, and conductance changes measured in living receptor cells, and thus far definitive experiments have not been done. Kilbride and Ebrey (1979) and Kilbride (1980) have shown that illumination causes cyclic GMP levels of whole retinas to fall over a period of seconds, rather than milliseconds. Lowering calcium concentration in the Ringer's solution from 1.6 m M to a nanomolar level increases the cyclic GMP change. These experiments did not monitor the relevant conductance changes or determine whether the cyclic GMP changes occurred in the outer segments. It was suggested that the rapid light-sensitive decrease in cyclic GMP observed by Woodruff et al. (1979) in isolated rod outer segments might occur only at low calcium concentration and be much slower at millimolar calcium levels. Polans et al. (1981), however, have recently found that the cyclic GMP decrease in isolated outer segments is substantially complete within 1 s at calcium concentrations varying from 10 .9 to 10 .3 M.
A number of factors that contribute to the control of PDE have now been established. Wheeler and Bitensky (1977), Shinozawa et al. (1979), and Fung and Stryer (1980) have studied GTPase and guanosine nucleotide-binding proteins that appear to be obligatory for PDE activation. An elutable inhibitor has also been reported (Sitaramayya et al., 1977; Dumler and Etingof, 1976; Hurley and Ebrey, 1979; Baehr et al., 1979; Robinson et al., 1980). Liebman and Pugh (1979 and 1980) have found that ATP is used in reversal of activation. We and our co-workers have reported further controls of the PDE complex (Robinson et al., 1980). Crude frog rod outer segments contain labile components that mediate a light-induced increase in the Michaelis constant of the enzyme and also confer Ca ++ sensitivity. The effect of increasing Ca ++ is to make the PDE complex more sensitive to illumination. It was found during these experiments that a desensitization of PDE activity observed under low-Ca ++ conditions required the presence of endogenous micromolar levels of ATP in the crude outer segment preparations. This was thought to be significant in light of the recent reports by Leibman and Pugh (1979 and 1980) that ATP causes an acceleration of the PDE activation-inactivation sequence.
In the studies reported in this paper we have investigated the effect of ATP and calcium in more detail. The results reveal a control system that may be relevant to the in vivo physiology of frog rod outer segments. This work has utilized an assay for PDE that measures the protons evolved by cyclic GMP hydrolysis (Yee and Liebman, 1978) and has demonstrated the validity of this

KAWAMURA AND BOWNDS Light Adaptation of Photoreceptor Phosphodiesterase 573
assay for the condi t ions used. It has been found tha t the p ro to n assay, car r ied out wi th app rop r i a t e controls, is faster, more convenient , and more reproduc- ible t han the isotope assay used in most o f the publ i shed studies on this enzyme.
MATERIALS AND METHODS
In these experiments we used rod outer segments freshly shaken from frog retinas and not subjected to further washing, to avoid loss of controls of the PDE enzyme complex (Robinson et al., 1980). The structures were, however, extensively fragmented by stirring during the proton assay for PDE (see below). In preparation for each experiment retinas were removed from one or two dark-adapted bullfrogs (Rana catesbeiana or Rana grylio) as described previously (Woodruffet al., 1977; Woodruff and Bownds, 1979). The retinas were then gently rinsed in 10 ml of Ringer's solution (115 mM NaCI, 2.5 mM KCI, 10 mM HEPES, 2 mM MgCI2, 1 mM dithiothreitol, pH 7.8) and then transferred into 0.5 ml of the same Ringer's solution. Outer segments were detached by shaking the retinas with forceps for 2-3 min. The suspension was diluted fivefold to eightfold to bring the rhodopsin concentration to 7-15 pM and then kept at 0~176 until use. All manipulations were carried out under infrared illumination (Robinson et al., 1980). The calcium buffers used in these experiments were made by adding various amounts of EGTA to 0.1 mM Ca ++ solutions (Polans et al., 1980). This calcium level was in excess of the endogenous calcium levels introduced by glassware and reagents (~ 10 -6 M, determined by atomic absorption spectroscopy and ion-specific electrode).
In each assay of PDE activity a 200-pl portion of the outer segment suspension was made 1 mM in GTP (by adding 5/.d of 40 mM GTP), placed in a small vial, and rapidly stirred at 20~ with a magnetic stirrer. In experiments using continuous illumination, the calibrated orange light source described previously was used (Brodie and Bownds, 1976) and intensity was expressed as rhodopsin molecules bleached per outer segment per second (rhod./o.s.-s). Cyclic GMP (10 /~1 of an 80 mM stock solution) was then added shortly after the onset of illumination to make a final concentration of 4 mM (chosen to be above the Km of the light-activated PDE--cf . Robinson et al. [1980]). When flash illumination was used, the cyclic GMP was added just before the flash. The flash source (Sunpak Auto 411, Berkey Marketing Co., Woodside, N. Y.) used the orange filter described by Brodie and Bownds (1976), and the flash duration was 0.36 ms.
In each experiment the pH was allowed to drop from 7.8 to 7.7 as protons were released by cyclic GMP hydrolysis. The pH drop was monitored with a pH micro- electrode (MI 410, Microelectrodes Inc., Londonderry, N. H.) and displayed on a pen chart recorder. Tracings of typical recordings are shown in Fig. 3. Proton release was determined by back-titrating the suspension with known amounts of 0.1 N NaOH, and PDE activity was then expressed as moles of cyclic GMP hydrolyzed per mole of rhodopsin present-minute (see below). In each assay the PDE activation caused by some level of dim continuous illumination was first determined, and then a saturating light (bleaching 3 • 106 rhod./o.s.-s) was turned on so that the maximum rate of proton evolution for that sample could be determined. The ratio of the rate of proton evolution at a given intensity to that just after presentation of the saturating light is referred to as relative activity (expressed as percent of maximum). This relative activity was found to be more constant from preparation to preparation than the absolute activity and did not vary as much with the age of the outer segment preparation (see discussion of Fig. 4).

574 T H E J O U R N A L OF G E N E R A L P H Y S I O L O G Y �9 V O L U M E 77 �9 1981
Ringer's solutions were made with ultrapure NaCI and KCI purchased from Alfa Inorganics (Beverly, Mass.) and MgClz was obtained from Johnson Matthey Chemi- cals (Royston, England). Other chemicals were obtained from Sigma Chemical Co. (St. Louis, Mo.). Purity of the cyclic GMP, GTP, and ATP used was found to be >98% by analysis with high-pressure liquid chromatography (Biernbaum and Bownds, 1979).
Validation of the pH Assay for PDE The proton evolution which results from cyclic G M P hydrolysis can be used as a rapid and convenient assay for PDE (Yee and Liebman, 1978), and is much less cumbersome than the assay that analyzes the products of hydrolysis of radioactive cyclic G M P (Robinson et al., 1980). Use of the proton evolution assay requires that one know the buffering properties of each solution employed, and the possible sources of proton evolution other than cyclic G M P hydrolysis must be excluded. Figs. 1 and
u
o
0
I
0.2
O.I
o �9 �9 o ~ o ooO ~,
l i l i i I A i i l i 7.5 8.0
<] pH
FIGURE 1. Titration of outer segment suspension with N a O H and cyclic GMP. 200/~1 of Ringer's solution containing 30 ~M bleached rhodopsin, 1 m M GTP, 0.1 m M CaC12, and 2.78 m M EGTA was brought from pH 7.0 to pH 8.2 by the addition of 1 mM increments of NaOH. The pH shown (abscissa) for each addition of 1 mM N a O H is the value midway between the starting and ending pH values for each addition (closed circles). Titration with cyclic G M P (which frees a proton as it is hydrolyzed to 5'-GMP) was carried out by adding cyclic G M P at each of the indicated pHs. 1 mM portions of cyclic G M P were added only one time for each measurement (open circles), because the hydrolysis product 5 ' -GMP has buffering capacity.
2 address these two points. Fig. 1 shows the titration of the outer segment suspension used in the PDE assay, which contained 1 m M GTP and was made - 1 0 -9 M in Ca ++ by the addition of 0.1 m M CaC12 and 2.78 m M EGTA. (These experiments were performed in the light, with PDE fully activated, so that all of the 1 m M cyclic G M P added was hydrolyzed within 1 min.) At pH values of 7.7 or higher, hydrolysis of 1 mM cyclic G M P produces almost the same p H change as the addition of an equivalent amount of acid. This result is not obtained when 5'-GMP, GTP, or ATP are substituted for cyclic GMP. The deviation between cyclic G M P hydrolysis and the pH change that occurs at pH values lower than 7.3 can be explained by the appearance of 5 '-GMP, which has an ionizable group with p K 6.3 (Yee and Liebman, 1978). In the experiments described in this paper the p H was allowed to drop from 7.8 to 7.7, and the amount of N a O H required to return the pH to 7.8 was taken as a

KAWAMURA AND BOWNDS Light Adaptation of Photoreceptor Phosphodiesterase 575
measure of the number of cyclic G M P molecules that had been hydrolyzed. The raw data are shown in Fig. 3 with the amount of N a O H added converted to moles cyclic G M P hydrolyzed. A pH range of 7.8-7.7 was chosen to ensure that proton evolution would accurately reflect cyclic G M P hydrolysis and also to stay within the pH opt imum of the enzyme. The p H opt imum in these studies was found to be broad, centering at pH 7.9. This confirms previous reports (Miki et al., 1973; Yee and Liebman, 1978). Titration curves such as the one shown in Fig. 1 were determined for each of the different solutions used in this work, since the buffering properties of the various solutions were slightly different.
Fig. 2 illustrates a comparison of the p H assay with the isotopic assay used in the experiments of Robinson et al. (1980). The two procedures are equivalent at early
.c
) r -6 30C E
-~20C
a .
.u_
o
f ~ O . . . . 0 " / f -
I I I I I -I 0 I 2 3 4
Time after onset of illumination( min )
FIGURE 2. Comparison of the pH and isotope assays for PDE. Rod outer segments in Ringer's solution containing 1 mM GTP and 10 -9 M Ca ++ were divided into two portions. Cyclic G M P was added to each to a final concentra- tion of 2 m M 1 min before the onset of illumination, and its hydrolysis in response to dim illumination bleaching 2.6 • 102 rhod./o.s.-s was measured by proton evolution (solid line) and the isotope assay (dashed line) employed by Robinson et al. (1980). Similar results were obtained when 0.5 m M ATP and 0.5 m M G T P were present. The figure represents one of six similar experiments. The divergence appearing after 2 min of illumination was noted in all six experiments. The data from all the experiments were not averaged because each experiment was carried out under different conditions of illumination.
stages of reaction (which were studied in the experiments of this paper) but diverge after several minutes of illumination. This suggests that some portion of the hydrolyzed cyclic G M P cannot be measured by the pH assay. Similar results were obtained when either G T P or both ATP and G T P were present.
R E S U L T S
T h e basic obse rva t ion wi th which this p a p e r deals is shown in Fig. 3. A c o m p a r i s o n o f pa r t s a a n d b demons t r a t e s tha t the presence of A T P du r ing con t inuous i l l umina t ion causes a suppress ion o f P D E act ivi ty. Th i s is con- sistent wi th the or iginal obse rva t ion o f L i e b m a n a n d Pugh (1979) tha t A T P d iminishes the P D E response elici ted by flashes o f light. In the e x p e r i m e n t

576 T H E J O U R N A L OF G E N E R A L P H Y S I O L O G Y �9 V O L U M E 7 7 . 1981
shown in Fig. 3 a two portions of an outer segment suspension, containing 1 mM GTP and 10 -9 M Ca ++, were il luminated with dim light. (GTP was included in all experiments, for it is required for PDE activation [Wheeler and Bitensky, 1977]). After I min of continuous illumination, cyclic GMP was added to one portion, and its hydrolysis was monitored as proton evolution. The data shown are a direct tracing of the chart recording of the pH drop, with the ordinate showing the pH change converted to moles cyclic GMP hydrolyzed per mole rhodopsin present (see Methods). At the time indicated by the arrow, saturating illumination was given to determine the maximum enzyme activity. The second portion of outer segments, which had been kept
.F.
o
60 eJ
"~ 40 E
~ 2o
} 60 a .
~ 4 0
g 20 = 0 e
~ ~--// I I / , I I
. b
,# ,fl U ' , '4 ,25
Time after onset of illumination (min)
FIGURE 3. ATP influences PDE activation. (a) A rod outer segment suspension containing 1 mM GTP and 10 -9 M Ca ++ was divided into two portions, both of which were illuminated with light bleaching 2.6 • 102 rhod./o.s.-s. After 1 rain, 4 mM cyclic GMP was added to one portion, and proton evolution due to the hydrolysis of cyclic GMP was monitored as a drop in pH. A tracing of the chart recording is shown. At the time indicated by the arrow, saturating light bleaching 3 • 106 rhod./o.s.-s was presented, and maximum enzyme activity was monitored. The second portion of outer segments, which had been kept in the dim illumination for 4 min, was then assayed by adding 4 mM cyclic GMP, and maximum activity was again determined. (b) Experiments identical to a, except that 0.5 mM ATP and 0.5 mM GTP were present.
in the dim illumination for 4 min, was then assayed by the addition of cyclic GMP. The rate of cyclic GMP hydrolysis was larger, reflecting the fact that increased rhodopsin bleaching results in increased activity. Again, saturating light was presented, and the maximum rate was shown to be similar for both portions of outer segments.
A similar experiment was performed (Fig. 3 b), but 0.5 mM ATP and 0.5 mM GTP instead of 1 mM GTP were used. (This was done to keep total nucleotide triphosphate concentration constant; see Fig. 5, legend). A first observation was that enzyme activity elicited by the same dim level of illumination is lower. Further, the activity assayed after 4 min of continuous

KAWAMURA AND BOW~DS Light Adaptation of Photoreceptor Phosphodiesterase 577
illumination was similar to that assayed after only 1 min, in spite of the fact that more rhodopsin had been bleached during this period. Finally, saturating illumination elicited activity similar to that observed in the absence of ATP. Thus, ATP appears to diminish the effectiveness of dim light but does not alter the maximal enzyme activity which can be caused by saturating illumi- nation (see also below). ADP, adenosine, and /~,y-methylene-ATP do not substitute for ATP. (During experiments of the sort shown in Fig. 3, ATP and GTP levels were followed by high-pressure liquid chromatography [Biern- baum and Bownds, 1979] and found to decline <20% in the 4-min period. Further, the addition of 100/~M ATP and GTP had no effect. Thus, adequate levels of triphosphates were present; the GTP and ATP effects on PDE require only micromolar amounts of these components [Wheeler and Bitensky, 1977; Liebman and Pugh, 1980]).
The behavior shown in Fig. 3 has been noted in over 100 separate experi- ments utilizing outer segments which have been detached from the retina for >20 min. Outer segments assayed in the absence of ATP within 5 or 10 rain of their detachment show desensitized behavior similar to that shown in Fig. 3 b, and then over a period of 10-20 rain shift to the more sensitized state shown in Fig. 3 a. During this period endogenous ATP is being hydrolyzed (Biernbaum and Bownds, 1979), and it seems most likely that the disappear- ance of this endogenous ATP causes the sensitization that subsequently can be reversed if excess ATP is added back to the system.
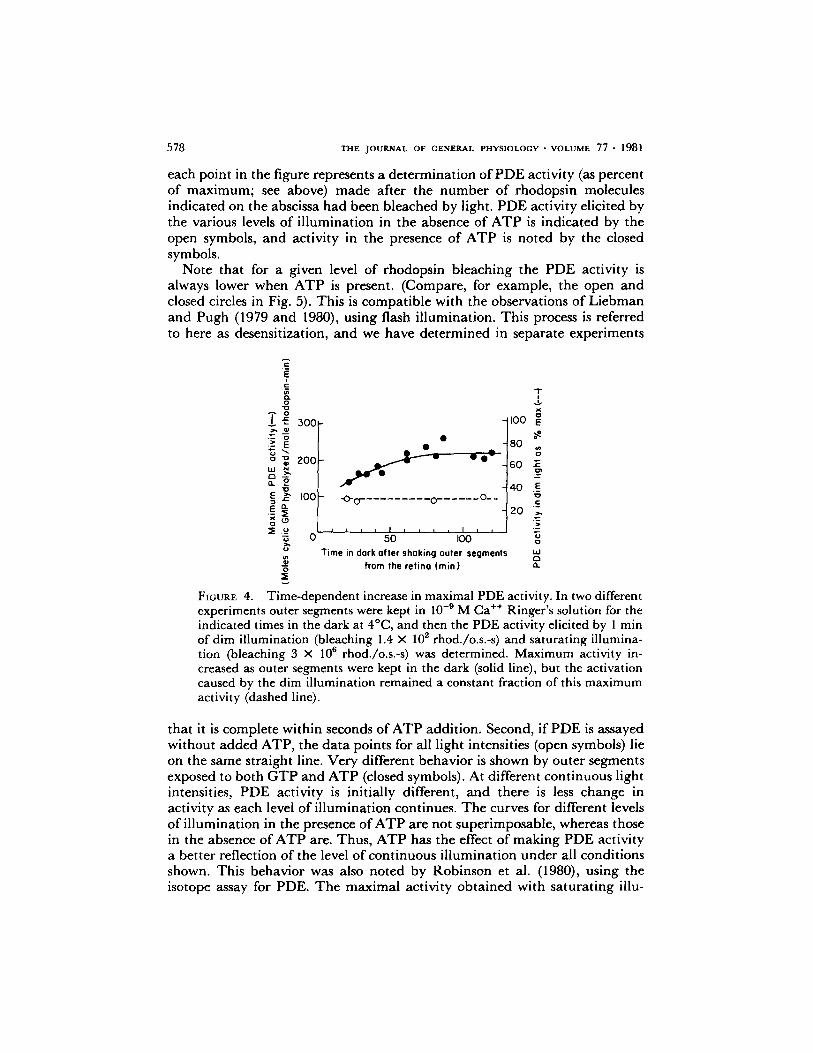
Another parameter must be mentioned as background for the figures that follow, detailing the effects of ATP and calcium. In many experiments of the sort shown in Fig. 3 we noted that the max imum PDE activity obtained with saturating illumination increased with the age of the outer segment suspension. The data of Fig. 4 (solid line) indicate that this increase in maximal activity is complete in ~ 1.5 h. The cause of the increase is not known. It could be due either to proteolysis that activates PDE (Miki et al., 1973) or to elution of inhibitor(s) (see above and references in Robinson et al. [1980]). In spite of an increase in maximum activity, the relative effect of a given level of illumination remains constant for 2 h after outer segments are shaken from the retina. This is shown by the dashed line in Fig. 4, which is a ~plot of the enzyme activity elicited by 1 min of dim light bleaching 1.4 • 10 rhod./o.s.-s expressed as a percent of the maximum activity elicited by saturating illumination. This remains constant, and it is for this reason that relative activities are expressed in the remaining figures in this paper. In all experiments the actual max imum PDE activities were in the range shown in Fig. 4, and all experiments were completed within 2 h after rod outer segments were shaken from the retina.
Regulation of PDE in Dim Light by an A TP-dependent Process
The effect of ATP on light activation of PDE mentioned above is shown in Fig. 5, which illustrates the behavior of the system in low calcium (10 -9 M) Ringer's solution under several different conditions. The data are plotted in a form which permits one to summarize many experiments of the sort shown in Fig. 3. Rod outer segments were exposed to continuous illumination, and
578 T H E J O U R N A L O F G E N E R A L P H Y S I O L O G Y �9 V O L U M E 77 �9 1981
each point in the figure represents a determination of PDE activity (as percent of maximum; see above) made after the number of rhodopsin molecules indicated on the abscissa had been bleached by light. PDE activity elicited by the various levels of illumination in the absence of ATP is indicated by the open symbols, and activity in the presence of ATP is noted by the closed symbols.
Note that for a given level of rhodopsin bleaching the PDE activity is always lower when ATP is present. (Compare, for example, the open and closed circles in Fig. 5). This is compatible with the observations of Liebman and Pugh (1979 and 1980), using flash illumination. This process is referred to here as desensitization, and we have determined in separate experiments
A
C
g
o~
IE
300
200
I00 " 0 " 0 ' 0 . . . . . . O - -
I t I J I I I t i I I i
50 100 Time in dark after shaking outer segments
from the retina (rain)
T ,.b'
I00
80 g
6o
E 4 0 .~
20 "~
o
taJ
IX.
FIGURE 4. Time-dependent increase in maximal PDE activity. In two different experiments outer segments were kept in 10 -9 M Ca ++ Ringer's solution for the indicated times in the dark at 4~ and then the PDE activity elicited by 1 min of dim illumination (bleaching 1.4 X 10 2 rhod./o.s.-s) and saturating illumina- tion (bleaching 3 X 10 n rhod./o.s.-s) was determined. Maximum activity in- creased as outer segments were kept in the dark (solid line), but the activation caused by the dim illumination remained a constant fraction of this maximum activity (dashed line).
that it is complete within seconds of ATP addition. Second, if PDE is assayed without added ATP, the data points for all light intensities (open symbols) lie on the same straight line. Very different behavior is shown by outer segments exposed to both GTP and ATP (closed symbols). At different continuous light intensities, PDE activity is initially different, and there is less change in activity as each level of illumination continues. The curves for different levels of illumination in the presence of ATP are not superimposable, whereas those in the absence of ATP are. Thus, ATP has the effect of making PDE activity a better reflection of the level of continuous illumination under all conditions shown. This behavior was also noted by Robinson et al. (1980), using the isotope assay for PDE. The maximal activity obtained with saturating illu-

KAWAraU~ ^No BowNDs Light Adaptation of Photoreceptor Phosphodiesterase 579
mina t ion is not inf luenced by A T P . In 10 separa te exper iments the rat io o f m a x i m u m P D E act ivi ty wi th an d wi thou t ad d ed A T P was 1.06 _ 0.06 (SEM).
Dependence of Desensitization on A TP Concentration
Fig. 6 demons t ra tes tha t m ic romola r levels o f A T P are sufficient to inf luence P D E activity. In the exper imen t shown, ou te r segments were exposed to d im i l luminat ion b leach ing 2.6 • 102 rhod./o.s .-s , in the presence o f the ind ica ted concent ra t ions o f added A T P , and the e n z y m e act ivi ty was d e t e rm in ed 1 an d
I 00 " V I A x I0 = rhod/o.s.-s"
02"6=10' HmM GTP r't ~ 8 0 - &l '3xl0" - A "
r'14.1x I0' V ~ V
.~" 0.SmM ATP
,0 '22Z:--"- ,., ~.~__~ O= J
o 20 4Pf-2.6x ~0'
10"gM C a * *
| i I ! t t t |
, 0 4 io 5
Rhodopsin molecules bleached/outer segment FIGURE 5. PDE activity as a function of light intensity in the presence and absence of ATP. PDE activation in 10 -9 M Ca ++ Ringer's solution was deter- mined by comparing proton evolution at the indicated continuous light inten- sities with the rate obtained with saturating illumination and is expressed on the ordinate as percent of maximum activity. Each point represents a determi- nation of activity made after the continuous illumination had bleached the number of rhodopsin m61ecules indicated on the abscissa. The different symbols represent the different light intensities indicated. The total concentration of nucleoside triphosphate added was kept constant (1 mM) to ensure that there would be no differential chelation of free Mg ions, which are known to be required for PDE activation (Miki et al., 1973; Chader et al., 1974; Robinson et al., 1980). The data shown in the absence of ATP were taken from six separate experiments. The data shown for the presence of ATP is taken from only one of seven similar experiments, to avoid crowding the figure. In each of these experiments data similar to that shown were obtained, even though different light intensities and times of illumination were used.
4 min af ter the onset o f i l luminat ion. A T P acts to suppress bo th the initial P D E act ivi ty (Fig. 6 a, 1 min) and the increase in act ivi ty caused by con t inu ing i l luminat ion (Fig. 6 a, 4 min). Fig. 6 b shows tha t the effect o f A T P on the act ivi ty of P D E af ter 4 min o f i l luminat ion is not fu r ther en h an ced as its concen t ra t ion is increased f rom 10 ktM to 1 m M . In these exper iments endogenous A T P levels were ana lyzed by high-pressure l iquid ch roma tog ra - phy (B ie rnbaum and Bownds, 1979) and found to be - 0 . 2 / ~ M in the sample

5 8 0 THE JOURNAL OF GENERAL PHYSIOLOGY. VOLUME 7 7 . 1981
to which no A T P was added . Note also that endogenous A T P a s e act ivi ty present in these c rude ou te r segment p repara t ions (B ie rnbaum an d Bownds, 1979) would be expec ted to hydro lyze some o f the ad d ed A T P af ter 4 min o f incubat ion , bu t the extent o f this hydrolysis was not de te rmined .
Calcium Reduces the Effect of A TP on PDE
Robinson et al. (1980) observed tha t P D E act ivi ty is less sensitive to illumi- na t ion at low Ca ++ concentra t ions . In tha t work it was also found that
80
A 1,r
6~
; 40
0. 20
(3 ATP
a d d i t i o n
~ N o n e
O . I / J . M
,~ IOp.M
0 I I l I I I 0 4 I 0 5
Rhodopsin molecules bleached/outer segmenl
2~ L a . I I I J I I I i I
0 'o.I I IO IOO I000 ATP added (p.M)
FmURE 6. Effect of ATP concentration on PDE activity in dim light. (a) Rod outer segments in Ringer's solution containing 10 -9 M Ca ++ and 1 mM GTP were illuminated with light bleaching 2.6 X 10² rhod./o.s.-s in the presence of the indicated concentrations of added ATP. Activity of PDE was determined after 1 min and 4 min and is plotted as in Fig. 5. Data shown are from one of four similar experiments. (b) Activity of PDE after 4 min of illumination bleaching a total of 6.2 • 104 rhod./o.s, is plotted against ATP concentration. At ATP concentrations higher than 50 #M the total concentration of ATP and GTP was kept at 1 mM.
increasing Ca ++ concen t ra t ion to mi l l imolar levels causes a sensit ization of the enzyme. T h e da ta o f Fig. 7, when c o m p a r e d wi th Fig. 5, conf i rm that observat ion, examined now in the context o f the A T P effect. A first observat ion is tha t in 1 m M Ca ++, in the presence of G T P alone or G T P plus A T P , P D E act ivi ty is more near ly a l inear funct ion o f the n u m b e r o f rhodops in molecules b leached than is the case in Fig. 5. This agrees wi th the previous publ ished work on P D E (of. Yee and L i e b m a n [1978]), which indicates tha t P D E act ivat ion is a l inear funct ion o f the a m o u n t o f rhodops in bleached.

KAWAMURA AND BOWNDS Light Adaptation of Photoreceptor Phosphodiesterase 581
Another obvious difference when high and low calcium conditions are compared is the way in which PDE activity changes during continuous illumination (cf. closed symbols of Figs. 5 and 7). In low calcium, PDE activity increases slowly as illumination continues, whereas in high calcium the activity increases more rapidly. This increase in the slopes of the curves in Fig. 7 compared with Fig. 5 is found for both the absence (open circles) and presence (closed circles) of ATP. Finally, in the presence of ATP and G T P the activity of the PDE is significantly lower in low calcium than in high calcium, for all corresponding intensities and durations of illumination.
A more direct comparison of the effect of low and high calcium on PDE activity is shown in Fig. 8, in which enzyme activity measured 1 min after the onset of illumination is plotted as a function of the continuous light intensity
I00 []
_,, 80
,m. GTP 7"/\o.5"M ATP
M GTP
40 lad Q ~ VVl.bxlOZ_ r hOd/~ a. Oe9.2xlO z
20 L~&2.gx103 Elll4.6xlO 3
10-3M Ca** 0 I I I I I I
10 4 10 5
Rhodopsin molecules bleached/outer segment
F[CURE 7. PDE activity in Ringer's solution containing 10 -3 M Ca ++. PDE activity was measured as in Fig. 5. Data were taken from three separate experiments, and points with bars (mean + SEM) represent more than three samples. Curves were drawn by hand.
(as in Robinson et al. [1980]). The desensitization that occurs in the presence of ATP and GTP (cf. solid lines) as calcium concentration is lowered from 10 -3 to 10 -9 M is shown as a shift to the right of the intensity-response curves of the enzyme. The dashed lines indicate that a small decrease in sensitivity also is observed when calcium concentration is lowered in the absence of added ATP (data replotted from Figs. 5 and 7).
There is some interest in examining what effects phosphodiesterase inhibi- tars might have on PDE intensity-response curves of the sort shown in Fig. 8, because several recent electrophysiological studies have examined the effect of these inhibitors on the rod photoresponse (cf. Lipton et al. [1977]). In the current experiments it has been found that 500 # M isobutylmethylxanthine, a concentration that exerts almost the maximum inhibition effect observed,

5 8 2 T H E J O U R N A L O F G E N E R A L P H Y S I O L O G Y �9 V O L U M E 77 �9 1 9 8 1
causes a twofold inhibi t ion of both dark and maximal ly l ight-act ivated PDE. It does not shift the intensity-response curve to lower or higher light intensities (data not shown).
P D E Activity as a Function of Ca ++ Concentration
Fig. 9 demonstrates the variat ion in PDE activi ty over a range of Ca ++ concentrat ions in response to i l luminat ion bleaching 2.6 • 108 rhod./o.s.-s, an intensity at which the effect of Ca +§ in the presence of A T P could most clearly be seen (cf. Fig. 8). T w o increases in relative enzyme activi ty were observed, one occurr ing between 10 -9 and 10 -7 M Ca ++ and the second between 10 -5 and 10 -8 M Ca ++. In these experiments the m a x i m u m PDE activity in sa tura t ing i l luminat ion was 275 + 10 (+SEM) moles of cyclic G M P hydro-
I00' A
8c
~> 60 o
fl_
20
~'lO "~ M Co § GTP ~10.9 M CO**
/
_/3 r , ,
/ I I
dark '101 102
~/, 10"gM Co+*J GTP
I I I I IO s 10 4 10 5 I0 s
Light intensity
(Rhodopsin molecules bleached/outer segment-s)
FIGURE 8. PDE activity as a function of light intensity in low and high Ca ++ solutions. PDE activity was measured after 1 min of continuous illumination at the indicated intensities in low (10 -9 M) or high (10 -3 M) Ca ++ with 0.5 mM GTP and 0.5 mM ATP present (solid lines). Each point represents the mean (:t:SEM) of three or four separate experiments. Intensity-response curves under the same conditions, but without added ATP, (1 mM GTP, dashed lines), were calculated from Figs. 5 and 7, assuming that PDE activity was determined by the total number of rhodopsin molecules bleached per outer segment.
l yzed /mole rhodopsin-min in 10 -3 M Ca ++ (19 determinat ions) and 219 -4- 15 (+SEM) in 10 -9 M Ca ++ (14 determinations) .
To examine the consequence of these transitions, PDE activity was mea- sured with 0.5 m M G T P and 0.5 m M A T P in 10 -6 M Ca ++ , using the procedures of Figs. 5 and 7. These d a t a are shown in Fig. 10 (solid line), with the corresponding da ta from Figs. 5 and 7 shown by dashed lines. The slope of the curve showing PDE activity plot ted against the n u m b e r of rhodopsin molecules bleached per outer segment is in termedia te between the slopes shown for 10 -3 and 10 -9 M Ca ++. In the presence of A T P and GTP, PDE activity in 10 -9 M Ca ++ remains almost constant as d im i l luminat ion contin- ues. At a Ca ++ concentra t ion of 10 -6 M the activity slowly increases dur ing i l lumination. Finally, in 10 -3 M Ca ++, PDE activi ty becomes more a funct ion

KAWAMURA AND BOWNDS Light Adaptation of Photoreceptor Phosphodiesterase 583
of the number of rhodopsin molecules bleached than of the rate of bleaching, and the sensitivity control exerted by the ATP has almost disappeared.
Response of PDE to Flashes of Light
The experiments described thus far have examined the responses of PDE to continuous illumination of the sort used in previous studies of cyclic G M P and permeabili ty changes in isolated outer segments (Bownds and Brodie, 1975; Woodruff and Bownds, 1979). It should be possible to explain the behavior of PDE during continuous illumination as a summation of its discrete responses to closely spaced flashes of light. Fig. 11 presents the beginning of such an analysis by showing PDE responses to single flashes of light that bleach 3 • 104 rhod./o.s. (0.001% of the total rhodopsin present). This
i oo
8o
>" 60
40 bJ Q Q.
2O
Y 0 I * I I I J I
10"9 10 -7 10 4 10 .3
C a * * c o n c e n t r a t i o n ( M )
FIGURE 9. Dependence of PDE activity on Ca ++ concentration. PDE activity was measured 1 min after the start of continuous illumination bleaching 2.6 X 10 3 rhod./o.s.-s. Outer segment suspensions containing 0.5 mM ATP, 0.5 mM GTP, and 0.1 mM Ca ++ were buffered to the indicated Ca ++ levels by the addition of different amounts of EGTA or CaCI2 (see Materials and Methods). The data are taken from seven separate experiments (i.e., outer segment suspen- sions were obtained from seven different frogs). The curve was drawn by hand.
represented the lowest light level at which reproducible responses could be easily obtained.
One sees in Fig. 11 the increase and decrease (activation and inactivation) in PDE that follows a flash delivered under a variety of conditions. Several effects that may contribute to explaining how changing ATP or calcium concentration alters PDE activity can be seen. Note that Fig. 11 b is distinc- tively different from Fig. 11 a, c, and d: in 10 -9 M Ca ++ with ATP present, less PDE activity is elicited by the dim flash and inactivation is relatively rapid. This is compatible with Fig. 5, which shows that under these conditions the response of PDE to continuous illumination is most highly suppressed. If the ATP is removed more PDE activity is generated by the flash, and its decay is slower (cf. Fig. 11 a and b). The rate constant for inactivation changes from

584 THE JOURNAL OF GENERAL PHYSIOLOGY. VOLUME 77. 1981
0.061 to 0.017 s -1. (The rate constants are best-fit values ob ta ined by assuming first-order reactions.) The reduced effect of A T P in 10 -3 M Ca ++ noted in the previous figure (cf. Fig. 7) is also clear from examin ing Fig. 11 c and d. A T P has little effect on the peak act ivi ty generated by the flash, and its addi t ion causes a small but significant increase in the inact ivat ion rate constant (from 0.02 to 0.03 s-l). This is compat ib le with the shift shown in Fig. 7 (closed vs. open symbols). A further point is tha t the t ime to reach peak activity after a flash in the presence of A T P (Fig. 11 b and d) is shorter t han in its absence (Fig. 11 a and c). The response t ime of the p H electrode used (1-2 s) did not permit accurate measurements of the t ime delay before peak activity.
8O
E 60
~ 40 o
W Q
" 20
/
i / /
/ / I I / / / /
0 I , , , , I , ]0 4 IO s
Rhodopsin molecules bleoched/outer segment FIGURE 10. PDE activity in Ringer's solution containing 10 -n M Ca ++. PDE activity in 10 -6 M Ca ++ elicited by light bleaching 1.3 • 103 rhod./o.s.-s was measured (solid line). Each point with a bar represents an average of four separate experiments (• PDE activities in 10 -9 M (filled circles) and 10 -3 M (filled squares) Ca ++ at similar light intensities (1.3 • 103 and 0.92 • 103 rhod./o.s.-s, respectively) are also shown (dashed lines). In all experiments, 0.5 mM ATP and 0.5 mM GTP were present. The data for 10-~M Ca ++ are redrawn from Fig. 7, and those for 10 -9 M Ca ++ are taken from three separate experiments, including the data shown in Fig. 5. The points without bars represent single determinations.
Fig. 12 illustrates another interesting feature of the system. The response of PDE to a series of flashes is not a l inear summat ion of responses of the sort shown in Fig. 11. Rather , as a series of flashes is presented at 15-s intervals, a nonl inear summat ion is observed. Each succeeding flash is less effective in s t imulat ing PDE activity. Fig. 12 a illustrates da ta ob ta ined at 10 -9 M Ca ++. The open symbols show the peaks of PDE activity elicited by each flash at 15- s intervals (0, 15, 30 s, etc.). After the thi rd flash, PDE activity no longer increases above the level reached after the previous flash, and a s teady state is reached. Finally, a sa tura t ing flash is delivered (arrow) to demonst ra te m a x i m u m activat ion of the enzyme. The closed circles show the response of PDE to flashes of light spaced at l-rain intervals. Now each response is similar;

KAWAMURA AND BOWNDS Light Adaptation of Photoreceptor Phosphodiesterase 585
there appears to be no residual effect of a flash presented 1 min previously. Delivery of a saturating flash (arrow) again demonstrates maximum activa- tion. Fig. 12 b shows analogous data obtained using a calcium concentration of 10 -6 M. Similar behavior is noted, except that individual responses are a bit larger because the calcium concentration has increased (cf. Figs. 9 and 10).
The data demonstrate that a short-lived process is triggered by illumination that renders a second flash less effective. The process decays within 1 min, so that the responses of PDE to flashes spaced at 1-min intervals are very similar.
E
o , o
o E
o
"o o
|
n
160
12(3
8(3 40
0
160 I 120 I
o io' ; .o
+ATP
k=O OiTs. I - " ~ ~ q k=OO61e, "t
"",,k,
I0 "s M Ca *~ i l l ] i t 1 t i i i
60 0 20 40 60
Time after f l a s h ( s )
FIGURE 11. Response of PDE to single flashes of light. A subsaturating flash bleaching 0.001% of the rhodopsin present was given to rod outer segments in the presence of 4 mM cyclic GMP with ATP (0.5 mM ATP + 0.5 mM GTP) and without ATP (1 mM GTP) in 10 -9 M Ca ++ (a and b) and 10 -a M Ca ++ (c and d). Proton evolution was measured at the indicated times, activity of a dark control was subtracted, and net activity resulting from the flash was graphed as a function of time after the flash. Assuming first-order kinetics, best- fit lines were obtained (solid lines), and the rate constants are shown. The points are the mean (:I:SEM) of three (a), six (b), and two (c and d) separate experiments. Variation between the points of the two experiments of (c) and (d) was within -+5%.
D I S C U S S I O N
An emphasis in this work has been the study of the activation of the PDE complex under conditions that minimally perturb the rod outer segments. The structures must be disrupted to permit access of substrate and controlling nucleotides, but purification and washing procedures have not been used because work in several laboratories (see references in Robinson et al., 1980)

586 T H E J O U R N A L OF G E N E R A L P H Y S I O L O G Y �9 V O L U M E 7 7 �9 1 9 8 1
has shown tha t control l ing elements can be easily eluted. Thus, we hope that the experiments are as relevant as is possible to the in vivo expression of the enzyme. The M g § and G T P cofactors known to be required for PDE act ivat ion (Wheeler and Bitensky, 1977) have been kept constant at mil l imolar levels so tha t the Ca ++ and A T P controls could be examined. Since both A T P and G T P are known to be present in intact outer segments at mil l imolar levels, and because light has been shown to decrease G T P but not A T P
r- 0
"3
,oo /
~ 50
~ o e-
~ 1 5 0
�9 \ R
O E
�9 "= 5 0
W O 0 i I I i i l r I:L 0 6 0 120 180
T i m e ( s )
FmuR~ 12. Response of PDE to successive flashes of light. (a) Successive flashes, each of which bleached 0.001% of the rhodopsin present, were given to rod outer segments in 10 -a M Ca ++ in the presence of 0.5 mM GTP and 0.5 mM ATP at intervals of 15 (open circles) and 60 s (closed circles). Finally, a saturating flash was given to each of the samples at the time indicated by the arrow. Proton evolution was measured, dark activity was subtracted, and net activity resulting from the flashes was graphed as a function of time. Curves were drawn by hand. (b) Similar experiment but in 10 -6 M Ca ++.
(Biernbaum and Bownds, 1979; Robinson and Hagins, 1979), it might be reasonable to assume tha t amoun t s of A T P sufficient to saturate the PDE controls shown in this paper are always present in living receptor cells. The present da ta are similar to those ob ta ined by W o o d r u f f and Bownds (1979) for the behavior of cyclic G M P in intact outer segments, suppor t ing the possibility tha t A T P normal ly plays a role in control l ing PDE sensitivity. In

KAWAMURA AND BOWNDS Light Adaptation of Photoreceptor Phosphodiesterase 587
Ringer's solution containing 10 -9 M Ca ++, 0.5 m M ATP, and 0.5 m M GTP, PDE activity reaches its max imum at a light intensity bleaching 2 X 10⁴ rhod./o.s.-s, and half-maximum activation occurs at levels bleaching 3 • 103 rhod./o.s.-s (Fig. 8). This is in close agreement with the behavior of cyclic GMP levels in freshly isolated frog rod outer segments, which maintain the ability to perform a light-induced permeability decrease (Woodruff and Bownds, 1979).
While the constant and high levels of ATP present in vivo suggest that changes in ATP concentration may not play a role in the in vivo control of PDE, it does seem reasonable to suppose that calcium concentration changes might be important, for recent work has shown that calcium is extruded from photoreceptors upon illumination (Gold and Korenbrot, 1980; Yoshikami et al., 1980). Whether this extrusion reflects an increase or decrease in cytoplas- mic calcium levels is not known. Perhaps the central observation of this work is that a desensitization of light-activated PDE that depends upon ATP is most striking at low calcium concentrations and is almost completely removed as calcium approaches millimolar levels. Lowering calcium concentration causes a shift of the intensity-response curve for the enzyme to higher light levels (Fig. 8). Robinson et al. (1980) (see also Bownds [1980]) have suggested that illumination of the living photoreceptor might cause at some point a lowering of internal calcium levels (due to the calcium extrusion just men- tioned) that causes a desensitization of PDE. This process then might consti- tute part of the mechanism of light adaptation. The data thus far do not suggest that light adaptation might be completely explained by calcium effects on PDE, for these effects shift the intensity-response curve for the enzyme by no more than one log unit in vitro, and normal light adaptation shifts the intensity response curve of the photoreceptor by 3-4 log units (Fain, 1976).
It is useful to consider possible analogies between the behavior of PDE and the light-suppressible conductance mechanisms of rod cells, for one speculation has been that PDE directly controls plasma membrane permeability through its influence on cyclic GMP levels (see Hubbell and Bownds [1979]). Such analogies must be approached with caution, for it is likely that there are significant differences between the activity of PDE in the disrupted outer segment suspensions used in these studies and the activity that occurs in living cells. The rise of PDE activity triggered by flash illumination of broken outer segments is slower than the conductance response (Baylor et al., 1979 a), indicating either that the enzyme is performing more slowly in vitro than in vivo, or, alternatively, that it is not appropriate to correlate its kinetics with the kinetics of the conductance change. It will be important to determine whether the duration of the in vivo conductance response to the levels of illumination used in this work (typically bleaching at least 10 a rhod./o.s.) is similar to the duration of the PDE activation (~40-60 s).
The effect of background light (light adaptation) on living rod cells is to reduce the sensitivity to a dim test flash and to shorten the time-course of the
588 T H E J O U R N A L OF G E N E R A L P H Y S I O L O G Y �9 V O L U M E 77 �9 1 9 8 1
response, suggesting a modification of the kinetics and gain of the transduction mechanisms within the outer segment (Baylor et al., 1979 a). The normal receptor response to continuous light appears to arise from a superposition of events with the shape of the incremental flash responses (Baylor et al., 1979 b). A decrease in PDE sensitivity and shortening of its time-course can be observed (as calcium concentration is lowered in the presence of ATP and GTP) that is similar in form to the change in the wave form of the current response during light adaptation. Fig. 12 further shows a superposition of individual PDE flash responses that generates a steady response, reflecting a process which may be analogous to the superposition of individual conduct- ance responses noted by Baylor et al. (1979 b). Whether or not these similarities prove ultimately to be relevant, it seems likely that there are many reactions other than PDE activation-inactivation that play a role in permeability control, and efforts must also be made to match their properties to the physiology (cf. Bownds [1980]). One such reaction is a light-induced decrease in GTP levels (Biernbaum and Bownds, 1979; Robinson and Hagins, 1979).
The data presented in this paper demonstrate that PDE displays a wide range of behavior in vitro. Activity monitored in 10 -3 M Ca ++ media in the absence of ATP is a function of the total amount of rhodopsin bleached. This suggests that each PDE activation event is relatively long lived, with the individual events summing. PDE activity in the presence of ATP and low Ca ++, on the other hand, is more nearly a function of the rate of rhodopsin bleaching. This suggests that each photon absorption results in a more transient activation-inactivation sequence, so that the summing of these short lived sequences results in net PDE activity that is set more by the rate of rhodopsin bleaching than by the total number of rhodopsin molecules bleached.
More insight into this behavior is derived by comparing the responses of PDE to discrete flashes of light, rather than to continuous illumination. One expects, by observing first the discrete responses of the enzyme complex to single flashes of light (Fig. 11) and then to a series of closely spaced flashes (Fig. 12), to reproduce the behavior observed with continuous illumination. Flashes elicit a rapid activation (<10 s to peak) of PDE, followed by a slower inactivation. The most obvious effect of ATP is to hasten the inactivation of PDE after a flash, in both low and high Ca ++ media (Fig. 11; cf. Liebman and Pugh [1979 and 1980]). Thus, one would expect the enzyme activity at a low level of continuous illumination to be lower in the presence than in the absence of ATP. A second possible control is indicated by Fig. 11. ATP in low-Ca ++ media suppresses the peak activity observed after a dim flash of light. Either the lifetime of the substance responsible for activating PDE has actually been shortened or a rapid inactivation process is established. Ca ++ inhibits this control (Fig. 11 c and d), and this probably explains why there is
3 + + only a slight difference in PDE sensitivity in 10- M Ca in the presence and absence of ATP with continuous illumination (Fig. 7). A third possible control lies in regulation of the time delay before PDE activity reaches its peak after

KnWAMU~ AND BOWNDS Light Adaptation of Photoreceptor Phosphodiesterase 589
a flash. The delay is clearly longer in Ca ++ solutions lacking added ATP (Fig. 11 a). One speculation is that ATP might be acting through its role in rhodopsin phosphorylation (Hubbell and Bownds, 1979; Liebman and Pugh, 1979 and 1980), but recent experiments (Hermolin and Bownds 1) have shown that the ATP effect on PDE can be observed under conditions that suppress rhodopsin phosphorylation. Further experiments will be required to determine the locus of the calcium and ATP effects.
It is important to note that controls illustrated by the responses to single flashes of light do not offer a complete explanation of the response of the enzyme complex to continuous illumination. The data of Fig. 12 reveal that a single flash diminishes the effectiveness of a second, similar flash. Thus, if a series of flashes is presented, the response to each grows smaller, and finally a constant rate is set for a given level ofrhodopsin bleaching. Cyclic GMP levels and the permeability of isolated outer segments also assume constant values at intermediate levels of illumination, and the present data suggest that this behavior may be determined, at least in part, by the behavior shown in Fig. 12. The process responsible for a t tenuat ing responsiveness to successive flashes is short lived, for a flash delivered 1 rain after the first flash elicits an equally large response. This suggests that a flash is followed by the transient accu- mulation of a substance that either inhibits further activation or accelerates inactivation of the PDE response to successive flashes of light. The data do not permit a clear distinction between these possibilities. The lifetime of the inhibitory process is on the same order as that of metarhodopsin II in these preparations, but no effect of ATP and low calcium on the decay kinetics of this intermediate were observed. Further work on the inhibitory process will require that its kinetics be measured as calcium and ATP concentrations are varied.
In studying the PDE complex that apparently is central in the regulation of visual transduction, one faces an array of potential controls. In addition to the GTPase, and, more recently, its "helper" protein (Shinozawa et al., 1980), there is an inhibitor, a light-activated Km shifter, a Ca++-dependent regulator (Robinson et al., 1980), and now an ATP-dependent regulator (Liebman and Pugh, 1979 and 1980). Current work in our laboratory is directed toward specifying the locus of the Ca ++ and ATP controls and probing further analogies between PDE activity and in vivo physiology.
We are grateful to Drs. J. Hermolin and M. Biernbaum for their critique of the manuscript. This work was supported by National Institutes of Health grant EY00463 and a grant to S. Kawamura from the Naito Foundation.
Received for publication 15 August 1980.
i Hermolin, J. H. and D. Bownds. 1981. Light-influenced outer segment protein phosphoryla- tion in frog retina: effects of cyclic nucleotides and calcium. Cold Spring Harbor Symposium on Cell Proliferation, Vol. 8. In press.
590 THE JOURNAL Or OENERAL PHYSIOLOOV �9 VOLUME 77 �9 1981
R E F E R E N C E S
BAEHR, W., M. J. DEVLIN, and M. L. APPLEaURV. 1979. Isolation and characterization ofcGMP phosphodiesterase from bovine rod outer segments, jr. Biol. Chem. 254:11669-11677.
BAYLOR, O. A., T. O. LAM, and K. W. YAU. 1979 a. The membrane current of single rod outer segments. J. Physiol. (Lond.). 288:589-611.
BAYLOR, D. A., T. D. LAM, and K. W. YAU. 1979 b. Responses of retinal rods to single photons. J. Physiol. ( Lond.). 288:613-634.
BXERNaAUM, M. S., and M. D. BOWNDS. 1979. Influence of light and calcium on guanosine 5'- triphosphate in isolated frog rod outer segments..]. Gen. Physiol. 74:649-669.
BowsDs, M. D. 1980. Biochemical steps in visual transduction-roles for nucleotides and calcium ions. Photochem. Photobiol. 32:487-490.
BOWNDS, M. D., and A. E. BRODIE. 1975. Light-sensitive swelling of isolated frog rod outer segments as an in vitro assay for visual transduction and dark adaptation.ft. Gen. Physiol. 66: 407-425.
BRODIE, A. N., and D. BOWNDS. 1976. Biochemical correlates of adaptation processes in isolated frog photoreceptor membranes. J. Gen. Physiol. 68" 1 - 11.
CHADER, G., M. JoHNsoN, R. FLETCHER, and R. BENSINGER. 1974. Cyclic nucleotide phospho- diesterase of the bovine retina: activity, subcellular distribution and kinetic parameters. J. Neurochem. 22:93-99.
DUMLER, I. L., and R. N. ETINGOr. 1976. Protein inhibitor of cyclic adenosine 3':5'-monophos- phate in retina. Biochim. Biophys. Acta. 429.474-484.
FAIN, G. L. 1976. Sensitivity of toad rods: dependence on wave-length and background illumination. J. Physiol. ( Lond. ). 261:71-101.
FUNO, B. K.-F., and L. STRYER. 1980. Photolyzed rhodopsin catalyzes the exchange of GTP for bound GDP in retinal rod outer segments. Proc. Natl. Acad. Sci. U. S. A. 77:2500-2504.
GOLD, G. H., and J. I. KORENnROT. 1980. Light-induced Ca effiux from intact rod cells in living retinas. Fed. Proc. A. 39:1814.
HUBBELL, W. L., and M. D. BOWNDS. 1979. Visual transduction in vertebrate photoreceptors. Annu. Rev. Neurosci. 2:17-34.
HURLEY, J. B., and T. G. EARLY. 1979. Regulatory components of bovine rod outer segment phosphodiesterase. Biophys. J . 25(2, Pt. 2):314 a.
KILBRIDE, P. 1980. Calcium effects on frog retinal cyclic guanosine 3',5'-monophosphate levels and their light-initiated rate of decay.J. Gen. Physiol. 75:457-465.
KJLBRIDE, P., and T. G. EBaEV. 1979. Light-initiated changes of cyclic guanosine monophos- phate levels in the frog retina measured with quick-freezing techniques. J. Gen. Physiol. 74: 415-426.
LIEBMAN, P. A., and E. N. PusH, JR. 1979. The control of phosphodiesterase in rod disk membranes: kinetics, possible mechanisms and significance for vision. Vision Res. 19:375-382.
LIEBMAN, P. A., and E. N. PuGn, JR. 1980. ATP mediates rapid reversal of cyclic GMP phosphodiesterase activation in visual receptor membranes, Nature (Lond.) 287:734-736.
LIPTON, S. A., H. RASMUSSEN, and J. E. DOWLING. 1977. Electrical and adaptive properties of rod photoreceptors in Bufo marinus. II. Effects of cyclic nucleotides and prostaglandins.J. Gen. Physiol. 70:771 - 791.
MIKI, N., J~ j . KEIRNS, F. R. MARCUS, J. FREEMAN, and M. W. BITENSKV. 1973. Regulation of cyclic nucleotide concentrations in photoreceptors: an ATP-dependent stimulation of cyclic nucleotide phosphodiesterase by light. Proc. Natl. Acad. Sci. U. S. A. 70:3820-3824.
MILLER, W. H., and G. D. NICOL. 1979. Evidence that cyclic GMP regulates membrane potential in rod photoreceptors. Nature (Lond.). 280:64-66.
KAWAMURA AND BOWNDS Light Adaptation of Photoreceptor Phosphodiesterase 591
POBER, J. A., and M. W. BITENSKY. 1979. Light-regulated enzymes of vertebrate retinal rods. Adv. Cyclic Nucleotide Res. 1h265-301.
POt~NS A. S., J. HEm~tOLIN, and M. D. BOWNt)S. 1979. Light-induced dephosphorylation of two proteins in frog outer segments: influence of cyclic nucleotides and calcium. J. Gen. Physiol. 74:595-613.
POL^NS, A. S., S. KAW^MUaA, and M. D. BOWNDS. 1981. Influence of calcium on guanosine 3',5'-cyclic monophosphate levels in frog rod outer segments. J. Gen. Physiol. 77:41-48.
ROBINSON, P. R., S. KAW^MUaA, B. ABRAMSON, and M. D. BOWNDS. 1980. Control of the cyclic GMP phosphodiesterase of frog photoreceptor membranes.J. Gen. Physiol. 76:631-645.
ROmNSON, W. E., and W. A. HAOINS. 1979. GTP hydrolysis in intact rod outer segments and the transmitter cycle in visual excitation. Nature (Lond.). 280.398-400.
SHINOZAW^. T., I. SEN, G. WHEELER, and M. BITENSKY. 1979. Predictive value of the analogy between hormone-sensitive adenylate cyclase and light-sensitive photoreceptor cyclic GMP phosphodiesterase: a specific role for a light-sensitive GTPase as a component in the activation process.J. Supramol. Struct. 10,185-190.
SmNOZAW^, T., S. UCHIDA, E. MARTIN, D. C^FISO, W. HUBBELL, and M. BITENSKY. 1980. Additional component required for activity and reconstitution of light-activated vertebrate photoreeeptor GTPase. Proc. Natl. Acad. Sci. U. S. A. 77:1408-1411.
SITARAMAYYA, A., N. VIRM^UX, and P. MANDEL. 1977. On the mechanism of activation of retinal rod outer segments cyclic GMP phosphodiesterase. Exp. Eye Res. 25:163-169.
WHEELER, G. L., and M. W. BITENSKY. 1977. A light-activated GTPase in vertebrate photore- ceptors: regulation of light-activated cyclic GMP phosphodiesterase. Proc. Natl. Acad. Set U. S. A. 74:4238-4242.
WOODRUFF, M. L., and M. D. BOWNDS. 1979. Amplitude, kinetics, and reversibility of a light- induced decrease in guanosine 3',5'-cyclic monophosphate in frog photoreceptor membranes.
J. Gen. Physiol. 73:629-653. WOODRUFV, M. L., D. BOWNDS, S. H. GREEN, J. L. MORXSSEY, and A. SHEDLOVSKY. 1977.
Guanosine 3',5'-cyclic monophosphate and the in vivo physiology of frog photoreceptor membranes.J. Gen. Physiol. 69,667-679.
YEE, R., and P. A. LIEBMAN. 1978. Light-activated phosphodiesterase of the rod outer segment: kinetics and parameters of activation and deactivation. J. Biol. Chem. 253:8902-8909.
YOSHIKAMI, S., J. GEORGE, and W. A. HAGINS. 1980. Light causes large fast Ca ++ effiux from outer segments of live retinal rods. Fed. Proc. 39:2066.