Embed Size (px)
Citation preview

Annual Report2010 Positioned for Global Growth
LiftPositionSecure

During Super Bowl XXXVIII at Reliant Stadium in Houston, TX, USA, CM entertainment Lodestar hoists were utilized to position the special lighting used during the various performances.
1
Table of Contents
Letter to Shareholders 1
Growth Strategy 2
Performance Highlights 3
Long-Term Goals 4
Company Profi le 6
Financial Summary 7
Shareholder Information 8
Form 10-K 10
Dear Fellow Shareholders:
Faced with very uncertain global markets that were dramatically slowing at the beginning
of fi scal 2010, our priorities were to generate operating cash fl ow by managing liquidity and
costs, while strategically investing in high-potential markets, new products, and leadership
talent. Your Company succeeded in executing these priorities very well during fi scal 2010
and we have entered fi scal 2011 strong, well capitalized, and positioned for global growth,
as we maintain our leadership in providing products and application knowledge to help
customers lift, position, and secure materials easily and safely.
Generating Operating Cash Flow
We generated approximately $30 million of cash fl ow from operations during fi scal 2010,
in spite of a 22% reduction in revenue by managing our working capital. We also reduced
net debt to its lowest level since Columbus McKinnon’s 1996 initial public offering,
amounting to 27% of net capitalization at March 31, 2010, and well within our long-term
goal of 30%, allowing fl exibility to 50% to accommodate acquisitions.
We continued to position ourselves to generate favorable operating leverage, which will
come with incremental improvement in demand, by consolidating certain North American
production facilities. We have reduced about 500,000 square feet of operating space and
eliminated approximately $13 to $15 million in annualized fi xed costs, with the third and
fi nal project of the initiative being completed in early fi scal 2011.
At the same time, your Company continues to embrace Lean systems globally to improve
productivity, quality, and effi ciency. As we reconfi gured our production facilities for
consolidation, we took the opportunity to ensure that our facilities took full advantage of
applying Lean techniques. These restructuring activities have made us more productive
as we will be able to meet historic peak demand levels with 25% less operating space
and $13 to $15 million lower fi xed costs. During the prior recession of 2001 to 2004, we
also undertook aggressive productivity enhancing steps, generating operating leverage
in a range from 20% to in excess of 30% as we emerged from that trough. We once again
anticipate comparable operating leverage with our new cost structure as we emerge from
this historic global recession.
We are a much different company than we were during the industrial downturn of the early
2000s. Today, we have signifi cantly lower debt and a balanced capital structure, improved
working capital utilization, better operating cash fl ow, higher productivity, and greater
product and geographic market diversity.
Investing In Our Future
What has not changed over the years is the strength and market leadership of Columbus
McKinnon’s brands. In the United States alone, most of our sales are from products where
we’ve earned the number one market share position in their respective product categories.
In North America, we are proud to have the largest installed base of hoists compared with
any of our competitors. And outside of North America, we’ve been investing to capitalize
on market leadership positions we have achieved and expand them further.

This manufacturing facility in Ohio, USA, uses a CM Loderail freestanding, enclosed track crane system, with a Lodestar electric chain hoist, to move fi xtures and tooling in and out of their CNC machine.
Growth Strategyn Grow revenue by investing in
existing and new markets aroundthe world and developing innovative and complementary materialhandling products
n Acquire synergistic, bolt-on acquisitions to complement our organic growth
n Continue increasing productivity by creating a Lean culture throughout the organization and continue investing in the development of our people
n Manage operating margins andreturn on invested capital; maintain a solid capital structure to support growth initiatives
2
In the face of fi scal 2010’s challenging operating environment, we positioned Columbus
McKinnon to quickly and fully capitalize on a recovery by investing in product development,
while continuing to expand our geographic reach in global markets.
We recently introduced a more technically advanced and global standards-compliant
Lodestar, the number-one selling electric chain hoist in North America, that now has wider
global application opportunities. We also expanded our rigging tool product offering,
including high capacity shackles for global applications. Other newly released hoists are
gaining traction in the global marketplace for their adaptability and ease of use, as we strive
toward our goal of having new products introduced in the last three years represent 20% or
more of our total sales in a given year.
We continued to invest in our global sales reach during fi scal 2010, as we work toward
our revenue diversifi cation goal of having 50% of our sales in markets outside of the U.S.
Supporting our international distribution network, we have more than 40 stand-alone sales
and service offi ces in 19 countries, including China, Brazil, Hungary, Russia, and South Africa,
as well as the developed North American and Western European regions.
Specifi cally in the Asia Pacifi c region (APAC), we are expanding our sales force and investing
in improving the productivity of our Chinese manufacturing operations, all under the
leadership of Eric Woon, who was appointed managing director for CMCO-Asia Pacifi c in
fi scal 2010. Eric is a member of our executive committee and responsible for leading our
profi table growth strategy for the region, with a strong focus on China. Most recently, Eric
was president of Volvo Construction Equipment China, and has been a senior corporate
executive based in Asia for more than 15 years.
Eric replaces Bob Clare, who retired after leading our Asian business in an interim role and
transitioning those responsibilities to Eric. We appreciate Bob’s 15 years of leadership in a
variety of key roles in our international operations and wish him well in his retirement.
We also continue to invest in our EMEA region, under the leadership of Dr. Ivo Celi, our
newly-appointed managing director for our Europe, Middle East, and Africa business.
Ivo joined us in the fourth quarter of fi scal 2010 from Hilti AG, one of the world’s leading
manufacturers of power tools for the professional construction and building maintenance
markets, where he was a senior vice president. Over his 13 years at Hilti, Ivo was responsible
for signifi cantly growing businesses, both organically and through acquisitions. His
experience includes roles in strategy development, sales and marketing, product portfolio
management, customer-oriented product development, procurement, production, and
logistics. He is based in Germany and also serves on our executive committee.
Upon joining Columbus McKinnon, Ivo worked closely with Wolfgang Wegener, who will
retire in fi scal 2011 after successfully leading our European operations for more than 30 years,
including the successful integration of our Pfaff-silberblau business which was acquired in
fi scal 2009. We cannot thank Wolfgang enough for his leadership and the valuable role he has
played in Columbus McKinnon’s growth in Europe and around the world.
In North America, we initiated a new go-to-market approach during the fi scal year, in
which all of our hoist and rigging brands are now sold through one sales force, supported
by very experienced product and vertical markets specialists. Key vertical markets for us
include: power generation and distribution, construction, mining, oil and gas exploration,
entertainment, and manufacturing.

The Metro Vienna, in Austria, uses a Pfaff-silberblau under-fl oor lifting system with electrically-driven turntables to maintain and repair its trains.
Performance Highlights – Fiscal Year 2010n Operations generate cash fl ow of
approximately $30 million
n Strong liquidity position with $64 million in cash on hand, $85 million line of credit and net debt to total capitalization of 26.9% at March 31, 2010
n International sales growth to 44%
n Facility consolidation cost reduction to generate $13-$15 million in annualized savings
3
We continue to invest in top corporate executive talent. Joe Maliekel joined our fi nancial
leadership team during fi scal 2010 as Corporate Controller and Chief Accounting Offi cer.
Joe, a CPA, brings tremendous fi nancial depth developed during his more than 20 years of
experience with Monsanto, Deloitte, and BDO Siedman.
Global Growth
Both U.S. and Eurozone capacity utilization are leading market indicators for your Company.
During this fi scal year, Eurozone and U.S. capacity utilization fell to historic lows. Eurozone
capacity utilization reached a 24-year low of 69.6%, according to the European Commission’s
report for June 2009. U.S. capacity utilization plummeted to an all-time low of 65.2%, also in
June 2009, according to the Federal Reserve Board.
Fortunately, as we progressed through fi scal 2010, we witnessed industrial capacity
utilization begin what we hope will lead to a sustained economic rebound. Eurozone
capacity utilization has been trending upward from its summer 2009 low to 75.5% in March
2010, according to the European Commission. Additionally, U.S. capacity utilization has been
increasing steadily since its June 2009 low to 71.3% in April 2010, according to the Federal
Reserve Board. While these statistics refl ect favorable trends, they are considerably below
the long-term average of approximately 80%.
Notably, what is most important to our ability to achieve economic revenue growth is the
trend line in capacity utilization, not an absolute number. In other words, any increase in
capacity utilization will positively affect our revenue, generally one to two quarters later.
Ultimately, what drives demand for our products is the need for end users to continually
enhance productivity and workplace safety. These drivers provide customers with
opportunities to innovate, gain competitive advantages within their own industries, and
comply with ever-expanding workplace regulatory requirements around the world.
Fiscal 2010 Results
For the fi scal year ending March 31, 2010, Columbus McKinnon’s net sales were $476.2
million, a 21.5% decline from $606.7 million the year prior. Refl ecting the severity of the
economic recession by adjusting for the impact of the mid-year fi scal 2009 Pfaff acquisition,
comparable sales declined 28.2% in fi scal 2010. Fiscal 2010 gross profi t margin was
24.3%, compared with 28.6% for fi scal 2009. Excluding special charges related to facility
consolidations, fi scal 2010 gross profi t margin was 25.3%.
While continuing to invest in our international market penetration and new product
development initiatives, we reduced selling, general, and administrative expenses by
8.1% to $101.4 million in fi scal 2010. This is the result of aggressive cost reduction
measures combined with lower commissions on reduced volume.
Excluding restructuring and other special costs, including a non-recurring goodwill
impairment charge in fi scal 2009, operating margin was 4.3% in fi scal 2010 and 10.5% in
fi scal 2009 on a non-GAAP basis.
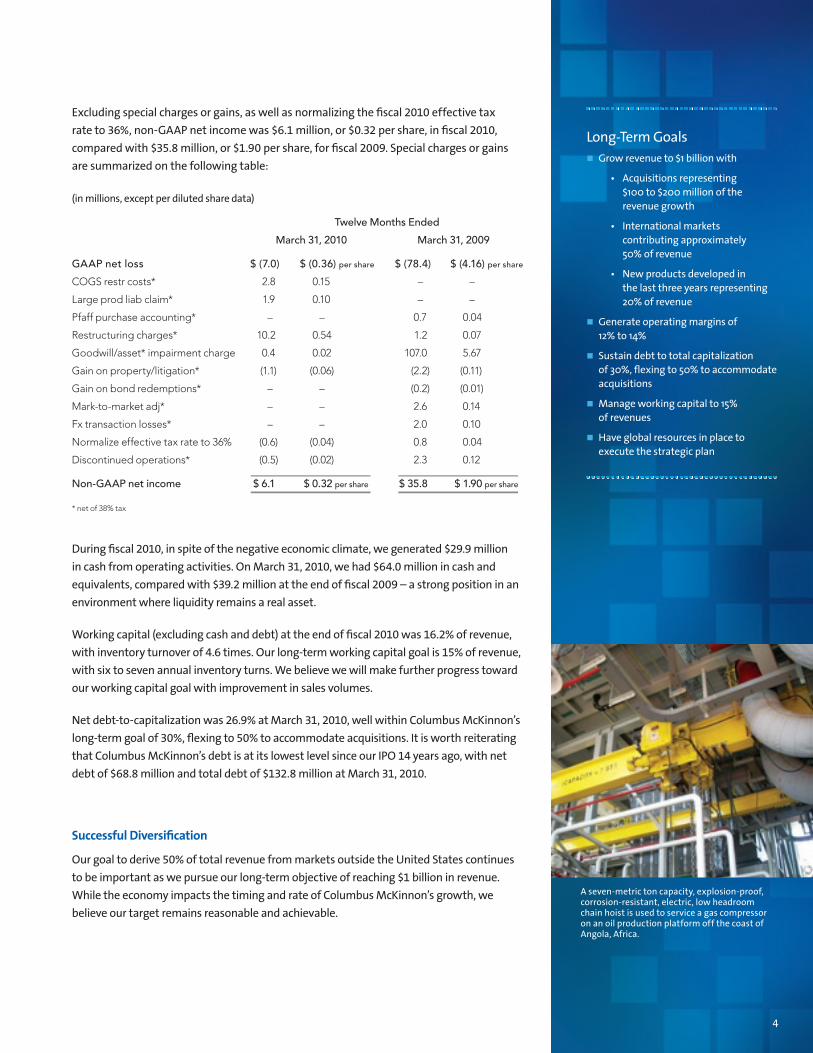
A seven-metric ton capacity, explosion-proof, corrosion-resistant, electric, low headroom chain hoist is used to service a gas compressor on an oil production platform off the coast of Angola, Africa.
Long-Term Goalsn Grow revenue to $1 billion with
• Acquisitions representing $100 to $200 million of the revenue growth
• International markets contributing approximately 50% of revenue
• New products developed in the last three years representing 20% of revenue
n Generate operating margins of 12% to 14%
n Sustain debt to total capitalization of 30%, fl exing to 50% to accommodate acquisitions
n Manage working capital to 15%of revenues
n Have global resources in place to execute the strategic plan
4
Excluding special charges or gains, as well as normalizing the fi scal 2010 effective tax
rate to 36%, non-GAAP net income was $6.1 million, or $0.32 per share, in fi scal 2010,
compared with $35.8 million, or $1.90 per share, for fi scal 2009. Special charges or gains
are summarized on the following table:
(in millions, except per diluted share data)
Twelve Months Ended
March 31, 2010 March 31, 2009
GAAP net loss $ (7.0) $ (0.36) per share $ (78.4) $ (4.16) per share
COGS restr costs* 2.8 0.15 – –
Large prod liab claim* 1.9 0.10 – –
Pfaff purchase accounting* – – 0.7 0.04
Restructuring charges* 10.2 0.54 1.2 0.07
Goodwill/asset* impairment charge 0.4 0.02 107.0 5.67
Gain on property/litigation* (1.1) (0.06) (2.2) (0.11)
Gain on bond redemptions* – – (0.2) (0.01)
Mark-to-market adj* – – 2.6 0.14
Fx transaction losses* – – 2.0 0.10
Normalize effective tax rate to 36% (0.6) (0.04) 0.8 0.04
Discontinued operations* (0.5) (0.02) 2.3 0.12
Non-GAAP net income $ 6.1 $ 0.32 per share $ 35.8 $ 1.90 per share
* net of 38% tax
During fi scal 2010, in spite of the negative economic climate, we generated $29.9 million
in cash from operating activities. On March 31, 2010, we had $64.0 million in cash and
equivalents, compared with $39.2 million at the end of fi scal 2009 – a strong position in an
environment where liquidity remains a real asset.
Working capital (excluding cash and debt) at the end of fi scal 2010 was 16.2% of revenue,
with inventory turnover of 4.6 times. Our long-term working capital goal is 15% of revenue,
with six to seven annual inventory turns. We believe we will make further progress toward
our working capital goal with improvement in sales volumes.
Net debt-to-capitalization was 26.9% at March 31, 2010, well within Columbus McKinnon’s
long-term goal of 30%, fl exing to 50% to accommodate acquisitions. It is worth reiterating
that Columbus McKinnon’s debt is at its lowest level since our IPO 14 years ago, with net
debt of $68.8 million and total debt of $132.8 million at March 31, 2010.
Successful Diversifi cation
Our goal to derive 50% of total revenue from markets outside the United States continues
to be important as we pursue our long-term objective of reaching $1 billion in revenue.
While the economy impacts the timing and rate of Columbus McKinnon’s growth, we
believe our target remains reasonable and achievable.

This wind farm installation in Hawaii, USA, uses an extensive rigging system of CM spreader beams, synthetic slings, and shackles to lift the blades, tower sections, hubs, and nacelles into position.
5
This New York City theater replaced a manual system with a CM Lodestar XL to allow workers to delicately lower the 2.5 ton chandelier during cleaning and maintenance operations.
Sales to markets outside the United States totaled $211 million, or 44% of revenue, in fiscal
2010. When compared with 38% of revenue in fiscal 2009, what is striking is the progress
we’ve made on geographic diversification since international growth became a key element
of our corporate strategy in 2001. Then, non-U.S. sales represented only 20% of total
revenue. Over the last nine years, we’ve more than doubled our percentage of non-U.S.
sales, while maintaining our U.S. market-leadership position. This geographic diversity is
important to provide greater profitable growth opportunities and additional potential
reliability to our revenue stream.
Acquisitions, particularly strategic “bolt-on” ones which broaden our geographic reach or
our product offering, will continue to be important for Columbus McKinnon, as we expect
$100 million to $200 million of our revenue goal to come from acquired businesses. During
fiscal 2010, we successfully integrated our Pfaff-silberblau business, acquired in fiscal
2009. While we did not close any transactions last year, we have continued with an active
program for evaluating potential targets.
Our Strategy
To achieve our long term goals, we remain focused on our growth strategy. As evidenced
by our performance and activities in fiscal 2010, Columbus McKinnon continues to:
n invest in global markets and new products
n improve productivity by implementing a Lean culture and investing in our people
n seek geographic and/or product expansion acquisition opportunities
n improve operating margins and return on invested capital, and maintain a solid
capital structure
We will continue to make prudent investments in new products, markets, and people
as we execute our growth strategy, while managing your Company with a balanced
approach toward maintaining liquidity, preserving cash, and aggressively containing costs.
A sincere thanks to all of our associates around the world who work to better our Company
every day. We also thank you, our shareholders, for your confidence and investment in
Columbus McKinnon.
Timothy T. Tevens
President and Chief Executive Officer
Ernest R. Verebelyi
Chairman of the Board of Directors

We value our corporate health
We value each other and our diverse backgrounds
We value innovation, quality and craftsmanship in all aspects of performance
We value helping our customers succeed
Superior Customer Excellence
Op
erat
iona
l Exc
elle
nce
New
Pro
duc
ts a
nd S
ervi
ces
Peop
le E
xcel
lenc
e
New
Mar
kets
, Geo
gra
phi
cs,
and
Dis
trib
utio
n C
hann
els
Our Goal
Our Initiatives
Our Values
Vision: Become the Material Handling Champion of the World
Company ProfileColumbus McKinnon Corporation (NASDAQ: CMCO) is a leading designer, manufacturer and marketer of material handling products, systems and services which lift, secure, position and move material ergonomically, safely, precisely and efficiently. Headquartered in Amherst, New York, Columbus McKinnon’s major products include hoists, cranes, actuators, chain and forged attachments. The Company’s products serve a wide variety of commercial and industrial applications that require the safety and quality provided by Columbus McKinnon’s superior product design and engineering know-how.
Growing International Presence
6
2001 2010
Latin America5%
Asia Pacific
2%
Europe, Middle East
& Africa32%
United States56%
Canada5%Latin
America2%
Asia Pacific
1%
Europe, Middle East
& Africa10%
United States80%
Canada7%

7
Financial Summary (In thousands, except per share, percent change, margin and ratio data) Data as of or for the years ended March 31, 2010 and March 31, 2009
Income Statement Data 2010 2009 Change
Net sales $476,183 $606,708 -21.5%
Gross profit 115,939 173,701 -33.3%
Gross margin 24.3% 28.6%
(Loss) from operations (3,812) (46,559) 91.8%
Operating Margin (0.8)% (7.7)%
Non-GAAP income from operations* 20,707 63,462 -67.4%
Non-GAAP operating margin* 4.3% 10.5%
Net (loss) (7,013) (78,384) 91.1%
Net (loss) per diluted share ($0.37) ($4.16) 91.1%
Non-GAAP net income per diluted share* $0.32 $1.90 -83.2%
Balance Sheet Data
Total assets $481,497 $491,664 -2.1%
Total liabilities 294,219 309,810 -5.0%
Total debt 132,817 137,886 -3.7%
Total debt, net of cash 68,849 98,650 -30.2%
Total shareholders’ equity 187,278 181,854 3.0%
Total debt/capitalization 41.5% 43.1%
Total debt, net of cash/capitalization 26.9% 35.2%
Other Data
Operating cash flow $29,867 $60,231 -50.4%
Operating cash flow per share 1.58 3.19 -50.5%
Depreciation, amortization and impairment 12,490 117,590
Capital expenditures (7,245) (12,245) -40.8%
Working capital (excl. cash and debt)/revenue 16.2% 18.8%
Days sales outstanding 51.4 53.7
Inventory turns 4.6 4.0
** Excludes restructuring-related costs of $21.0 million in fiscal 2010 and $1.9 million in fiscal 2009, other special charges of $3.5 million in fiscal 2010 and $1.1 million in fiscal 2009, and a $107.0 million goodwill impairment charge in fiscal 2009
** International sales refers to those to customers outside the United States
Strong Cash Flow From Operations
$60
30
009 10
60.2
29.9
06
46.4
07
45.5
08
59.6
Cash Flow from Operations($ in millions)
$250
125
006
155.6
07
159.2
08 09 10
188.3224.5 210.7
International Sales**
Growing Globally ($ in millions)
$700
350
006
513.3
07
550.5
08 09 10
593.8 606.7
476.2
Net Sales
$4
2
0
3.19
1.58
06
2.79
07
2.40
08
3.11
Cash Flow from Operations per Share
09 10
Operating Margin (%)*20
10
009 1006
11.1
07
13.6
08
13.6
10.5
4.3
Strong Liquidity Position ($ in millions)
$300
150
009 1006 07 08
98.768.8
164.2123.4
71.9
Total Debt, Net of Cash

8
Shareholder and Corporate Information
Common StockColumbus McKinnon’s common stock is traded on NASDAQ
under the symbol CMCO. As of April 30, 2010, there were 589
shareholders of record of the Company’s common stock.
According to March 31, 2010 SEC filings, about 118 institutional
investors own approximately 93% of Columbus McKinnon’s
outstanding common shares.
Annual Meeting of ShareholdersJuly 26, 2010
10:00 a.m. Eastern Time
The Martha Washington Inn
150 West Main Street
Abington, Virginia 24210
Transfer AgentPlease direct questions about lost certificates, change of address
and consolidation of accounts to the Company’s transfer agent
and registrar:
American Stock Transfer & Trust Company
59 Maiden Lane, Plaza Level
New York, New York 10038
(800) 937-5449
(718) 921-8200
www.amstock.com
Investor RelationsKaren L. Howard
Vice President – Finance and Chief Financial Officer
716-689-5550
E-mail: [email protected]
Investor information is available on the Company’s web site:
www.cmworks.com
Corporate HeadquartersColumbus McKinnon Corporation
140 John James Audubon Parkway
Amherst, New York 14228-1197
716-689-5400
Independent AuditorsErnst & Young LLP
50 Fountain Plaza, 15th floor
Buffalo, New York 14202-2297
Forward-Looking InformationThe Columbus McKinnon annual report contains “forward-looking
statements” within the meaning of the Private Securities Litigation
Reform Act of 1995. Such statements include, but are not limited
to, statements concerning future revenue and earnings, involve
known and unknown risks, uncertainties and other factors that
could cause the actual results of the Company to differ materially
from the results expressed or implied by such statements, including
general economic and business conditions, conditions affecting the
industries served by the Company and its subsidiaries, conditions
affecting the Company’s customers and suppliers, competitor
responses to the Company’s products and services, the overall
market acceptance of such products and services and other factors
disclosed in the Company’s periodic reports filed with the Securities
and Exchange Commission. The Company assumes no obligation to
update the forward-looking information contained in this report.

This page intentionally left blank.
UNITED STATES SECURITIES AND EXCHANGE COMMISSION Washington, D.C. 20549 FORM 10-K
[X] ANNUAL REPORT PURSUANT TO SECTION 13 OR 15(d) OF THE SECURITIES EXCHANGE ACT OF 1934 (FEE REQUIRED)
For the fiscal year ended March 31, 2010
Commission file number 0-27618
_________________
COLUMBUS McKINNON CORPORATION (Exact name of Registrant as specified in its charter)
New York 16-0547600
(State of Incorporation) (I.R.S. Employer Identification Number)
140 John James Audubon Parkway Amherst, New York 14228-1197
(Address of principal executive offices, including zip code)
(716) 689-5400 (Registrant’s telephone number, including area code)
_________________
Securities pursuant to section 12(b) of the Act: NONE
Securities registered pursuant to Section 12(g) of the Act:
Common Stock, $0.01 Par Value (and rights attached thereto)
Indicate by check mark if the registrant is a well-known seasoned issuer, as defined in Rule 405 of the Securities Act. Yes [ ] No [X]
Indicate by check mark if the registrant is not required to file reports pursuant to Section 13 or Section 15(d) of the Exchange Act. Yes [ ] No [X]
Indicate by checkmark whether the registrant (1) has filed all reports required to be filed by Section 13 or 15(d) of the Securities Exchange Act of 1934 during the preceding 12 months (or for such shorter period that the Registrant was required to file such reports), and (2) has been subject to such filing requirements for the past 90 days. Yes [X] No [ ] Indicate by check mark whether the registrant has submitted electronically and posted on its corporate Web site, if any, every Interactive Data File required to be submitted and posted pursuant to Rule 405 of Regulation S-T during the preceding 12 months (or for such shorter period that the registrant was required to submit and post such files). Yes [ ] No [ ] Indicate by check mark if disclosure of delinquent filers pursuant to Item 405 of Regulation S-K (§229.405 of this chapter) is not contained herein, and will not be contained, to the best of Registrant’s knowledge, in definitive proxy or information statements incorporated by reference in Part III of this Form 10-K or any amendment to this Form 10-K [X].

Indicate by checkmark whether the registrant is a large accelerated filer, an accelerated filer, a non-accelerated filer, or a smaller reporting company. See definition of “accelerated filer,” “large accelerated filer” and “smaller reporting company” in Rule 12b-2 of the Act.
Large accelerated filer [ ] Accelerated filer [ X]
Non-accelerated filer [ ] Smaller reporting company [ ]
Indicate by check mark whether the registrant is a shell company (as defined in Rule 12b-2 of the Act). Yes [ ] No [X] The aggregate market value of the voting stock held by non-affiliates of the Registrant as of September 30, 2009 (the second fiscal quarter in which this Form 10-K relates) was approximately $287 million, based upon the closing price of the Company’s common shares as quoted on the Nasdaq Stock Market on such date. The number of shares of the Registrant’s common stock outstanding as of April 30, 2010 was 19,122,266 shares.
DOCUMENTS INCORPORATED BY REFERENCE Portions of the Registrant’s proxy statement for its 2010 Annual Meeting of Shareholders to be filed with the Securities and Exchange Commission pursuant to Regulation 14A not later than 120 days after the end of the Registrant’s fiscal year ended March 31, 2010 are incorporated by reference into Part III of this report.

1
COLUMBUS McKINNON CORPORATION 2010 Annual Report on Form 10-K
This annual report contains “forward-looking statements” within the meaning of the Private Securities Litigation Reform Act of 1995. Such statements involve known and unknown risks, uncertainties and other factors that could cause our actual results to differ materially from the results expressed or implied by such statements, including general economic and business conditions, conditions affecting the industries served by us and our subsidiaries, conditions affecting our customers and suppliers, competitor responses to our products and services, the overall market acceptance of such products and services, the integration of acquisitions and other factors set forth herein under “Risk Factors.” We use words like “will,” “may,” “should,” “plan,” “believe,” “expect,” “anticipate,” “intend,” “future” and other similar expressions to identify forward looking statements. These forward looking statements speak only as of their respective dates and we do not undertake and specifically decline any obligation to publicly release the results of any revisions to these forward-looking statements that may be made to reflect any future events or circumstances after the date of such statements or to reflect the occurrence of anticipated or unanticipated changes. Our actual operating results could differ materially from those predicted in these forward-looking statements, and any other events anticipated in the forward-looking statements may not actually occur.
PART I Item 1. Business General We are a leading global designer, manufacturer and marketer of hoists, cranes, actuators, chain, forged attachments, lift and other material handling products serving a wide variety of commercial and industrial end-user markets. Our products are used to efficiently and ergonomically move, lift, position or secure objects and loads. We are the U.S. market leader in hoists, our principal line of products, as well as certain chain and forged attachment products which we believe provides us with a strategic advantage in selling our other products. We have achieved this leadership position through strategic acquisitions, our extensive, diverse and well-established distribution channels and our commitment to product innovation and quality. We have one of the most comprehensive product offerings in the industry and we believe we have more overhead hoists in use in North America than all of our competitors combined. Additionally, we believe are the market leader of manual hoist products in Europe, which provides us further opportunity to sell our other products through our existing distribution channels in that region. Further, complimented by our October 2008 Pfaff acquisition, we believe we are the global leader for mechanical actuator products and services. Our products are sold globally and our brand names, including CM, Coffing, Chester, Duff-Norton, Pfaff, Shaw-Box and Yale, are among the most recognized and well-respected in the marketplace. Our business is cyclical in nature and sensitive to changes in general economic conditions, including changes in the industrial capacity utilization, industrial production and the general economic activity indicators like GDP. The U.S. industrial capacity utilization, which we use as a leading market indicator for our U.S. based businesses, reached 70.5% in March 2010, the first time it has been above 70% since November 2008. This is compared to 65.2% reached in June 2009; the lowest reported US industrial capacity utilization as published by the U.S. Federal Reserve Board. Similarly, the Eurozone capacity utilization reached 75.5% in March 2010, following a 69.6% trough in June 2009. In response to the negative economic climate we experienced in Fiscal 2010 and consistent with our manufacturing strategy, we initiated a plan to rationalize our North American hoist and rigging operations to improve efficiency, control costs and facilitate future growth. During fiscal 2010, we closed one of our forge facilities in the U.S. and significantly stopped welded chain production in our Mexico facility. Continuing into early fiscal 2011, one of our hoist facilities will be closed, with this entire facility consolidation initiative resulting in a reduction of 500,000 square feet of manufacturing space and generating annual savings estimated at approximately $13-$15 million. After completion, we will have sufficient capacity to produce peak demands. The cost of the restructuring is expected to be approximately $25-$27 million with 80% of the total charges having been incurred in fiscal year 2010. This strategy, together with steps to integrate our sales force will provide increased operating leverage when the global economy returns to more normalized levels.

2
Our Position in the Industry The broad, global material handling industry includes the following sectors:
• overhead material handling and lifting devices; • continuous materials movement; • wheeled handling devices; • pallets, containers and packaging; • storage equipment and shop furniture; • automation systems and robots; and • services and unbundled software.
The breadth of our products and services enables us to participate in most of these sectors. This diversification, together with our extensive and varied distribution channels, minimizes our dependence on any particular product, market or customer. We believe that none of our competitors offers the variety of products or services in the markets we serve. We believe that the demand for our products and services will be aided by several macro-economic growth drivers. These drivers include: Productivity Enhancement - We believe employers respond to competitive pressures by seeking to maximize productivity and efficiency, among other actions. Our hoists and other lifting and positioning products allow loads to be lifted and placed quickly, precisely, with little effort and fewer people, thereby increasing productivity and reducing cycle time. Safety Regulations - Driven by workplace safety regulations such as the Occupational Safety and Health Act and the Americans with Disabilities Act in the U.S. and other safety regulations around the world, and by the general competitive need to reduce costs such as health insurance premiums and workers’ compensation expenses, employers seek safer ways to lift and position loads. Our lifting and positioning products enable these tasks to be performed with reduced risk of personal injury. Consolidation of Suppliers - In an effort to reduce costs and increase productivity, our channel partners and end-user customers are increasingly consolidating their suppliers. We believe that our broad product offering combined with our well established brand names will enable us to benefit from this consolidation and enhance our market share. Our Competitive Strengths Leading North American Market Positions - We are a leading manufacturer and marketer of hoists and alloy and high strength carbon steel chain and attachments in North America. We have developed our leading market positions over our 135-year history by emphasizing technological innovation, manufacturing excellence and superior service. Approximately 61% of our U.S. net sales for the year ended March 31, 2010 were from product categories in which we believe we hold the number one market share. We believe that the strength of our established products and brands and our leading market positions provide us with significant competitive advantages, including preferred supplier status with a majority of our largest channel partners and end user customers. Our large installed base of products also provides us with a significant competitive advantage in selling our products to existing customers as well as providing repair and replacement parts. The following table summarizes the product categories where we believe we are the U.S. market leader:
Product Category U.S. Market Share U.S. Market Position Percentage of U.S. Net Sales
Powered Hoists (1) 45% #1 22% Manual Hoists & Trolleys (1) 55% #1 13% Forged Attachments (1) 35% #1 7% Lifting and Sling Chains (1) 49% #1 4% Hoist Parts (2) 50% #1 10% Mechanical Actuators (3) 43% #1 5% Tire Shredders (4) 80% #1 2% Jib Cranes (5) 25% #1 1% 64%
(1) Market share and market position data are internal estimates derived from survey information collected and provided by our trade associations in 2009. (2) Market share and market position data are internal estimates based on our market shares of Powered Hoists and Manual Hoists & Trolleys, which we
believe are good proxies for our Hoist Parts market share because we believe most end-users, purchase Hoist Parts from the original equipment supplier.

3
(3) Market share and market position data are internal estimates derived by comparison of our net sales to net sales of one of our competitors and to
estimates of total market sales from a trade association in 2009.
(4) Market share and market position data are internal estimates derived by comparing the number of our tire shredders in use and their capacity to estimates of the total number of tires shredded published by a trade association in 2009.
(5) Market share and market position are internal estimates derived from both the number of bids we win as a percentage of the total projects for which we
submit bids and from estimates of our competitors’ net sales based on their relative position in distributor catalogues in 2009. Comprehensive Product Lines and Strong Brand Name Recognition - We believe we offer the most comprehensive product lines in the markets we serve. Most of our products work in conjunction with each other to create a lifting system. We offer engineering and design services to help channel partners and end users solve material handling problems. We are the only major supplier of material handling equipment offering full lines of hoists, rigging and lifting tools as well as actuators. Our capability as a full-line supplier has allowed us to (i) provide our customers with “one-stop shopping” for material handling equipment, which meets some customers’ desires to reduce the number of their supply relationships in order to lower their costs, (ii) leverage our engineering, product development and marketing costs over a larger sales base and (iii) achieve purchasing efficiencies on common materials used across our product lines. In addition, our brand names, including Budgit, Chester, CM, Coffing, Duff-Norton, Little Mule Pfaff, Shaw-Box and Yale, are among the most recognized and respected in the industry. The CM and Yale names have been synonymous with powered hoists and manual hoists and were first developed and marketed under these brand names in the early 1900s. We believe that our strong brand name recognition has created customer loyalty and helps us maintain existing business, as well as capture additional business. No single SKU comprises more than 1% of our sales, a testament to our broad and diversified product offering. Distribution Channel Diversity and Strength - Our products are sold to over 15,000 general and specialty distributors, end users and OEMs globally. We enjoy long-standing relationships with, and are a preferred provider to, the majority of our largest distributors and industrial buying groups. There has been consolidation among distributors of material handling equipment and we have benefited from this consolidation by maintaining and enhancing our relationships with our leading distributors, as well as forming new relationships. We believe our extensive distribution channels provide a significant competitive advantage and allow us to effectively market new product line extensions and promote cross-selling. Expanding International Markets - We have significantly grown our international sales since becoming a public company in 1996. Our international sales have grown from $34.3 million (representing 16% of total sales) in fiscal 1996 to $210.7 million (representing 44% of our total sales) during the year ended March 31, 2010. This growth has occurred primarily in Europe, Latin America and Asia-Pacific. The Pfaff acquisition in October 2008 has enhanced our international revenue growth, particularly in Europe. Additionally, we have recently opened two sales offices in Shanghai and Guangzhou, China to sell into this growing industrial market, with more planned in the coming year. Our international business has provided us, and we believe will continue to provide us, with significant growth opportunities and new markets for our products. “International sales,” as expressed throughout Items 1 and 7 of this Form 10-K, are defined as sales to customers located outside of the United States. Low-Cost Manufacturing with Significant Operating Leverage - We have the ability to produce products in low cost countries of the world. We have a manufacturing base in Hangzhou, China which allows us to produce certain products in this low cost environment. We do believe we will continue to generate significant operating leverage due to the restructuring activities recently initiated as summarized below. Once the economic climate improves, our operating leverage goal is for each incremental sales dollar to generate 20%-30% of additional operating income, in addition to the fixed cost savings realized from our facility consolidation activities.
— Rationalization and Consolidation - We have a successful history of consolidating manufacturing facilities
and optimizing warehouse utilization and location resulting in lower annual operating costs and improving our fixed-variable cost relationship. During fiscal 2010, we underwent consolidation of our North American hoist and rigging operations in accordance with our strategy. We completed the closure of one of our manufacturing facilities and significantly downsized a second facility in the third quarter of fiscal 2010. We expect to complete the closure of a third facility at the end of our FY 2011 first quarter. We expect that these projects will result in an aggregate reduction of approximately 500,000 square feet of manufacturing space and generate annual savings estimated at approximately $13-$15 million.
— Lean Culture - We have been applying Lean techniques since 2001, facilitating inventory reductions, and a
significant decline in required manufacturing floor space, a decrease in product lead time and improved

4
productivity and on-time deliveries. We believe continued application of Lean will generate benefits for many years to come. We are developing our people and focusing on now becoming a Lean culture where we improve our processes and reduce waste in all forms in all our business activities.
— International Expansion - Our continued expansion of our manufacturing facilities in China, Mexico and
Hungary provides us with a cost efficient platform to manufacture and distribute certain of our products and components. We now operate 22 manufacturing facilities in eight countries, with 41 stand alone sales and service offices in 19 countries.
— Consolidated Purchasing Activities - We continue to leverage our company-wide purchasing power through
our Purchasing Council to reduce our costs and manage fluctuations in commodity pricing, including steel. — Selective Integration and outsourcing - We manufacture many of the critical parts and components used in the
manufacture of our hoists and lifting systems, resulting in reduced costs. We also evaluate outsourcing opportunities for non-critical operations and components.
Strong -Market Sales and Support - We believe that we retain customers and attract new customers due to our ongoing commitment to customer service and ultimate satisfaction. We have a large installed base of hoists and rigging tools that drives our after-market sales for replacement units and components and repair parts. We maintain strong relationships with our distribution channel partners and provide prompt service to end-users of our products through our authorized network of 16 chain repair stations and approximately 340 hoist service and repair stations. We also work closely with end users to design the appropriate lifting systems using our products to help them solve their material handling problems. Long History of Free Cash Flow Generation and Significant Debt Reduction - We have consistently generated positive free cash flow (which we define as net cash provided by operating activities less capital expenditures) by continually controlling our costs, improving our working capital management, and reducing the capital intensity of our manufacturing operations. In the past five years, we have reduced total net debt by $89.9 million, from $158.7 million to $68.8 million and continue to improve our cash balance. Experienced Management Team with Equity Ownership - Our senior management team provides a depth and continuity of experience in the material handling industry. Our management has experience in the material handling industry as well as growing businesses, aggressive cost management, balance sheet management, efficient manufacturing techniques, acquiring and integrating businesses and global operations, all of which are critical to our long-term growth. Management of the Company promotes the ownership of its stock by the executive officers and directors. Our Strategy Grow our Core Business. We intend to leverage our strong competitive advantages to increase our market shares across all of our product lines and geographies by:
— Leverage Our Strong Competitive Position - Our large, diversified, global customer base, our extensive
distribution channels and our close relationships with end users and channel partners provide us with insights into customer preferences and product requirements that allow us to anticipate and address the future needs of the marketplace. We are also investing in key vertical markets that will help us grow our revenues in these key markets.
— Introducing New Product - We continue to expand our business by developing new material handling
products and services and expanding the breadth of our product lines to address material handling needs of our customers. We design our powered hoist lines to many international standards included the FEM (European) and ANSI (U.S.) and other standard setting bodies. We employ the StageGate process to enhance discipline and focus in our new product development program. New product sales (as defined by new items introduced within the last three years) amounted to $74.3 million, $74.8 million and $89.0 million in fiscal 2010, 2009 and 2008, respectively.
— Leveraging Our Brand Portfolio to Maximize Market Coverage - Most industrial distributors carry one or
two lines of material handling products on a semi-exclusive basis. Unlike many of our competitors, we have developed and acquired multiple well-recognized brands that are viewed by both distributors and end-users as discrete product lines. As a result, we are able to sell our products to multiple distributors in the same

5
geographic area. This strategy maximizes our market coverage and provides the largest number of end-users with access to our products.
Continue to Grow in International Markets - Our international sales of $210.7 million comprised 44% of our net sales for the year ended March 31, 2010, as compared with $228.8 million, or 38% in fiscal 2009 compared to $34.3 million, or 16% of our net sales, in fiscal 1996, the year we became a public company. We sell to distributors in over 50 countries and have our primary international manufacturing facilities in China, France, Germany, Hungary, Mexico and the United Kingdom. In addition to new product introductions, we continue to expand our sales and service presence in the major and developing market areas of Europe, Asia-Pacific and Latin America including through our sales offices and warehouse facilities in Canada, various countries in Western and Eastern Europe, China, Thailand, Brazil, Uruguay, Panama and Mexico. We intend to increase our sales by manufacturing and exporting a broader array of high quality, low-cost products and components from our facilities in China and Hungary for distribution in North America, Europe, Latin America and Asia-Pacific. We have developed and are continuing to expand upon new hoist and other products in compliance with global standards and international designs to enhance our global distribution. Further Reduce Our Operating Costs and Increase Manufacturing Productivity - Our objective is to provide the highest quality product and service at a price consistent with the value created for our customers. We continually evaluate our costs and challenge the global supply and manufacturing chain to reduce costs. Our view is that a market focused sales and marketing effort along with a low cost of operating will prove to be successful for our customers and Columbus McKinnon. We continually seek ways to reduce our operating costs and increase our manufacturing productivity. In furtherance of this objective, we have undertaken the following:
— Lean - We continuously identify value streams throughout our businesses and work intensively to remove
waste in all forms. We started Lean in 2001 and continue to recognize benefits from this effort. — Rationalization of Facilities - We have a successful history of consolidating manufacturing resulting in
lower annual operating costs and improving our fixed-variable cost relationship. We have sufficient capacity to meet current and future demand and we periodically investigate opportunities for further facility rationalization. During fiscal 2010, we began consolidation of our North American hoist and rigging operations in accordance with our strategy. This involves the closing of two manufacturing facilities and significantly downsizing a third facility during fiscal 2010 and continuing through fiscal 2011 resulting in a reduction of approximately 500,000 square feet of manufacturing space and generating annual savings estimated at approximately $13-$15 million.
— Leveraging of Our Purchasing Power - Our Purchasing Council was formed in fiscal 1998 to centralize and
leverage our overall purchasing power and has resulted in significant savings for our Company as well as management of fluctuations in commodity pricing, including steel.
Pursue Strategic Acquisitions and Alliances; Evaluate Existing Business Portfolio - We intend to pursue synergistic acquisitions to complement our organic growth. Priorities for such acquisitions include: 1) increasing international geographic penetration, particularly in the Asia-Pacific region and other emerging markets, and 2) further broadening our offering with complementary products frequently used in conjunction with hoists. Additionally, we continually challenge the long-term fit of our businesses for potential divestiture and redeployment of capital. Our Business ASC Topic 280 “Segment Reporting” establishes the standards for reporting information about operating segments in financial statements. As part of the organizational restructuring announced in our December 22, 2008 press release and Form 8-K filing, we reevaluated our reportable segments and determined that we have only one reporting segments for internal and external reporting purposes. We continue to believe that we have only one reportable operating segment. We design, manufacture and distribute a broad range of material handling products for various applications. Products include a wide variety of electric, lever, hand and air-powered hoists, hoist trolleys, winches industrial crane systems such as bridge, gantry and jib cranes; alloy and carbon steel chain; closed-die forged attachments, such as hooks, shackles, textile slings, clamps logging tools and load binders; industrial components, such as mechanical and electromechanical actuators and rotary unions; below-the-hook special purpose lifters; tire shredders; and light-rail systems. These products are typically manufactured for stock or assembled to order from standard components and are sold primarily through a variety of commercial distributors;

6
and to a lesser extent directly to end-users. The diverse end-users of our products are in a variety of industries including: manufacturing, power generation and distribution, utilities, wind power, warehouses, commercial construction, oil exploration and refining, petrochemical, marine, ship building, transportation and heavy duty trucking, agriculture, logging and mining. We also serve a niche market for the entertainment industry including permanent and traveling concerts, live theater and sporting venues. Products In excess of 75% of our net sales are derived from the sale of products that we sell at a unit price of less than $5,000. Of our 2010 sales, $265.5 million, or 56% were U.S. and $210.7 million, or 44% were international. The following table sets forth certain sales data for our products, expressed as a percentage of net sales for fiscal 2010 and 2009:
Fiscal Years Ended March 31, 2010 2009 Hoists ....................................................................................... 53% 55% Chain........................................................................................ 11 12 Forged attachments.................................................................. 10 10 Industrial cranes....................................................................... 9 10 Actuators and rotary unions..................................................... 14 10 Other ........................................................................................ 3 3 100% 100%
Hoists - We manufacture a wide variety of electric chain hoists, electric wire rope hoists, hand-operated hoists, winches, lever tools and air-powered hoists. Load capacities for our hoist product lines range from one-eighth of a ton to 100 tons. These products are sold under our Budgit, Chester, CM, Coffing, Little Mule, Pfaff, Shaw-Box, Yale and other recognized brands. Our hoists are sold for use in numerous general industrial applications, as well as for use in the construction, energy, mining, food services, entertainment and other markets. We also supply hoist trolleys, driven manually or by electric motors, for the industrial, consumer and OEM markets. We also offer several lines of standard and custom-designed, below-the-hook tooling, clamps, and textile strappings. Below-the-hook tooling, textile and chain slings and associated forgings, and clamps are specialized lifting apparatus used in a variety of lifting activities performed in conjunction with hoisting or lifting applications. Chain - We manufacture alloy and carbon steel chain for various industrial and consumer applications. U.S. federal regulations require the use of alloy chain, which we first developed, for overhead lifting applications because of its strength and wear characteristics. A line of our alloy chain is sold under the Herc-Alloy brand name for use in overhead lifting, pulling and restraining applications. In addition, we also sell specialized load chain for use in hoists, as well as three grades and multiple sizes of carbon steel welded-link chain for various load securing and other non-overhead lifting applications. We also manufacture kiln chain sold primarily to the cement manufacturing market. Forged Attachments - We produce a broad line of alloy and carbon steel closed-die forged attachments, including hooks, shackles, hitch pins and master links. These forged attachments are used in chain, wire rope and textile rigging applications in a variety of industries, including transportation, mining, construction, marine, logging, petrochemical and agriculture.
In addition, we manufacture carbon steel forged and stamped products, such as load binders, logging tools and other securing devices, for sale to the industrial, consumer and logging markets through industrial distributors, hardware distributors, mass merchandiser outlets and OEMs. Industrial Cranes - We participate in the U.S. crane manufacturing and servicing markets through our offering of overhead bridge, jib and gantry cranes. Our products are sold under the CES, Abell-Howe, Gaffey and Washington Equipment brands. Crane builders represent a specific distribution channel for electric wire rope hoists, chain hoists and other crane components. Actuators and Rotary Unions - Through our Duff-Norton and Pfaff divisions, we design and manufacture industrial components such as mechanical and electromechanical actuators and rotary unions. Actuators are linear motion devices used in a variety of industries, including the transportation, paper, steel, energy, aerospace and many other commercial industries. Rotary unions are devices that transfer a liquid or gas from a fixed pipe or hose to a rotating drum, cylinder or other device. Rotary unions are used in a variety of industries including pulp and paper, printing, textile and fabric manufacturing, rubber and plastic.

7
Other - This category includes tire shredders, light-rail systems and lift tables. We have developed and patented a line of heavy equipment that shreds whole tires, for use in recycling the various components of a tire including: rubber and steel. These recycled products also can be used as aggregate, playgrounds, sports surfaces, landscaping and other such applications, as well as scrap steel. Light-rail systems are portable steel overhead beam configurations used at workstations, from which hoists are an integral component. We also evaluate outsourcing opportunities for non-core competencies. Sales and Marketing Our sales and marketing efforts consist of the following programs: Factory-Direct Field Sales and Customer Service - We sell our products through our sales force of more than 140 sales people and through independent sales agents worldwide. Our sales are further supported by over 350 company-trained customer service correspondents and sales application engineers. We compensate our sales force through a combination of base salary and a commission plan based on top line sales and a pre-established sales quota. Product Advertising - We promote our products by advertising in leading trade journals as well as producing and distributing high quality information catalogs. We run targeted advertisements for hoists, chain, forged attachments, actuators, and cranes. Target Marketing - With increased emphasis beginning in fiscal 2010, we provide marketing literature to target specific end-user market sectors including entertainment, construction, energy, mining, food service, and others. This literature displays our broad product offering applicable to those sectors to enhance awareness at the end-user level within those sectors. We also employ vertical market specialists to support our field sales force to assist our customers with solving their material handling application needs. Trade Show Participation - Trade shows are central to the promotion of our products, and we participate in more than 40 regional, national and international trade shows each year. Shows in which we participate range from global events held in Germany to local “markets” and “open houses” organized by individual hardware and industrial distributors. We also attend specialty shows for the entertainment, rental and safety markets, construction, as well as general purpose industrial and hardware shows. In fiscal 2010, we participated in trade shows in the U.S., Canada, Mexico, Germany, the United Kingdom, France, China, Brazil, Russia, and the United Arab Emirates. Industry Association Membership and Participation - As a recognized industry leader, we have a long history of work and participation in a variety of industry associations. Our management is directly involved in numerous industry associations including the following: ISA (Industrial Supply Association), AWRF (Associated Wire Rope Fabricators), PTDA (Power Transmission and Distributors Association), SCRA (Specialty Carriers and Riggers Association), WSTDA (Web Sling and Tie Down Association), MHI (Material Handling Institute), HMI (Hoist Manufacturers Institute), CMAA (Crane Manufacturers Association of America), ESTA (Entertainment Services and Technology Association), NACM (National Association of Chain Manufacturers) and ARA (American Rental Association). Product Standards and Safety Training Classes - We conduct on-site training programs worldwide for distributors and end-users to promote and reinforce the attributes of our products and their safe use and operation in various material handling applications.
8
Web Sites - Our main corporate web site www.cmworks.com supports the Company’s broad product offering providing product data, maintenance manuals and related information for 11 brands within our product portfolio. The site also provides detailed search and simultaneous product comparisons, the ability to submit Requests for Quotations and allow users to be able chat live with a member of our customer service department. In addition to our main site we maintain an additional 20 sites supporting various product lines, industry segments and geographies. Within these sites we currently sell Towing products, Training, and standard hoists products manufactured by Pfaff. Distributors also have access to a secure, extranet portal website allowing them to enter sales orders, search pricing information, check order status, and product serial number information. Distribution and Markets Our distribution channels include a variety of commercial distributors. In addition, we sell overhead bridge, jib and gantry cranes as well as certain Pfaff products directly to end-users. The following describes our global distribution channels: General Distribution Channels - Our global general distribution channels consist of:
— Industrial distributors that serve local or regional industrial markets and sell a variety of products for
maintenance repair, operating and production, or MROP, applications through their own direct sales force. — Rigging shops that are distributors with expertise in rigging, lifting, positioning and load securing. Most
rigging shops assemble and distribute chain, wire rope and synthetic slings and distribute manual hoists and attachments, chain slings and other products.
— Independent crane builders that design, build, install and service overhead crane and light-rail systems for
general industry and also distribute a wide variety of hoists and crane components. We sell electric wire rope hoists and chain hoists as well as crane components, such as end trucks, trolleys, drives and electrification systems to crane builders.
Specialty Distribution Channels - Our global specialty distribution channels consist of:
— National distributors that market a variety of MROP supplies, including material handling products, either
exclusively through large, nationally distributed catalogs, or through a combination of catalog, internet and branch sales and a field sales force. The customer base served by national distributors such as W. W. Grainger, which traditionally included smaller industrial companies and consumers, has grown to include large industrial accounts and integrated suppliers.
— Material handling specialists and integrators that design and assemble systems incorporating hoists,
overhead rail systems, trolleys, scissor lift tables, manipulators, air balancers, jib arms and other material handling products to provide end-users with solutions to their material handling problems.
— Entertainment equipment distributors that design, supply and install a variety of material handling and
rigging equipment for concerts, theaters, ice shows, sporting events, convention centers and night clubs. Pfaff International Direct - Our German-based Pfaff business markets and sells most of its actuators and certain of its
hoist products direct to end-users, providing an additional method to market for us in the European region. Crane End-Users - We market and sell overhead bridge, jib and gantry cranes, parts and service to end-users through our
wholly owned crane builder, Crane Equipment & Service, Inc. (“CES”). CES which includes Abell-Howe, Gaffey and Washington Equipment brands designs, manufactures, installs and services a variety of cranes with capacities up to 100 tons.
Service-After-Sale Distribution Channel - Service-after-sale distributors include our authorized network of 16 chain repair service stations and approximately 340 hoist service and repair stations throughout North America. This service network is designed for easy parts and service access for our large installed base of hoists and related equipment in that region.

9
OEM/Government Distribution Channels - This channel consists of: — OEMs that supply various component parts directly to other industrial manufacturers as well as private
branding and packaging of our traditional products for material handling, lifting, positioning and special purpose applications.
— Government agencies, including the U.S. and Canadian Navies and Coast Guards, that purchase primarily
load securing chain and forged attachments. We also provide our products to the U.S government for a variety of military applications.
Customer Service and Training We maintain customer service departments staffed by trained personnel for all of our sales divisions, and regularly schedule product and service training schools for all customer service representatives and field sales personnel. Training programs for distribution and service station personnel, as well as for end-users, are scheduled on a regular basis at most of our facilities and in the field. We have approximately 340 service and repair stations worldwide that provide local and regional repair, warranty and general service work for distributors and end-users. End-user trainees attending our various programs include representatives of 3M, Cummins Engine, DuPont, GTE, General Electric, John Deere, Praxair and many other industrial and entertainment organizations. We also provide, in multiple languages, a variety of collateral material in video, cassette, CD-ROM, slide and print format addressing relevant material handling topics such as the care, use and inspection of chains and hoists, and overhead lifting and positioning safety. In addition, we sponsor advisory boards made up of representatives of our primary distributors and service-after-sale network members who are invited to participate in discussions focused on improving products and service. These boards enable us and our primary distributors to exchange product and market information relevant to industry trends. Backlog Our backlog of orders at March 31, 2010 was approximately $67.8 million compared to approximately $70.1 million at March 31, 2009. Our orders for standard products are generally shipped within one week. Orders for products that are manufactured to customers’ specifications are generally shipped within four to twelve weeks. Given the short product lead times, we do not believe that the amount of our backlog of orders is a reliable indication of our future sales. Competition The material handling industry remains highly fragmented. We face competition from a wide range of regional, national and international manufacturers in both U.S. and international markets. In addition, we often compete with individual operating units of larger, highly diversified companies. The principal competitive factors affecting our business include customer service and support as well as product availability, performance, functionality, brand reputation, reliability and price. Other important factors include distributor relationships and territory coverage. Major competitors for hoists are Konecranes, Demag Cranes and Kito-Harrington; for chain are Campbell Chain, Peerless Chain Company and American Chain and Cable Company; for forged attachments are The Crosby Group and Brewer Tichner Company; for cranes are Konecranes, Demag Cranes and a variety of independent crane builders; for actuators and rotary unions are Deublin, Joyce-Dayton and Nook Industries; for tire shredders is Granutech; and for light-rail systems is Gorbel. Employees At March 31, 2010, we had 2,542 employees; 1,501 in the U.S./Canada, 70 in Latin America, 659 in Europe and 312 in Asia. Approximately 13% of our employees are represented under five separate U.S. or Canadian collective bargaining agreements which terminate at various times between July 2010 and March 2012. We believe that our relationship with our employees is good.

10
Raw Materials and Components Our principal raw materials and components are steel, consisting of structural steel, processed steel bar, forging bar steel, steel rod and wire, steel pipe and tubing and tool steel; electric motors; bearings; gear reducers; castings; and electro-mechanical components. These commodities are all available from multiple sources. We purchase most of these raw materials and components from a limited number of strategic and preferred suppliers under long-term agreements which are negotiated on a company-wide basis through our Purchasing Council to take advantage of volume discounts. We generally seek to pass on materials price increases to our distribution channel partners and end-user customers. We will continue to monitor our costs and reevaluate our pricing policies. Our ability to pass on these increases is determined by market conditions. Manufacturing We complement our own manufacturing by outsourcing components and finished goods from an established global network of suppliers. We regularly upgrade our global manufacturing facilities and invest in tooling, equipment and technology. In 2001, we began implementing Lean improvement techniques in our business which has resulted in inventory reductions, reductions in required manufacturing floor area, shorter product lead time and increased productivity. Our manufacturing operations are highly integrated. Although raw materials and some components such as motors, bearings, gear reducers, castings and electro-mechanical components are purchased, our vertical integration enables us to produce many of the components used in the manufacturing of our products. We manufacture hoist lifting chain, steel forged gear blanks, lift wheels, trolley wheels, and hooks and other attachments for incorporation into our hoist products. These products are also sold as spare parts for hoist repair. Additionally, our hoists are used as components in the manufacture of crane systems by us as well as our crane-builder customers. Environmental and Other Governmental Regulation Like most manufacturing companies, we are subject to various federal, state and local laws relating to the protection of the environment. To address the requirements of such laws, we have adopted a corporate environmental protection policy which provides that all of our owned or leased facilities shall, and all of our employees have the duty to, comply with all applicable environmental regulatory standards, and we have initiated an environmental auditing program for our facilities to ensure compliance with such regulatory standards. We have also established managerial responsibilities and internal communication channels for dealing with environmental compliance issues that may arise in the course of our business. We have made and could be required to continue to make significant expenditures to comply with environmental requirements. Because of the complexity and changing nature of environmental regulatory standards, it is possible that situations will arise from time to time requiring us to incur additional expenditures in order to ensure environmental regulatory compliance. However, we are not aware of any environmental condition or any operation at any of our facilities, either individually or in the aggregate, which would cause expenditures having a material adverse effect on our results of operations, financial condition or cash flows and, accordingly, have not budgeted any material capital expenditures for environmental compliance for fiscal 2010.
In addition, we notified the North Carolina Department of Environment and Natural Resources (the “DENR”) in April 2006 of the presence of certain contaminants in excess of regulatory standards at our Coffing Hoist facility in Wadesboro, North Carolina. We filed an application with the DENR to enter its voluntary cleanup program and were accepted. We investigated under the supervision of a DENR Registered Environmental Consultant (“the REC”) and have commenced voluntary clean-up at the facility. At this time, additional remediation costs are not expected to exceed the accrued balance of $0.2 million.
In March of 2007, we also discovered the presence of certain contaminants in excess of regulatory standards at our Damascus, Virginia hoist plant and have notified the Virginia Department of Environmental Quality (the “DEQ”). We filed an application with the DEQ to participate in its voluntary remediation program and have been accepted. We are currently investigating under the terms of the DEQ Voluntary Remediation Program and, if appropriate, will remediate site conditions at the facility. At this time, investigative and remediation costs are not expected to be significant.

11
In June of 2007, we were identified by the New York State Department of Environmental Conservation (“the DEC”), along with other companies, as a potential responsible party (“PRP”) at the Frontier Chemical Royal Avenue Site in Niagara Falls, New York. From 1974 to 1992, the Frontier Royal Avenue Site had been operated as a commercial waste treatment and disposal facility. We sent waste sulfuric acid pickling solution generated at our facility in Tonawanda, New York to the Frontier Royal Avenue Site during the period from approximately 1982 to 1984. We have joined with other PRP members known as the Frontier Chemical Site Joint Defense Alliance Group to conduct investigation and, if appropriate, remediation activities at the site. At this early stage, we do not have an estimate of likely remediation costs, if any, but do not believe that such costs would have a material adverse effect on our financial condition or operating results.
For all of the currently known environmental matters, we have accrued a total of $0.2 million as of March 31, 2010, which, in our opinion, is sufficient to deal with such matters. Further, we believe that the environmental matters known to, or anticipated by, us should not, individually or in the aggregate, have a material adverse effect on our operating results or financial condition. However, there can be no assurance that potential liabilities and expenditures associated with unknown environmental matters, unanticipated events, or future compliance with environmental laws and regulations will not have a material adverse effect on us. Our operations are also governed by many other laws and regulations, including those relating to workplace safety and worker health, principally OSHA in the U.S. and regulations thereunder. We believe that we are in material compliance with these laws and regulations and do not believe that future compliance with such laws and regulations will have a material adverse effect on our operating results or financial condition. Available Information Our internet address is www.cmworks.com. We make available free of charge through our website our Annual Report on Form 10-K, Quarterly Reports on Form 10-Q, Current Reports on Form 8-K and amendments to those reports filed or furnished pursuant to Section 13(a) or 15(d) of the Securities Exchange Act of 1934, as amended, as soon as reasonably practicable after such documents are electronically filed with, or furnished to, the Securities and Exchange Commission. Item 1A. Risk Factors Columbus McKinnon is subject to a number of risk factors that could negatively affect our results from business operations or cause actual results to differ materially from those projected or indicated in any forward looking statement. Such factors include, but are not limited to, the following: Our business is cyclical and is affected by industrial economic conditions. Many of the end-users of our products are in highly cyclical industries, such as general manufacturing and construction that are sensitive to changes in general economic conditions. Their demand for our products, and thus our results of operations, is directly related to the level of production in their facilities, which changes as a result of changes in general economic conditions and other factors beyond our control. During fiscal year 2010, we experienced significantly reduced demand for our products, generally as a result of the rapid and severe contraction in industrial markets worldwide. These lower levels of demand resulted in a significant decline in net sales as well as a decline in income from operations during that period. U.S. industrial capacity utilization has improved to 70.5% in March 2010 from historical low of 65.2% in June of 2009. Similarly, Eurozone industrial capacity utilization has improved to 75.5% in March 2010 compared with its June 2009 trough of 69.6%. However if the current economic trends fail to continue in FY 2011 with respect to the general economy or in the industries we serve, our business, results of operations and financial condition could be materially adversely affected. In addition, the cyclical nature of our business could at times also adversely affect our liquidity and ability to borrow under our revolving credit facility.

12
We are subject to the risk of loss resulting from financial institutions or customers defaulting on their obligations. Due to the general weakening of the, global economy and credit conditions over the past 18 months certain of the lenders in our senior credit facility may have a weakened financial condition related to their lending and other financial relationships. As a result, they may tighten their lending standards, which could make it more difficult for us to borrow under our credit facility or to obtain other financing on favorable terms or at all. Also, any cash balances with our banks are insured only up to $250,000 per bank by the FDIC, and any deposits in excess of this limit are also subject to risk. In addition, the weakening of the economy and the reduced availability of credit may have decreased the financial stability of our major customers and suppliers. As a result, it may be more difficult for us to collect our accounts receivable and outsource products and services to our suppliers. If any of these conditions were to occur, our financial condition and results of operations could be adversely affected. We rely in large part on independent distributors for sales of our products. For the most part, we depend on independent distributors to sell our products and provide service and aftermarket support to our end-user customers. Distributors play a significant role in determining which of our products are stocked at the branch locations, and hence are most readily accessible to aftermarket buyers, and the price at which these products are sold. Almost all of the distributors with whom we transact business offer competitive products and services to our end-user customers. For the most part, we do not have written agreements with our distributors located in the United States. The loss of a substantial number of these distributors or an increase in the distributors’ sales of our competitors’ products to our ultimate customers could materially reduce our sales and profits. We are subject to currency fluctuations from our international sales. Our products are sold in many countries around the world. Thus, a portion of our revenues (approximately $210 million in fiscal year 2010) is generated in foreign currencies, including principally the euro and the Canadian dollar, and while much of the costs incurred to generate those revenues are incurred in the same currency, a portion is incurred in other currencies. Since our financial statements are denominated in U.S. dollars, changes in currency exchange rates between the U.S. dollar and other currencies have had, and will continue to have, a currency translation impact on our earnings. Currency fluctuations may impact our financial performance in the future. Our international operations pose certain risks that may adversely impact sales and earnings. We have operations and assets located outside of the United States, primarily in China, Mexico, Germany, the United Kingdom, France, and Hungary. In addition, we import a portion of our hoist product line from Asia, and sell our products to distributors located in approximately 50 countries. In fiscal year 2010, approximately 44% of our net sales were derived from non-U.S. markets. These international operations are subject to a number of special risks, in addition to the risks of our U.S. business, including currency exchange rate fluctuations on transactions, differing protections of intellectual property, trade barriers, labor unrest, exchange controls, regional economic uncertainty, differing (and possibly more stringent) labor regulation, risk of governmental expropriation, U.S. and foreign customs and tariffs, current and changing regulatory environments, difficulty in obtaining distribution support, difficulty in staffing and managing widespread operations, differences in the availability and terms of financing, political instability and risks of increases in taxes. Also, in some foreign jurisdictions we may be subject to laws limiting the right and ability of entities organized or operating therein to pay dividends or remit earnings to affiliated companies unless specified conditions are met. These factors may adversely affect our future profits. Part of our strategy is to expand our worldwide market share and reduce costs by strengthening our international distribution capabilities and sourcing basic components in lower cost countries, in particular in China and Hungary. Implementation of this strategy may increase the impact of the risks described above, and we cannot assure you that such risks will not have an adverse effect on our business, results of operations or financial condition.
13
Our business is highly competitive and increased competition could reduce our sales, earnings and profitability. The principal markets that we serve within the material handling industry are fragmented and highly competitive. Competition is based primarily on customer service and support as well as product availability, performance, functionality, brand reputation, reliability and price. Our competition in the markets in which we participate comes from companies of various sizes, some of which have greater financial and other resources than we do. Increased competition could force us to lower our prices or to offer additional services at a higher cost to us, which could reduce our gross margins and net income.
The greater financial resources or the lower amount of debt of certain of our competitors may enable them to commit larger amounts of capital in response to changing market conditions. Certain competitors may also have the ability to develop product or service innovations that could put us at a disadvantage. In addition, some of our competitors have achieved substantially more market penetration in certain of the markets in which we operate. If we are unable to compete successfully against other manufacturers of material handling equipment, we could lose customers and our revenues may decline. There can also be no assurance that customers will continue to regard our products favorably, that we will be able to develop new products that appeal to customers, that we will be able to improve or maintain our profit margins on sales to our customers or that we will be able to continue to compete successfully in our core markets.
We are subject to debt covenant restrictions.
Our credit facility contains several financial and other restrictive covenants. A significant decline in our operating income or
cash generating ability could cause us to violate our leverage or fixed charge coverage ratios in our bank credit facility. This could result in our being unable to borrow under our bank credit facility or being obliged to refinance and renegotiate the terms of our bank indebtedness. Our strategy depends on successful integration of acquisitions. Acquisitions are a key part of our growth strategy. Our historical growth has depended, and our future growth is likely to depend on our ability to successfully implement our acquisition strategy, and the successful integration of acquired businesses into our existing operations. We intend to continue to seek additional acquisition opportunities in accordance with our acquisition strategy, both to expand into new markets and to enhance our position in existing markets throughout the world. If we are unable to successfully integrate acquired businesses into our existing operations or expand into new markets, our sales and earnings growth could be reduced. Our products involve risks of personal injury and property damage, which exposes us to potential liability.
Our business exposes us to possible claims for personal injury or death and property damage resulting from the products that we sell. We maintain insurance through a combination of self-insurance retentions and excess insurance coverage. We monitor claims and potential claims of which we become aware and establish accrued liability reserves for the self-insurance amounts based on our liability estimates for such claims. We cannot give any assurance that existing or future claims will not exceed our estimates for self-insurance or the amount of our excess insurance coverage. In addition, we cannot give any assurance that insurance will continue to be available to us on economically reasonable terms or that our insurers would not require us to increase our self-insurance amounts. Claims brought against us that are not covered by insurance or that result in recoveries in excess of insurance coverage could have a material adverse effect on our results and financial condition. Our future operating results may be affected by fluctuations in steel or other material prices. We may not be able to pass on increases in raw material costs to our customers. The principal raw material used in our chain, forging and crane building operations is steel. The steel industry as a whole is highly cyclical, and at times pricing and availability can be volatile due to a number of factors beyond our control, including general economic conditions, labor costs, competition, import duties, tariffs and currency exchange rates. This volatility can significantly affect our raw material costs. In an environment of increasing raw material prices, competitive conditions will determine how much of the steel price increases we can pass on to our customers. During historical rising cost periods, we were generally successful in adding and maintaining a surcharge to the prices of our high steel content products or incorporating them into price increases, with a goal of margin neutrality. In the future, to the extent we are unable to pass on any steel price increases to our customers, our profitability could be adversely affected.

14
We depend on our senior management team and the loss of any member could adversely affect our operations. Our success is dependent on the management and leadership skills of our senior management team. The loss of any of these individuals or an inability to attract, retain and maintain additional personnel could prevent us from implementing our business strategy. We cannot assure you that we will be able to retain our existing senior management personnel or to attract additional qualified personnel when needed. We have not entered into employment agreements with any of our senior management personnel with the exception of Dr. Ivo Celi, our Managing Director, EMEA and Wolfgang Wegener, our Vice President and former Managing Director of Columbus McKinnon Europe. We are subject to various environmental laws which may require us to expend significant capital and incur substantial cost. Our operations and facilities are subject to various federal, state, local and foreign requirements relating to the protection of the environment, including those governing the discharges of pollutants in the air and water, the generation, management and disposal of hazardous substances and wastes and the cleanup of contaminated sites. We have made, and will continue to make, expenditures to comply with such requirements. Violations of, or liabilities under, environmental laws and regulations, or changes in such laws and regulations (such as the imposition of more stringent standards for discharges into the environment), could result in substantial costs to us, including operating costs and capital expenditures, fines and civil and criminal sanctions, third party claims for property damage or personal injury, clean-up costs or costs relating to the temporary or permanent discontinuance of operations. Certain of our facilities have been in operation for many years, and we have remediated contamination at some of our facilities. Over time, we and other predecessor operators of such facilities have generated, used, handled and disposed of hazardous and other regulated wastes. Additional environmental liabilities could exist, including clean-up obligations at these locations or other sites at which materials from our operations were disposed, which could result in substantial future expenditures that cannot be currently quantified and which could reduce our profits or have an adverse effect on our financial condition. We rely on subcontractors or suppliers to perform their contractual obligations. Some of our contracts involve subcontracts with other companies upon which we rely to perform a portion of the services we must provide to our customers. There is a risk that we may have disputes with our subcontractors, including disputes regarding the quality and timeliness of work performed by our subcontractor or customer concerns about the subcontractor. Failure by our subcontractors to satisfactorily provide on a timely basis the agreed-upon supplies or perform the agreed upon services may materially and adversely impact our ability to perform our obligations as the prime contractor. A delay in our ability to obtain components and equipment parts from our suppliers may affect our ability to meet our customers’ needs and may have an adverse effect upon our profitability. Item 1B. Unresolved Staff Comments None.
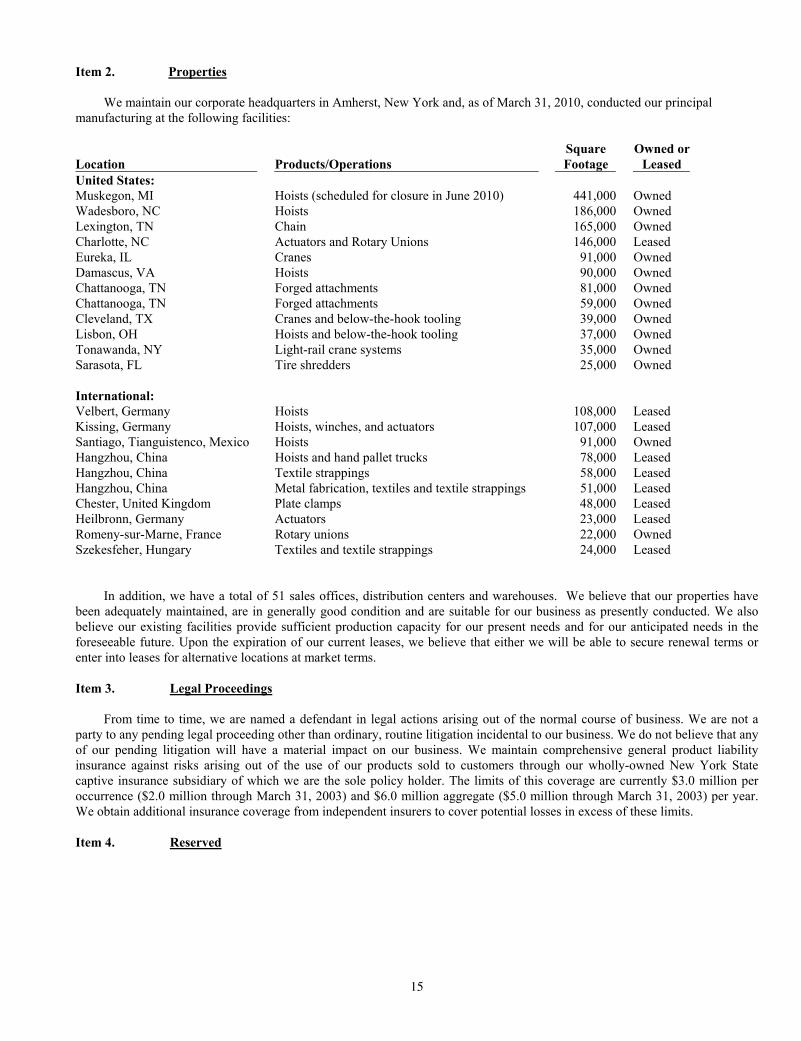
15
Item 2. Properties We maintain our corporate headquarters in Amherst, New York and, as of March 31, 2010, conducted our principal manufacturing at the following facilities:
Location
Products/Operations Square
Footage Owned or
Leased United States: Muskegon, MI Hoists (scheduled for closure in June 2010) 441,000 Owned Wadesboro, NC Hoists 186,000 Owned Lexington, TN Chain 165,000 Owned Charlotte, NC Actuators and Rotary Unions 146,000 Leased Eureka, IL Cranes 91,000 Owned Damascus, VA Hoists 90,000 Owned Chattanooga, TN Forged attachments 81,000 Owned Chattanooga, TN Forged attachments 59,000 Owned Cleveland, TX Cranes and below-the-hook tooling 39,000 Owned Lisbon, OH Hoists and below-the-hook tooling 37,000 Owned Tonawanda, NY Light-rail crane systems 35,000 Owned Sarasota, FL Tire shredders 25,000 Owned International: Velbert, Germany Hoists 108,000 Leased Kissing, Germany Hoists, winches, and actuators 107,000 Leased Santiago, Tianguistenco, Mexico Hoists 91,000 Owned Hangzhou, China Hoists and hand pallet trucks 78,000 Leased Hangzhou, China Textile strappings 58,000 Leased Hangzhou, China Metal fabrication, textiles and textile strappings 51,000 Leased Chester, United Kingdom Plate clamps 48,000 Leased Heilbronn, Germany Actuators 23,000 Leased Romeny-sur-Marne, France Rotary unions 22,000 Owned Szekesfeher, Hungary Textiles and textile strappings 24,000 Leased In addition, we have a total of 51 sales offices, distribution centers and warehouses. We believe that our properties have been adequately maintained, are in generally good condition and are suitable for our business as presently conducted. We also believe our existing facilities provide sufficient production capacity for our present needs and for our anticipated needs in the foreseeable future. Upon the expiration of our current leases, we believe that either we will be able to secure renewal terms or enter into leases for alternative locations at market terms. Item 3. Legal Proceedings From time to time, we are named a defendant in legal actions arising out of the normal course of business. We are not a party to any pending legal proceeding other than ordinary, routine litigation incidental to our business. We do not believe that any of our pending litigation will have a material impact on our business. We maintain comprehensive general product liability insurance against risks arising out of the use of our products sold to customers through our wholly-owned New York State captive insurance subsidiary of which we are the sole policy holder. The limits of this coverage are currently $3.0 million per occurrence ($2.0 million through March 31, 2003) and $6.0 million aggregate ($5.0 million through March 31, 2003) per year. We obtain additional insurance coverage from independent insurers to cover potential losses in excess of these limits. Item 4. Reserved

16
PART II Item 5. Market for the Company’s Common Stock and Related Security Holder Matters Our common stock is traded on the Nasdaq Stock Market under the symbol ‘‘CMCO.” As of April 30, 2010, there were 488 holders of record of our common stock. We do not currently pay cash dividends. Our current credit agreement allows, but limits our ability to pay dividends. We may reconsider or revise this policy from time to time based upon conditions then existing, including, without limitation, our earnings, financial condition, capital requirements, restrictions under credit agreements or other conditions our Board of Directors may deem relevant. The following table sets forth, for the fiscal periods indicated, the high and low sale prices per share for our common stock as reported on the Nasdaq Stock Market.
Price Range of Common Stock
High Low Year Ended March 31, 2009 First Quarter ..........................................................$ 32.87 $ 24.05 Second Quarter...................................................... 30.14 21.29 Third Quarter......................................................... 23.69 8.84 Fourth Quarter....................................................... 16.25 6.90 Year Ended March 31, 2010 First Quarter ..........................................................$ 15.32 $ 8.43 Second Quarter...................................................... 16.28 11.36 Third Quarter......................................................... 17.79 13.61 Fourth Quarter....................................................... 17.33 12.63
On May 21, 2010, the closing price of our common stock on the Nasdaq Stock Market was $16.56 per share.

17
PERFORMANCE GRAPH The Performance Graph shown below compares the cumulative total shareholder return on our common stock based on its market price, with the total return of the S&P MidCap 400 Index and the Dow Jones US Diversified Industrials. The comparison of total return assumes that a fixed investment of $100 was invested on March 31, 2005 in our common stock and in each of the foregoing indices and further assumes the reinvestment of dividends. The stock price performance shown on the graph is not necessarily indicative of future price performance.
COMPARISON OF 5 YEAR CUMULATIVE TOTAL RETURN*Among Columbus McKinnon Corporation, the S&P Midcap 400 Index
and the Dow Jones US Diversified Industrials Index
$0
$50
$100
$150
$200
$250
3/05 3/06 3/07 3/08 3/09 3/10
Columbus McKinnon Corporation
S&P Midcap 400
Dow Jones US Diversified Industrials
*$100 invested on 3/31/05 in stock or index, including reinvestment of dividends.Fiscal year ending March 31.
Copyright© 2010 S&P, a division of The McGraw-Hill Companies Inc. All rights reserved.Copyright© 2010 Dow Jones & Co. All rights reserved.

18
Item 6. Selected Financial Data
The consolidated balance sheets as of March 31, 2010 and 2009 and the related statements of operations, cash flows and shareholders’ equity for the three years ended March 31, 2010 and notes thereto appear elsewhere in this annual report. The selected consolidated financial data presented below should be read in conjunction with, and are qualified in their entirety by “Management’s Discussion and Analysis of Results of Operations and Financial Condition,” our consolidated financial statements and the notes thereto and other financial information included elsewhere in this annual report.
Year ended March 31st
2010 2009 2008 2007 2006
Statements of Operations Data: Net sales $ 476.1 606.7 $ 593.8 $ 550.5 $ 513.3 Cost of products sold 360.2 433.0 408.2 385.7 372.1 Gross profit 115.9 173.7 185.6 164.8 141.2 Selling expenses 64.4 72.6 69.9 59.4 51.9 General and administrative expenses 36.9 37.7 34.1 30.6 30.4 Restructuring charges (1) 16.5 1.9 0.8 (0.1) 1.6 Impairment loss (2) — 107.0 — — — Amortization of intangibles 1.9 1.0 0.1 0.2 0.3 (Loss) income from operations (3.8) (46.5) 80.7 74.7 57.0 Interest and debt expense 13.2 13.2 13.6 15.9 24.4 Other (income) and expense, net (4.2) (1.6) (2.6) (1.9) 5.3 (Loss) income before income taxes (12.8) (58.1) 69.7 60.7 27.3 Income tax (benefit) expense (5.3) 18.0 22.8 22.1 (31.4) (Loss) income from continuing operations (7.5) (76.1) 46.9 38.6 58.7 (Loss) income from discontinued operations (3) 0.5 (2.3) (9.6) (4.5) 1.1 Net (loss) income $ (7.0) (78.4) $ 37.3 $ 34.1 $ 59.8 Diluted (loss) earnings per share from continuing
operations $ (0.40) (4.16) $ 2.45 $ 2.04 $ 3.53Basic (loss) earnings per share from continuing
operations $ (0.40) (4.16) $ 2.50 $ 2.09 $ 3.66Weighted average shares outstanding – assuming
dilution 19.0 18.9 19.2 19.0 16.6Weighted average shares outstanding – basic 19.0 18.9 18.7 18.5 16.1
Balance Sheet Data (at end of period): Total assets $ 481.5 491.7 $ 590.0 $ 565.6 $ 566.0 Total debt (4) 132.8 137.9 133.3 159.4 204.3 Total debt, net of cash and cash equivalents 68.8 98.7 57.3 110.7 158.7 Total shareholders’ equity 187.3 181.9 295.5 241.3 204.4
Other Data:
Net cash provided by operating activities 29.9 60.2 59.6 45.5 46.4 Net cash used in investing activities (1.4) (65.5) (8.6) (3.4) (6.4) Net cash used in financing activities (5.4) (22.5) (28.6) (39.9) (4.2) Capital expenditures 7.2 12.2 12.5 10.5 8.2 Cash dividends per common share 0.00 0.00 0.00 0.00 0.00

19
(1) Refer to “Results of Operations” in “Item 7. Management’s Discussion and Analysis of Results of Operations and Financial Condition” for a discussion of the restructuring charges related to fiscal 2010, 2009, and 2008. The fiscal 2006 charges consist of the cost of removal of certain environmentally hazardous materials ($0.6 million), inventory disposal costs related to the rationalization of certain product families within our mechanical jack lines ($0.4 million), the ongoing maintenance costs of a non-operating facility accrued based on anticipated sale date ($0.3 million) and other facility rationalization projects ($0.3 million).
(2) The Company’s impairment testing is performed on an annual basis in the fourth quarter of each year. The Company
recorded a $107.0 million goodwill impairment charge in accordance with ASC Topic 350-20 during the fourth quarter of fiscal 2009. Refer to “Item 7. Management’s Discussion and Analysis of Results of Operations and Financial Condition” and Note 9 to our consolidated financial statements for additional information on Goodwill and Intangible Assets.
(3) In July 2008, the Company sold its integrated material handling conveyor systems business, Univeyor A/S and its results
of operations have been reflected as discontinued operations for all periods presented. In May 2002, the Company sold substantially all of the assets of ASI. As part of the sale of ASI, the Company received an 8% subordinated note in the principal amount of $6.8 million which is payable over 10 years beginning in August 2004. The full amount of this note has been reserved due to the uncertainty of collection. Principal payments received on the note are recorded as income from discontinued operations at the time of receipt. All interest and principal payments required under the note have been made to date. Refer to Note 4 to our consolidated financial statements for additional information on Discontinued Operations.
(4) Total debt includes all debt, including the current portion, notes payable and subordinated debt.
Item 7. Management’s Discussion and Analysis of Results of Operations and Financial Condition This section should be read in conjunction with our consolidated financial statements included elsewhere in this annual report. Comments on the results of operations and financial condition below refer to our continuing operations, except in the section entitled “Discontinued Operations.” EXECUTIVE OVERVIEW
We are a leading global designer, marketer and manufacturer of a wide variety of powered and manually operated wire rope and chain hoists, industrial crane systems, chain, hooks and other attachments, actuators, rotary unions, and tire shredders serving a wide variety of commercial and industrial end-user markets. Our products are used to efficiently and ergonomically move, lift, position or secure objects and loads. Founded in 1875, we have grown to our current size and leadership position through organic growth and acquisitions. We developed our leading market position over our 135-year history by emphasizing technological innovation, manufacturing excellence and superior after-sale service. In addition, acquisitions significantly broadened our product lines and services and expanded our geographic reach, end-user markets and customer base. Ongoing initiatives include improving our productivity and increasing penetration of the European, Latin American, and Asian marketplaces. In accordance with our strategy, we have been investing in our Lean efforts across the Company, new product development and directed sales and marketing activities. Shareholder value will be enhanced through continued emphasis on improvement of the fundamentals including new product development, market expansion, manufacturing efficiency, cost containment, efficient capital investment and a high degree of customer satisfaction.

20
Over the course of its history, the Company has resiliently withstood many business cycles and its strong cash flow profile has helped it to grow and expand globally. Reflecting on the recent global economic recession and credit crisis, we stand with a strong capital structure which includes excess cash reserves, significant revolver availability with an expiration of May 2013, fixed-rate long-term debt which expires in 2013 and a strong free cash flow business profile. We believe our liquidity strength and operational cost management actions have enabled us to withstand this downturn. During the first quarter of fiscal 2010, we consolidated our North American sales force and offered certain employees an incentive to voluntarily retire early. The early retirement program consisted of two benefits: a paid leave of absence and an enhanced pension benefit. In furtherance of our strategic reorganization, we completed the sale of one of our less strategic businesses, American Lifts, generating $2.4 million of proceeds during the third quarter of fiscal 2010. Further, we are managing our business through this cycle with a lower fixed cost footprint than prior cycles and are aggressively reducing our fixed cost base further as we strategically reorganize our North American hoist and rigging operations. The process includes the closure of two manufacturing facilities and the significant downsizing of a third facility, of which two of the three projects were completed in the third quarter of fiscal 2010 and the third schedule for completion during the first quarter of fiscal 2011. The closures will result in a reduction of approximately 500,000 square feet of manufacturing space and generation of annual savings estimated at approximately $13 - $15 million with approximately 77% of the total $18 - $19 million of restructuring charges related to manufacturing facility consolidation expected in fiscal 2010. These costs were being recognized beginning in the second quarter of fiscal 2010 and will continue into early fiscal 2011. We recorded total restructuring charges, including costs related to the early retirement program and paid leave of absence, of approximately $16.5 million in fiscal 2010 and incurred an additional $4.5 million of facility consolidation-related costs categorized as costs of products sold in fiscal 2010. Additionally, our revenue base now is more geographically diverse than in our Company’s history, with approximately 44% derived outside the U.S. in fiscal 2010, which we believe will help to balance the impact of changes that will occur in different global economies at different times. As in the past, we monitor U.S. and Eurozone Industrial Capacity Utilization as an indicator of anticipated demand for our product. These statistics weakened significantly between September 2008 and June 2009, but have since consistently improved through March 31, 2010. In addition, we continue to monitor the potential impact of other global and U.S. trends, including industrial production, energy costs, steel price fluctuations, interest rates, currency exchange and activity in a variety of end-user markets around the globe.
Regardless of the economic climate, we constantly explore ways to manage our operating margins as well as further
improve our productivity and competitiveness, regardless of the point in the economic cycle. We have specific initiatives related to improved customer satisfaction, reduction of defects, shortened lead times, improved inventory turns and on-time deliveries, reduction of warranty costs, and improved working capital utilization. The initiatives are being driven by the continued implementation of our Lean efforts which are fundamentally and culturally changing our manufacturing and business processes to be more responsive to customer demand and improving on-time delivery and productivity. In addition to Lean, we are working to achieve these strategic initiatives through product simplification, the creation of centers of excellence, and improved supply chain management. We continuously monitor market prices of steel. We utilize approximately $25.0 million to $35.0 million of steel annually in a variety of forms including rod, wire, bar, structural and others. Generally, as we experience fluctuations in our costs, we reflect them as price increases or surcharges to our customers with the goal of being margin neutral. Our steel costs have been relatively stable during this quarter despite an increase in structural steel pricing experienced as the result of higher scrap surcharges and the outsourcing of cut-to-length processes in conjunction with our plant rationalization. From a strategic perspective, we are investing in international markets and new products as we focus on our greatest opportunities for growth. We maintain a strong North American market share with significant leading market positions in hoists, lifting and sling chain , forged attachments and actuators. We seek to maintain and enhance our market share by continuing and focusing our sales and marketing activities directed toward select North American and global sectors including entertainment, energy, construction, mining and food processing. Our fiscal 2009 acquisition of Pfaff is enhancing our European market penetration as well as strengthening our global actuator offering. Further, we continue to invest in emerging market penetration, including the geographic regions of Asia, Eastern Europe, and Latin America. We complement these activities with continued investments in new product development, particularly products with global reach.

21
We are also looking for opportunities for growth via acquisitions or joint ventures. The focus of our acquisition strategy centers on opportunities for international revenue growth and product line expansion in alignment with our existing core offering.
We continue to operate in a highly competitive and global business environment, effectively managing through a global
economic cycle. We face a variety of opportunities in those markets and geographies, including trends toward increased utilization of the global labor force and the expansion of market opportunities in Asia and other emerging markets. While we continue to execute our long-term growth strategy, we have weathered this cycle with our strong capital structure, including a solid cash position and flexible cost base, aggressively addressing costs and restructuring to future margin opportunities. RESULTS OF OPERATIONS Fiscal 2010 sales were $476.2 million, down 21.5%, or $130.5 million compared with fiscal 2009. Our Pfaff acquisition contributed $71.5 million to our sales for fiscal 2010 with the remaining business being down 28.1%, or $158.0 million, excluding Pfaff. The decline in sales was primarily due to volume decline resulting from the global economic slow down. The divestiture of our American Lift business as well as fewer shipping days also contributed to lower sales in FY 2010 by approximately $5 million but was partially offset by favorable foreign currency impact of approximately $3.5 million. In fiscal 2009, net sales increased by $12.9 million to $606.7 million or 2.2% from fiscal 2008. Fiscal 2009 was marked by growth in the first half of the year followed by a significant decline in sales and orders received as a result of the rapid and severe contraction in industrial markets worldwide. Our Pfaff acquisition contributed $43.5 million to our sales growth in fiscal 2009 with the remaining business down approximately $30.6 million. Fiscal 2009 was also impacted by the recovery of the U.S. dollar relative to other currencies, particularly the Euro, and reported sales were unfavorably affected by $3.6 million.
Our gross profit margins were approximately 24.3%, 28.6% and 31.3% in fiscal 2010, 2009 and 2008, respectively. The fiscal 2010 decline in gross profit margin of $57.8 million or 33.3% compared with fiscal 2009 was mostly due to under absorption of costs due to lower volume in all markets. Restructuring charges related to factory consolidation of approximately $4.5 million as well as reserve related to an atypical product liability claim of $2.9 million also contributed to lower margin in fiscal 2010. Despite higher revenue, the fiscal 2009 margin compared with fiscal 2008 was negatively impacted by higher material, freight, and utility costs in the second and third quarters, one time accounting charges associated with the Pfaff acquisition in the third quarter, as well as under absorption of costs in the fiscal 2009 fourth quarter due to the rapid and significant decline in sales. Selling expenses were $64.4 million, $72.6 million and $69.9 million in fiscal 2010, 2009 and 2008, respectively. As a percentage of net sales, selling expenses were 13.5%, 12.0% and 11.8% in fiscal 2010, 2009 and 2008, respectively. Decreases in fiscal 2010 selling expense of $8.2 million or 11.3% reflect aggressive efforts to reduce or eliminate costs as well as lower salaries, benefits and commissions by $3.3 million on lower volume offset by $0.5 million in increased variable compensation expense. The fiscal 2009 increase was a result of the addition of the Pfaff business contributing $6.7 million and continued investments in our strategic growth initiatives offset by lower commissions/incentives of $2.0 million, marketing and travel expense of $1.0 million as a result of and in response to the economic slowdown, and translation of foreign currencies of $0.8 million. General and administrative expenses were $36.9 million, $37.7 million and $34.0 million in fiscal 2010, 2009 and 2008, respectively. As a percentage of net sales, general and administrative expenses were 7.7%, 6.2% and 5.7% in fiscal 2010, 2009 and 2008, respectively. Fiscal 2010 general and administrative expenses decreased by $0.8 million or 2.2% primarily due to lower pension/group health benefit costs of $1.2 million and lower bad debt expense of $1.1 million offset by increased variable compensation expense of $2.4 million, and other miscellaneous items. The fiscal 2009 increase was a result of the addition of the Pfaff business contributing $4.3 million, increased credit and collection reserves of $1.3 million, increased fees for professional services of $0.6 million and increased research and development costs of $0.4 million, offset by lower employee benefit costs including variable compensation of $2.5 million and foreign currency translation of $0.3 million. Restructuring charges of $16.5 million, $1.9 million and $0.8 million, or 3.5%, 0.3% and 0.1% of net sales were recorded in fiscal 2010, 2009 and 2008, respectively. Fiscal 2010 charges resulted from the consolidation of our North American sales force, early retirement benefits offered and costs associated with the closure and downsizing of manufacturing facilities (see further discussion above in Executive Overview). The 2009 charges are primarily severance costs related to a company-wide staff reduction effort in response to the sudden decline in economic conditions during the third and fourth quarters.

22
In the fourth quarter of 2009, we recorded an impairment charge of $107.0 million ($5.67 per diluted share) associated with goodwill. Based on impairment testing performed as of February 22, 2009, we determined that impairment existed for goodwill related to our rest of products reporting unit. Refer to Note 9 to our consolidated financial statements for additional information on Goodwill and Intangible Assets. There were no goodwill impairments in fiscal 2010 or fiscal 2008. Amortization of intangibles was $1.9 million, $1.0 million and $0.1 million in fiscal 2010, 2009 and 2008, respectively. The fiscal 2010 increase is attributable to a full year of amortization of intangible assets from the Pfaff acquisition. Interest and debt expense was $13.2 million, $13.2 million and $13.6 million in fiscal 2010, 2009 and 2008, respectively. As a percentage of net sales, interest and debt expense was 2.8%, 2.2% and 2.3% in fiscal 2010, 2009 and 2008, respectively. The fiscal 2009 decrease primarily resulted from slightly lower debt levels as we continue to execute our strategy of debt reduction and increased financial flexibility. We incurred ($0.2 million) and $1.8 million in fiscal 2009 and 2008, respectively, related to redemption (gain) costs associated with the repurchase of outstanding debt. In fiscal 2009, we recorded a $3.3 million gain from a litigation settlement. Investment (income) loss of ($1.5 million), $2.9 million, and ($1.2 million) in fiscal 2010, 2009 and 2008, respectively, related to marketable securities held in the Company’s wholly owned captive insurance subsidiary. The fiscal 2009 loss includes $4.0 million related to unrealized losses on securities that were determined to be other than temporary in nature. See Note 7 to our consolidated financial statements for additional information on Marketable Securities and were included in other income (expense). Foreign currency exchange (gain) loss was ($0.3) million, $3.0 million and $0.4 million in fiscal 2010, 2009 and 2008, respectively, as a result of foreign currency volatility related to purchases and intercompany debt. Other income, net was $2.3 million, $3.9 million, and $3.6 million in fiscal 2010, 2009 and 2008, respectively. Other income in fiscal 2010 includes a gain from the sale of the American Lifts business and a gain from the sale of an equity investment in Europe. Income tax (benefit) expense as a percentage of (loss) income from continuing operations before income tax (benefit) expense was (41.5) %, 31.0% and 32.7% in fiscal 2010, 2009 and 2008, respectively. After excluding the impact of the $107 million impairment charge, none of which is deductible for tax purposes, the effective tax rate for fiscal 2009 was 36.8%. The effective rate for fiscal 2010 was positively impacted by foreign tax benefits and from U.S. state net operating loss benefits. Fiscal 2009 income from continuing operations was adjusted for the $107 million goodwill impairment charge, none of which is deductible for tax purposes the percentages vary from the U.S. statutory rate due to varying effective tax rates at our foreign subsidiaries, and the jurisdictional mix of taxable income LIQUIDITY AND CAPITAL RESOURCES
Cash and cash equivalents totaled $63.9 million, $39.2 million, and $76.0 million at March 31, 2010, 2009 and 2008, respectively. $52.8 million of cash on hand was used for the Pfaff acquisition in October of 2008.
Net cash provided by operating activities was $29.9 million, $60.2 million and $59.6 million in fiscal 2010, 2009 and 2008,
respectively. The $30.3 million decrease in fiscal 2010 relative to fiscal 2009 was primarily due to lower operating performance on lower sales as a result of the continued weakness in the global economy as well as cash payments related to restructuring activities, partially offset by improved working capital management. Favorable changes in the net working capital affects on cash flows from operating activities included $19.8 million in inventory, $7.5 million in trade accounts payable, and $1.8 million in accrued and other non-current liabilities, partially offset by unfavorable changes in accounts receivable of $13.9 million and prepaid expenses and other assets of $2.7 million. Net cash provided by operating activities was $60.2 million in fiscal 2009, an increase of $0.6 million compared to fiscal 2008. The increase in cash provided by operating activities in fiscal 2009 relative to fiscal 2008 was primarily due to weaker operating performance in fiscal 2009 ($29.5 million) and an increase in cash used by discontinued operations ($1.6 million) offset by higher cash from working capital components of $30.9 million. Changes in net working capital included favorable changes of $27.7 million in accounts receivable, $10.8 million in inventory, and unfavorable changes in accounts payable of $15.0 million as a result of the declining volume of business.

23
Net cash used by investing activities was $1.4 million, $65.5 million and $8.6 million in fiscal 2010, 2009 and 2008, respectively. The fiscal 2010 decrease in cash used of $64.1 million compared to fiscal 2009 was primarily the result of $52.8 million of cash used in fiscal 2009 for the Pfaff acquisition as well as lower capital expenditures in fiscal 2010. The fiscal 2010, 2009 and 2008 amounts included $7.2 million, $12.2 million and $12.5 million for capital expenditures. The fiscal 2010, 2009 and 2008 amounts benefited from $3.5 million, $1.6 million, and $5.5 million, respectively, of proceeds from business, property and asset divestitures.
Net cash used by financing activities was $5.4 million, $22.5 million and $28.6.million in fiscal 2010, 2009 and 2008, respectively. The decrease in cash used by financing activities for fiscal 2010 compared to fiscal 2009 was due to less debt repayment from continuing operations of $2.1 million. The decrease in cash used by financing activities for fiscal 2009 compared to fiscal 2008 was due to less debt repayments from continuing operations of $21.5 million offset by an additional $14.2 million of payments by the Company on outstanding debt of its divested business, Univeyor. Fiscal 2010, 2009 and 2008 include $0.3 million, $0.4 million and $1.4 million, respectively, of proceeds from the exercise of employee stock options.
We entered into an amended, restated and expanded revolving credit facility dated December 31, 2009, providing availability up to a maximum of $85.0 million. We believe that our cash on hand, cash flows, and borrowing capacity under this recently amended Revolving Credit Facility will be sufficient to fund our ongoing operations, restructuring activities and budgeted capital expenditures for at least the next twelve months. This belief is dependent upon no significant further deterioration in the economy and successful execution of our current business plan which focuses on continued implementation of lean manufacturing, and improving working capital utilization, specifically inventory management.
The restated Revolving Credit Agreement has an initial term ending May 1, 2013, which can be extended to December 31,
2013 as long as our existing Senior Subordinated Notes are paid in full on or prior to May 1, 2013 from proceeds of permitted indebtedness with a maturity of no earlier than January 5, 2014.
Provided there is no default, we may, on a one-time basis, request an increase in the availability of the Revolving Credit
Facility by an amount not exceeding $65 million, subject to lender approval. The unused portion of the Revolving Credit Facility totaled $77.1 million, net of outstanding borrowings of $0 and outstanding letters of credit of $7.9 million, as of March 31, 2010. Interest on the revolver is payable at varying Eurodollar rates based on LIBOR or prime plus a spread determined by our total leverage ratio amounting to 300 or 200 basis points, respectively, based on our leverage ratio at March 31, 2010. The Revolving Credit Facility is secured by all domestic inventory, receivables, equipment, real property, subsidiary stock (limited to 65% of foreign subsidiaries) and intellectual property.
The restated Revolving Credit Facility Agreement places certain debt covenant restrictions on us, including certain financial
requirements and restrictions on dividend payments, with which we were in compliance as of March 31, 2010. Key financial covenants include a minimum fixed charge coverage ratio of 1.25x, a maximum total leverage ratio, net of cash, of 3.75x through June 30, 2010 and 3.5x thereafter, and maximum annual capital expenditures of $15 million in fiscal 2010 and $18 million thereafter excluding capital expenditures associated with a global ERP system.
The Senior Subordinated 8 7/8% Notes (8 7/8% Notes) issued on September 2, 2005 amounted to $124.9 million at March 31, 2010 and are due November 1, 2013. Provisions of the 8 7/8% Notes include, without limitation, restrictions on indebtedness, asset sales, and dividends and other restricted payments. On or after November 1, 2009, the 8 7/8% Notes are redeemable at the option of the Company, in whole or in part, at prices declining annually from 104.438% to 100% on and after November 1, 2011. In the event of a Change of Control (as defined in the indenture for such notes), each holder of the 8 7/8% Notes may require us to repurchase all or a portion of such holder’s 8 7/8% Notes at a purchase price equal to 101% of the principal amount thereof. The 8 7/8% Notes are guaranteed by certain existing and future U.S. subsidiaries and are not subject to any sinking fund requirements.
Our capital lease obligations related to property and equipment leases amounted to $7.0 million at March 31, 2010. Capital lease obligations are included in senior debt in the consolidated balance sheets.
Unsecured and uncommitted lines of credit are available to meet short-term working capital needs for certain of our subsidiaries operating outside of the U.S. The lines of credit are available on an offering basis, meaning that transactions under the line of credit will be on such terms and conditions, including interest rate, maturity, representations, covenants and events of default, as mutually agreed between our subsidiaries and the local bank at the time of each specific transaction. As of March 31, 2010, significant unsecured credit lines totaled approximately $7.1 million, of which $.8 million was drawn.
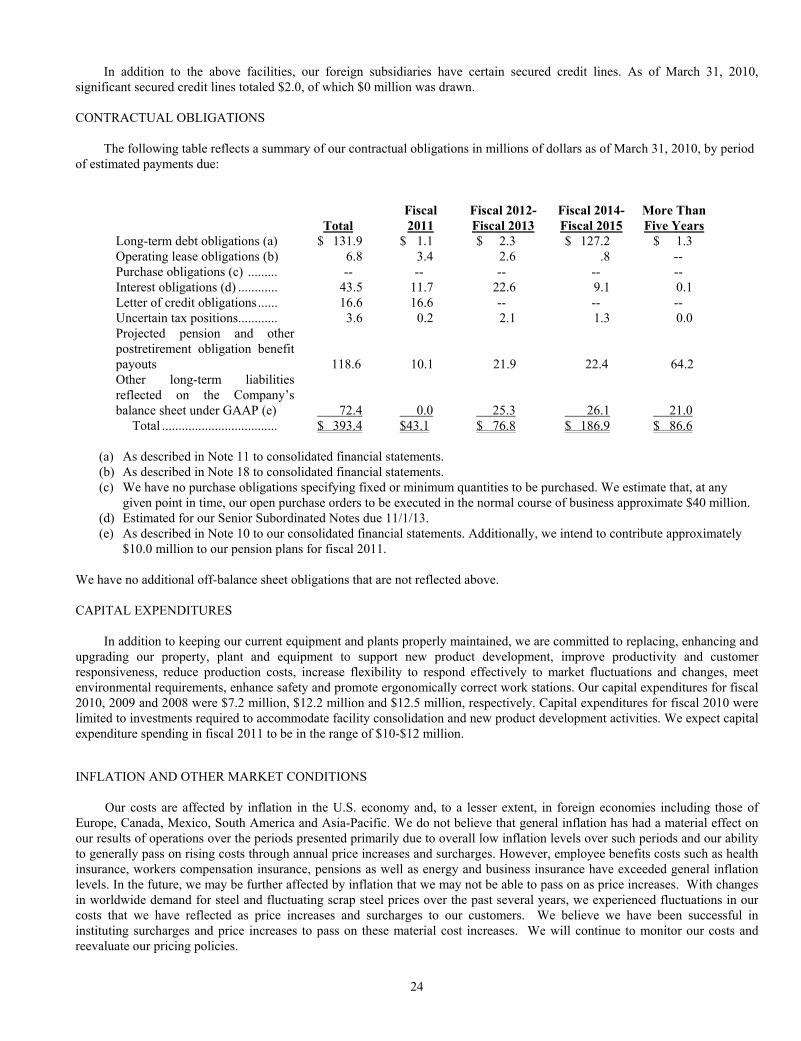
24
In addition to the above facilities, our foreign subsidiaries have certain secured credit lines. As of March 31, 2010, significant secured credit lines totaled $2.0, of which $0 million was drawn.
CONTRACTUAL OBLIGATIONS The following table reflects a summary of our contractual obligations in millions of dollars as of March 31, 2010, by period of estimated payments due:
Fiscal Fiscal 2012- Fiscal 2014- More Than Total 2011 Fiscal 2013 Fiscal 2015 Five Years Long-term debt obligations (a) $ 131.9 $ 1.1 $ 2.3 $ 127.2 $ 1.3 Operating lease obligations (b) 6.8 3.4 2.6 .8 -- Purchase obligations (c) ......... -- -- -- -- -- Interest obligations (d) ............ 43.5 11.7 22.6 9.1 0.1 Letter of credit obligations...... 16.6 16.6 -- -- -- Uncertain tax positions............ 3.6 0.2 2.1 1.3 0.0 Projected pension and other postretirement obligation benefit payouts 118.6 10.1 21.9 22.4 64.2 Other long-term liabilities reflected on the Company’s balance sheet under GAAP (e) 72.4 0.0 25.3 26.1 21.0 Total ................................... $ 393.4 $43.1 $ 76.8 $ 186.9 $ 86.6
(a) As described in Note 11 to consolidated financial statements. (b) As described in Note 18 to consolidated financial statements. (c) We have no purchase obligations specifying fixed or minimum quantities to be purchased. We estimate that, at any
given point in time, our open purchase orders to be executed in the normal course of business approximate $40 million. (d) Estimated for our Senior Subordinated Notes due 11/1/13. (e) As described in Note 10 to our consolidated financial statements. Additionally, we intend to contribute approximately
$10.0 million to our pension plans for fiscal 2011. We have no additional off-balance sheet obligations that are not reflected above. CAPITAL EXPENDITURES In addition to keeping our current equipment and plants properly maintained, we are committed to replacing, enhancing and upgrading our property, plant and equipment to support new product development, improve productivity and customer responsiveness, reduce production costs, increase flexibility to respond effectively to market fluctuations and changes, meet environmental requirements, enhance safety and promote ergonomically correct work stations. Our capital expenditures for fiscal 2010, 2009 and 2008 were $7.2 million, $12.2 million and $12.5 million, respectively. Capital expenditures for fiscal 2010 were limited to investments required to accommodate facility consolidation and new product development activities. We expect capital expenditure spending in fiscal 2011 to be in the range of $10-$12 million. INFLATION AND OTHER MARKET CONDITIONS Our costs are affected by inflation in the U.S. economy and, to a lesser extent, in foreign economies including those of Europe, Canada, Mexico, South America and Asia-Pacific. We do not believe that general inflation has had a material effect on our results of operations over the periods presented primarily due to overall low inflation levels over such periods and our ability to generally pass on rising costs through annual price increases and surcharges. However, employee benefits costs such as health insurance, workers compensation insurance, pensions as well as energy and business insurance have exceeded general inflation levels. In the future, we may be further affected by inflation that we may not be able to pass on as price increases. With changes in worldwide demand for steel and fluctuating scrap steel prices over the past several years, we experienced fluctuations in our costs that we have reflected as price increases and surcharges to our customers. We believe we have been successful in instituting surcharges and price increases to pass on these material cost increases. We will continue to monitor our costs and reevaluate our pricing policies.

25
SEASONALITY AND QUARTERLY RESULTS Our quarterly results may be materially affected by the timing of large customer orders, periods of high vacation and holiday concentrations, restructuring charges and other costs attributable to our facility rationalization program, divestitures, acquisitions and the magnitude of rationalization integration costs. Therefore, our operating results for any particular fiscal quarter are not necessarily indicative of results for any subsequent fiscal quarter or for the full fiscal year. DISCONTINUED OPERATIONS
As part of the continuing evaluation of our businesses, we determined that our integrated material handling conveyor systems business (Univeyor A/S) no longer provided a strategic fit with its long-term growth and operational objectives. On July 25, 2008, we completed the sale of Univeyor A/S, which business represented the majority of our former Solutions segment. In accordance with the provisions of ASC Topic 205-20 “Discontinued Operations” the results of operations of the Univeyor business have been classified as such in the condensed, consolidated balance sheets, statements of operations and statements of cash flows presented herein.
In connection with the sale of Univeyor A/S on July 25, 2008, we used cash on hand to repay $15.2 million in amounts
outstanding on Univeyor’s lines of credit and fixed term bank debt.
In May 2002, we completed the divestiture of substantially all of the assets of ASI which comprised the principal business unit in our former Solutions - Automotive segment. Proceeds from this sale included an 8% subordinated note in the principal amount of $6.8 million payable over 10 years. Due to the uncertainty of its collection, the note has been recorded at its estimated net realizable value of $0 at the time of the divestiture. Principal payments received on the note are recorded as income from discontinued operations at the time of receipt. Accordingly, $0.5 million of income from discontinued operations was recorded in fiscal 2010, net of tax. All interest and principal payments required under the note have been made to date. CRITICAL ACCOUNTING POLICIES AND ESTIMATES The preparation of financial statements in conformity with U.S. generally accepted accounting principles requires us to make estimates and assumptions that affect the amounts reported in our consolidated financial statements and accompanying notes. We continually evaluate the estimates and their underlying assumptions, which form the basis for making judgments about the carrying value of our assets and liabilities. Actual results inevitably will differ from those estimates. We have identified below the accounting policies involving estimates that are critical to our financial statements. Other accounting policies are more fully described in Note 2 of our consolidated financial statements. Pension and Other Postretirement Benefits. The determination of the obligations and expense for pension and postretirement benefits is dependent on our selection of certain assumptions that are used by actuaries in calculating such amounts. Those assumptions are disclosed in Note 12 to our fiscal 2010 consolidated financial statements and include the discount rates, expected long-term rate of return on plan assets and rates of future increases in compensation and healthcare costs. The pension discount rate assumptions of 6%, 7¼%, and 6½% as of March 31, 2010, 2009, and 2008, respectively, are primarily based on long-term AA rated corporate bond rates. The decrease in the discount rate for fiscal 2010 resulted in a $33.9 million increase in projected benefit obligation. The increase in the discount rates for fiscal 2009, and 2008 resulted in an $11.2 million, and $8.4 million, respectively, decrease in the projected benefit obligation as of March 31, 2009, and 2008, respectively. The rate of return on plan assets assumptions of 7½% for each of the years ended March 31, 2010, 2009 and 2008 is based on the composition of the asset portfolios (approximately 70% equities and 30% fixed income at March 31, 2010) and their long-term historical returns. The assets realized actual gain of $30.5 million in fiscal 2010 and actual losses of $34.9 million in fiscal 2009 as a result of the significant volatility in US capital markets in fiscal 2010 and fiscal 2009. The assets realized gains of $6.9 million in fiscal 2008. Our under-funded status as of March 31, 2010 and 2009 was $36.8 million and $48.9 million, or 21.8% and 34.9% of the projected benefit obligation, respectively. Our pension contributions during fiscal 2010 and 2009 were approximately $18.0 million and $9.3 million, respectively. The under-funded status may result in future pension expense increases. Pension expense for the March 31, 2011 fiscal year is expected to approximate $7.2 million, which is down from the fiscal 2010 amount of $12.6 million due to a decrease in amortization of unrecognized losses, improved expected returns on the somewhat recovered asset values and curtailment expenses of $2.4 million not expected to re-occur. Pension funding contributions for the March 31, 2011 fiscal year is expected to decrease by approximately $9.0 million compared to fiscal 2010. The compensation increase assumption of 2% as of March 31, 2010 and 2% as of March 31, 2009 and 3% as of March 31, 2008 is based on expected wage trends and historical patterns.

26
The healthcare costs inflation assumptions of 8.0%, 8.75% and 9.5% for fiscal 2011, 2010, and 2009, respectively, are based on anticipated trends. Healthcare costs in the United States have increased substantially over the last several years. If this trend continues, the cost of postretirement healthcare will increase in future years. Insurance Reserves. Our accrued general and product liability reserves as described in Note 15 to consolidated financial statements involve actuarial techniques including the methods selected to estimate ultimate claims, and assumptions including emergence patterns, payment patterns, initial expected losses and increased limit factors. These actuarial estimates are subject to a high degree of uncertainty due to a variety of factors, including extended lag time in the reporting and resolution of claims, trends or changes in claim settlement patterns, insurance industry practices, and legal interpretations. As a result, actual costs could differ significantly from the estimated amounts. Adjustments to estimated reserves are recorded in the period in which the change in estimate occurs. Other insurance reserves such as workers compensation and group health insurance are based on actual historical and current claim data provided by third party administrators or internally maintained. Inventory and Accounts Receivable Reserves. Slow-moving and obsolete inventory reserves are judgmentally determined based on formulas applied to historical and expected future usage within a reasonable timeframe. We reassess trends and usage on a regular basis and if we identify changes, we revise our estimated allowances. Allowances for doubtful accounts and credit memo reserves are also judgmentally determined based on formulas applied to historical bad debt write-offs and credit memos issued, assessing potentially uncollectible customer accounts and analyzing the accounts receivable aging.
Impairment of depreciable and amortizable long-lived assets. Property, plant and equipment and certain intangibles are depreciated or amortized over their assigned lives. We test long-lived assets for impairment when events or changes in circumstances indicate that the carrying amount of those assets may not be recoverable and exceed their fair market value. The following summarizes the value of long-lived assets subject to impairment testing when events or circumstances indicate potential impairment (amounts in millions):
Balance as of
March 31, 2010 Property, plant and equipment, net $ 57.1 Acquired intangibles with estimable useful lives 19.0 Other assets 4.0
Impairment may exist if the carrying amount of the asset in question exceeds the sum of the undiscounted cash flows expected to result from the use of the asset. The impairment loss, if any, would be measured as the amount by which the carrying amount of a long-lived asset exceeds its fair market value as determined by appropriate valuation techniques.
Goodwill impairment testing. Our goodwill balance, $105.1 million as of March 31, 2010, is subject to impairment testing.
We test goodwill for impairment at least annually, as of the end of February, and more frequently whenever events occur or circumstances change that indicate there may be impairment. These events or circumstances could include a significant long-term adverse change in the business climate, poor indicators of operating performance, or a sale or disposition of a significant portion of a reporting unit.
We test goodwill at the reporting unit level, which is one level below our operating segment. We identify our reporting
units by assessing whether the components of our operating segment constitute businesses for which discrete financial information is available and segment management regularly reviews the operating results of those components. We also aggregate components that have similar economic characteristics into single reporting units (for example, similar products and / or services, similar long-term financial results, product processes, classes of customers, etc.). We have four reporting units, only two of which have goodwill. Our Duff Norton reporting unit and Rest of Products reporting unit have goodwill totaling $9.8 million and $95.3 million at March 31, 2010, respectively.
During fiscal 2010, we tested goodwill for impairment as of September 30, 2009 for the Duff-Norton reporting units
because key performance indicators for this reporting unit were below budget and prior year levels. Accordingly, we performed Step I impairment testing as of the end of the second quarter. Step I testing was not considered necessary for our other reporting unit with goodwill because, based on testing performed in the prior year, the fair value of the reporting unit sufficiently exceeded book value and no new risks of impairment existed at September 30, 2009. Based on our assessment as of September 30, 2009, the fair value of the Duff-Norton reporting unit exceeded its net book value by 6%; as such, no impairment charges related to goodwill or intangible assets were recorded during the six month period ended September 30, 2009. As of December 31, 2009, we concluded that no indicators of goodwill impairment existed, so an interim test was not performed.
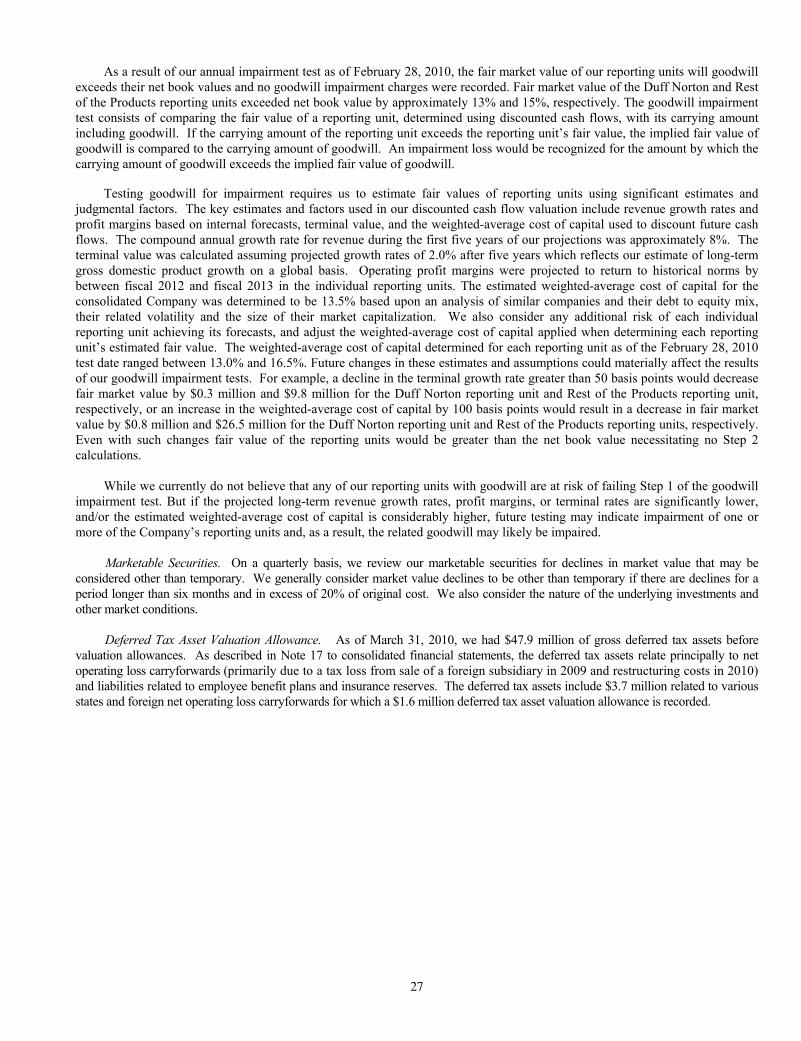
27
As a result of our annual impairment test as of February 28, 2010, the fair market value of our reporting units will goodwill exceeds their net book values and no goodwill impairment charges were recorded. Fair market value of the Duff Norton and Rest of the Products reporting units exceeded net book value by approximately 13% and 15%, respectively. The goodwill impairment test consists of comparing the fair value of a reporting unit, determined using discounted cash flows, with its carrying amount including goodwill. If the carrying amount of the reporting unit exceeds the reporting unit’s fair value, the implied fair value of goodwill is compared to the carrying amount of goodwill. An impairment loss would be recognized for the amount by which the carrying amount of goodwill exceeds the implied fair value of goodwill.
Testing goodwill for impairment requires us to estimate fair values of reporting units using significant estimates and judgmental factors. The key estimates and factors used in our discounted cash flow valuation include revenue growth rates and profit margins based on internal forecasts, terminal value, and the weighted-average cost of capital used to discount future cash flows. The compound annual growth rate for revenue during the first five years of our projections was approximately 8%. The terminal value was calculated assuming projected growth rates of 2.0% after five years which reflects our estimate of long-term gross domestic product growth on a global basis. Operating profit margins were projected to return to historical norms by between fiscal 2012 and fiscal 2013 in the individual reporting units. The estimated weighted-average cost of capital for the consolidated Company was determined to be 13.5% based upon an analysis of similar companies and their debt to equity mix, their related volatility and the size of their market capitalization. We also consider any additional risk of each individual reporting unit achieving its forecasts, and adjust the weighted-average cost of capital applied when determining each reporting unit’s estimated fair value. The weighted-average cost of capital determined for each reporting unit as of the February 28, 2010 test date ranged between 13.0% and 16.5%. Future changes in these estimates and assumptions could materially affect the results of our goodwill impairment tests. For example, a decline in the terminal growth rate greater than 50 basis points would decrease fair market value by $0.3 million and $9.8 million for the Duff Norton reporting unit and Rest of the Products reporting unit, respectively, or an increase in the weighted-average cost of capital by 100 basis points would result in a decrease in fair market value by $0.8 million and $26.5 million for the Duff Norton reporting unit and Rest of the Products reporting units, respectively. Even with such changes fair value of the reporting units would be greater than the net book value necessitating no Step 2 calculations.
While we currently do not believe that any of our reporting units with goodwill are at risk of failing Step 1 of the goodwill
impairment test. But if the projected long-term revenue growth rates, profit margins, or terminal rates are significantly lower, and/or the estimated weighted-average cost of capital is considerably higher, future testing may indicate impairment of one or more of the Company’s reporting units and, as a result, the related goodwill may likely be impaired. Marketable Securities. On a quarterly basis, we review our marketable securities for declines in market value that may be considered other than temporary. We generally consider market value declines to be other than temporary if there are declines for a period longer than six months and in excess of 20% of original cost. We also consider the nature of the underlying investments and other market conditions. Deferred Tax Asset Valuation Allowance. As of March 31, 2010, we had $47.9 million of gross deferred tax assets before valuation allowances. As described in Note 17 to consolidated financial statements, the deferred tax assets relate principally to net operating loss carryforwards (primarily due to a tax loss from sale of a foreign subsidiary in 2009 and restructuring costs in 2010) and liabilities related to employee benefit plans and insurance reserves. The deferred tax assets include $3.7 million related to various states and foreign net operating loss carryforwards for which a $1.6 million deferred tax asset valuation allowance is recorded.
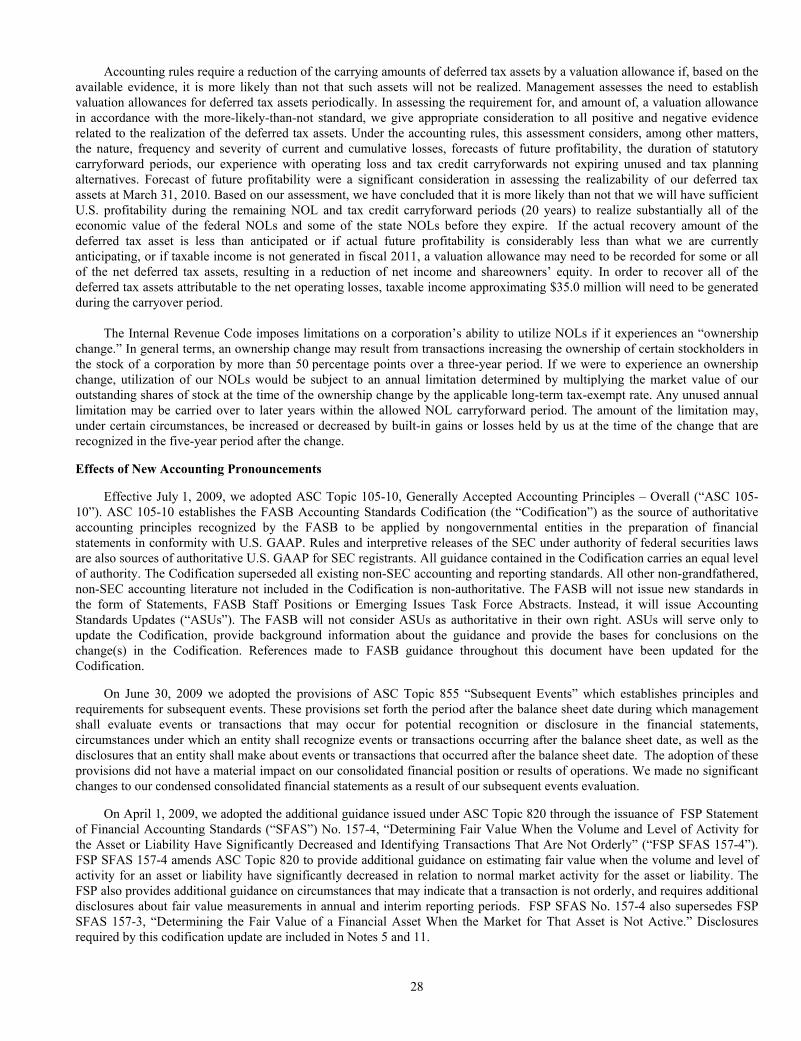
28
Accounting rules require a reduction of the carrying amounts of deferred tax assets by a valuation allowance if, based on the available evidence, it is more likely than not that such assets will not be realized. Management assesses the need to establish valuation allowances for deferred tax assets periodically. In assessing the requirement for, and amount of, a valuation allowance in accordance with the more-likely-than-not standard, we give appropriate consideration to all positive and negative evidence related to the realization of the deferred tax assets. Under the accounting rules, this assessment considers, among other matters, the nature, frequency and severity of current and cumulative losses, forecasts of future profitability, the duration of statutory carryforward periods, our experience with operating loss and tax credit carryforwards not expiring unused and tax planning alternatives. Forecast of future profitability were a significant consideration in assessing the realizability of our deferred tax assets at March 31, 2010. Based on our assessment, we have concluded that it is more likely than not that we will have sufficient U.S. profitability during the remaining NOL and tax credit carryforward periods (20 years) to realize substantially all of the economic value of the federal NOLs and some of the state NOLs before they expire. If the actual recovery amount of the deferred tax asset is less than anticipated or if actual future profitability is considerably less than what we are currently anticipating, or if taxable income is not generated in fiscal 2011, a valuation allowance may need to be recorded for some or all of the net deferred tax assets, resulting in a reduction of net income and shareowners’ equity. In order to recover all of the deferred tax assets attributable to the net operating losses, taxable income approximating $35.0 million will need to be generated during the carryover period.
The Internal Revenue Code imposes limitations on a corporation’s ability to utilize NOLs if it experiences an “ownership
change.” In general terms, an ownership change may result from transactions increasing the ownership of certain stockholders in the stock of a corporation by more than 50 percentage points over a three-year period. If we were to experience an ownership change, utilization of our NOLs would be subject to an annual limitation determined by multiplying the market value of our outstanding shares of stock at the time of the ownership change by the applicable long-term tax-exempt rate. Any unused annual limitation may be carried over to later years within the allowed NOL carryforward period. The amount of the limitation may, under certain circumstances, be increased or decreased by built-in gains or losses held by us at the time of the change that are recognized in the five-year period after the change. Effects of New Accounting Pronouncements
Effective July 1, 2009, we adopted ASC Topic 105-10, Generally Accepted Accounting Principles – Overall (“ASC 105-10”). ASC 105-10 establishes the FASB Accounting Standards Codification (the “Codification”) as the source of authoritative accounting principles recognized by the FASB to be applied by nongovernmental entities in the preparation of financial statements in conformity with U.S. GAAP. Rules and interpretive releases of the SEC under authority of federal securities laws are also sources of authoritative U.S. GAAP for SEC registrants. All guidance contained in the Codification carries an equal level of authority. The Codification superseded all existing non-SEC accounting and reporting standards. All other non-grandfathered, non-SEC accounting literature not included in the Codification is non-authoritative. The FASB will not issue new standards in the form of Statements, FASB Staff Positions or Emerging Issues Task Force Abstracts. Instead, it will issue Accounting Standards Updates (“ASUs”). The FASB will not consider ASUs as authoritative in their own right. ASUs will serve only to update the Codification, provide background information about the guidance and provide the bases for conclusions on the change(s) in the Codification. References made to FASB guidance throughout this document have been updated for the Codification.
On June 30, 2009 we adopted the provisions of ASC Topic 855 “Subsequent Events” which establishes principles and requirements for subsequent events. These provisions set forth the period after the balance sheet date during which management shall evaluate events or transactions that may occur for potential recognition or disclosure in the financial statements, circumstances under which an entity shall recognize events or transactions occurring after the balance sheet date, as well as the disclosures that an entity shall make about events or transactions that occurred after the balance sheet date. The adoption of these provisions did not have a material impact on our consolidated financial position or results of operations. We made no significant changes to our condensed consolidated financial statements as a result of our subsequent events evaluation.
On April 1, 2009, we adopted the additional guidance issued under ASC Topic 820 through the issuance of FSP Statement of Financial Accounting Standards (“SFAS”) No. 157-4, “Determining Fair Value When the Volume and Level of Activity for the Asset or Liability Have Significantly Decreased and Identifying Transactions That Are Not Orderly” (“FSP SFAS 157-4”). FSP SFAS 157-4 amends ASC Topic 820 to provide additional guidance on estimating fair value when the volume and level of activity for an asset or liability have significantly decreased in relation to normal market activity for the asset or liability. The FSP also provides additional guidance on circumstances that may indicate that a transaction is not orderly, and requires additional disclosures about fair value measurements in annual and interim reporting periods. FSP SFAS No. 157-4 also supersedes FSP SFAS 157-3, “Determining the Fair Value of a Financial Asset When the Market for That Asset is Not Active.” Disclosures required by this codification update are included in Notes 5 and 11.
29
On April 1, 2009, we adopted the additional guidance issued under ASC Topic 320 and ASC Topic 325 through the issuance of FSP SFAS No. 115-2 and SFAS No. 124-2, “Recognition and Presentation of Other-Than-Temporary Impairments” (“FSP SFAS 115-2 / 124-2”). This FSP extends existing disclosure requirements about debt and equity securities to interim reporting periods as well as provides new disclosure requirements. FSP SFAS 115-2 / 124-2 also provides new guidance on the recognition and presentation of an other-than-temporary impairment for debt securities classified as available for sale or held to maturity. Equity securities are excluded from the scope the FSP’s recognition and measurement provisions. Refer to Note 7 to consolidated financial statements for disclosures required as a result of the adoption of this codification update.
On April 1, 2009, we adopted additional guidance issued under ASC Topic 825 “Financial Instruments” through the issuance of FSP SFAS No. 107-1, “Interim Disclosures about Fair Value of Financial Instruments” (“FSP SFAS 107-1”) which requires disclosures about fair value of financial instruments in financial statements for interim reporting periods and in annual financial statements of publicly-traded companies. These provisions also require entities to disclose the method(s) and significant assumptions used to estimate the fair value of financial instruments in financial statements on an interim and annual basis and to highlight any changes from prior periods. The adoption of these provisions did not have a material impact on our consolidated financial position, results of operations or cash flows. Disclosures required by this codification update are included in Notes 5 and 11 to consolidated financial statements.
On April 1, 2009, we adopted the additional guidance issued under ASC Topic 815 “Derivatives and Hedging” through the
issuance of SFAS No. 161 “Disclosures about Derivative Instruments and Hedging Activities – an amendment of FASB Statement No. 133” which requires additional disclosures about the objectives of derivative instruments and hedging activities, the method of accounting for such instruments and a tabular disclosure of the effects of such instruments and related hedged items on our financial position, financial performance, and cash flows. The adoption of these provisions did not have a material impact on our consolidated financial position, results of operations or cash flows. On April 1, 2008, the Company adopted the measurement provisions related to Split Dollar Life Insurance Arrangements contained in ASC Topic 715 and covered in paragraphs 715-60-35-177 to 35-185 (formerly under the pre-codification standards of EITF 06-10). In accordance with ASC Topic 715-60-35-177, an employer should recognize a liability for the postretirement benefit related to a collateral assignment split-dollar life insurance arrangement. These provisions were applied as a change in accounting principle through a cumulative-effect adjustment to retained earnings. The adoption of this guidance resulted in a $1.2 million reduction to the fiscal 2009 opening balance of retained earnings, recorded on April 1, 2008, the date of adoption. The adoption of ASC Topic 715 did not have a significant impact on our financial position, results of operations or cash flows, or basic or diluted per share amounts.
On April 1, 2009, we adopted the provisions of ASC Topic 805 “Business Combinations” which requires the acquiring entity in a business combination to recognize all the assets acquired and liabilities assumed in the transaction; establishes the acquisition-date fair value as the measurement objective for all assets acquired and liabilities assumed; and requires the acquirer to disclose all of the information required to evaluate and understand the nature and financial effect of the business combination. We adopted these provisions effective April 1, 2009 for future acquisitions and for deferred tax adjustments related to acquisitions completed before its effective date. In December 2008, the FASB issued additional guidance under ASC Topic 715 to require additional disclosures about assets held in an employer’s defined benefit pension or other postretirement plan. This replaces the requirement to disclose the percentage of the fair value of total plan assets for each major category of plan assets, such as equity securities, debt securities, real estate and all other assets, with the fair value of each major asset category as of each annual reporting date for which a financial statement is presented. It also requires disclosure of the level within the fair value hierarchy in which each major category of plan assets falls, using the guidance in ASC Topic 820. This requirement is applicable for fiscal years ending after December 15, 2009. We will comply with these disclosure provisions after its effective date. We do not expect the adoption of this requirement to have a material impact on our consolidated financial position, results of operations or cash flows.

30
Safe Harbor Statement under the Private Securities Litigation Reform Act of 1995 This report may include “forward-looking statements” within the meaning of the Private Securities Litigation Reform Act of 1995. Such statements involve known and unknown risks, uncertainties and other factors that could cause our actual results to differ materially from the results expressed or implied by such statements, including general economic and business conditions, conditions affecting the industries served by us and our subsidiaries, conditions affecting our customers and suppliers, competitor responses to our products and services, the overall market acceptance of such products and services, facility consolidations and other restructurings, our asbestos-related liability, the integration of acquisitions and other factors disclosed in our periodic reports filed with the Commission. Consequently such forward-looking statements should be regarded as our current plans, estimates and beliefs. We do not undertake and specifically decline any obligation to publicly release the results of any revisions to these forward-looking statements that may be made to reflect any future events or circumstances after the date of such statements or to reflect the occurrence of anticipated or unanticipated events. Item 7A. Quantitative and Qualitative Disclosures About Market Risk Market risk is the potential loss arising from adverse changes in market rates and prices, such as interest rates. We are exposed to various market risks, including commodity prices for raw materials, foreign currency exchange rates and changes in interest rates. We may enter into financial instrument transactions, which attempt to manage and reduce the impact of such changes. We do not enter into derivatives or other financial instruments for trading or speculative purposes. Our primary commodity risk is related to changes in the price of steel. We control this risk through negotiating purchase contracts on a consolidated basis and by attempting to build changes in raw material costs into the selling prices of or surcharges on our products. We have not entered into financial instrument transactions related to raw material costs. In fiscal 2010, 39% of our net sales were from manufacturing plants and sales offices in foreign jurisdictions. We manufacture our products in the United States, Mexico, China, the United Kingdom, France, Hungary and Germany and sell our products in over 50 countries. Our results of operations could be affected by factors such as changes in foreign currency rates or weak economic conditions in foreign markets. Our operating results are exposed to fluctuations between the U.S. dollar and the Canadian dollar, European currencies, the Mexican peso and the Chinese Yuan. For example, when the U.S. dollar weakens against the Euro, the value of our net sales and net income denominated in Euros increases when translated into U.S. dollars for inclusion in our consolidated results. We are also exposed to foreign currency fluctuations in relation to purchases denominated in foreign currencies. Our foreign currency risk is mitigated since the majority of our foreign operations’ net sales and the related expense transactions are denominated in the same currency so therefore a significant change in foreign exchange rates would likely have a very minor impact on net income. For example, a 10% decline in the rate of exchange between the euro and the U.S. dollar impacts net income by approximately $0.4 million. In addition, the majority of our export sale transactions are denominated in U.S. dollars.
During 2009, the Company entered into cross-currency swaps and foreign exchange forward agreements to hedge changes in the value of intercompany loans to certain foreign subsidiaries due to changes in foreign exchange rates. The notional amount of these derivatives is $18.3 million and all contracts mature by September 30, 2013. As of March 31, 2010, the fair value of these derivatives was a $0.8 million loss that was recorded to earnings and is included in foreign currency exchange loss. We control risk related to changes in interest rates by structuring our debt instruments with a combination of fixed and variable interest rates and by periodically entering into financial instrument transactions as appropriate. At March 31, 2010, we do not have any material swap agreements or similar financial instruments in place. At March 31, 2010 and 2009, approximately 94% and 91% of our outstanding debt had fixed interest rates, respectively. At those dates, we had approximately $8.0 million and $11.9 million, respectively, of outstanding variable rate debt. A 1% fluctuation in interest rates would have changed interest expense on that outstanding variable rate debt by approximately $0.1 million in fiscal 2010 and 2009.
Like many industrial manufacturers, we are involved in asbestos-related litigation. In continually evaluating costs relating to our estimated asbestos-related liability, we review, among other things, the incidence of past and recent claims, the historical case dismissal rate, the mix of the claimed illnesses and occupations of the plaintiffs, our recent and historical resolution of the cases, the number of cases pending against us, the status and results of broad-based settlement discussions, and the number of years such activity might continue. Based on this review, we have estimated our share of liability to defend and resolve probable asbestos-related personal injury claims. This estimate is highly uncertain due to the limitations of the available data and the difficulty of forecasting with any certainty the numerous variables that can affect the range of the liability. We will continue to study the variables in light of additional information in order to identify trends that may become evident and to assess their impact on the range of liability that is probable and estimable.

31
Based on actuarial information, we have estimated our asbestos-related aggregate liability through March 31, 2028 and March 31, 2040 to range between $7.4 million and $17.8 million using actuarial parameters of continued claims for a period of 18 to 30 years. Our estimation of our asbestos-related aggregate liability that is probable and estimable, in accordance with U.S. generally accepted accounting principles approximates $11 million which has been reflected as a liability in the consolidated financial statements as of March 31, 2010. The recorded liability does not consider the impact of any potential favorable federal legislation. This liability may fluctuate based on the uncertainty in the number of future claims that will be filed and the cost to resolve those claims, which may be influenced by a number of factors, including the outcome of the ongoing broad-based settlement negotiations, defensive strategies, and the cost to resolve claims outside the broad-based settlement program. Of this amount, management expects to incur asbestos liability payments of approximately $0.5 million over the next 12 months. Because payment of the liability is likely to extend over many years, management believes that the potential additional costs for claims will not have a material after-tax effect on our financial condition or our liquidity, although the net after-tax effect of any future liabilities recorded could be material to earnings in a future period.

F-1
Item 8. Financial Statements and Supplementary Data.
INDEX TO CONSOLIDATED FINANCIAL STATEMENTS Columbus McKinnon Corporation Audited Consolidated Financial Statements as of March 31, 2010: Report of Ernst & Young LLP, Independent Registered Public Accounting Firm............................................. F-2 Consolidated Balance Sheets.............................................................................................................................. F-3 Consolidated Statements of Operations.............................................................................................................. F-4 Consolidated Statements of Shareholders’ Equity.............................................................................................. F-5 Consolidated Statements of Cash Flows............................................................................................................. F-6 Notes to Consolidated Financial Statements 1. Description of Business ........................................................................................................................ F-7 2. Accounting Principles and Practices ..................................................................................................... F-7 3. Acquisitions .......................................................................................................................................... F-12 4. Divestitures ........................................................................................................................................... F-13 5. Fair Value Measurements ..................................................................................................................... F-13 6. Inventories ............................................................................................................................................ F-16 7. Marketable Securities............................................................................................................................ F-16 8. Property, Plant, and Equipment ............................................................................................................ F-18 9. Goodwill and Intangible Assets ............................................................................................................ F-18 10. Accrued Liabilities and Other Non-current Liabilities.......................................................................... F-21 11. Debt....................................................................................................................................................... F-21 12. Pensions and Other Benefit Plans ......................................................................................................... F-23 13. Employee Stock Ownership Plan (ESOP) ............................................................................................ F-28 14. Earnings per Share and Stock Plans...................................................................................................... F-29 15. Loss Contingencies ............................................................................................................................... F-34 16. Restructuring Charges........................................................................................................................... F-36 17. Income Taxes ........................................................................................................................................ F-37 18. Rental Expense and Lease Commitments ............................................................................................. F-39 19. Summary Financial Information ........................................................................................................... F-40 20. Business Segment Information ............................................................................................................. F-44 21. Selected Quarterly Financial Data (unaudited) ..................................................................................... F-45 22. Accumulated Other Comprehensive Loss............................................................................................. F-45 23. Effects of New Accounting Pronouncements ....................................................................................... F-46 Schedule II – Valuation and Qualifying Accounts. ........................................................................................ F-49

F-2
Report of Ernst & Young LLP, Independent Registered Public Accounting Firm
The Board of Directors and Shareholders of Columbus McKinnon Corporation We have audited the accompanying consolidated balance sheets of Columbus McKinnon Corporation as of March 31, 2010 and 2009, and the related consolidated statements of operations, shareholders' equity and cash flows for each of the three years in the period ended March 31, 2010. Our audits also included the financial statement schedule listed in the Index at Item 15(2). These financial statements and schedule are the responsibility of the Company's management. Our responsibility is to express an opinion on these financial statements and schedule based on our audits. We conducted our audits in accordance with the standards of the Public Company Accounting Oversight Board (United States). Those standards require that we plan and perform the audit to obtain reasonable assurance about whether the financial statements are free of material misstatement. An audit includes examining, on a test basis, evidence supporting the amounts and disclosures in the financial statements. An audit also includes assessing the accounting principles used and significant estimates made by management, as well as evaluating the overall financial statement presentation. We believe that our audits provide a reasonable basis for our opinion. In our opinion, the financial statements referred to above present fairly, in all material respects, the consolidated financial position of Columbus McKinnon Corporation at March 31, 2010 and 2009 and the consolidated results of its operations and its cash flows for each of the three years in the period ended March 31, 2010, in conformity with U.S. generally accepted accounting principles. Also, in our opinion, the related financial statement schedule, when considered in relation to the basic financial statements taken as a whole, presents fairly in all material respects the information set forth therein. As discussed in Note 12 to consolidated financial statements, on March 31, 2007 the Company changed its method of accounting for employee retirement plans and other postretirement benefits in accordance with guidance originally issued in FASB Statement No. 158, Employers’ Accounting for Defined Benefit Pension and Other Postretirement Plans, an amendment of FASB Statements No. 87, 88, 106, and 132(R) (codified in FASB ASC Topic 715, Compensation – Retirement Plans ), and on March 31, 2009 the Company adopted the measurement date provisions of FASB ASC Topic 715. As discussed in Note 17 to consolidated financial statements, on April 1, 2007 the Company changed its method of accounting for uncertainty in income taxes. We also have audited, in accordance with the standards of the Public Company Accounting Oversight Board (United States), Columbus McKinnon Corporation’s internal control over financial reporting as of March 31, 2010, based on criteria established in Internal Control-Integrated Framework issued by the Committee of Sponsoring Organizations of the Treadway Commission and our report dated May 28, 2010 expressed an unqualified opinion thereon. /s/ Ernst & Young LLP Buffalo, New York May 28, 2010
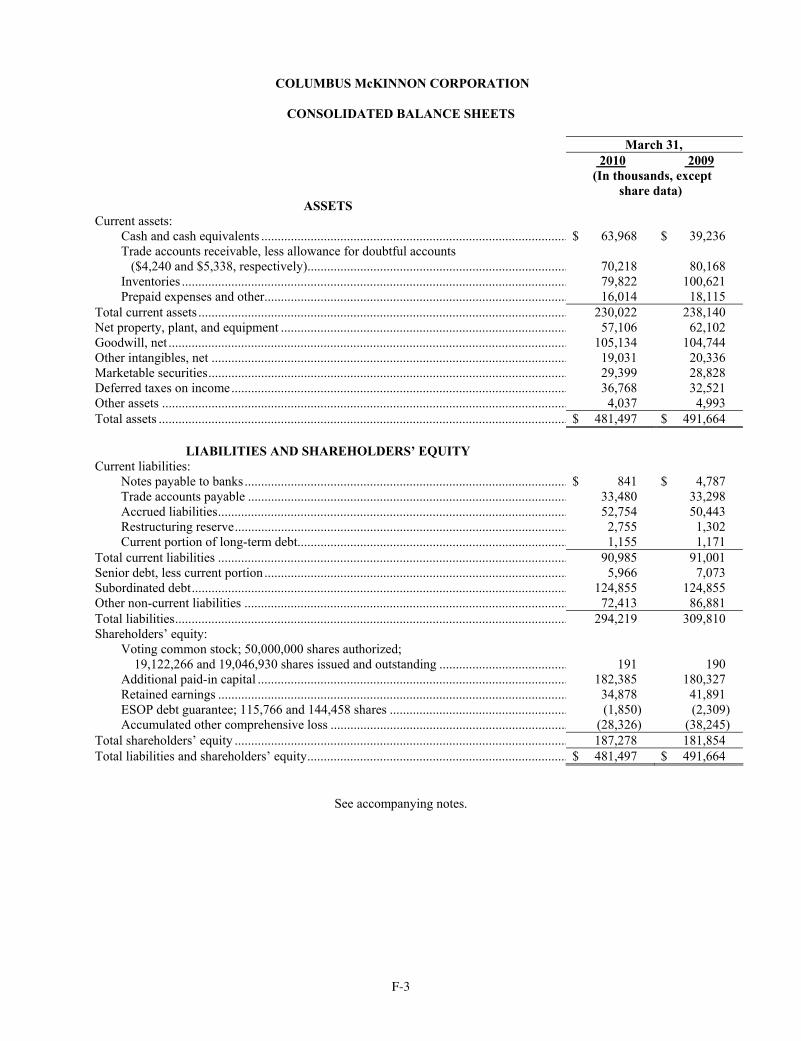
F-3
COLUMBUS McKINNON CORPORATION
CONSOLIDATED BALANCE SHEETS
March 31, 2010 2009 (In thousands, except
share data) ASSETS
Current assets: Cash and cash equivalents ............................................................................................. $ 63,968 $ 39,236 Trade accounts receivable, less allowance for doubtful accounts ($4,240 and $5,338, respectively)...............................................................................
70,218
80,168
Inventories ..................................................................................................................... 79,822 100,621 Prepaid expenses and other............................................................................................ 16,014 18,115 Total current assets ................................................................................................................ 230,022 238,140 Net property, plant, and equipment ....................................................................................... 57,106 62,102 Goodwill, net ......................................................................................................................... 105,134 104,744 Other intangibles, net ............................................................................................................ 19,031 20,336 Marketable securities............................................................................................................. 29,399 28,828 Deferred taxes on income...................................................................................................... 36,768 32,521 Other assets ........................................................................................................................... 4,037 4,993 Total assets ............................................................................................................................ $ 481,497 $ 491,664
LIABILITIES AND SHAREHOLDERS’ EQUITY
Current liabilities: Notes payable to banks.................................................................................................. $ 841 $ 4,787 Trade accounts payable ................................................................................................. 33,480 33,298 Accrued liabilities.......................................................................................................... 52,754 50,443 Restructuring reserve..................................................................................................... 2,755 1,302 Current portion of long-term debt.................................................................................. 1,155 1,171 Total current liabilities .......................................................................................................... 90,985 91,001 Senior debt, less current portion ............................................................................................ 5,966 7,073 Subordinated debt.................................................................................................................. 124,855 124,855 Other non-current liabilities .................................................................................................. 72,413 86,881 Total liabilities....................................................................................................................... 294,219 309,810 Shareholders’ equity: Voting common stock; 50,000,000 shares authorized; 19,122,266 and 19,046,930 shares issued and outstanding ....................................... 191 190 Additional paid-in capital .............................................................................................. 182,385 180,327 Retained earnings .......................................................................................................... 34,878 41,891 ESOP debt guarantee; 115,766 and 144,458 shares ...................................................... (1,850) (2,309) Accumulated other comprehensive loss ........................................................................ (28,326) (38,245) Total shareholders’ equity ..................................................................................................... 187,278 181,854 Total liabilities and shareholders’ equity............................................................................... $ 481,497 $ 491,664
See accompanying notes.

F-4
COLUMBUS McKINNON CORPORATION
CONSOLIDATED STATEMENTS OF OPERATIONS
Year Ended March 31, 2010 2009 2008 (In thousands, except per share data)
Net sales ............................................................................................... $ 476,183 $ 606,708 $ 593,786 Cost of products sold............................................................................ 360,244 433,007 408,211 Gross profit........................................................................................... 115,939 173,701 185,575 Selling expenses ................................................................................... 64,464 72,620 69,836 General and administrative expenses ................................................... 36,892 37,721 34,048 Restructuring charges ........................................................................... 16,519 1,921 836 Impairment loss .................................................................................... - 107,000 - Amortization of intangibles.................................................................. 1,876 998 115 (Loss) income from operations............................................................. (3,812) (46,559) 80,740 Interest and debt expense...................................................................... 13,225 13,148 13,562 (Gain) loss on bond redemptions.......................................................... - (244) 1,794 Investment (income) loss...................................................................... (1,544) 2,889 (1,165) Foreign currency exchange (gain) loss ................................................. (344) 3,018 403 Gain from litigation settlement............................................................. - (3,330) - Other income, net ................................................................................. (2,260) (3,939) (3,588) (Loss) income from continuing operations before income tax (benefit) expense ..........................................................................
(12,889)
(58,101)
69,734
Income tax (benefit) expense................................................................ (5,345) 18,001 22,819 (Loss) income from continuing operations........................................... (7,544) (76,102) 46,915 Income (loss) from discontinued operations (net of tax) ...................... 531 (2,282) (9,566) Net (loss) income.................................................................................. $ (7,013) $ (78,384) $ 37,349 Average basic shares outstanding......................................................... 18,963 18,861 18,723 Average diluted shares outstanding...................................................... 18,963 18,861 19,158 Basic (loss) income per share: (Loss) income from continuing operations................................... $ (0.40) $ (4.04) $ 2.50 Income (loss) from discontinued operations................................. 0.03 (0.12) (0.51) Basic (loss) income per share ....................................................... $ (0.37) $ (4.16) $ 1.99 Diluted (loss) income per share: (Loss) income from continuing operations................................... $ (0.40) $ (4.04) $ 2.45 Income (loss) from discontinued operations................................. 0.03 (0.12) (0.50) Diluted (loss) income per share .................................................... $ (0.37) $ (4.16) $ 1.95
See accompanying notes.
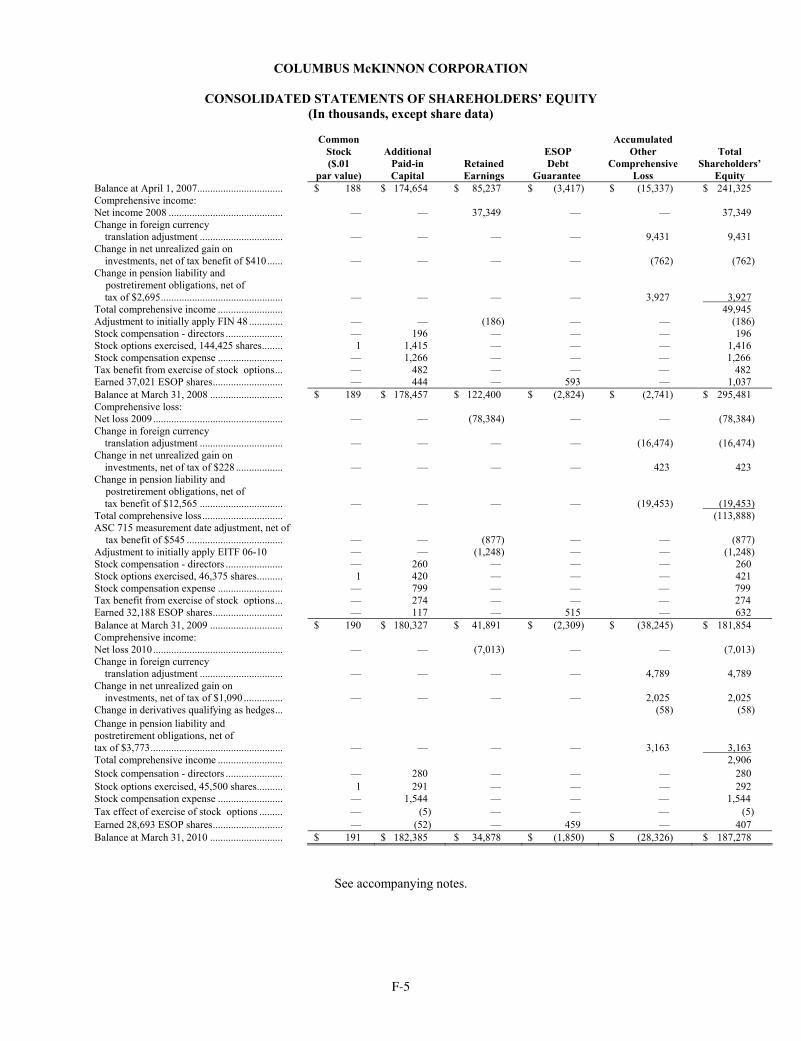
F-5
COLUMBUS McKINNON CORPORATION
CONSOLIDATED STATEMENTS OF SHAREHOLDERS’ EQUITY (In thousands, except share data)
Common
Stock ($.01
par value)
Additional
Paid-in Capital
Retained Earnings
ESOP Debt
Guarantee
Accumulated Other
Comprehensive Loss
Total
Shareholders’ Equity
Balance at April 1, 2007................................. $ 188 $ 174,654 $ 85,237 $ (3,417) $ (15,337) $ 241,325 Comprehensive income: Net income 2008 ............................................ — — 37,349 — — 37,349 Change in foreign currency translation adjustment ................................ — — —
—
9,431 9,431
Change in net unrealized gain on investments, net of tax benefit of $410...... — — — —
(762) (762)
Change in pension liability and postretirement obligations, net of
tax of $2,695............................................... — — — — 3,927 3,927
Total comprehensive income ......................... 49,945 Adjustment to initially apply FIN 48 ............. — — (186) — — (186) Stock compensation - directors ...................... — 196 — — — 196 Stock options exercised, 144,425 shares........ 1 1,415 — — — 1,416 Stock compensation expense ......................... — 1,266 — — — 1,266 Tax benefit from exercise of stock options... — 482 — — — 482 Earned 37,021 ESOP shares........................... — 444 — 593 — 1,037 Balance at March 31, 2008 ............................ $ 189 $ 178,457 $ 122,400 $ (2,824) $ (2,741) $ 295,481 Comprehensive loss: Net loss 2009.................................................. — — (78,384) — — (78,384) Change in foreign currency translation adjustment ................................ — — —
—
(16,474) (16,474)
Change in net unrealized gain on investments, net of tax of $228 .................. — — — —
423 423
Change in pension liability and postretirement obligations, net of
tax benefit of $12,565 ................................ — — — — (19,453) (19,453)
Total comprehensive loss............................... (113,888) ASC 715 measurement date adjustment, net of
tax benefit of $545 ..................................... — — (877) — — (877) Adjustment to initially apply EITF 06-10 — — (1,248) — — (1,248) Stock compensation - directors ...................... — 260 — — — 260 Stock options exercised, 46,375 shares.......... 1 420 — — — 421 Stock compensation expense ......................... — 799 — — — 799 Tax benefit from exercise of stock options... — 274 — — — 274 Earned 32,188 ESOP shares........................... — 117 — 515 — 632 Balance at March 31, 2009 ............................ $ 190 $ 180,327 $ 41,891 $ (2,309) $ (38,245) $ 181,854 Comprehensive income: Net loss 2010.................................................. — — (7,013) — — (7,013) Change in foreign currency translation adjustment ................................ — — —
—
4,789 4,789
Change in net unrealized gain on investments, net of tax of $1,090 ............... — — — —
2,025 2,025
Change in derivatives qualifying as hedges... (58) (58) Change in pension liability and postretirement obligations, net of tax of $3,773................................................... — — —
— 3,163 3,163
Total comprehensive income ......................... 2,906 Stock compensation - directors ...................... — 280 — — — 280 Stock options exercised, 45,500 shares.......... 1 291 — — — 292 Stock compensation expense ......................... — 1,544 — — — 1,544 Tax effect of exercise of stock options ......... — (5) — — — (5) Earned 28,693 ESOP shares........................... — (52) — 459 — 407 Balance at March 31, 2010 ............................ $ 191 $ 182,385 $ 34,878 $ (1,850) $ (28,326) $ 187,278
See accompanying notes.

F-6
COLUMBUS McKINNON CORPORATION
CONSOLIDATED STATEMENTS OF CASH FLOWS Year ended March 31, 2010 2009 2008
Operating activities: (In thousands) Net (loss) income................................................................................................. $ (7,013) $ (78,384) $ 37,349Adjustments to reconcile net (loss) income to net cash provided by operating
activities:
(Income) loss from discontinued operations................................................ (531) 2,282 9,566 Depreciation and amortization..................................................................... 12,490 10,590 8,325 Deferred income taxes ................................................................................. (8,675) (1,700) 14,737 (Gain) loss on sale of real estate/investments and other .............................. (2,515) 2,594 (596) (Gain) loss on early retirement of bonds ..................................................... — (300) 1,378 Amortization/write-off of deferred financing costs ..................................... 640 575 982 Stock-based compensation .......................................................................... 1,824 1,059 1,462 Impairment loss ........................................................................................... — 107,000 — Non-cash restructuring charges ................................................................... 1,835 — — Changes in operating assets and liabilities net of effects of business divestitures:
Trade accounts receivable ................................................................... 10,508 24,396 (3,292) Inventories ........................................................................................... 21,477 1,658 (9,144) Prepaid expenses and other.................................................................. 941 2,955 612 Other assets.......................................................................................... 1,228 1,960 (1,176) Trade accounts payable ....................................................................... 288 (7,207) 7,801 Accrued and non-current liabilities ..................................................... (2,630) (4,451) (7,231)Net cash provided by operating activities from continuing operations ............... 29,867 63,027 60,773Net cash used by operating activities from discontinued operations ................... — (2,796) (1,183)Net cash provided by operating activities............................................................ 29,867 60,231 59,590Investing activities: Proceeds from sale of marketable securities........................................................ 6,340 363 13,076Purchases of marketable securities ...................................................................... (4,518) (2,968) (14,638)Capital expenditures ............................................................................................ (7,245) (12,245) (12,479)Proceeds from sale of assets ................................................................................ 3,542 1,593 5,504Purchases of businesses....................................................................................... — (52,779) —Net cash used by investing activities from continuing operations....................... (1,881) (66,036) (8,537)Net cash provided (used) by investing activities from discontinued operations.. 531 531 (30)Net cash used by investing activities ................................................................... (1,350) (65,505) (8,567)Financing activities: Proceeds from exercise of stock options ............................................................. 291 421 1,416Payments under revolving line-of-credit agreements .......................................... (8,502) (10,623) (831)Borrowings under revolving line-of-credit agreements....................................... 4,556 8,485 18Repayment of debt............................................................................................... (964) (6,987) (29,855)Payment of deferred financing costs ................................................................... (1,258) — (2)Tax benefit from exercise of stock options.......................................................... — 274 482Change in ESOP debt guarantee.......................................................................... 459 515 593Net cash used by financing activities from continuing operations ...................... (5,418) (7,915) (28,179)Net cash used by financing activities from discontinued operations ................... — (14,612) (383)Net cash used by financing activities .................................................................. (5,418) (22,527) (28,562)Effect of exchange rate changes on cash.......................................................... 1,633 (8,957) 4,878Net change in cash and cash equivalents............................................................. 24,732 (36,758) 27,339Cash and cash equivalents at beginning of year .................................................. 39,236 75,994 48,655Cash and cash equivalents at end of year ............................................................ $ 63,968 $ 39,236 $ 75,994Supplementary cash flows data: Interest paid ................................................................................................. $ 12,451 $ 12,815 $ 14,079 Income taxes paid, net of refunds................................................................ $ 3,954 $ 9,673 $ 9,568
See accompanying notes.

F-7
COLUMBUS McKINNON CORPORATION
NOTES TO CONSOLIDATED FINANCIAL STATEMENTS
(tabular amounts in thousands, except share data) 1. Description of Business Columbus McKinnon Corporation (the Company) is a leading designer, marketer and manufacturer of material handling products and services which efficiently and safely moves, lift position and secure material. Key products include hoists, cranes, rigging tools including chain and forged attachments and actuators. The Company’s material handling products are sold, domestically and internationally, principally to third party distributors through diverse distribution channels, and to a lesser extent directly to end-users. During fiscal 2010, approximately 56% of sales were to customers in the United States. 2. Accounting Principles and Practices
Advertising
Costs associated with advertising are expensed in the year incurred and are included in selling expense in the consolidated statements of operations. Advertising expenses were $3,020,000, $4,883,000, and $5,406,000 in fiscal 2010, 2009, and 2008, respectively.
Cash and Cash Equivalents
The Company considers as cash equivalents all highly liquid investments with an original maturity of three
months or less.
Concentrations of Labor
Approximately 13% of the Company’s employees are represented by five separate domestic and Canadian collective bargaining agreements which terminate at various times between July 2010 and March 2012. Approximately 5% of the labor force is covered by collective bargaining agreements that will expire within one year.
Consolidation
These consolidated financial statements include the accounts of the Company and its domestic and foreign subsidiaries; all significant intercompany accounts and transactions have been eliminated. Our international subsidiaries in Asia and Spain close one month and our Mexican subsidiary closes three months earlier to facilitate consolidated reporting.
Derivative Instruments
The Company uses derivative instruments to manage selected foreign currency exposures. The Company does
not use derivative instruments for speculative trading purposes. All derivative instruments must be recorded on the balance sheet at fair value. For derivatives designated as cash flow hedges, the effective portion of changes in the fair value of the derivative is recorded as accumulated other comprehensive loss, or AOCL, and is reclassified to earnings when the underlying transaction has an impact on earnings. The ineffective portion of changes in the fair value of the derivative is reported in foreign currency exchange (gain) loss in the Company’s consolidated statement of operations. For derivatives not classified as cash flow hedges, all changes in market value are recorded as a foreign currency exchange (gain) loss in the Company’s consolidated statements of operations.
The Company has foreign currency forward agreements and a cross-currency swap in place to offset changes in the value of intercompany loans to certain foreign subsidiaries due to changes in foreign exchange rates. The notional amount of these derivatives is $18,289,000, and all contracts mature by September 30, 2013. These contracts are not designated as hedges.

F-8
COLUMBUS McKINNON CORPORATION
NOTES TO CONSOLIDATED FINANCIAL STATEMENTS—(Continued)
(tabular amounts in thousands, except share data) In relation to certain of the derivative transactions discussed above, the Company issued a guarantee to a third
party lender which secures any obligations of one of the Company’s wholly-owned foreign subsidiaries under the subsidiary’s agreement with the third party lender, regarding those derivative transactions. The fair value of the derivative liabilities of the foreign subsidiary at March 31, 2010 relating to this guarantee was $717,000.
The Company has foreign currency forward agreements in place to hedge changes in the value of booked foreign
currency liabilities due to changes in foreign exchange rates at the settlement date. The notional amount of those derivatives is $1,817,000 and all contracts mature within twelve months. These contracts are not designated as hedges.
The Company has foreign currency forward agreements that are designated as cash flow hedges to hedge a portion of forecasted inventory purchases denominated in a foreign currency. The notional amount of those derivates is $2,872,000 and all contracts mature within thirteen months of March 31, 2010.
The Company is exposed to credit losses in the event of nonperformance by the counterparties on its financial instruments. All counterparties have investment grade credit ratings. The Company anticipates that these counterparties will be able to fully satisfy their obligations under the contracts.
The following is the pretax effect of derivative instruments on the condensed consolidated statement of operations for the year ended March 31, 2010:
Derivatives Designated as Cash
Flow Hedges
Amount of Loss Recognized in Other
Comprehensive Income on Derivatives
(Effective Portion)
Location of Loss Recognized in Income on
Derivatives
Amount of Loss
Reclassified from AOCL into Income (Effective Portion)
Foreign exchange contracts
$ 94
Cost of products sold
-
Derivatives Not Designated as Hedging Instruments
Location of (Gain) or Loss Recognized
in Income on Derivatives
Amount of (Gain) or Loss Recognized in
Income on Derivatives Foreign exchange contracts Foreign currency exchange (gain) loss $ (174)
The following is information relative to the Company’s derivative instruments in the condensed consolidated
balance sheet as of March 31, 2010:
Derivatives Designated as Hedging Instruments Balance Sheet
Location Fair Value of
Liability Foreign exchange contracts Accrued Liabilities $ 114
Derivatives Not Designated as Hedging Instruments Balance Sheet
Location Fair Value of
Liability Foreign exchange contracts Accrued Liabilities $ 834
Financial Instruments
The carrying value of the Company’s current assets and current liabilities approximate their fair values based
upon the relatively short maturity of those instruments. For the fair value of the Company’s marketable securities and debt instruments, see Notes 7 and 11, respectively.

F-9
COLUMBUS McKINNON CORPORATION
NOTES TO CONSOLIDATED FINANCIAL STATEMENTS—(Continued)
(tabular amounts in thousands, except share data) Foreign Currency Translations
The Company translates foreign currency financial statements as described in Financial Accounting Standards
Board (FASB) Accounting Standards Codification (ASC) Topic 830, “Foreign Currency Matters.” Under this method, all items of income and expense are translated to U.S. dollars at average exchange rates for the year. All assets and liabilities are translated to U.S. dollars at the year-end exchange rate. Gains or losses on translations are recorded in accumulated other comprehensive loss in the shareholders’ equity section of the balance sheet. The functional currency is the foreign currency in which the foreign subsidiaries conduct their business. Gains and losses from foreign currency transactions are reported in foreign currency exchange (gain) loss. There were gains, including changes in the fair value of derivatives, of approximately $344,000 on foreign currency transactions in fiscal 2010. There were losses, including changes in the fair value of derivatives, of approximately $3,018,000 and $403,000 on foreign currency transactions in fiscal 2009 and 2008, respectively.
Gain from Litigation
During the fourth quarter of fiscal 2009, the Company settled a dispute with a previous service provider. The
Company recorded a gain of $3,330,000 related to the settlement in the form of cash proceeds and a note receivable which was collected in fiscal 2010.
Goodwill
Goodwill is not amortized but is tested for impairment at least annually, in accordance with the provisions of
ASC Topic 350-20-35-1. Goodwill impairment is deemed to exist if the net book value of a reporting unit exceeds its estimated fair value. The fair value of a reporting unit is determined using a discounted cash flow methodology. The Company’s reporting units are determined based upon whether discrete financial information is available and reviewed regularly, whether those units constitute a business, and the extent of economic similarities between those reporting units for purposes of aggregation. The Company’s reporting units identified under ASC Topic 350-20-35-33 are at the component level, or one level below the reporting segment level as defined under ASC Topic 280-10-50-10 “Segment Reporting – Disclosure.” The Company’s one segment is subdivided into four reporting units. See Note 9 for further discussion of goodwill and intangible assets.
Impairment of Long-Lived Assets
The Company assesses impairment of its long-lived assets in accordance with the provisions of ASC Topic 360 “Property, Plant, and Equipment.” This statement requires long-lived assets, such as property and equipment and purchased intangibles subject to amortization to be reviewed for impairment whenever events or changes in circumstances indicate that the carrying amount of an asset group may not be recoverable. Recoverability of assets to be held and used is measured by a comparison of the carrying amount of an asset group to estimated undiscounted future cash flows expected to be generated by the asset group. If the carrying amount of an asset group exceeds its estimated future cash flows, an impairment charge is recognized equal to the amount by which the carrying amount of the asset group exceeds the fair value of the asset group.
In assessing long-lived assets for an impairment loss, assets are grouped with other assets and liabilities at the lowest level for which identifiable cash flows are largely independent of the cash flows of other assets and liabilities. Asset grouping requires a significant amount of judgment. Accordingly, facts and circumstances will influence how asset groups are determined for impairment testing. In assessing long-lived assets for impairment, management considered the Company’s product line portfolio, customers and related commercial agreements, labor agreements and other factors in grouping assets and liabilities at the lowest level for which identifiable cash flows are independent. The Company considers projected future undiscounted cash flows, trends and other factors in its assessment of whether impairment conditions exist. While the Company believes that its estimates of future cash flows are reasonable, different assumptions regarding such factors as future production volumes, customer pricing, economics and productivity and cost initiatives, could significantly affect its estimates. In determining fair value of long-lived assets, management uses management estimates, discounted cash flow calculations, and appraisals where necessary.
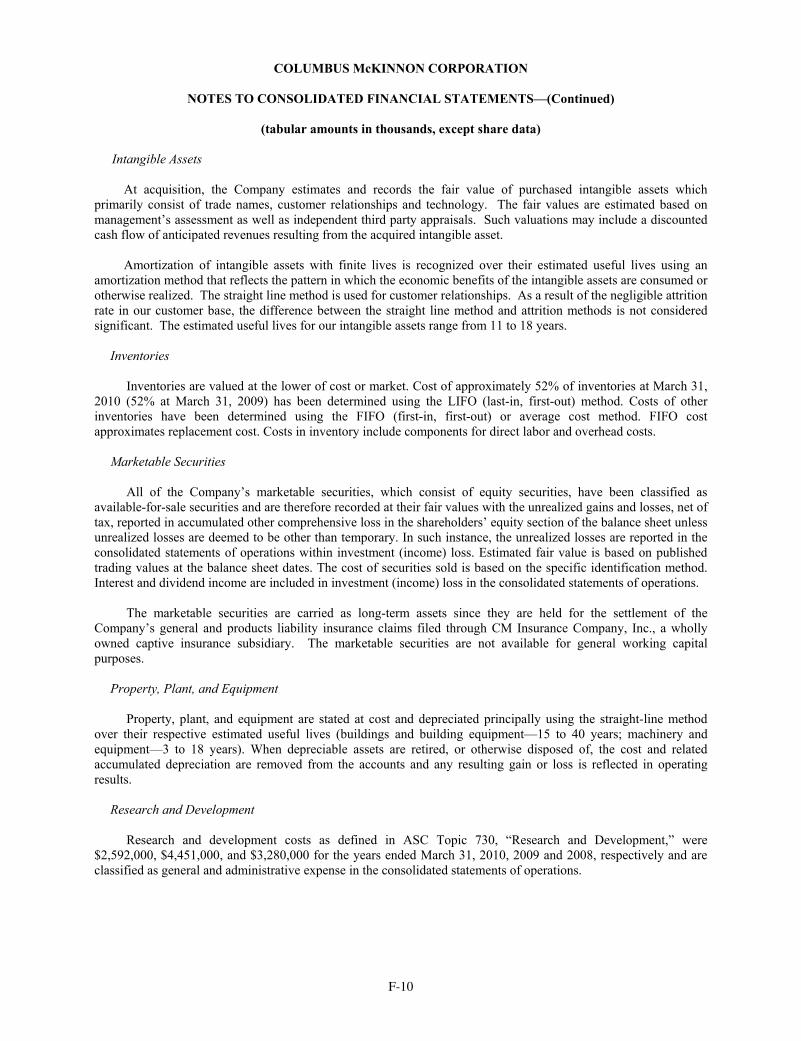
F-10
COLUMBUS McKINNON CORPORATION
NOTES TO CONSOLIDATED FINANCIAL STATEMENTS—(Continued)
(tabular amounts in thousands, except share data) Intangible Assets
At acquisition, the Company estimates and records the fair value of purchased intangible assets which
primarily consist of trade names, customer relationships and technology. The fair values are estimated based on management’s assessment as well as independent third party appraisals. Such valuations may include a discounted cash flow of anticipated revenues resulting from the acquired intangible asset.
Amortization of intangible assets with finite lives is recognized over their estimated useful lives using an
amortization method that reflects the pattern in which the economic benefits of the intangible assets are consumed or otherwise realized. The straight line method is used for customer relationships. As a result of the negligible attrition rate in our customer base, the difference between the straight line method and attrition methods is not considered significant. The estimated useful lives for our intangible assets range from 11 to 18 years.
Inventories
Inventories are valued at the lower of cost or market. Cost of approximately 52% of inventories at March 31, 2010 (52% at March 31, 2009) has been determined using the LIFO (last-in, first-out) method. Costs of other inventories have been determined using the FIFO (first-in, first-out) or average cost method. FIFO cost approximates replacement cost. Costs in inventory include components for direct labor and overhead costs.
Marketable Securities
All of the Company’s marketable securities, which consist of equity securities, have been classified as
available-for-sale securities and are therefore recorded at their fair values with the unrealized gains and losses, net of tax, reported in accumulated other comprehensive loss in the shareholders’ equity section of the balance sheet unless unrealized losses are deemed to be other than temporary. In such instance, the unrealized losses are reported in the consolidated statements of operations within investment (income) loss. Estimated fair value is based on published trading values at the balance sheet dates. The cost of securities sold is based on the specific identification method. Interest and dividend income are included in investment (income) loss in the consolidated statements of operations.
The marketable securities are carried as long-term assets since they are held for the settlement of the Company’s general and products liability insurance claims filed through CM Insurance Company, Inc., a wholly owned captive insurance subsidiary. The marketable securities are not available for general working capital purposes.
Property, Plant, and Equipment
Property, plant, and equipment are stated at cost and depreciated principally using the straight-line method over their respective estimated useful lives (buildings and building equipment—15 to 40 years; machinery and equipment—3 to 18 years). When depreciable assets are retired, or otherwise disposed of, the cost and related accumulated depreciation are removed from the accounts and any resulting gain or loss is reflected in operating results.
Research and Development
Research and development costs as defined in ASC Topic 730, “Research and Development,” were
$2,592,000, $4,451,000, and $3,280,000 for the years ended March 31, 2010, 2009 and 2008, respectively and are classified as general and administrative expense in the consolidated statements of operations.
F-11
COLUMBUS McKINNON CORPORATION
NOTES TO CONSOLIDATED FINANCIAL STATEMENTS—(Continued)
(tabular amounts in thousands, except share data)
Revenue Recognition, Accounts Receivable and Concentration of Credit Risk
Sales are recorded when title passes to the customer which is generally at time of shipment to the customer. The Company performs ongoing credit evaluations of its customers’ financial condition, but generally does not require collateral to support customer receivables. The credit risk is controlled through credit approvals, limits and monitoring procedures. Accounts receivable are reported at net realizable value and do not accrue interest. The Company establishes an allowance for doubtful accounts based upon factors surrounding the credit risk of specific customers, historical trends and other factors. Accounts receivable are charged against the allowance for doubtful accounts once all collection efforts have been exhausted. The Company does not routinely permit customers to return product. However, sales returns are permitted in specific situations and typically include a restocking charge or the purchase of additional product. The Company has established an allowance for returns based upon historical trend rates.
Sale-Leaseback Transactions
On June 22, 2007, the Company sold its facility in Charlotte, NC and entered into a leaseback for a portion of
the facility under a 10-year lease agreement. Net proceeds to the Company for the sale of the property were approximately $4,800,000. The $800,000 gain on the transaction was deferred and is being recognized as income over the 10-year leaseback period. The lease agreement has been recorded as a capital lease; refer to Note 8.
Shipping and Handling Costs
Shipping and handling costs are a component of cost of products sold.
Stock-Based Compensation
The Company records stock-based compensation in accordance with ASC Topic 718, “Compensation – Stock
Compensation.” This Statement requires all equity-based payments to employees, including grants of employee stock options, to be recognized in the statement of earnings based on the grant date fair value of the award. Stock compensation expense is included in cost of goods sold, selling, and general and administrative expense. The Company uses a straight-line method of attributing the value of stock-based compensation expense, subject to minimum levels of expense, based on vesting. See Note 14 for further discussion of stock-based compensation.
Use of Estimates
The preparation of financial statements in conformity with U.S. generally accepted accounting principles requires management to make estimates and assumptions that affect the amounts reported in the financial statements and accompanying notes. Actual results could differ from those estimates.
Reclassifications
Certain prior year numbers have been reclassified to conform to current year reporting presentations.

F-12
COLUMBUS McKINNON CORPORATION
NOTES TO CONSOLIDATED FINANCIAL STATEMENTS—(Continued)
(tabular amounts in thousands, except share data)
Warranties
The Company offers warranties for certain products it sells. The specific terms and conditions of those warranties vary depending upon the product sold and the country in which the Company sold the product. The Company generally provides a basic limited warranty, including parts and labor for any product deemed to be defective for a period of one year. The Company estimates the costs that may be incurred under its basic limited warranty, based largely upon actual warranty repair costs history, and records a liability in the amount of such costs in the month that the product revenue is recognized. The resulting accrual balance is reviewed during the year. Factors that affect the Company’s warranty liability include the number of units sold, historical and anticipated rate of warranty claims, and cost per claim. Changes in the Company’s product warranty accrual are as follows: March 31, 2010 2009 Balance at beginning of year ...................................................................... $ 1,282 $ 1,403 Accrual for warranties issued ..................................................................... 1,946 3,761 Warranties settled ....................................................................................... (2,302) (3,882) Balance at end of year ................................................................................ $ 926 $ 1,282
3. Acquisitions
On October 1, 2008, the Company acquired Pfaff Beteiligungs GmbH (“Pfaff-silberblau” or “Pfaff”), a Kissing, Germany based company with a leading European position in lifting, material handling and actuator products. Pfaff had revenue of approximately $90,000,000 in calendar 2007. This strategic acquisition continues the execution of the Company’s strategic plan to grow its revenue in complementary product lines and also broaden that revenue in international markets. Pfaff-silberblau complements the Company’s existing material handling business in Europe and the U.S. and creates a global actuator business when combined with the Company’s U.S. based Duff-Norton actuator business. The Company is creating value from this acquisition through integrating the Pfaff business with the Columbus McKinnon European and U.S. based material handling businesses and Duff-Norton. Value is being created by cross selling products among these groups as well as reducing costs through business integration and procurement activities. The results of Pfaff-silberblau are included in the Company’s consolidated financial statements from the date of acquisition. This transaction was accounted for under the purchase method of accounting. The aggregate purchase consideration for the acquisition of Pfaff-silberblau was $52,779,000 in cash and acquisition costs. The acquisition was funded with existing cash. The purchase price was allocated to the assets acquired and liabilities assumed based upon a valuation of respective fair values. The identifiable intangible assets consisted of trademarks with a value of $6,101,000 (18 year estimated useful life), customer relationships with a value of $15,092,000 (11 year estimated useful life), and technology with a value of $806,000 (14 year estimated useful life). The excess consideration over fair value was recorded as goodwill and approximated $27,769,000, none of which is deductible for tax purposes. The allocation of purchase consideration to the assets acquired and liabilities assumed is as follows:
Working capital…………………………………………………………….. $ 13,340 Property, plant and equipment ...................................................................... 8,321 Other long term liabilities, net……………………………………………… (18,650) Identifiable intangible assets ……………………………………………….. 21,999 Goodwill……………………………………………………………………. 27,769 Total .............................................................................................................. $ 52,779

F-13
COLUMBUS McKINNON CORPORATION
NOTES TO CONSOLIDATED FINANCIAL STATEMENTS—(Continued)
(tabular amounts in thousands, except share data)
4. Divestitures As part of the continuing strategic evaluation of its businesses, the Company determined that its integrated material handling conveyor systems business (Univeyor A/S) no longer provided a strategic fit with its long-term growth and operational objectives. On July 25, 2008, the Company completed the sale of Univeyor A/S, which business represented the majority of the Company’s former “Solutions” segment. In accordance with the provisions of Financial Accounting Standards Board (“FASB”) Accounting Standards Codification (“ASC”) Topic 205-20-45-1, “Presentation of Financial Statements – Discontinued Operations”, the results of operations of Univeyor A/S have been classified as discontinued operations in the condensed statements of operations and statements of cash flows presented herein. In connection with the sale of Univeyor A/S on July 25, 2008, the Company used cash on hand to repay $15,191,000 in amounts outstanding on Univeyor’s lines of credit and fixed term bank debt. Income from discontinued operations presented herein includes payments received on a note receivable related to the fiscal 2002 disposal of Automatic Systems, Inc. Due to the uncertainty surrounding the financial viability of the debtor, the note was recorded at the estimated net realizable value of $0 at the time of the divestiture.
Summarized statements of operations for discontinued operations are as follows:
Year Ended March 31, 2010 2009 2008 (In thousands)
Net revenue.................................................................................. $ - $ 8,982 $ 29,548 Gain (loss) before income taxes .................................................. 857 (798) (9,346) Income tax expense ..................................................................... 326 326 220 Gain (loss) from operations of discontinued businesses.............. 531 (1,124) (9,566) Loss on sale of discontinued operation........................................ - (15,926) - Tax benefit from sale of discontinued operation ......................... - 14,768 - Gain (loss) from discontinued operations.................................... $ 531 $ (2,282) $ (9,566)
During fiscal 2010, as part of the continuing strategic evaluation of its businesses, the Company determined that its American Lifts business no longer provided a strategic fit with its long-term growth and operational objectives. The American Lifts business manufactured powered lift tables which enhance workplace ergonomics and were sold primarily to customers in the general manufacturing, construction, and air cargo industries. On October 30, 2009, the Company sold this business to a strategic buyer for $2,400,000 in cash. A $1,055,000 pre-tax gain on the sale is included in other income, net in the Company’s consolidated statements of operations for the year ended March 31, 2010. American Lifts has not been treated as a discontinued operation as its results from operations were immaterial to the overall consolidated financial results of the Company.
5. Fair Value Measurements
ASC Topic 820 “Fair Value Measurements and Disclosures” establishes the standards for reporting financial assets and liabilities and nonfinancial assets and liabilities that are recognized or disclosed at fair value on a recurring basis (at least annually). Under these standards, fair value is defined as the price that would be received to sell an asset or paid to transfer a liability (i.e. the "exit price") in an orderly transaction between market participants at the measurement date.
The Company applied the provisions of ASC Topic 820 in determining the fair value of its financial assets and financial liabilities effective April 1, 2008. The Company applied the provisions of ASC Topic 820 in determining the fair value of its nonfinancial assets and nonfinancial liabilities on a non-recurring basis effective April 1, 2009.
F-14
COLUMBUS McKINNON CORPORATION
NOTES TO CONSOLIDATED FINANCIAL STATEMENTS—(Continued)
(tabular amounts in thousands, except share data) ASC Topic 820-10-35-37 establishes a hierarchy for inputs used in measuring fair value that maximizes the use of observable inputs and minimizes the use of unobservable inputs by requiring that the most observable inputs be used when available. Observable inputs are inputs that market participants would use in pricing the asset or liability developed based on market data obtained from sources independent of the Company. Unobservable inputs are inputs that reflect the Company's assumptions about the valuation techniques that market participants would use in pricing the asset or liability developed based on the best information available in the circumstances. The hierarchy is separated into three levels based on the reliability of inputs as follows:
Level 1 - Valuations based on quoted prices in active markets for identical assets or liabilities that the Company has the ability to access. Since valuations are based on quoted prices that are readily and regularly available in an active market, valuation of these products does not entail a significant degree of judgment. Level 2 - Valuations based on quoted prices in markets that are not active or for which all significant inputs are observable, either directly or indirectly, involving some degree of judgment. Level 3 - Valuations based on inputs that are unobservable and significant to the overall fair value measurement. The degree of judgment exercised in determining fair value is greatest for instruments categorized in Level 3.
The availability of observable inputs can vary from asset/liability to asset/liability and is affected by a wide variety of factors, including, the type of asset/liability, whether the asset/liability is established in the marketplace, and other characteristics particular to the transaction. To the extent that valuation is based on models or inputs that are less observable or unobservable in the market, the determination of fair value requires more judgment. In certain cases, the inputs used to measure fair value may fall into different levels of the fair value hierarchy. In such cases, for disclosure purposes the level in the fair value hierarchy within which the fair value measurement in its entirety falls is determined based on the lowest level input that is significant to the fair value measurement in its entirety. Fair value is a market-based measure considered from the perspective of a market participant rather than an entity-specific measure. Therefore, even when market assumptions are not readily available, assumptions are required to reflect those that market participants would use in pricing the asset or liability at the measurement date. When valuing our derivative portfolio, the Company uses readily observable market data in conjunction with commonly used valuation models. Consequently, the Company designates our derivatives as Level 2. The following table provides information regarding financial assets and liabilities measured at fair value on a recurring basis:
Fair value measurements at reporting date using
Description
At March 31, 2010
Quoted prices in active markets for
identical assets (Level 1)
Significant other observable
inputs (Level 2)
Significant unobservable
inputs (Level 3)
Assets/(Liabilities): Marketable securities $ 29,399 $ 29,399 $ - $ - Accrued severance costs
(2,755) - - (2,755)
Property, plant, and equipment
775 - - 775
Derivative liabilities (948) - (948) - As of March 31, 2010, the Company did not have any nonfinancial assets and liabilities that are recognized or disclosed at fair value on a recurring basis.

F-15
COLUMBUS McKINNON CORPORATION
NOTES TO CONSOLIDATED FINANCIAL STATEMENTS—(Continued)
(tabular amounts in thousands, except share data) Interest and dividend income on marketable securities are recorded in investment (income) loss. Changes in the fair value of derivatives are recorded in foreign currency exchange (gain) loss and other comprehensive loss. Interest and dividend income on marketable securities are measured based upon amounts earned on their respective declaration dates. During fiscal 2009, the Company reduced the cost bases of certain marketable securities since it was determined that the unrealized losses on those securities were other than temporary in nature. This determination resulted in the recognition of a pre-tax charge to earnings of $4,014,000, classified within investment (income) loss. During fiscal 2010, the Company sold a portion of these previously written down investments, which resulted in the recognition of a gain of approximately $606,000. Assets that are measured on a non-recurring basis include the Company’s reporting units that are used to test goodwill for impairment on an annual or interim basis under the provisions of ASC Topic 350-20-35-1 “Intangibles, Goodwill and Other – Goodwill Subsequent Measurement”, as well as property, plant and equipment in circumstances when the Company determines that those assets are impaired under the provisions of ASC Topic 360-10-35-17 “Property Plant and Equipment – Subsequent Measurement” and the measurement of termination benefits in connection with the Company’s restructuring plan under the provisions of ASC Topic 420 “Exit or Disposal Cost Obligations”. The Company applied the provisions of ASC Topic 350-20-35-1 during the annual goodwill impairment test performed as of February 28, 2010. Step I of the goodwill impairment test consisted of determining a fair value for each of the Company’s reporting units. The fair values for the Company’s reporting units cannot be determined using readily available quoted Level 1 inputs or Level 2 inputs that are observable in active markets. Therefore, the Company used a discounted cash flow valuation model to estimate the fair value of its reporting units, using Level 3 inputs. To estimate the fair values of reporting units, the Company uses significant estimates and judgmental factors. The key estimates and factors used in the discounted cash flow valuation model include revenue growth rates and profit margins based on internal forecasts, terminal growth rates, and the weighted-average cost of capital used to discount future cash flows. See Note 9 for the results of the Company’s February 28, 2010 annual goodwill impairment test. The write-down of fixed assets to their estimated fair market values, as discussed above, related to the closure of two manufacturing facilities and the significant downsizing of a third facility in connection with the Company’s restructuring plan. The fair value was determined based on management’s best estimate of the realizability of the assets, using Level 3 inputs given the lack of observable market data for the assets. The net book value of the assets was $2,650,000, and their estimated fair market value was $775,000. During the year ended March 31, 2010, the Company offered termination benefits to certain employees in connection with its restructuring plan and the liabilities measured and recorded during the period have been determined based upon their ultimate payment amounts, which approximate fair value as determined using Level 3 inputs.

F-16
COLUMBUS McKINNON CORPORATION
NOTES TO CONSOLIDATED FINANCIAL STATEMENTS—(Continued)
(tabular amounts in thousands, except share data) 6. Inventories
Inventories consisted of the following: March 31, 2010 2009 At cost—FIFO basis: Raw materials ............................................................................................. $ 42,340 $ 49,697 Work-in-process ......................................................................................... 10,774 12,497 Finished goods............................................................................................ 44,585 59,896 97,699 122,090 LIFO cost less than FIFO cost............................................................................ (17,877) (21,469) Net inventories ................................................................................................... $ 79,822 $ 100,621
The excess of FIFO over LIFO cost decreased primarily due to LIFO liquidation resulting in a $2,797,000 positive impact on fiscal 2010 income. 7. Marketable Securities
All of the Company’s marketable securities, which consist of equity securities, have been classified as available-for-sale securities and are therefore recorded at their fair values with the unrealized gains and losses, net of tax, reported in accumulated other comprehensive loss in the shareholders’ equity section of the balance sheet unless unrealized losses are deemed to be other-than-temporary. In such instances, the unrealized losses are reported in the consolidated statements of operations and retained earnings within investment (income) loss. Estimated fair value is based on published trading values at the balance sheet dates. The cost of securities sold is based on the specific identification method. Interest and dividend income are included in investment (income) loss in the consolidated statements of operations.
Marketable securities are carried as long-term assets since they are held for the settlement of the Company’s general and products liability insurance claims filed through CM Insurance Company, Inc., a wholly owned captive insurance subsidiary. The marketable securities are not available for general working capital purposes. In accordance with ASC Topic 320-10-35-30 “Investments – Debt & Equity Securities – Subsequent Measurement,” the Company reviews its marketable securities for declines in market value that may be considered other-than-temporary. The Company generally considers market value declines to be other-than-temporary if they are declines for a period longer than six months and in excess of 20% of original cost, or when other evidence indicates impairment. During the year ended March 31, 2009, because of uncertain market conditions and the duration at which certain securities had been trading below cost, the Company reduced the cost bases of certain equity securities since it was determined that the unrealized losses on those securities were other than temporary in nature. This determination resulted in the recognition of a pre-tax charge to earnings of $4,014,000 for the year ended March 31, 2009, classified within investment (income) loss. There were no other than temporary impairments for the years ended March 31, 2010 and 2008. During fiscal 2010, the Company sold a portion of these previously written down investments, which resulted in the recognition of a gain of approximately $606,000.
F-17
COLUMBUS McKINNON CORPORATION
NOTES TO CONSOLIDATED FINANCIAL STATEMENTS—(Continued)
(tabular amounts in thousands, except share data)
The following is a summary of available-for-sale securities at March 31, 2010:
Cost Gross Unrealized
Gains Gross Unrealized
Losses Estimated Fair
Value Equity securities ...................... $ 26,771 $ 2,667 $ 39 $ 29,399
The aggregate fair value of investments and unrealized losses on available-for-sale securities in an unrealized loss position at March 31, 2010 are as follows: Aggregate Unrealized Fair Value Losses Securities in a continuous loss position for less than 12 months $ 2,295 $ 30 Securities in a continuous loss position for more than 12 months 454 9 $ 2,749 $ 39
The Company considered the nature of the investments, causes of previous impairments, the severity and
duration of unrealized losses and other factors and determined that the unrealized losses at March 31, 2010 were temporary in nature.
Net realized (losses) gains related to sales of marketable securities (excluding other-than-temporary
impairments) were $(238,000), $7,000, and $88,000 in fiscal 2010, 2009 and 2008, respectively.
The following is a summary of available-for-sale securities at March 31, 2009:
Cost Gross Unrealized
Gains Gross Unrealized
Losses Estimated Fair
Value Equity securities ...................... $ 29,315 $ 394 $ 881 $ 28,828
The aggregate fair value of investments and unrealized losses on available-for-sale securities in an unrealized
loss position at March 31, 2009 are as follows: Aggregate Unrealized Fair Value Losses Securities in a continuous loss position for less than 12 months $ 2,318 $ 107 Securities in a continuous loss position for more than 12 months 15,982 774 $ 18,300 $ 881
Net unrealized gains (losses) included in the balance sheet amounted to $2,628,000 at March 31, 2010 and
$(487,000) at March 31, 2009. The amounts, net of related income tax expense (benefit) of $920,000 and $(170,000) at March 31, 2010 and 2009, respectively, are reflected as a component of accumulated other comprehensive loss within shareholders’ equity.

F-18
COLUMBUS McKINNON CORPORATION
NOTES TO CONSOLIDATED FINANCIAL STATEMENTS—(Continued)
(tabular amounts in thousands, except share data) 8. Property, Plant, and Equipment
Consolidated property, plant, and equipment of the Company consisted of the following:
March 31, 2010 2009 Land and land improvements ....................................................................................... $ 4,804 $ 4,172 Buildings ...................................................................................................................... 28,621 25,169 Machinery, equipment, and leasehold improvements................................................... 121,447 120,293 Construction in progress............................................................................................... 2,335 4,825 157,207 154,459 Less accumulated depreciation..................................................................................... 100,101 92,357 Net property, plant, and equipment .............................................................................. $ 57,106 $ 62,102
Buildings include assets recorded under capital leases amounting to $3,147,000 for each of the years ended
March 31, 2010 and 2009. Machinery, equipment, and leasehold improvements include assets recorded under capital leases amounting to $5,613,000 and $5,505,000 for the years ended March 31, 2010 and 2009, respectively. Accumulated depreciation includes accumulated amortization of the assets recorded under capital leases amounting to $1,910,000 and $959,000 at March 31, 2010 and 2009, respectively.
Depreciation expense, including amortization of assets recorded under capital leases, was $10,613,000,
$9,592,000, and $8,210,000 for the years ended March 31, 2010, 2009 and 2008, respectively. 9. Goodwill and Intangible Assets As discussed in Note 2, Goodwill is not amortized but is tested for impairment at least annually, in accordance with the provisions of ASC Topic 350-20-35-1. Goodwill impairment is deemed to exist if the net book value of a reporting unit exceeds its estimated fair value. The fair value of a reporting unit is determined using a discounted cash flow methodology. The Company’s reporting units are determined based upon whether discrete financial information is available and reviewed regularly, whether those units constitute a business, and the extent of economic similarities between those reporting units for purposes of aggregation. The Company’s reporting units identified under ASC Topic 350-20-35-33 are at the component level, or one level below the reporting segment level as defined under ASC Topic 280-10-50-10 “Segment Reporting – Disclosure.” The Company has four reporting units. Only two of the four reporting units carry goodwill at March 31, 2010 and March 31, 2009. The Duff-Norton reporting unit (which designs, manufactures and sources mechanical and electromechanical actuators and rotary unions) had goodwill of $9,838,000 and $9,919,000 at March 31, 2010 and 2009, respectively, and the Rest of Products reporting unit (representing the core hoist, chain, and forgings design, manufacturing, and distribution businesses) had goodwill of $95,296,000 and $96,500,000 at March 31, 2010 and 2009, respectively. In accordance with ASC Topic 350-20-35-3, the measurement of impairment of goodwill consists of two steps. In the first step, the Company compares the fair value of each reporting unit to its carrying value. As part of the impairment analysis, the Company determines the fair value of each of its reporting units with goodwill using the income approach. The income approach uses a discounted cash flow methodology to determine fair value. This methodology recognizes value based on the expected receipt of future economic benefits. Key assumptions in the income approach include a free cash flow projection, an estimated discount rate, a long-term growth rate and a terminal value. These assumptions are based upon the Company’s historical experience, current market trends and future expectations.

F-19
COLUMBUS McKINNON CORPORATION
NOTES TO CONSOLIDATED FINANCIAL STATEMENTS—(Continued)
(tabular amounts in thousands, except share data) During fiscal 2009, the generally weak economic conditions resulted in a rapid decline in business, a reduction in forecasted cash flows, and an increase in capital costs as a result of tightening credit markets. Based on this evaluation, the Company determined that the fair value of its Rest of Products reporting unit was less than its carrying value in the fourth quarter of fiscal 2009. Following this assessment, ASC Topic 350-20-35-8 required the Company to perform a second step in order to determine the implied fair value of goodwill in this reporting unit and to compare it to its carrying value. The activities in the second step included hypothetically valuing all of the tangible and intangible assets of the impaired reporting unit using market participant assumptions, as if the reporting unit had been acquired in a business combination. As a result of this assessment, the Company recorded a goodwill impairment charge of $107,000,000 in the fourth quarter of fiscal 2009. None of the charge related to goodwill was deductible for tax purposes. During fiscal 2010, the Company tested goodwill for impairment as of September 30, 2009 for the Duff-Norton reporting unit because key performance indicators for this reporting unit were below budget and prior year levels. Accordingly, the Company performed Step I impairment testing as of the end of the second quarter. Step I testing was not considered necessary for the other reporting unit because, based on testing performed for prior year end, fair value of the reporting unit sufficiently exceeded book value and no new risk of impairment existed at September 30, 2009. Based on the Company’s assessment as of September 30, 2009, fair value of the Duff-Norton reporting unit exceeded its book value by 6%; as such, no impairment charges related to goodwill or intangible assets were recorded during the six month period ended September 30, 2009. As of December 31, 2009, the Company concluded that no indicators of goodwill impairment existed, so an interim test was not performed. As a result of the assessments for the years ended March 31, 2010 and 2008, the Company concluded that the balances of goodwill and intangible assets were not impaired, and therefore did not record impairment charges during the fiscal years ended March 31, 2010 and 2008. Future impairment indicators, such as declines in forecasted cash flows, may cause additional significant impairment charges. Impairment charges could be based on such factors as the Company’s stock price, forecasted cash flows, assumptions used, control premiums or other variables.
F-20
COLUMBUS McKINNON CORPORATION
NOTES TO CONSOLIDATED FINANCIAL STATEMENTS—(Continued)
(tabular amounts in thousands, except share data) Identifiable intangible assets acquired in a business combination are amortized over their estimated useful
lives.
A summary of changes in goodwill during the years ended March 31, 2010 and 2009 is as follows:
Balance at March 31, 2008................................................................................................... $ 187,055 Acquisitions.......................................................................................................................... 27,769 Impairment ........................................................................................................................... (107,000) Currency translation ............................................................................................................. (3,080) Balance at March 31, 2009................................................................................................... $ 104,744 Currency translation ............................................................................................................. 390 Balance at March 31, 2010................................................................................................... $ 105,134
Intangible assets at March 31, 2010 are as follows:
Gross Carrying Amount
Accumulated Amortization Net
Trademark .................................................................. $ 5,856 $ 481 $ 5,375 Customer relationships ............................................... 14,487 1,996 12,491 Other........................................................................... 1,358 193 1,165 Balance at March 31, 2010......................................... $ 21,701 $ 2,670 $ 19,031 Intangible assets at March 31, 2009 were as follows:
Gross Carrying Amount
Accumulated Amortization Net
Trademark .................................................................. $ 5,743 $ 157 $ 5,586 Customer relationships ............................................... 14,208 652 13,556 Other........................................................................... 1,342 148 1,194 Balance at March 31, 2009......................................... $ 21,293 $ 957 $ 20,336
All of the Company’s intangibles assets are considered to have definite lives and are amortized. The weighted-
average amortization periods are 18 years for trademarks, 11 years for customer relationships and 14 years for other. Total amortization expense was $1,876,000, $998,000, and $115,000 for fiscal 2010, 2009, and 2008, respectively. Based on the current amount of intangible assets, the estimated amortization expense for each of the succeeding five years is expected to be $1,890,000, $1,860,000, $1,830,000, $1,810,000, and $1,780,000, respectively.

F-21
COLUMBUS McKINNON CORPORATION
NOTES TO CONSOLIDATED FINANCIAL STATEMENTS—(Continued)
(tabular amounts in thousands, except share data)
10. Accrued Liabilities and Other Non-current Liabilities
Consolidated accrued liabilities of the Company consisted of the following:
March 31, 2010 2009 Accrued payroll ................................................................................................ $ 17,534 $ 14,568 Interest payable................................................................................................. 4,902 4,790 Accrued workers compensation........................................................................ 2,301 2,525 Accrued income taxes payable ......................................................................... 2,401 4,048 Accrued postretirement benefit obligation ....................................................... 1,169 1,159 Accrued health insurance.................................................................................. 3,665 3,177 Accrued general and product liability costs...................................................... 4,081 4,010 Other accrued liabilities.................................................................................... 16,701 16,166 $ 52,754 $ 50,443
Consolidated other non-current liabilities of the Company consisted of the following:
March 31, 2010 2009 Accumulated postretirement benefit obligation................................................ $ 7,909 $ 7,360 Accrued general and product liability costs...................................................... 18,973 19,232 Accrued pension cost........................................................................................ 36,179 49,052 Accrued workers compensation........................................................................ 1,764 2,272 Deferred income tax ......................................................................................... 5,644 6,504 Other non-current liabilities.............................................................................. 1,944 2,461 $ 72,413 $ 86,881 11. Debt
Consolidated long-term debt of the Company consisted of the following:
March 31, 2010 2009 Revolving Credit Facility due May 1, 2013 ..................................................... $ - $ - Capital lease obligations................................................................................... 6,974 8,020 Other senior debt .............................................................................................. 147 224 Total senior debt ............................................................................................... 7,121 8,244 8 7/8% Senior Subordinated Notes due November 1, 2013 with interest payable in semi-annual installments .............................................................
124,855
124,855
Total ................................................................................................................. 131,976 133,099 Less current portion.......................................................................................... 1,155 1,171 $ 130,821 $ 131,928
The Company entered into an amended, restated and expanded revolving credit facility dated December 31, 2009. The new Revolving Credit Facility provides availability up to a maximum of $85,000,000 and has an initial term ending May 1, 2013, which can be extended to December 31, 2013 as long as the Company’s existing Senior Subordinated Notes are paid in full on or prior to May 1, 2013 from proceeds of permitted indebtedness with a maturity of no earlier than January 5, 2014.
F-22
COLUMBUS McKINNON CORPORATION
NOTES TO CONSOLIDATED FINANCIAL STATEMENTS—(Continued)
(tabular amounts in thousands, except share data)
Provided there is no default, the Company may, on a one-time basis, request an increase in the availability of the Revolving Credit Facility by an amount not exceeding $65,000,000, subject to lender approval. The unused portion of the Revolving Credit Facility totaled $77,097,000, net of outstanding borrowings of $0 and outstanding letters of credit of $7,903,000, as of March 31, 2010. Interest on the revolver is payable at varying Eurodollar rates based on LIBOR or prime plus a spread determined by the Company’s total leverage ratio amounting to 300 or 200 basis points, respectively, based on the Company’s leverage ratio at March 31, 2010. The Revolving Credit Facility is secured by all domestic inventory, receivables, equipment, real property, subsidiary stock (limited to 65% of foreign subsidiaries) and intellectual property. The corresponding credit agreement associated with the Revolving Credit Facility places certain debt covenant restrictions on the Company, including certain financial requirements and restrictions on dividend payments, with which the Company was in compliance as of March 31, 2010. Key financial covenants include a minimum fixed charge coverage ratio of 1.25x, a maximum total leverage ratio, net of cash, of 3.75x through June 30, 2010 and 3.5x thereafter, and maximum annual capital expenditures of $15,000,000 in fiscal 2010 and $18,000,000 thereafter, excluding capital expenditures for a global ERP system.
The Senior Subordinated 8 7/8% Notes (8 7/8% Notes) issued on September 2, 2005 amounted to $124,855,000 at March 31, 2010 and are due November 1, 2013. Provisions of the 8 7/8% Notes include, without limitation, restrictions on indebtedness, asset sales, and dividends and other restricted payments. The 8 7/8% Notes are redeemable at the option of the Company, in whole or in part, at a price of 104.44% through October 31, 2010, 102.22% from November 1, 2010 through October 31, 2011, and 100.00% from November 1, 2011 and thereafter. In the event of a Change of Control (as defined in the indenture for such notes), each holder of the 8 7/8% Notes may require us to repurchase all or a portion of such holder’s 8 7/8% Notes at a purchase price equal to 101% of the principal amount thereof. The 8 7/8% Notes are guaranteed by certain existing and future U.S. subsidiaries and are not subject to any sinking fund requirements. The Company used cash on hand to repurchase $5,000,000 and $6,145,000 of the outstanding 8 7/8% Notes in fiscal 2009 and 2008, respectively.
The carrying amount of the Company’s revolving credit facility, notes payable to banks and other senior debt approximate their fair values based on current market rates. The Company’s Senior Subordinated Notes, which have a carrying value of $124,855,000 at March 31, 2010, have an approximate fair value of $126,104,000, based on market data. The Company recorded approximately $1,069,000 of deferred financing charges related to the December 31, 2009 amendment and restatement of its credit agreement, which are being amortized over the life of the agreement.
(Gain) loss on bond redemptions, including discounts, premiums and the write-off of deferred financing fees,
was $0, $(244,000), and $1,794,000 in fiscal 2010, 2009 and 2008, respectively. On June 22, 2007, the Company recorded a capital lease resulting from the sale and partial leaseback of its
facility in Charlotte, NC under a 10 year lease agreement. The Company also has capital leases on certain production machinery and equipment. The outstanding balance on the capital leases of $6,974,000 and $8,020,000 as of March 31, 2010 and 2009, respectively, is included in senior debt in the consolidated balance sheets.
The principal payments scheduled to be made as of March 31, 2010 on the above debt are as follows (in $
thousands):
2011 1,155 2012 1,176 2013 1,088 2014 125,868 2015 1,333 Thereafter 1,356

F-23
COLUMBUS McKINNON CORPORATION
NOTES TO CONSOLIDATED FINANCIAL STATEMENTS—(Continued)
(tabular amounts in thousands, except share data)
International Lines of Credit and Loans
Unsecured and uncommitted lines of credit are available to meet short-term working capital needs for certain of our subsidiaries operating outside of the U.S. The lines of credit are available on an offering basis, meaning that transactions under the line of credit will be on such terms and conditions, including interest rate, maturity, representations, covenants and events of default, as mutually agreed between our subsidiaries and the local bank at the time of each specific transaction. As of March 31, 2010, significant unsecured credit lines totaled approximately $7,100,000, of which $800,000 was drawn.
In addition to the above facilities, our foreign subsidiaries have certain secured credit lines. As of March 31, 2010, significant secured credit lines totaled $2,000,000, of which none was drawn.
12. Pensions and Other Benefit Plans
The Company provides retirement plans, including defined benefit and defined contribution plans, and postretirement benefit plans to certain employees. Effective March 31, 2007, the Company adopted ASC Topic 715 “Compensation – Retirement Benefits,” which required the recognition in pension and other postretirement benefits obligations and accumulated other comprehensive income of actuarial gains or losses, prior service costs or credits and transition assets or obligations that had previously been deferred. This statement also requires an entity to measure a defined benefit postretirement plan’s assets and obligations that determine its funded status as of the end of the fiscal year. The measurement date requirement was adopted in fiscal 2009 and was applied as a change in accounting principle, resulting in an $877,000, net of tax, cumulative-effect reduction to the opening balance of retained earnings.

F-24
COLUMBUS McKINNON CORPORATION
NOTES TO CONSOLIDATED FINANCIAL STATEMENTS—(Continued)
(tabular amounts in thousands, except share data) Pension Plans
The Company provides defined benefit pension plans to certain employees. The Company uses March 31 as the measurement date. The following provides a reconciliation of benefit obligation, plan assets, and funded status of the plans: March 31, 2010 2009 Change in benefit obligation: Benefit obligation at beginning of year ................................................................. $ 140,085 $ 140,873 ASC Topic 715 measurement date adjustment...................................................... - (520) Acquisitions........................................................................................................... - 4,685 Service cost............................................................................................................ 3,687 4,381 Interest cost............................................................................................................ 9,950 8,969 Actuarial loss (gain)............................................................................................... 22,688 (11,139) Benefits paid.......................................................................................................... (8,168) (6,245) Foreign exchange rate changes.............................................................................. 676 (919) Benefit obligation at end of year ........................................................................... $ 168,918 $ 140,085 Change in plan assets: Fair value of plan assets at beginning of year........................................................ $ 91,144 $ 125,540 ASC Topic 715 measurement date adjustment...................................................... - (1,705) Actual gain (loss) on plan assets............................................................................ 30,549 (34,933) Employer contribution........................................................................................... 18,026 9,311 Benefits paid.......................................................................................................... (8,168) (6,245) Settlements ............................................................................................................ - (244) Foreign exchange rate changes.............................................................................. 585 (580) Fair value of plan assets at end of year.................................................................. $ 132,136 $ 91,144 Funded status ........................................................................................................ $ (36,782) $ (48,941) Unrecognized actuarial loss................................................................................... 47,739 54,334 Unrecognized prior service cost ............................................................................ 1,251 1,956 Net amount recognized.......................................................................................... $ 12,208 $ 7,349
Amounts recognized in the consolidated balance sheets are as follows: March 31, 2010 2009 Other assets – non current ..................................................................................... $ - $ 707 Accrued liabilities.................................................................................................. (603) (596) Other non-current liabilities................................................................................... (36,179) (49,052) Deferred tax effect of accumulated other comprehensive loss .............................. 18,546 22,488 Accumulated other comprehensive loss ................................................................ 30,444 33,802 Net amount recognized.......................................................................................... $ 12,208 $ 7,349

F-25
COLUMBUS McKINNON CORPORATION
NOTES TO CONSOLIDATED FINANCIAL STATEMENTS—(Continued)
(tabular amounts in thousands, except share data) In fiscal 2011, an estimated net loss of $3,410,000 and prior service cost of $240,000 for the defined benefit pension plans will be amortized from accumulated other comprehensive loss to net periodic benefit cost.
Net periodic pension cost included the following components:
Year Ended March 31, 2010 2009 2008 Service costs—benefits earned during the period.................................... $ 3,687 $ 4,381 $ 4,386 Interest cost on projected benefit obligation............................................ 9,950 8,969 8,277 Expected return on plan assets................................................................. (7,479) (9,234) (8,198) Net amortization ...................................................................................... 4,210 1,319 2,014 Curtailment/settlement loss ..................................................................... 2,417 457 80 Net periodic pension cost ........................................................................ $ 12,785 $ 5,892 $ 6,559
In fiscal 2010, the Company recorded a curtailment loss on the statement of operations within restructuring
charges. Refer to Note 16 for further discussion.
Information for pension plans with a projected benefit obligation in excess of plan assets is as follows: March 31, 2010 2009 Projected benefit obligation................................................................................... $ 168,918 $ 135,021 Fair value of plan assets......................................................................................... 132,136 85,374
Information for pension plans with an accumulated benefit obligation in excess of plan assets is as follows: March 31, 2010 2009 Accumulated benefit obligation............................................................................. $ 162,212 $ 127,890 Fair value of plan assets......................................................................................... 132,136 85,374
Unrecognized gains and losses are amortized on a straight-line basis over the average remaining service period of active participants. The weighted-average assumptions in the following table represent the rates used to develop the actuarial present value of the projected benefit obligation for the year listed and also net periodic pension cost for the following year: March 31, 2010 2009 2008 Discount rate............................................................... 6.00% 7.25% 6.50% Expected long-term rate of return on plan assets........ 7.50 7.50 7.50 Rate of compensation increase ................................... 2.00 2.00 3.00 The expected rates of return on plan asset assumptions are determined considering historical averages and real returns on each asset class.
The Company’s retirement plan target and actual asset allocations are as follows: March 31, Target Actual 2011 2010 2009 Equity securities ......................................................... 70% 60% 56% Fixed income .............................................................. 30 40 44 Total plan assets ......................................................... 100% 100% 100%
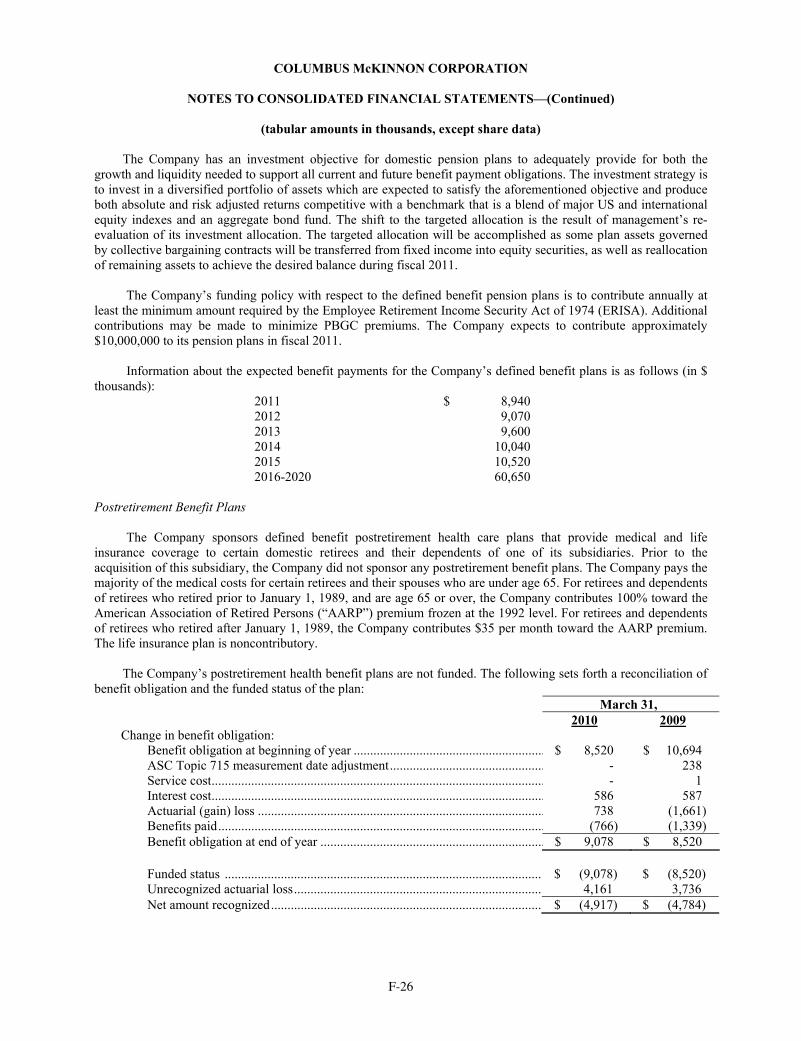
F-26
COLUMBUS McKINNON CORPORATION
NOTES TO CONSOLIDATED FINANCIAL STATEMENTS—(Continued)
(tabular amounts in thousands, except share data) The Company has an investment objective for domestic pension plans to adequately provide for both the growth and liquidity needed to support all current and future benefit payment obligations. The investment strategy is to invest in a diversified portfolio of assets which are expected to satisfy the aforementioned objective and produce both absolute and risk adjusted returns competitive with a benchmark that is a blend of major US and international equity indexes and an aggregate bond fund. The shift to the targeted allocation is the result of management’s re-evaluation of its investment allocation. The targeted allocation will be accomplished as some plan assets governed by collective bargaining contracts will be transferred from fixed income into equity securities, as well as reallocation of remaining assets to achieve the desired balance during fiscal 2011.
The Company’s funding policy with respect to the defined benefit pension plans is to contribute annually at least the minimum amount required by the Employee Retirement Income Security Act of 1974 (ERISA). Additional contributions may be made to minimize PBGC premiums. The Company expects to contribute approximately $10,000,000 to its pension plans in fiscal 2011.
Information about the expected benefit payments for the Company’s defined benefit plans is as follows (in $ thousands):
2011 $ 8,940 2012 9,070 2013 9,600 2014 10,040 2015 10,520 2016-2020 60,650
Postretirement Benefit Plans
The Company sponsors defined benefit postretirement health care plans that provide medical and life insurance coverage to certain domestic retirees and their dependents of one of its subsidiaries. Prior to the acquisition of this subsidiary, the Company did not sponsor any postretirement benefit plans. The Company pays the majority of the medical costs for certain retirees and their spouses who are under age 65. For retirees and dependents of retirees who retired prior to January 1, 1989, and are age 65 or over, the Company contributes 100% toward the American Association of Retired Persons (“AARP”) premium frozen at the 1992 level. For retirees and dependents of retirees who retired after January 1, 1989, the Company contributes $35 per month toward the AARP premium. The life insurance plan is noncontributory.
The Company’s postretirement health benefit plans are not funded. The following sets forth a reconciliation of benefit obligation and the funded status of the plan: March 31, 2010 2009 Change in benefit obligation: Benefit obligation at beginning of year .......................................................... $ 8,520 $ 10,694 ASC Topic 715 measurement date adjustment............................................... - 238 Service cost..................................................................................................... - 1 Interest cost..................................................................................................... 586 587 Actuarial (gain) loss ....................................................................................... 738 (1,661) Benefits paid................................................................................................... (766) (1,339) Benefit obligation at end of year .................................................................... $ 9,078 $ 8,520 Funded status ................................................................................................. $ (9,078) $ (8,520) Unrecognized actuarial loss............................................................................ 4,161 3,736 Net amount recognized................................................................................... $ (4,917) $ (4,784)

F-27
COLUMBUS McKINNON CORPORATION
NOTES TO CONSOLIDATED FINANCIAL STATEMENTS—(Continued)
(tabular amounts in thousands, except share data)
Amounts recognized in the consolidated balance sheets are as follows: March 31, 2010 2009 Accrued liabilities........................................................................................... $ (1,169) $ (1,159) Other non-current liabilities............................................................................ (7,909) (7,360) Deferred tax effect of accumulated other comprehensive loss ....................... 1,664 1,494 Accumulated other comprehensive loss ......................................................... 2,497 2,241 Net amount recognized................................................................................... $ (4,917) $ (4,784)
In fiscal 2011, an estimated net loss of $344,000 for the defined benefit postretirement health care plans will be amortized from accumulated other comprehensive loss to net periodic benefit cost. In fiscal 2010, net periodic postretirement benefit cost included the following: Year Ended March 31, 2010 2009 2008 Service cost—benefits attributed to service during the period ...................... $ - $ 1 $ 3 Interest cost.................................................................................................... 586 587 613 Net amortization ............................................................................................ 313 351 418 Net periodic postretirement benefit cost................................................ $ 899 $ 939 $1,034
For measurement purposes, healthcare costs are assumed to increase 8.0% in fiscal 2011, grading down over
time to 5.0% in five years. The discount rate used in determining the accumulated postretirement benefit obligation was 6.0% and 7.25% as of March 31, 2010 and 2009, respectively.
Information about the expected benefit payments for the Company’s postretirement health benefit plans is as follows:
2011 $ 1,170 2012 1,110 2013 1,090 2014 1,000 2015 920 2016-2020 3,600
Assumed medical claims cost trend rates have an effect on the amounts reported for the health care plans. A
one-percentage point change in assumed health care cost trend rates would have the following effects:
One Percentage One Percentage Point Increase Point Decrease Effect on total of service and interest cost components................... $ 31 $ (28) Effect on postretirement obligation ................................................. 515 (464)
The Company has split dollar life insurance arrangements with two of its former employees. Under these arrangements, the Company pays certain premium costs on life insurance polices for the employees. Upon the later of the death of the former employee or their spouse, the Company will receive all of the premiums paid to date.
On April 1, 2008, the Company adopted the measurement provisions related to Split Dollar Life Insurance Arrangements contained in ASC Topic 715 and covered in paragraphs 715-60-35-177 to 35-185 (formerly under the pre-codification standards of EITF 06-10). In accordance with ASC Topic 715-60-35-177, an employer should recognize a liability for the postretirement benefit related to a collateral assignment split-dollar life insurance arrangement. These provisions were applied as a change in accounting principle through a cumulative-effect adjustment to retained earnings. The adoption of this guidance resulted in a $1,248,000 reduction to the fiscal 2009 opening balance of retained earnings, recorded on April 1, 2008, the date of adoption. The net periodic pension cost for fiscal 2009 was $71,000 and the accrued liability at March 31, 2009 is $301,000. The net periodic pension cost for fiscal 2010 was $77,000 and the accrued liability at March 31, 2009 is $44,000.

F-28
COLUMBUS McKINNON CORPORATION
NOTES TO CONSOLIDATED FINANCIAL STATEMENTS—(Continued)
(tabular amounts in thousands, except share data) Other Benefit Plans
The Company also sponsors defined contribution plans covering substantially all domestic employees. Participants may elect to contribute basic contributions. These plans provide for employer contributions based primarily on employee participation. The Company recorded a charge for such contributions of approximately $340,000, $1,684,000, and $1,780,000 for the years ended March 31, 2010, 2009 and 2008, respectively. Due to the significant economic downturn, the Company significantly reduced its contribution to the defined contribution plans in FY 2010.
Fair Values of Plan Assets
The fair values of the Company’s defined benefit plans’ consolidated assets by asset category as of March 31 were as follows:
March 31, 2010 2009 Asset categories: Equity securities ............................................................................................... $ 80,430 $ 49,645 Fixed income securities .................................................................................... 50,875 40,515 Cash equivalents ............................................................................................... 831 984 Total.................................................................................................................. $ 132,136 $ 91,144
The fair values of our defined benefit plans’ consolidated assets were determined using the fair value hierarchy of inputs described in Note 5. The fair values by category of inputs as of March 31, 2010 were as follows:
Quoted Prices
in Active Markets for
Identical Assets (Level 1)
Significant
Unobservable Inputs
(Level 3)
Total Asset categories: Equity securities ......................................................................... $ 80,430 $ - $ 80,430 Fixed income securities .............................................................. 35,212 15,663 50,875 Cash equivalents ......................................................................... 831 - 831 Total............................................................................................ $ 116,473 $ 15,663 $ 132,136
Level 1 fixed income securities consist of fixed income mutual funds with quoted market prices.
Fair value of Level 3 fixed income securities at the beginning of the year was $15,603,000. During fiscal 2010 fixed income securities earned investment return of $785,000 and had disbursements, settlements, and transfers, net of $725,000 resulting in an ending balance of $15,663,000. 13. Employee Stock Ownership Plan (ESOP)
The guidance in ASC Topic 718 "Compensation - Stock Compensation" and covered in sub-topic 718-40 "Employee Stock Ownership Plans" requires that compensation expense for ESOP shares be measured based on the fair value of those shares when committed to be released to employees, rather than based on their original cost. Also, dividends on those ESOP shares that have not been allocated or committed to be released to ESOP participants are not reflected as a reduction of retained earnings. Rather, since those dividends are used for debt service, a charge to compensation expense is recorded. Furthermore, ESOP shares that have not been allocated or committed to be released are not considered outstanding for purposes of calculating earnings per share.
The obligation of the ESOP to repay borrowings incurred to purchase shares of the Company’s common stock
is guaranteed by the Company; the unpaid balance of such borrowings, if any, would be reflected in the consolidated balance sheet as a liability. An amount equivalent to the cost of the collateralized common stock and representing deferred employee benefits has been recorded as a deduction from shareholders’ equity.

F-29
COLUMBUS McKINNON CORPORATION
NOTES TO CONSOLIDATED FINANCIAL STATEMENTS—(Continued)
(tabular amounts in thousands, except share data)
Substantially all of the Company’s domestic non-union employees are participants in the ESOP. Contributions to the plan result from the release of collateralized shares as debt service payments are made. Compensation expense amounting to $408,000, $632,000, and $1,037,000 in fiscal 2010, 2009 and 2008, respectively, is recorded based on the guaranteed release of the ESOP shares at their fair market value. Dividends on allocated ESOP shares, if any, are recorded as a reduction of retained earnings and are applied toward debt service.
At March 31, 2010 and 2009, 623,137 and 646,329 of ESOP shares, respectively, were allocated or available to be allocated to participants’ accounts. At March 31, 2010 and 2009, 115,778 and 144,458 of ESOP shares were pledged as collateral to guarantee the ESOP term loans.
The fair market value of unearned ESOP shares at March 31, 2010 amounted to $2,300,000. 14. Earnings per Share and Stock Plans
Earnings per Share
The Company calculates earnings per share in accordance with ASC Topic 260, “Earnings per Share.” Basic earnings per share exclude any dilutive effects of options, warrants, and convertible securities. Diluted earnings per share include any dilutive effects of stock options. Stock options and performance shares with respect to 178,000 common shares and 15,000 common shares, respectively, were not included in the computation of diluted loss per share for fiscal 2010 because they were antidilutive as a result of the Company’s net loss. Stock options and performance shares with respect to 236,000 common shares and 28,000 common shares, respectively, were not included in the computation of diluted loss per share for fiscal 2009 because they were antidilutive as a result of the Company’s net loss.
The following table sets forth the computation of basic and diluted earnings per share:
Year Ended March 31, 2010 2009 2008 Numerator for basic and diluted earnings per share: (Loss) income from continuing operations................................. $ (7,544) $ (76,102) $ 46,915 Income (loss) from discontinued operations (net of tax) ............ 531 (2,282) (9,566) Net (loss) income ....................................................................... $ (7,013) $ (78,384) $ 37,349 Denominators: Weighted-average common stock outstanding— denominator for basic EPS .....................................................
18,963
18,861
18,723
Effect of dilutive employee stock options .................................. - - 435 Adjusted weighted-average common stock outstanding and assumed conversions— denominator for diluted EPS ..................................................
18,963
18,861
19,158
The weighted-average common stock outstanding shown above is net of unallocated ESOP shares (see Note
13).
F-30
COLUMBUS McKINNON CORPORATION
NOTES TO CONSOLIDATED FINANCIAL STATEMENTS—(Continued)
(tabular amounts in thousands, except share data) Stock Plans
The Company records stock-based compensation in accordance with ASC Topic 718, “Compensation –
Retirement Benefits,” applying the modified prospective method. This Statement requires all equity-based payments to employees, including grants of employee stock options, to be recognized in the statement of earnings based on the grant date fair value of the award. Under the modified prospective method, the Company is required to record equity-based compensation expense for all awards granted after the date of adoption and for the unvested portion of previously granted awards outstanding as of the date of adoption. Long Term Incentive Plan
The Company grants share based compensation to eligible participants under our Long Term Incentive Plan, or LTIP. The LTIP was approved by our Board of Directors and the shareholders of the Company in fiscal 2007. The total number of shares of common stock with respect to which awards may be granted under the plan is 850,000, of which 401,821 shares remain for future grants as of March 31, 2010. The LTIP was designed as an omnibus plan and awards may consist of non-qualified stock options, incentive stock options, stock appreciation rights, restricted stock, restricted stock units, or stock bonuses. A maximum of 600,000 shares may be awarded as restricted stock, restricted stock units, or stock bonuses.
Under the plan, the granting of awards to employees may take the form of options, restricted shares, and
performance shares. The Compensation Committee of our Board of Directors determines the number of shares, the term, the frequency and date, the type, the exercise periods, any performance criteria pursuant to which awards may be granted and the restriction and other terms and conditions of each grant in accordance with terms of our Plan.
Stock based compensation expense was $1,544,000, $799,000, and $1,266,000 for fiscal 2010, 2009 and 2008,
respectively. Stock compensation expense is included in cost of goods sold, selling, and general and administrative expense. The Company recognizes expense for all share–based awards over the service period, which is the shorter of the period until the employees’ retirement eligibility dates or the service period for the award for awards expected to vest. Accordingly, expense is generally reduced for estimated forfeitures. ASC Topic 718 requires forfeitures to be estimated at the time of grant and revised if necessary, in subsequent periods if actual forfeitures differ from those estimates.
The Company recognized compensation expense for stock option awards and unvested restricted share awards that vest based on time or market parameters straight-line over the requisite service period for vesting of the award.
Stock Option Plans
The Company granted stock options under the LTIP in 2010. Options granted have a maximum term of 10
years and vest ratably over a five or six year period from date of grant. Option awards provide for accelerated vesting as a result of reaching retirement age and a specified number of years of service. Existing prior to the adoption of the LTIP, the Company maintained two stock option plans, a Non-Qualified Stock Option Plan (Non-Qualified Plan) and an Incentive Stock Option Plan (Incentive Plan). Under the Non-Qualified Plan, options may be granted to officers and other key employees of the Company as well as to non-employee directors and advisors. As of March 31, 2010, no options have been granted to non-employees. Options granted under the Non-Qualified and Incentive Plans generally become exercisable over a four-year period at the rate of 25% per year commencing one year from the date of grant at an exercise price of not less than 100% of the fair market value of the common stock on the date of grant. Any option granted under the Non-Qualified plan may be exercised not earlier than one year from the date such option is granted. Any option granted under the Incentive Plan may be exercised not earlier than one year and not later than 10 years from the date such option is granted.

F-31
COLUMBUS McKINNON CORPORATION
NOTES TO CONSOLIDATED FINANCIAL STATEMENTS—(Continued)
(tabular amounts in thousands, except share data)
A summary of option transactions during each of the three fiscal years in the period ended March 31, 2010 is as follows:
Shares
Weighted-average Exercise Price
Weighted-average Remaining
Contractual Life (in years)
Aggregate Intrinsic
Value Outstanding at April 1, 2007 .............. 931,150 $ 12.28 Granted .......................................... 5,000 32.85 Exercised ....................................... (144,425) 9.81 Cancelled ....................................... (4,875) 5.46 Outstanding at March 31, 2008 .......... 786,850 $ 12.91 Granted .......................................... 89,150 27.42 Exercised ....................................... (46,375) 9.07 Cancelled ....................................... (103,970) 22.69 Outstanding at March 31, 2009 .......... 725,655 $ 13.51 Granted .......................................... 160,700 13.73 Exercised ....................................... (45,500) 6.40 Cancelled ....................................... (194,596) 21.11 Outstanding at March 31, 2010 .......... 646,259 $ 12.02 5.3 $ 3,341 Exercisable at March 31, 2010 ........... 444,663 $ 10.27 3.6 $ 3,004
The Company calculated intrinsic value for those options that had an exercise price lower than the market price of our common shares as of March 31, 2010. The aggregate intrinsic value of outstanding options as of March 31, 2010 is calculated as the difference between the exercise price of the underlying options and the market price of our common shares for the 521,018 options that were in-the-money at that date. The aggregate intrinsic value of exercisable options as of March 31, 2010 is calculated as the difference between the exercise price of the underlying options and the market price of our common shares for the 363,350 exercisable options that were in-the-money at that date. The Company's closing stock price was $15.87 as of March 31, 2010. The total intrinsic value of stock options exercised was $324,000, $773,000, and $2,842,000 during fiscal 2010, 2009 and 2008, respectively. As of March 31, 2010, there are 96,615 options available for future grants under the two stock option plans.
The fair value of shares that vested was $12.32, $4.20, and $5.14 during fiscal 2010, 2009 and 2008,
respectively. Cash received from option exercises under all share-based payment arrangements during fiscal 2010 was
approximately $292,000. Proceeds from the exercise of stock options under stock option plans are credited to common stock at par value and the excess is credited to additional paid-in capital.
As of March 31, 2010, $718,000 of unrecognized compensation cost related to non-vested stock options is
expected to be recognized over a weighted-average period of approximately 3 years.
Exercise prices for options outstanding as of March 31, 2010, ranged from $5.46 to $28.45. The following table provides certain information with respect to stock options outstanding at March 31, 2010:
Range of Exercise Prices
Stock Options Outstanding
Weighted-average
Exercise Price
Weighted-average Remaining
Contractual Life Up to $10.00 ....................................... 351,850 $ 7.46 2.9 $10.01 to $20.00. ................................. 189,168 14.07 8.8 $20.01 to $30.00 .................................. 105,241 23.60 7.0 646,259 $ 12.02 5.3

F-32
COLUMBUS McKINNON CORPORATION
NOTES TO CONSOLIDATED FINANCIAL STATEMENTS—(Continued)
(tabular amounts in thousands, except share data)
The following table provides certain information with respect to stock options exercisable at March 31, 2010:
Range of Exercise Prices
Stock Options Outstanding
Weighted-average
Exercise Price Up to $10.00 ......................................................................... 351,850 $ 7.46 $10.01 to $20.00. ................................................................... 19,000 14.79 $20.01 to $30.00 .................................................................... 73,813 22.49 444,663 $ 10.27
The fair value of stock options granted was estimated on the date of grant using a Black-Scholes option pricing model. The Black-Scholes option valuation model was developed for use in estimating the fair value of traded options which have no vesting restrictions and are fully transferable. In addition, option valuation models require the input of highly subjective assumptions including the expected stock price volatility. Because the Company’s employee stock options have characteristics significantly different from those of traded options, and because changes in the subjective input assumptions can materially affect the fair value estimate, in management’s opinion, the existing models do not necessarily provide a reliable single measure of the fair value of its employee stock options. The weighted-average fair value of the options was $8.18, $14.77, and $18.48 for options granted during fiscal 2010, 2009 and 2008, respectively. The following table provides the weighted-average assumptions used to value stock options granted during fiscal 2010, 2009 and 2008:
Year Ended Year Ended Year Ended March 31, 2010 March 31, 2009 March 31, 2008Assumptions:
Risk-free interest rate ................................... 1.97% 2.58% 4.92% Dividend yield—Incentive Plan ................... 0.0% 0.0% 0.0% Volatility factor ............................................ 0.591 0.567 0.571 Expected life—Incentive Plan...................... 5.5 years 6.0 years 5.5 years
To determine expected volatility, the Company uses historical volatility based on daily closing prices of its
Common Stock over periods that correlate with the expected terms of the options granted. The risk-free rate is based on the United States Treasury yield curve at the time of grant for the appropriate term of the options granted. Expected dividends are based on the Company's history and expectation of dividend payouts. The expected term of stock options is based on vesting schedules, expected exercise patterns and contractual terms.
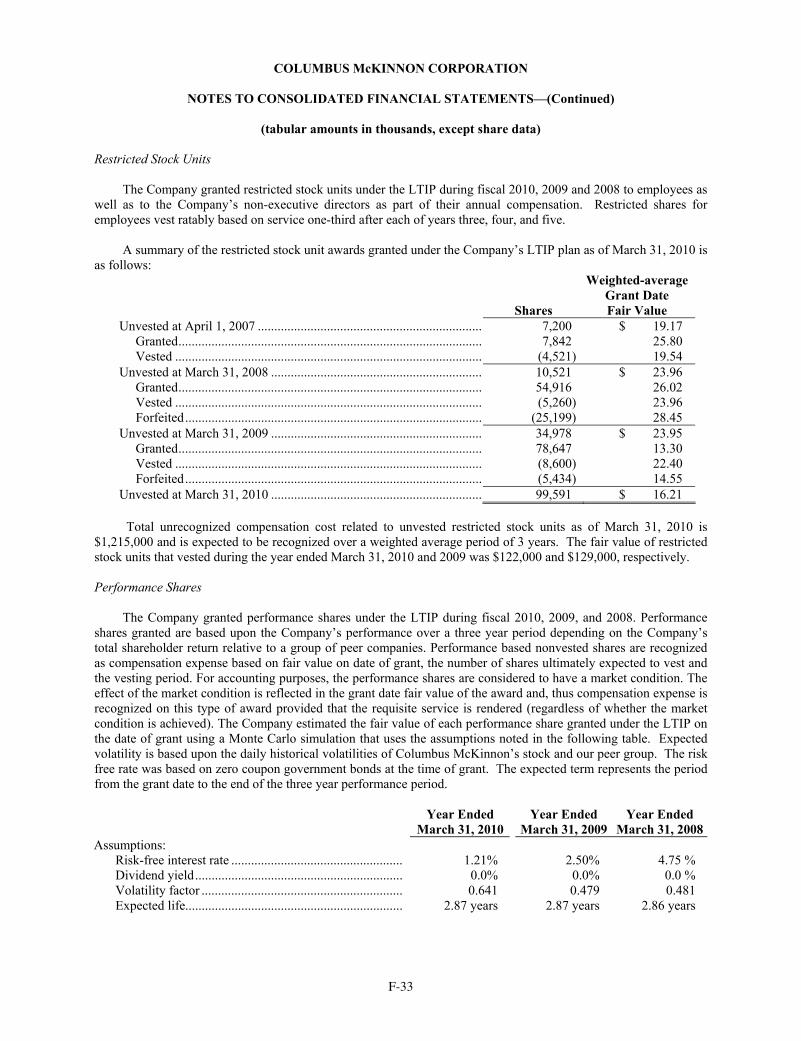
F-33
COLUMBUS McKINNON CORPORATION
NOTES TO CONSOLIDATED FINANCIAL STATEMENTS—(Continued)
(tabular amounts in thousands, except share data) Restricted Stock Units
The Company granted restricted stock units under the LTIP during fiscal 2010, 2009 and 2008 to employees as well as to the Company’s non-executive directors as part of their annual compensation. Restricted shares for employees vest ratably based on service one-third after each of years three, four, and five.
A summary of the restricted stock unit awards granted under the Company’s LTIP plan as of March 31, 2010 is as follows:
Shares
Weighted-average Grant Date Fair Value
Unvested at April 1, 2007 ..................................................................... 7,200 $ 19.17 Granted............................................................................................. 7,842 25.80 Vested .............................................................................................. (4,521) 19.54 Unvested at March 31, 2008 ................................................................. 10,521 $ 23.96 Granted............................................................................................. 54,916 26.02 Vested .............................................................................................. (5,260) 23.96 Forfeited........................................................................................... (25,199) 28.45 Unvested at March 31, 2009 ................................................................. 34,978 $ 23.95 Granted............................................................................................. 78,647 13.30 Vested .............................................................................................. (8,600) 22.40 Forfeited........................................................................................... (5,434) 14.55 Unvested at March 31, 2010 ................................................................. 99,591 $ 16.21
Total unrecognized compensation cost related to unvested restricted stock units as of March 31, 2010 is
$1,215,000 and is expected to be recognized over a weighted average period of 3 years. The fair value of restricted stock units that vested during the year ended March 31, 2010 and 2009 was $122,000 and $129,000, respectively. Performance Shares
The Company granted performance shares under the LTIP during fiscal 2010, 2009, and 2008. Performance shares granted are based upon the Company’s performance over a three year period depending on the Company’s total shareholder return relative to a group of peer companies. Performance based nonvested shares are recognized as compensation expense based on fair value on date of grant, the number of shares ultimately expected to vest and the vesting period. For accounting purposes, the performance shares are considered to have a market condition. The effect of the market condition is reflected in the grant date fair value of the award and, thus compensation expense is recognized on this type of award provided that the requisite service is rendered (regardless of whether the market condition is achieved). The Company estimated the fair value of each performance share granted under the LTIP on the date of grant using a Monte Carlo simulation that uses the assumptions noted in the following table. Expected volatility is based upon the daily historical volatilities of Columbus McKinnon’s stock and our peer group. The risk free rate was based on zero coupon government bonds at the time of grant. The expected term represents the period from the grant date to the end of the three year performance period.
Year Ended Year Ended Year Ended March 31, 2010 March 31, 2009 March 31, 2008Assumptions:
Risk-free interest rate .................................................... 1.21% 2.50% 4.75 % Dividend yield............................................................... 0.0% 0.0% 0.0 % Volatility factor ............................................................. 0.641 0.479 0.481 Expected life.................................................................. 2.87 years 2.87 years 2.86 years

F-34
COLUMBUS McKINNON CORPORATION
NOTES TO CONSOLIDATED FINANCIAL STATEMENTS—(Continued)
(tabular amounts in thousands, except share data)
A summary of the performance shares transactions during each of the three fiscal years in the period ended March 31, 2010 is as follows:
Shares Weighted-average
Grant Date Fair Value Unvested at April 1, 2007 - - Granted 34,457 $ 19.40 Unvested at March 31, 2008........................................................... 34,457 19.40 Granted ...................................................................................... 20,669 28.07 Forfeited .................................................................................... (10,047) 22.60 Unvested at March 31, 2009........................................................... 45,079 22.66 Granted ...................................................................................... 64,614 17.12 Forfeited .................................................................................... (20,059) 19.40 Vested ........................................................................................ (8,062) 19.40 Unvested at March 31, 2010........................................................... 81,572 $ 19.40
Total unrecognized compensation costs related to the unvested performance share awards as of March 31, 2010
was $995,000 and is expected be recognized over a weighted average period of 1.5 years. The fair value of performance shares that vested during the year ended March 31, 2010 and 2009 was $127,000 and $0, respectively. Restricted Stock
Also, existing prior to the adoption of the LTIP, the Company maintains a Restricted Stock Plan. The Company charges compensation expense and shareholders’ equity for the market value of shares ratably over the restricted period. Grantees that remain continuously employed with the Company become vested in their shares five years after the date of the grant. As of March 31, 2010, there were 47,000 shares available for future grants under the Restricted Stock Plan.
During fiscal 2008, 1,000 shares of restricted stock were granted at a weighted average fair value grant price of $31.69. No restricted stock was granted in fiscal 2009 or fiscal 2010. As of March 31, 2010, there are 2,000 shares of restricted stock outstanding with a weighted average fair value grant price of $27.10. Directors Stock
During fiscal 2010, 2009 and 2008, a total of 21,536, 12,436, and 7,601 shares of stock, respectively, were granted under the LTIP to the Company’s non-executive directors as part of their annual compensation. The weighted average fair value grant price of those shares was $13.00, $20.96, and $25.80 for fiscal 2010, 2009 and 2008, respectively. The expense related to the shares for fiscal 2010, 2009 and 2008 was $280,000, $260,000, and $196,000, respectively. 15. Loss Contingencies From time to time, the Company is named a defendant in legal actions arising out of the normal course of business. The Company is not a party to any pending legal proceeding other than ordinary, routine litigation incidental to our business. The Company does not believe that any of our pending litigation will have a material impact on its business.
General and Product Liability — Accrued general and product liability costs are the actuarially estimated reserves based on amounts determined from loss reports, individual cases filed with the Company, and an amount for losses incurred but not reported. Future cash payments related to reserves for nonasbestos claims are not discounted due to their underlying uncertainty. Reserves for certain asbestos related claims are discounted using a risk free interest rate which ranged from 0.41% to 4.72% as of March 31, 2010. The aggregate amount of undiscounted reserves and discount amount was $24,535,000 and $1,481,000, respectively, as of March 31, 2010. Payments over each of the next five years for the portion of asbestos reserves that the Company discounts are expected to be $200,000 per year and $3,400,000 thereafter. The liability for accrued general and product liability costs are funded by investments in marketable securities (see Notes 2 and 7).
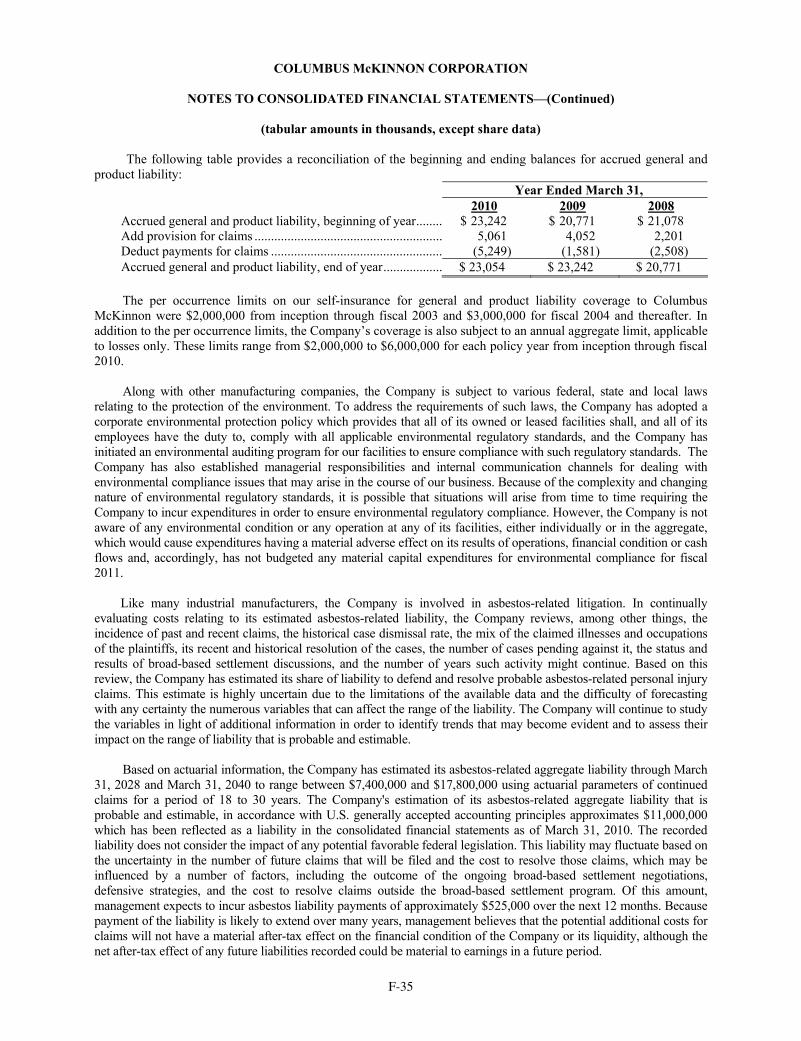
F-35
COLUMBUS McKINNON CORPORATION
NOTES TO CONSOLIDATED FINANCIAL STATEMENTS—(Continued)
(tabular amounts in thousands, except share data)
The following table provides a reconciliation of the beginning and ending balances for accrued general and product liability: Year Ended March 31, 2010 2009 2008 Accrued general and product liability, beginning of year........ $ 23,242 $ 20,771 $ 21,078 Add provision for claims ......................................................... 5,061 4,052 2,201 Deduct payments for claims .................................................... (5,249) (1,581) (2,508) Accrued general and product liability, end of year.................. $ 23,054 $ 23,242 $ 20,771 The per occurrence limits on our self-insurance for general and product liability coverage to Columbus McKinnon were $2,000,000 from inception through fiscal 2003 and $3,000,000 for fiscal 2004 and thereafter. In addition to the per occurrence limits, the Company’s coverage is also subject to an annual aggregate limit, applicable to losses only. These limits range from $2,000,000 to $6,000,000 for each policy year from inception through fiscal 2010.
Along with other manufacturing companies, the Company is subject to various federal, state and local laws
relating to the protection of the environment. To address the requirements of such laws, the Company has adopted a corporate environmental protection policy which provides that all of its owned or leased facilities shall, and all of its employees have the duty to, comply with all applicable environmental regulatory standards, and the Company has initiated an environmental auditing program for our facilities to ensure compliance with such regulatory standards. The Company has also established managerial responsibilities and internal communication channels for dealing with environmental compliance issues that may arise in the course of our business. Because of the complexity and changing nature of environmental regulatory standards, it is possible that situations will arise from time to time requiring the Company to incur expenditures in order to ensure environmental regulatory compliance. However, the Company is not aware of any environmental condition or any operation at any of its facilities, either individually or in the aggregate, which would cause expenditures having a material adverse effect on its results of operations, financial condition or cash flows and, accordingly, has not budgeted any material capital expenditures for environmental compliance for fiscal 2011. Like many industrial manufacturers, the Company is involved in asbestos-related litigation. In continually evaluating costs relating to its estimated asbestos-related liability, the Company reviews, among other things, the incidence of past and recent claims, the historical case dismissal rate, the mix of the claimed illnesses and occupations of the plaintiffs, its recent and historical resolution of the cases, the number of cases pending against it, the status and results of broad-based settlement discussions, and the number of years such activity might continue. Based on this review, the Company has estimated its share of liability to defend and resolve probable asbestos-related personal injury claims. This estimate is highly uncertain due to the limitations of the available data and the difficulty of forecasting with any certainty the numerous variables that can affect the range of the liability. The Company will continue to study the variables in light of additional information in order to identify trends that may become evident and to assess their impact on the range of liability that is probable and estimable.
Based on actuarial information, the Company has estimated its asbestos-related aggregate liability through March 31, 2028 and March 31, 2040 to range between $7,400,000 and $17,800,000 using actuarial parameters of continued claims for a period of 18 to 30 years. The Company's estimation of its asbestos-related aggregate liability that is probable and estimable, in accordance with U.S. generally accepted accounting principles approximates $11,000,000 which has been reflected as a liability in the consolidated financial statements as of March 31, 2010. The recorded liability does not consider the impact of any potential favorable federal legislation. This liability may fluctuate based on the uncertainty in the number of future claims that will be filed and the cost to resolve those claims, which may be influenced by a number of factors, including the outcome of the ongoing broad-based settlement negotiations, defensive strategies, and the cost to resolve claims outside the broad-based settlement program. Of this amount, management expects to incur asbestos liability payments of approximately $525,000 over the next 12 months. Because payment of the liability is likely to extend over many years, management believes that the potential additional costs for claims will not have a material after-tax effect on the financial condition of the Company or its liquidity, although the net after-tax effect of any future liabilities recorded could be material to earnings in a future period.

F-36
COLUMBUS McKINNON CORPORATION
NOTES TO CONSOLIDATED FINANCIAL STATEMENTS—(Continued)
(tabular amounts in thousands, except share data) 16. Restructuring Charges
During fiscal 2010, the Company continued its business reorganization plan. As part of that plan, the Company consolidated its North American sales force and offered certain of its employees an incentive to voluntarily retire early. Charges related to the early retirement program were approximately $5,732,000 and consist of two benefits: a paid leave of absence and an enhanced pension benefit. The payments for the paid leave of absence are being made to the employees in installments on their regular pay dates. Charges for the enhanced pension benefit of $2,012,000 are recorded in long-term pension liabilities. Long-term pension liabilities are included in other non-current liabilities on the condensed consolidated balance sheets.
Furthermore, during fiscal 2010, as part of the business reorganization plan, the Company initiated strategic consolidation of its North American hoist and rigging operations. The process includes the closure of two manufacturing facilities and the significant downsizing of a third facility. The closures will result in a reduction of approximately 500,000 square feet of manufacturing space and generation of annual savings estimated at approximately $13,000,000 to $15,000,000. The Company expects to record approximately $3,500,000 in additional restructuring charges in fiscal 2011. Rationalization of North American hoist and rigging operations and the significant downsizing of the third facility resulted in $1,835,000 of non-cash fixed asset impairment charges, $3,209,000 of other facility related costs, $5,325,000 in expense for severance costs related to salaried and union workforce reductions, and $418,000 of pension plan curtailment charges recognized in fiscal 2010. Restructuring reserves were $2,755,000 as of March 31, 2010, consisting primarily of accrued severance costs. The majority of the severance costs will be paid during fiscal 2011.
During fiscal 2009, the Company incurred restructuring costs of $1,921,000 for facility rationalization costs
and severance. The total charge for severance was $1,823,000, all of which related to salaried workforce reductions, and $98,000 for costs associated with the closure of a production facility. The number of salaried employees terminated was approximately 70. During fiscal 2008, the Company recorded restructuring costs of $836,000 for facility demolition costs and severance.
The following provides a reconciliation of the activity related to restructuring reserves:
Employee Facility Total Reserve at April 1, 2007................................................................................. $ - $ 599 $ 599 Fiscal 2008 restructuring charges ................................................................... 105 731 836 Cash payments................................................................................................ (105) (1,272) (1,377) Reserve at March 31, 2008 ............................................................................. $ - $ 58 $ 58 Fiscal 2009 restructuring charges ................................................................... 1,823 98 1,921 Cash payments................................................................................................ (521) (156) (677) Reserve at March 31, 2009 ............................................................................. $ 1,302 $ - $ 1,302 Fiscal 2010 restructuring charges ................................................................... 11,475 5,044 16,519 Cash payments................................................................................................ (7,592) (3,209) (10,801) Reclassification of long-term pension liability ............................................... (2,430) - (2,430) Fixed asset impairment................................................................................... - (1,835) (1,835) Reserve at March 31, 2010 ............................................................................. $ 2,755 $ - $ 2,755

F-37
COLUMBUS McKINNON CORPORATION
NOTES TO CONSOLIDATED FINANCIAL STATEMENTS—(Continued)
(tabular amounts in thousands, except share data) 17. Income Taxes
The provision for income taxes differs from the amount computed by applying the statutory federal income tax rate to income from continuing operations before income tax expense. The sources and tax effects of the difference were as follows:
Year Ended March 31, 2010 2009 2008 Expected tax at 35% .................................................................................. $ (4,511) $ (20,335) $ 24,407 State income taxes net of federal benefit ................................................... (238) 309 1,238 Foreign taxes less than statutory provision................................................ (1,081) (1,136) (1,095) Permanent items ........................................................................................ 229 137 315 Goodwill impairment................................................................................. - 37,450 - Valuation allowance .................................................................................. - - (1,000) Other.......................................................................................................... 256 1,576 (1,046) Actual tax (benefit) provision.................................................................... $ (5,345) $ 18,001 $ 22,819
The provision for income tax (benefit) expense consisted of the following:
Year Ended March 31, 2010 2009 2008 Current income tax (benefit) expense: United States Federal......................................................................... $ - $ 13,963 $ 853 State taxes.......................................................................................... 913 291 1,904 Foreign............................................................................................... 2,417 5,447 5,437 Deferred income tax (benefit) expense: United States...................................................................................... (7,745) (1,076) 14,304 Foreign............................................................................................... (930) (624) 321 $ (5,345) $ 18,001 $ 22,819
The Company applies the liability method of accounting for income taxes as required by ASC Topic 740, “Income Taxes.” The tax effects of temporary differences that give rise to significant portions of the deferred tax assets and deferred tax liabilities are as follows:
March 31, 2010 2009 Deferred tax assets: Federal net operating loss carryforwards................................................................. $ 12,184 $ 1,556 State and foreign net operating loss carryforwards.................................................. 3,703 2,829 Employee benefit plans ........................................................................................... 12,163 18,050 Asset reserves .......................................................................................................... 1,674 1,471 Insurance reserves ................................................................................................... 9,035 9,245 Accrued vacation and incentive costs...................................................................... 1,916 2,259 Other........................................................................................................................ 7,250 8,681 Valuation allowance ................................................................................................ (1,609) (1,594) Gross deferred tax assets 46,316 42,497 Deferred tax liabilities: Inventory reserves ................................................................................................... (2,355) (1,298) Property, plant, and equipment................................................................................ (1,521) (2,303) Intangible assets....................................................................................................... (5,167) (5,533) Gross deferred tax liabilities................................................................................ (9,043) (9,134) Net deferred tax assets ..................................................................................... $ 37,273 $ 33,363

F-38
COLUMBUS McKINNON CORPORATION
NOTES TO CONSOLIDATED FINANCIAL STATEMENTS—(Continued)
(tabular amounts in thousands, except share data)
The valuation allowance includes $545,000 and $530,000 related to pre-acquisition foreign net operating losses and $1,064,000 related to state net operating losses in the United States at both March 31, 2010 and 2009. The increase in the foreign valuation allowance is due to exchange rate fluctuations. The valuation allowance was established due to uncertainty of the Company's ability to utilize all of the net operating loss carry forwards before they expire. The Company’s valuation allowance related to Pfaff is for net operating losses which have an indefinite life. The state net operating losses have expiration dates ranging from 2014 through 2030.
The United States Federal net operating losses have expiration dates ranging from 2029 to 2030.
Deferred income taxes are classified within the consolidated balance sheets based on the following breakdown:
March 31, 2010 2009 Net current deferred tax asset ...................................................................................... $ 6,149 $ 7,346 Net non-current deferred tax asset............................................................................... 36,768 32,521 Net non-current deferred tax liability .......................................................................... (5,644) (6,504) Net deferred tax asset .......................................................................................... $ 37,273 $ 33,363
The net current deferred tax asset and net non-current deferred tax liability are included in prepaid expenses and other non-current liabilities, respectively.
Income (loss) from continuing operations before income tax expense includes foreign subsidiary income (loss) of $8,769,000, $(16,119,000), and $21,715,000 for the years ended March 31, 2010, 2009, and 2008, respectively. Income (loss) from discontinued operations reported in the statements of operations is net of tax expense (benefit) of $326,000, $(14,442,000), and $220,000 for the years ended March 31, 2010, 2009, and 2008, respectively. As of March 31, 2010, the Company had unrecognized deferred tax liabilities related to approximately $31,000,000 of cumulative undistributed earnings of foreign subsidiaries. These earnings are considered to be permanently invested in operations outside the United States. Determination of the amount of unrecognized deferred U.S. income tax liability with respect to such earnings is not practicable.
There were 2,500 and 24,375 shares of common stock issued through the exercise of non-qualified stock options or
through the disqualifying disposition of incentive stock options in the years ended March 31, 2010 and 2009, respectively. The tax benefit to the Company from these transactions, which is credited to additional paid-in capital rather than recognized as a reduction of income tax expense, was $5,600 and $274,000 in 2010 and 2009, respectively. This tax benefit has also been recognized in the consolidated balance sheet as an increase in deferred tax assets.
On April 1, 2007, the Company adopted the provisions of ASC Topic 740, “Income Taxes, relating to accounting for uncertainty in income taxes,” formerly referred to as Financial Accounting Standards Board ("FASB") Interpretation ("FIN") No. 48 “Accounting for Uncertainty in Income Taxes,” (“FIN 48”) an interpretation of FASB Statement of Financial Accounting Standards ("SFAS") No. 109, which clarifies the accounting for uncertainty in income taxes recognized. ASC Topic 740 prescribes a recognition threshold and measurement attribute for financial statement recognition and measurement of a tax position taken or expected to be taken in a tax return and also provides guidance on various related matters such as derecognition, interest and penalties, and disclosure.
Changes in the Company’s uncertain income tax positions, excluding the related accrual for interest and penalties,
are as follows:
2010 2009 Beginning balance ....................................................................................................... $ 3,546 $ 2,447 Additions for prior year tax positions.......................................................................... 20 12 Additions for current year tax positions ...................................................................... 260 1,327 Reductions for prior year tax positions........................................................................ (33) (116) Foreign currency translation........................................................................................ (90) - Lapses in statute limitations ........................................................................................ (126) (124) Ending balance ............................................................................................................ $ 3,577 $ 3,546

F-39
COLUMBUS McKINNON CORPORATION
NOTES TO CONSOLIDATED FINANCIAL STATEMENTS—(Continued)
(tabular amounts in thousands, except share data) The Company had $130,000 and $123,000 accrued for the payment of interest and penalties at March 31, 2010 and
2009, respectively. The Company recognizes interest expense or penalties related to uncertain tax positions as a part of income tax expense in its consolidated statements of operations.
Substantially all of the unrecognized tax benefits as of March 31, 2010 would impact the effective tax rate if
recognized. The Company and its subsidiaries file income tax returns in the U.S. and various state and local and foreign
jurisdictions. The Internal Revenue Service has completed an examination of the Company’s U.S. income tax returns for 2007 and 2008, resulting in a reduction of AMT credit carry forwards of $256,000. Current examinations include an IRS audit for one of the Company’s subsidiaries for its 2009 return, a German audit of 2005 through 2007, and various state audits.
The Company does not anticipate that total unrecognized tax benefits will change significantly due to the
settlement of audits or the expiration of statutes of limitations prior to March 31, 2011. 18. Rental Expense and Lease Commitments
Rental expense for the years ended March 31, 2010, 2009, and 2008 was $5,463,000, $5,695,000, and $5,560,000, respectively. The following amounts represent future minimum payment commitments as of March 31, 2010 under non-cancelable operating leases extending beyond one year:
Year Ended March 31, Real Property Vehicles/Equipment Total 2011....................................................................... $ 1,639 $ 1,779 $ 3,418 2012....................................................................... 501 1,240 1,741 2013....................................................................... 333 529 862 2014....................................................................... 316 317 633 2015 and thereafter ................................................ 16 194 210 Total $ 2,805 $ 4,059 $ 6,864

F-40
COLUMBUS McKINNON CORPORATION
NOTES TO CONSOLIDATED FINANCIAL STATEMENTS—(Continued)
(tabular amounts in thousands, except share data) 19. Summary Financial Information
The following information sets forth the condensed consolidating summary financial information of the parent and guarantors, which guarantee the 8 7/8% Senior Subordinated Notes, and the nonguarantors. The guarantors are wholly owned and the guarantees are full, unconditional, joint and several. As of and for the year ended March 31, 2010:
Parent
Guarantors Non
Guarantors
Eliminations
Consolidated As of March 31, 2010: Current assets: Cash........................................................... $ 33,081 $ 24 $ 30,863 $ — $ 63,968 Trade accounts receivable ......................... 38,316 64 31,838 — 70,218 Inventories ................................................. 26,023 16,057 39,742 (2,000) 79,822 Prepaid expenses ....................................... 3,432 874 11,056 652 16,014 Total current assets ................................ 100,852 17,019 113,499 (1,348) 230,022 Net property, plant, and equipment ................... 27,330 11,998 17,778 — 57,106 Goodwill and other intangibles, net................... 41,013 31,028 52,124 — 124,165 Intercompany balances ...................................... (79,763) 153,190 (76,594) 3,167 — Other non-current assets .................................... 37,319 1,255 31,630 — 70,204 Investment in subsidiaries 248,915 — — (248,915) — Total assets ............................................ $ 375,666 $ 214,490 $ 138,437 $ (247,096) $ 481,497 Current liabilities ............................................... $ 38,157 $ 13,176 $ 37,833 $ 1,819 $ 90,985 Long-term debt, less current portion ................. 124,855 2,475 3,491 — 130,821 Other non-current liabilities .............................. 25,376 9,083 37,954 — 72,413 Total liabilities....................................... 188,388 24,734 79,278 1,819 294,219 Shareholders’ equity.......................................... 187,278 189,756 59,159 (248,915) 187,278 Total liabilities and shareholders’ equity .......................................................
$ 375,666 $ 214,490 $ 138,437 $ (247,096) $ 481,497
For the Year Ended March 31, 2010: Net sales ............................................................ $ 193,784 $ 117,854 $ 192,326 $ (27,781) $ 476,183 Cost of products sold......................................... 158,571 94,906 135,245 (28,478) 360,244 Gross profit........................................................ 35,213 22,948 57,081 697 115,939 Selling, general and administrative expenses .... 41,397 13,651 46,308 — 101,356 Restructuring charges ........................................ 15,316 — 1,203 — 16,519 Amortization of intangibles............................... 119 3 1,754 — 1,876 (Loss) income from operations.......................... (21,619) 9,294 7,816 697 (3,812) Interest and debt expense................................... 11,865 493 867 — 13,225 Other (income) and expense, net ....................... (1,893) (1,033) (1,222) — (4,148) (Loss) income from continuing operations before income tax (benefit) expense......................................
(31,591)
9,834
8,171
697
(12,889)
Income tax (benefit) expense............................. (9,963) 2,739 1,687 192 (5,345) Equity in income from continuing operations of subsidiaries……………................................
14,084
—
—
(14,084)
—
(Loss) income from continuous operations ....... (7,544) 7,095 6,484 (13,579) (7,544) Income from discontinued operations ............... 531 — — — 531 Net (loss) income............................................... $ (7,013) $ 7,095 $ 6,484 $ (13,579) $ (7,013)

F-41
COLUMBUS McKINNON CORPORATION
NOTES TO CONSOLIDATED FINANCIAL STATEMENTS—(Continued)
(tabular amounts in thousands, except share data)
Parent
Guarantors Non
Guarantors
Eliminations
Consolidated For the Year Ended March 31, 2010: Operating activities: Net cash provided by operating activities from
continuing operations ..................................................... $ 28,418 $ (665) $ 16,198 $ (14,084) $ 29,867 Cash provided by operating activities................................... 28,418 (665) 16,198 (14,084) 29,867 Investing activities: Purchases of marketable securities, net ................................ (414) — 2,236 — 1,822 Capital expenditures.............................................................. (4,933) (1,674) (638) — (7,245) Investment in subsidiaries..................................................... (14,084) — — 14,084 — Purchases of businesses, net of cash — 2,407 1,135 — 3,542 Net cash used by investing activities from continuing
operations........................................................................ (19,431) 733 2,733 14,084 (1,881) Net cash provided by investing activities from
discontinued operations.................................................. 531 — — — 531 Net cash used by investing activities .................................... (18,900) 733 2,733 14,084 (1,350) Financing activities: Proceeds from exercise of stock options .............................. 291 — — — 291 Net repayments under revolving line-of-credit agreements .......................................................................
—
—
(3,946)
—
(3,946)
Repayment of debt ................................................................ — (130) (834) — (964) Deferred financing costs incurred......................................... (1,258) — — — (1,258) Other...................................................................................... 390 69 — — 459 Net cash used by financing activities from continuing
operations........................................................................ (577) (61) (4,780) — (5,418) Net cash (used) provided by financing activities from
discontinued operations.................................................. — — — — — Net cash used by financing activities.................................... (577) (61) (4,780) — (5,418) Effect of exchange rate changes on cash........................... — (13) 1,646 — 1,633 Net change in cash and cash equivalents.............................. 8,941 (6) 15,797 — 24,732 Cash and cash equivalents at beginning of year ................... 24,140 30 15,066 — 39,236 Cash and cash equivalents at end of year ............................. $ 33,081 $ 24 $ 30,863 $ — $ 63,968 As of and for the year ended March 31, 2009:
Parent
Guarantors Non
Guarantors
Eliminations
Consolidated As of March 31, 2009 Current assets: Cash and cash equivalents $ 24,115 $ 30 $ 15,091 $ — $ 39,236 Trade accounts receivable 46,358 37 33,773 — 80,168 Inventories 33,268 21,113 48,937 (2,697) 100,621 Other current assets 8,480 1,060 7,731 844 18,115 Total current assets 112,221 22,240 105,532 (1,853) 238,140 Property, plant, and equipment, net 29,001 11,995 21,106 — 62,102 Goodwill and other intangibles, net 41,016 31,031 53,033 — 125,080 Intercompany (58,739) 140,495 (83,748) 1,992 — Other assets 36,099 4,659 25,584 — 66,342 Investment in subsidiaries 222,102 — — (222,102) — Total assets $ 381,700 $ 210,420 $ 121,507 $ (221,963) $ 491,664
Current liabilities $ 33,767 $ 17,162 $ 39,933 $ 139 $ 91,001 Long-term debt, less current portion 124,855 2,597 4,476 — 131,928 Other non-current liabilities 41,224 13,895 31,762 — 86,881 Total liabilities 199,846 33,654 76,171 139 309,810 Shareholders' equity 181,854 176,766 45,336 (222,102) 181,854 Total liabilities and shareholders' equity $ 381,700 $ 210,420 $ 121,507 $ (221,963) $ 491,664

F-42
COLUMBUS McKINNON CORPORATION
NOTES TO CONSOLIDATED FINANCIAL STATEMENTS—(Continued)
(tabular amounts in thousands, except share data)
Parent
Guarantors
Non Guarantors
Eliminations
Consolidated
For the Year Ended March 31, 2009: Net sales ................................................................................ $ 288,928 $ 162,935 $ 197,200 $ (42,355) $ 606,708 Cost of products sold ............................................................ 217,628 124,573 132,829 (42,023) 433,007 Gross profit (loss).................................................................. 71,300 38,362 64,371 (332) 173,701 Selling, general and administrative expenses ....................... 46,242 18,612 45,487 — 110,341 Restructuring charges............................................................ 1,367 554 — — 1,921 Impairment loss..................................................................... 48,000 26,000 33,000 — 107,000 Amortization of intangibles .................................................. 117 3 878 — 998 Loss from operations............................................................. (24,426) (6,807) (14,994) (332) (46,559) Interest and debt expense ...................................................... 10,793 1,497 858 — 13,148 Other (income) and expense, net .......................................... (4,833) (1,230) 4,457 — (1,606) Loss from continuing operations before income tax expense (benefit) ........................................................
(30,386)
(7,074)
(20,309)
(332)
(58,101)
Income tax expense (benefit) ................................................ 6,730 7,979 3,418 (126) 18,001 Equity in (loss) income from continuing operations of subsidiaries………................................................................
(38,986)
—
—
38,986
—
(Loss) income from continuous operations .......................... (76,102) (15,053) (23,727) 38,780 (76,102) Loss from discontinued operations....................................... (627) — (1,655) — (2,282) Equity in (loss) income from discontinued operations of subsidiaries (net of tax)……….............................................
(1,655)
—
—
1,655
—
Net (loss) income .................................................................. $ (78,384) $ (15,053) $ (25,382) $ 40,435 $ (78,384) For the Year Ended March 31, 2009: Operating activities: Net cash provided by operating activities from
continuing operations ..................................................... $ (20,482) $ 628 $ 43,895 $ 38,986 $ 63,027 Net cash used by operating activities from discontinued
operations........................................................................ (2,233) — (2,218) 1,655 (2,796) Cash provided by operating activities................................... (22,715) 628 41,677 40,641 60,231 Investing activities: Purchases of marketable securities, net ................................ — — (2,605) — (2,605) Capital expenditures.............................................................. (7,461) (1,910) (2,874) — (12,245) Proceeds from sale of PP&E................................................. — 1,593 — — 1,593 Purchases of businesses, net of cash…………………… — — (52,779) — (52,779) Investment in subsidiaries..................................................... 40,641 — — (40,641) — Net cash used by investing activities from continuing
operations........................................................................ 33,180 (317) (58,258) (40,641) (66,036) Net cash provided by investing activities from
discontinued operations.................................................. 531 — — — 531 Net cash used by investing activities .................................... 33,711 (317) (58,258) (40,641) (65,505) Financing activities: Proceeds from exercise of stock options .............................. 421 — — — 421 Net repayments under revolving line-of-credit agreements .......................................................................
—
—
(2,138)
—
(2,138)
Repayment of debt ................................................................ (4,700) (191) (2,096) — (6,987) Other...................................................................................... 789 — — — 789 Net cash used by financing activities from continuing
operations........................................................................ (3,490) (191) (4,234) — (7,915) Net cash (used) provided by financing activities from
discontinued operations.................................................. (15,191) — 579 — (14,612) Net cash used by financing activities.................................... (18,681) (191) (3,655) — (22,527) Effect of exchange rate changes on cash........................... — 251 (9,208) — (8,957) Net change in cash and cash equivalents.............................. (7,685) 371 (29,444) — (36,758) Cash and cash equivalents at beginning of year ................... 31,800 (341) 44,535 — 75,994 Cash and cash equivalents at end of year ............................. $ 24,115 $ 30 $ 15,091 $ — $ 39,236

F-43
COLUMBUS McKINNON CORPORATION
NOTES TO CONSOLIDATED FINANCIAL STATEMENTS—(Continued)
(tabular amounts in thousands, except share data) For the year ended March 31, 2008:
Parent
Guarantors Non
Guarantors
Eliminations
Consolidated For the Year Ended March 31, 2008: Net sales ................................................................................ $ 302,676 $ 176,901 $ 155,609 $ (41,400) $ 593,786 Cost of products sold ............................................................ 219,366 129,575 100,465 (41,195) 408,211 Gross profit (loss).................................................................. 83,310 47,326 55,144 (205) 185,575 Selling, general and administrative expenses ....................... 49,834 18,043 36,007 — 103,884 Restructuring charges...........................................................… 836 — — — 836 Amortization of intangibles .................................................… 112 3 — — 115 Income (loss) from operations .............................................. 32,528 29,280 19,137 (205) 80,740 Interest and debt expense ...................................................... 9,918 3,554 90 — 13,562 Other (income) and expense, net .......................................... 641 (643) (2,554) — (2,556) Income (loss) from continuing operations before income tax expense (benefit) .............................................................
21,969
26,369
21,601
(205)
69,734
Income tax expense (benefit) ................................................ 6,068 11,080 5,759 (88) 22,819 Equity in income from continuing operations of subsidiaries………................................................................
20,891
—
—
(20,891)
—
Income (loss) from continuous operations ........................... 36,792 15,289 15,842 (21,008) 46,915 Income (loss) from discontinued operations ........................ 557 — (10,123) — (9,566) Net income (loss) .................................................................. $ 37,349 $ 15,289 $ 5,719 $ (21,008) $ 37,349 For the Year Ended March 31, 2008: Operating activities: Net cash provided (used) by operating activities from
continuing operations ..................................................... $ 78,528 $ (1,483) $ 14,741 $ (31,013) $ 60,773 Net cash used by operating activities from discontinued
operations........................................................................ (10,123) — (1,183) 10,123 (1,183) Net cash provided (used) by operating activities.................. 68,405 (1,483) 13,558 (20,890) 59,590 Investing activities: Purchases of marketable securities, net ................................ — — (1,562) — (1,562) Capital expenditures.............................................................. (7,228) (2,745) (2,506) — (12,479) Proceeds from sale of businesses and surplus real estate ..... — 5,504 — — 5,504 Investment in subsidiaries..................................................... (20,891) — — 20,891 — Net cash (used) provided by investing activities from
continuing operations ..................................................... (28,119) 2,759 (4,068) 20,891 (8,537) Net cash provided (used) by investing activities from
discontinued operations.................................................. 557 — (587) — (30) Net cash (used) provided by investing activities .................. (27,562) 2,759 (4,655) 20,891 (8,567) Financing activities: Proceeds from exercise of stock options .............................. 1,416 — 1 (1) 1,416 Net repayment under revolving line-of-credit agreements .......................................................................
—
—
(813)
—
(813)
(Repayment) borrowing of debt............................................ (29,898) (142) 185 — (29,855) Deferred financing costs incurred......................................... (2) — — — (2) Other...................................................................................... 1,075 — — — 1,075 Net cash used by financing activities from continuing
operations........................................................................ (27,409) (142) (627) (1) (28,179) Net cash used by financing activities from discontinued
operations........................................................................ — — (383) — (383) Net cash used by financing activities.................................... (27,409) (142) (1,010) (1) (28,562) Effect of exchange rate changes on cash........................... - (313) 5,191 — 4,878 Net change in cash and cash equivalents.............................. 13,434 821 13,084 — 27,339 Cash and cash equivalents at beginning of year .............................................................
18,366
(1,162)
31,451
—
48,655
Cash and cash equivalents at end of year ............................. $ 31,800 $ (341) $ 44,535 $ — $ 75,994

F-44
COLUMBUS McKINNON CORPORATION
NOTES TO CONSOLIDATED FINANCIAL STATEMENTS—(Continued)
(tabular amounts in thousands, except share data) 20. Business Segment Information
ASC Topic 280, “Segment Reporting,” establishes the standards for reporting information about operating segments in financial statements. Historically the Company had two operating and reportable segments, Products and Solutions. The Solutions segment engaged primarily in the design, fabrication and installation of integrated material handling conveyor systems and service and in the design and manufacture of tire shredders, lift tables and light-rail systems. In fiscal 2009, the Company re-evaluated its operating and reportable segments in connection with the discontinuation of its integrated material handling conveyor systems and service business. With this divestiture, and in consideration of the quantitative contribution of the remaining portions of the Solutions segment to the Company as a whole and our products-orientated strategic growth initiatives, the Company determined that it now has only one operating and reportable segment for both internal and external reporting purposes. Fiscal 2008 financial information reflects the financial position and results of operations as one segment. As part of the organizational restructuring announced in response to adverse market conditions, the Company has reevaluated its reportable segments and continues to believe that it has only one reportable operating segment.
Financial information relating to the Company’s operations by geographic area is as follows: Year Ended March 31, 2010 2009 2008 Net sales: United States................................................................................................. $ 291,564 $ 420,498 $ 447,977 Europe .......................................................................................................... 149,872 141,595 106,503 Canada 12,081 15,052 18,672 Other............................................................................................................. 22,666 29,563 20,634 Total ............................................................................................................. $ 476,183 $ 606,708 $ 593,786 Year Ended March 31, 2010 2009 2008 Total assets: United States................................................................................................. $ 302,210 $ 321,656 $ 399,462 Europe .......................................................................................................... 139,064 134,027 139,360 Canada.......................................................................................................... 13,943 8,422 15,464 Other............................................................................................................. 26,280 27,559 13,414 Assets of continuing operations.................................................................... 481,497 491,664 567,700 Assets of discontinued operations ................................................................ - - 22,335 Total ............................................................................................................. $ 481,497 $ 491,664 $ 590,035 Year Ended March 31, 2010 2009 2008 Long-lived assets: United States................................................................................................. $ 111,369 $ 113,043 $ 184,792 Europe .......................................................................................................... 64,458 66,760 52,564 Other............................................................................................................. 5,444 7,379 3,440 Total ............................................................................................................. $ 181,271 $ 187,182 $ 240,796 Note: Long-lived assets include goodwill, other intangibles and other assets
Sales by major product group are as follows: Year Ended March 31, 2010 2009 2008 Hoists............................................................................................................ $ 252,824 $ 331,822 $ 321,778 Chain and forged attachments ...................................................................... 95,862 132,492 142,966 Industrial cranes ........................................................................................... 41,170 59,868 63,327 Other............................................................................................................. 86,327 82,526 65,715 Total ............................................................................................................. $ 476,183 $ 606,708 $ 593,786

F-45
COLUMBUS McKINNON CORPORATION
NOTES TO CONSOLIDATED FINANCIAL STATEMENTS—(Continued)
(tabular amounts in thousands, except share data) 21. Selected Quarterly Financial Data (Unaudited)
Below is selected quarterly financial data for fiscal 2010 and 2009:
Three Months Ended June 30,
2009 September 30,
2009 December 31,
2009 March 31,
2010 Net sales ................................................... $ 119,008 $ 115,234 $ 118,971 $ 122,970 Gross profit............................................... 29,430 28,051 26,825 31,633 (Loss) income from operations................. (1,786) 543 (2,543) (26) Net (loss) income...................................... $ (2,398) $ (2,731) $ (2,344) $ 460
Net (loss) income per share – basic .......... $ (0.13)
$ (0.14)
$ (0.12)
$ 0.02
Net (loss) income per share – diluted ....... $ (0.13)
$ (0.14)
$ (0.12)
$ 0.02
For fiscal 2009, the Company’s quarterly reporting periods, with the exception of the fourth quarter, ended on
the Sunday closest to the end of the calendar quarter.
Three Months Ended June 29,
2008 September 28,
2008 December 28,
2008 March 31,
2009 Net sales ................................................... $ 151,164 $ 154,680 $ 165,076 $ 135,788 Gross profit............................................... 48,525 45,572 44,791 34,813 Income (loss) from operations.................. 20,395 18,778 14,889 (100,621) Net income (loss)...................................... $ 9,670 $ 10,637 $ 3,813 $ (102,504)
Net income (loss) per share – basic .......... $ 0.51
$ 0.56
$ 0.20
$ (5.43)
Net income (loss) per share – diluted ....... $ 0.50
$ 0.55
$ 0.20
$ (5.43)
Note: The per-share net income (loss) for the four quarters may not equal the per share net loss for the year due to rounding).
Fiscal 2009 results include a $2,096,000 loss from discontinued operations, net of tax, in the quarter ended June 29, 2008, a pre-tax $3,628,000 other-than-temporary impairment of marketable securities in the quarter ended December 28, 2008, and a goodwill impairment charge of $107,000,000 and a pre-tax gain of $3,330,000 from litigation in the quarter ended March 31, 2009. None of the charges related to goodwill were deductible for tax purposes. 22. Accumulated Other Comprehensive Loss The components of accumulated other comprehensive loss is as follows:
March 31, 2010 2009 Net unrealized investment gain (loss) – net of tax............................................. $ 1,708 $ (317) Adjustment to pension liability– net of tax........................................................ (31,112) (34,336) Adjustment to other postretirement obligations – net of tax.............................. (2,497) (2,241) Adjustment to split-dollar life insurance arrangements – net of tax .................. (443) (638) Foreign currency translation adjustment – net of tax......................................... 4,076 (713) Derivatives qualifying as hedges – net of tax .................................................... (58) - Accumulated other comprehensive loss ............................................................ $ (28,326) $ (38,245)

F-46
COLUMBUS McKINNON CORPORATION
NOTES TO CONSOLIDATED FINANCIAL STATEMENTS—(Continued)
(tabular amounts in thousands, except share data)
The deferred taxes associated with the items included in accumulated other comprehensive loss were $19,291,000 and $24,154,000, for 2010 and 2009, respectively. As a result of the recording of a deferred tax asset valuation allowance in fiscal 2005, the Company recorded as an offsetting entry a $534,000 charge in the minimum pension liability component of other comprehensive income. With the reversal of that valuation allowance in fiscal 2006 the Company recorded the reversal of the valuation allowance as a reduction of income taxes in the consolidated statements of operations. This is in accordance with ASC Topic 740, “Income Taxes,” even though the valuation allowance was initially established by a charge against comprehensive income. This amount will remain indefinitely as a component of minimum pension liability adjustment.
The activity by year related to investments, including reclassification adjustments for activity included in earnings are as follows (all items shown net of tax):
Year Ended March 31, 2010 2009 2008 Net unrealized investment (loss) gain at beginning of year.................. $ (317) $ (740) $ 22 Unrealized holdings gain (loss) arising during the period ................ 2,393 (3,584) (674) Reclassification adjustments for (gain) loss included in earnings .... (368) 4,007 (88) Net change in unrealized gain (loss) on investments............................ 2,025 423 (762) Net unrealized investment gain (loss) at end of year............................ $ 1,708 $ (317) $ (740) 23. Effects of New Accounting Pronouncements
Effective July 1, 2009, the Company adopted ASC Topic 105-10, “Generally Accepted Accounting Principles – Overall” (“ASC 105-10”). ASC 105-10 establishes the FASB Accounting Standards Codification (the “Codification”) as the source of authoritative accounting principles recognized by the FASB to be applied by nongovernmental entities in the preparation of financial statements in conformity with U.S. GAAP. Rules and interpretive releases of the SEC under authority of federal securities laws are also sources of authoritative U.S. GAAP for SEC registrants. All guidance contained in the Codification carries an equal level of authority. The Codification superseded all existing non-SEC accounting and reporting standards. All other non-grandfathered, non-SEC accounting literature not included in the Codification is non-authoritative. The FASB will not issue new standards in the form of Statements, FASB Staff Positions or Emerging Issues Task Force Abstracts. Instead, it will issue Accounting Standards Updates (“ASUs”). The FASB will not consider ASUs as authoritative in their own right. ASUs will serve only to update the Codification, provide background information about the guidance and provide the bases for conclusions on the change(s) in the Codification. References made to FASB guidance throughout this document have been updated for the Codification.
On June 30, 2009 the Company adopted the provisions of ASC Topic 855 “Subsequent Events” which establishes principles and requirements for subsequent events. These provisions set forth the period after the balance sheet date during which management shall evaluate events or transactions that may occur for potential recognition or disclosure in the financial statements, circumstances under which an entity shall recognize events or transactions occurring after the balance sheet date, as well as the disclosures that an entity shall make about events or transactions that occurred after the balance sheet date. The adoption of these provisions did not have a material impact on the Company’s consolidated financial position or results of operations. The Company made no significant changes to its condensed consolidated financial statements as a result of its subsequent events evaluation.
F-47
COLUMBUS McKINNON CORPORATION
NOTES TO CONSOLIDATED FINANCIAL STATEMENTS—(Continued)
(tabular amounts in thousands, except share data)
On April 1, 2009, the Company adopted the additional guidance issued under ASC Topic 820 through the issuance of FSP Statement of Financial Accounting Standards (“SFAS”) No. 157-4, “Determining Fair Value When the Volume and Level of Activity for the Asset or Liability Have Significantly Decreased and Identifying Transactions That Are Not Orderly” (“FSP SFAS 157-4”). FSP SFAS 157-4 amends ASC Topic 820 to provide additional guidance on estimating fair value when the volume and level of activity for an asset or liability have significantly decreased in relation to normal market activity for the asset or liability. The FSP also provides additional guidance on circumstances that may indicate that a transaction is not orderly, and requires additional disclosures about fair value measurements in annual and interim reporting periods. FSP SFAS No. 157-4 also supersedes FSP SFAS 157-3, “Determining the Fair Value of a Financial Asset When the Market for That Asset is Not Active.” Disclosures required by this codification update are included in Notes 5 and 11.
On April 1, 2009, the Company adopted the additional guidance issued under ASC Topic 320 and ASC Topic 325 through the issuance of FSP SFAS No. 115-2 and SFAS No. 124-2, “Recognition and Presentation of Other-Than-Temporary Impairments” (“FSP SFAS 115-2 / 124-2”). This FSP extends existing disclosure requirements about debt and equity securities to interim reporting periods as well as provides new disclosure requirements. FSP SFAS 115-2 / 124-2 also provides new guidance on the recognition and presentation of an other-than-temporary impairment for debt securities classified as available for sale or held to maturity. Equity securities are excluded from the scope the FSP’s recognition and measurement provisions. Refer to Note 6 for disclosures required as a result of the adoption of this codification update.
On April 1, 2009, the Company adopted additional guidance issued under ASC Topic 825 “Financial Instruments” through the issuance of FSP SFAS No. 107-1, “Interim Disclosures about Fair Value of Financial Instruments” (“FSP SFAS 107-1”) which requires disclosures about fair value of financial instruments in financial statements for interim reporting periods and in annual financial statements of publicly-traded companies. These provisions also require entities to disclose the method(s) and significant assumptions used to estimate the fair value of financial instruments in financial statements on an interim and annual basis and to highlight any changes from prior periods. The adoption of these provisions did not have a material impact on the Company’s consolidated financial position, results of operations or cash flows. Disclosures required by this codification update are included in Notes 5 and 11. On April 1, 2009, the Company adopted the additional guidance issued under ASC Topic 815 “Derivatives and Hedging” through the issuance of SFAS No. 161 “Disclosures about Derivative Instruments and Hedging Activities – an amendment of FASB Statement No. 133” which requires additional disclosures about the objectives of derivative instruments and hedging activities, the method of accounting for such instruments and a tabular disclosure of the effects of such instruments and related hedged items on the Company’s financial position, financial performance, and cash flows. The adoption of these provisions did not have a material impact on the Company’s consolidated financial position, results of operations or cash flows. On April 1, 2008, the Company adopted the additional guidance issued under ASC Topic 715 “Compensation – Retirement Benefits” through the issuance of FASB Emerging Issues Task Force (“EITF”) Issue No. 06-10, “Accounting for Collateral Assignment Split-Dollar Life Insurance Arrangements” (“EITF 06-10”). In accordance with this codification update, an employer should recognize a liability for the postretirement benefit related to a collateral assignment split-dollar life insurance arrangement. The provisions of EITF 06-10 were applied as a change in accounting principle through a cumulative-effect adjustment to retained earnings. The adoption of EITF 06-10 resulted in a $1,248,000 reduction to the opening balance of retained earnings, recorded on April 1, 2008, the date of adoption. The adoption of EITF 06-10 did not have a significant impact on the Company’s financial position, results of operations or cash flows, basic or diluted per share amounts.

F-48
COLUMBUS McKINNON CORPORATION
NOTES TO CONSOLIDATED FINANCIAL STATEMENTS—(Continued)
(tabular amounts in thousands, except share data)
On April 1, 2009, the Company adopted the provisions of ASC Topic 805 “Business Combinations” which requires the acquiring entity in a business combination to recognize all the assets acquired and liabilities assumed in the transaction; establishes the acquisition-date fair value as the measurement objective for all assets acquired and liabilities assumed; and requires the acquirer to disclose all of the information required to evaluate and understand the nature and financial effect of the business combination. The Company adopted these provisions effective April 1, 2009 for future acquisitions and for deferred tax adjustments related to acquisitions completed before its effective date. In December 2008, the FASB issued additional guidance under ASC Topic 715 to require additional disclosures about assets held in an employer’s defined benefit pension or other postretirement plan. This replaces the requirement to disclose the percentage of the fair value of total plan assets for each major category of plan assets, such as equity securities, debt securities, real estate and all other assets, with the fair value of each major asset category as of each annual reporting date for which a financial statement is presented. It also requires disclosure of the level within the fair value hierarchy in which each major category of plan assets falls, using the guidance in ASC Topic 820. This requirement is applicable for fiscal years ending after December 15, 2009. The Company will comply with these disclosure provisions after its effective date. The Company does not expect the adoption of this requirement to have a material impact on its consolidated financial position, results of operations or cash flows.

F-49
COLUMBUS McKINNON CORPORATION
SCHEDULE II—Valuation and qualifying accounts
March 31, 2010, 2009 and 2008 Dollars in thousands
Additions
Description
Balance at Beginning of Period
Charged to Costs and Expenses
Charged to Other Accounts
Deductions
Balance at End of Period
Year ended March 31, 2010: Deducted from asset accounts: Allowance for doubtful accounts $ 5,338 $ 553 $ — $ 1,651 (1) $ 4,240 Slow-moving and obsolete inventory 8,624 1,548 — 1,799 (2) 8,373 Deferred tax asset valuation allowance 1,594 — 15 — 1,609 Total $ 15,556 $ 2,101 $ 15 $ 3,450 $ 14,222 Reserves on balance sheet: Accrued general and product liability costs $ 23,242 $ 5,061 $ — $ 5,249 (3) $ 23,054 Year ended March 31, 2009: Deducted from asset accounts: Allowance for doubtful accounts $ 3,583 $ 2,447 $ 370 (4) $ 1,062 (1) $ 5,338 Slow-moving and obsolete inventory 8,735 535 644 (4) 1,290 (2) 8,624 Deferred tax asset valuation allowance 1,064 — 530 (4) — 1,594 Total $ 13,382 $ 2,982 $ 1,544 $ 2,352 $ 15,556 Reserves on balance sheet: Accrued general and product liability costs $ 20,771 $ 4,052 $ — $ 1,581 (3) $ 23,242 Year ended March 31, 2008: Deducted from asset accounts: Allowance for doubtful accounts $ 3,515 $ 921 $ — $ 853 (1) $ 3,583 Slow-moving and obsolete inventory 8,843 1,549 — 1,657 (2) 8,735 Deferred tax asset valuation allowance 2,064 — — 1,000 1,064 Total $ 14,422 $ 2,470 $ — $ 3,510 $ 13,382 Reserves on balance sheet: Accrued general and product liability costs $ 21,078 $ 2,201 $ — $ 2,508 (3) $ 20,771 ________ (1) Uncollectible accounts written off, net of recoveries (2) Obsolete inventory disposals (3) Insurance claims and expenses paid (4) Reserves at date of acquisition of subsidiary

32
Item 9. Changes in and Disagreements with Accountants on Accounting and Financial Disclosures None. Item 9A. Controls and Procedures Management’s Evaluation of Disclosure Controls and Procedures As of March 31, 2010, an evaluation was performed under the supervision and with the participation of our management, including the Chief Executive Officer and Chief Financial Officer, of the effectiveness of the design and operation of our disclosure controls and procedures. Based on that evaluation, our management, including the Chief Executive Officer and Chief Financial Officer, concluded that our disclosure controls and procedures were effective as of March 31, 2010. There were no changes in our internal controls or in other factors during our fourth quarter ended March 31, 2010. Management’s Report on Internal Control Over Financial Reporting
Our management is responsible for establishing and maintaining adequate internal control over financial reporting, as such term is defined in Exchange Act Rules 13a-15(f) and 15d-15(f). Under the supervision and with the participation of our management, including our Chief Executive Officer and Chief Financial Officer, we conducted an evaluation of the effectiveness of our internal control over financial reporting as of March 31, 2010 based on the framework in Internal Control--Integrated Framework issued by the Committee of Sponsoring Organizations of the Treadway Commission (COSO). Based on that evaluation, our management concluded that our internal control over financial reporting was effective as of March 31, 2010.
The effectiveness of the Company’s internal control over financial reporting as of March 31, 2010 has been audited by
Ernst & Young LLP, an independent registered public accounting firm, as stated in their report which is included herein. Our management, including the CEO and CFO, does not expect that our disclosure controls or our internal control over
financial reporting will prevent or detect all error and all fraud. A control system, no matter how well designed and operated, can provide only reasonable, not absolute, assurance that the control system’s objectives will be met. The design of a control system must reflect the fact that there are resource constraints, and the benefits of controls must be considered relative to their costs. Further, because of the inherent limitations in all control systems, no evaluation of controls can provide absolute assurance that misstatements due to error or fraud will not occur or that all control issues and instances of fraud, if any, have been detected. These inherent limitations include the realities that judgments in decision-making can be faulty and that breakdowns can occur because of simple error or mistake. Controls can also be circumvented by the individual acts of some persons, by collusion of two or more people, or by management override of the controls. The design of any system of controls is based in part on certain assumptions about the likelihood of future events, and there can be no assurance that any design will succeed in achieving its stated goals under all potential future conditions. Projections of any evaluation of controls effectiveness to future periods are subject to risks. Over time, controls may become inadequate because of changes in conditions or deterioration in the degree of compliance with policies or procedures.
Changes in Internal Control over Financial Reporting
There have been no changes in internal control over financial reporting during the most recent fiscal quarter that have materially affected, or are reasonably likely to materially affect, our internal control over financial reporting.

33
Report of Ernst & Young LLP, Independent Registered Public Accounting Firm The Board of Directors and Shareholders of Columbus McKinnon Corporation We have audited Columbus McKinnon Corporation’s internal control over financial reporting as of March 31, 2010, based on criteria established in Internal Control—Integrated Framework issued by the Committee of Sponsoring Organizations of the Treadway Commission (the COSO criteria). Columbus McKinnon Corporation’s management is responsible for maintaining effective internal control over financial reporting, and for its assessment of the effectiveness of internal control over financial reporting included in the accompanying Management’s Report on Internal Control Over Financial Reporting. Our responsibility is to express an opinion on the company’s internal control over financial reporting based on our audit. We conducted our audit in accordance with the standards of the Public Company Accounting Oversight Board (United States). Those standards require that we plan and perform the audit to obtain reasonable assurance about whether effective internal control over financial reporting was maintained in all material respects. Our audit included obtaining an understanding of internal control over financial reporting, assessing the risk that a material weakness exists, testing and evaluating the design and operating effectiveness of internal control based on the assessed risk, and performing such other procedures as we considered necessary in the circumstances. We believe that our audit provides a reasonable basis for our opinion. A company’s internal control over financial reporting is a process designed to provide reasonable assurance regarding the reliability of financial reporting and the preparation of financial statements for external purposes in accordance with generally accepted accounting principles. A company’s internal control over financial reporting includes those policies and procedures that (1) pertain to the maintenance of records that, in reasonable detail, accurately and fairly reflect the transactions and dispositions of the assets of the company; (2) provide reasonable assurance that transactions are recorded as necessary to permit preparation of financial statements in accordance with generally accepted accounting principles, and that receipts and expenditures of the company are being made only in accordance with authorizations of management and directors of the company; and (3) provide reasonable assurance regarding prevention or timely detection of unauthorized acquisition, use or disposition of the company’s assets that could have a material effect on the financial statements. Because of its inherent limitations, internal control over financial reporting may not prevent or detect misstatements. Also, projections of any evaluation of effectiveness to future periods are subject to the risk that controls may become inadequate because of changes in conditions or that the degree of compliance with the policies or procedures may deteriorate. In our opinion, Columbus McKinnon Corporation maintained, in all material respects, effective internal control over financial reporting as of March 31, 2010, based on the COSO criteria. We have also audited, in accordance with the standards of the Public Company Accounting Oversight Board (United States), the consolidated balance sheets of Columbus McKinnon Corporation as of March 31, 2010 and 2009, and the related consolidated statements of operations, shareholders’ equity, and cash flows for each of the three years in the period ended March 31, 2010 of Columbus McKinnon Corporation and our report dated May 28, 2010 expressed an unqualified opinion thereon. /s/ Ernst & Young LLP Buffalo, New York May 28, 2010 Item 9B. Other Information None.

34
PART III Item 10. Directors and Executive Officers of the Registrant The information regarding Directors and Executive Officers of the Registrant will be included in a Proxy Statement to be filed with the Commission prior to July 29, 2010 and upon the filing of such Proxy Statement, is incorporated by reference herein.
The charters of our Audit Committee, Compensation and Succession Committee, and Governance and Nomination Committee are available on our website at www.cmworks.com and are available to any shareholder upon request to the Corporate Secretary. The information on the Company's website is not incorporated by reference into this Annual Report on Form 10-K.
We have adopted a code of ethics that applies to all of our employees, including our principal executive officer, principal financial officer and principal accounting officer, as well as our directors. Our code of ethics, the Columbus McKinnon Corporation Legal Compliance & Business Ethics Manual, is available on our website at www.cmworks.com. We intend to disclose any amendment to, or waiver from, the code of ethics that applies to our principal executive officer, principal financial officer or principal accounting officer otherwise required to be disclosed under Item 10 of Form 8-K by posting such amendment or waiver, as applicable, on our website. Item 11. Executive Compensation The information regarding Executive Compensation will be included in a Proxy Statement to be filed with the Commission prior to July 29, 2010 and upon the filing of such Proxy Statement, is incorporated by reference herein. Item 12. Security Ownership of Certain Beneficial Owners and Management The information regarding Security Ownership of Certain Beneficial Owners and Management and regarding equity compensation plan incorporation will be included in a Proxy Statement to be filed with the Commission prior to July 29, 2010 and upon the filing of such Proxy Statement, is incorporated by reference herein. Item 13. Certain Relationships and Related Transactions The information regarding Certain Relationships and Related Transactions will be included in a Proxy Statement to be filed with the Commission prior to July 29, 2010 and upon the filing of such Proxy Statement, is incorporated by reference herein. Item 14. Principal Accountant Fees and Services The information regarding Principal Accountant Fees and Services will be included in a Proxy Statement to be filed with the Commission prior to July 29, 2010 and upon the filing of such Proxy Statement, is incorporated by reference herein.

35
PART IV Item 15. Exhibits and Financial Statement Schedules (1) Financial Statements: The following consolidated financial statements of Columbus McKinnon Corporation are included in Item 8:
Reference Page No.
Report of Ernst & Young LLP, Independent Registered Public Accounting Firm F-2
Consolidated balance sheets - March 31, 2010 and 2009 F-3
Consolidated statements of operations – Years ended March 31, 2010, 2009, and 2008 F-4
Consolidated statements of shareholders’ equity – Years ended March 31, 2010, 2009, and 2008 F-5
Consolidated statements of cash flows – Years ended March 31, 2010, 2009 , and 2008 F-6
Notes to consolidated financial statements F-7 to F-48
(2) Financial Statement Schedule: Page No. Schedule II - Valuation and qualifying accounts F-49
All other schedules for which provision is made in the applicable accounting regulation of the Securities and Exchange Commission are not required under the related instructions or are inapplicable and therefore have been omitted.
(3) Exhibits:
Exhibit Number
Exhibit
3.1 Restated Certificate of Incorporation of the Registrant (incorporated by reference to Exhibit 3.1 to the
Company’s Registration Statement No. 33-80687 on Form S-1 dated December 21, 1995).
3.2 Amended By-Laws of the Registrant (incorporated by reference to Exhibit 3. to the Company’s Current Report on Form 8-K dated May 17, 1999).
3.3 Certificate of Amendment to the Certificate of Incorporation of Columbus McKinnon Corporation, dated as of May 18, 2009 (incorporated by reference to Exhibit 3.1 to the Company’s Current Report on Form 8-K dated May 18, 2009).
4.1 Specimen common share certificate (incorporated by reference to Exhibit 4.1 to the Company’s Registration Statement No. 33-80687 on Form S-1 dated December 21, 1995.)
4.2 Indenture among Columbus McKinnon Corporation, Audubon Europe S.a.r.l., Crane Equipment & Service, Inc., Yale Industrial Products, Inc. and U.S. Bank National Association., as trustee, dated as of September 2, 2005 (incorporated by reference to Exhibit 4.5 to the Company’s Registration Statement No. 33-129142 on Form S-3 dated October 19, 2005).
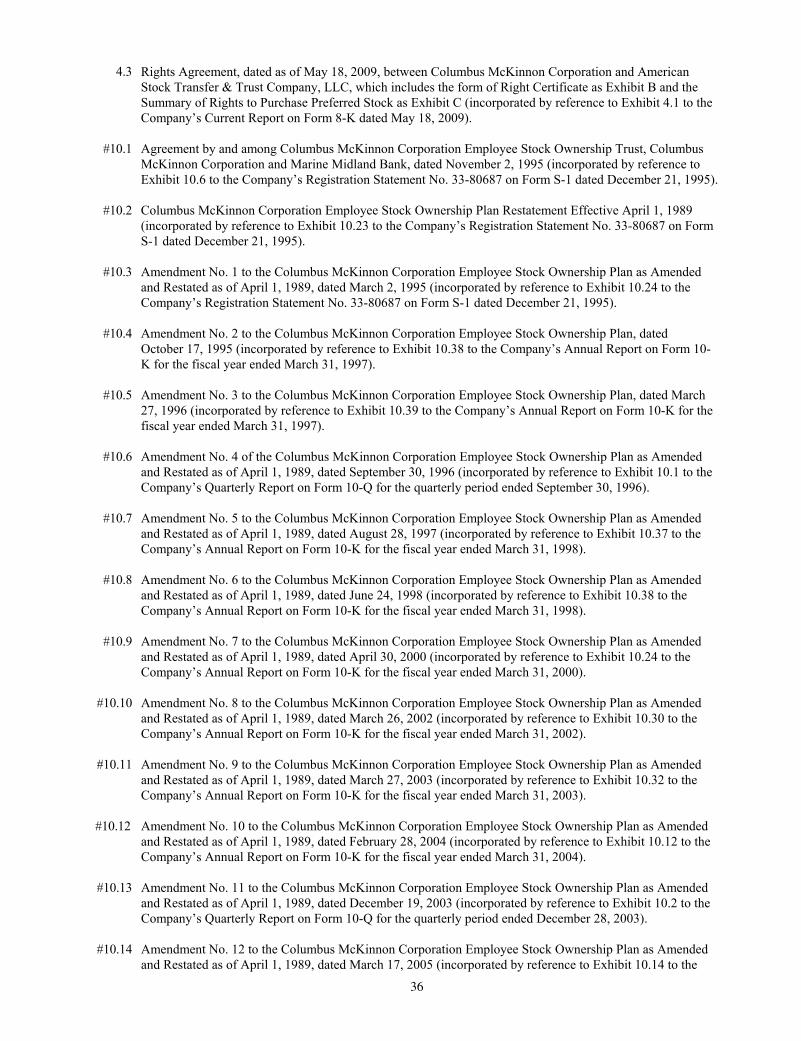
36
4.3 Rights Agreement, dated as of May 18, 2009, between Columbus McKinnon Corporation and American Stock Transfer & Trust Company, LLC, which includes the form of Right Certificate as Exhibit B and the Summary of Rights to Purchase Preferred Stock as Exhibit C (incorporated by reference to Exhibit 4.1 to the Company’s Current Report on Form 8-K dated May 18, 2009).
#10.1 Agreement by and among Columbus McKinnon Corporation Employee Stock Ownership Trust, Columbus McKinnon Corporation and Marine Midland Bank, dated November 2, 1995 (incorporated by reference to Exhibit 10.6 to the Company’s Registration Statement No. 33-80687 on Form S-1 dated December 21, 1995).
#10.2 Columbus McKinnon Corporation Employee Stock Ownership Plan Restatement Effective April 1, 1989 (incorporated by reference to Exhibit 10.23 to the Company’s Registration Statement No. 33-80687 on Form S-1 dated December 21, 1995).
#10.3 Amendment No. 1 to the Columbus McKinnon Corporation Employee Stock Ownership Plan as Amended and Restated as of April 1, 1989, dated March 2, 1995 (incorporated by reference to Exhibit 10.24 to the Company’s Registration Statement No. 33-80687 on Form S-1 dated December 21, 1995).
#10.4 Amendment No. 2 to the Columbus McKinnon Corporation Employee Stock Ownership Plan, dated October 17, 1995 (incorporated by reference to Exhibit 10.38 to the Company’s Annual Report on Form 10-K for the fiscal year ended March 31, 1997).
#10.5 Amendment No. 3 to the Columbus McKinnon Corporation Employee Stock Ownership Plan, dated March 27, 1996 (incorporated by reference to Exhibit 10.39 to the Company’s Annual Report on Form 10-K for the fiscal year ended March 31, 1997).
#10.6 Amendment No. 4 of the Columbus McKinnon Corporation Employee Stock Ownership Plan as Amended and Restated as of April 1, 1989, dated September 30, 1996 (incorporated by reference to Exhibit 10.1 to the Company’s Quarterly Report on Form 10-Q for the quarterly period ended September 30, 1996).
#10.7 Amendment No. 5 to the Columbus McKinnon Corporation Employee Stock Ownership Plan as Amended and Restated as of April 1, 1989, dated August 28, 1997 (incorporated by reference to Exhibit 10.37 to the Company’s Annual Report on Form 10-K for the fiscal year ended March 31, 1998).
#10.8 Amendment No. 6 to the Columbus McKinnon Corporation Employee Stock Ownership Plan as Amended and Restated as of April 1, 1989, dated June 24, 1998 (incorporated by reference to Exhibit 10.38 to the Company’s Annual Report on Form 10-K for the fiscal year ended March 31, 1998).
#10.9 Amendment No. 7 to the Columbus McKinnon Corporation Employee Stock Ownership Plan as Amended and Restated as of April 1, 1989, dated April 30, 2000 (incorporated by reference to Exhibit 10.24 to the Company’s Annual Report on Form 10-K for the fiscal year ended March 31, 2000).
#10.10 Amendment No. 8 to the Columbus McKinnon Corporation Employee Stock Ownership Plan as Amended and Restated as of April 1, 1989, dated March 26, 2002 (incorporated by reference to Exhibit 10.30 to the Company’s Annual Report on Form 10-K for the fiscal year ended March 31, 2002).
#10.11 Amendment No. 9 to the Columbus McKinnon Corporation Employee Stock Ownership Plan as Amended and Restated as of April 1, 1989, dated March 27, 2003 (incorporated by reference to Exhibit 10.32 to the Company’s Annual Report on Form 10-K for the fiscal year ended March 31, 2003).
#10.12 Amendment No. 10 to the Columbus McKinnon Corporation Employee Stock Ownership Plan as Amended and Restated as of April 1, 1989, dated February 28, 2004 (incorporated by reference to Exhibit 10.12 to the Company’s Annual Report on Form 10-K for the fiscal year ended March 31, 2004).
#10.13 Amendment No. 11 to the Columbus McKinnon Corporation Employee Stock Ownership Plan as Amended and Restated as of April 1, 1989, dated December 19, 2003 (incorporated by reference to Exhibit 10.2 to the Company’s Quarterly Report on Form 10-Q for the quarterly period ended December 28, 2003).
#10.14 Amendment No. 12 to the Columbus McKinnon Corporation Employee Stock Ownership Plan as Amended and Restated as of April 1, 1989, dated March 17, 2005 (incorporated by reference to Exhibit 10.14 to the

37
Company’s Annual Report on Form 10-K for the fiscal year ended March 31, 2005).
#10.15 Amendment No. 13 to the Columbus McKinnon Corporation Employee Stock Ownership Plan as Amended and Restated as of April 1, 1989, dated December 19, 2008 (incorporated by reference to Exhibit 10.1 to the Company’s Quarterly Report on Form 10-Q for the quarterly period ended December 28, 2008).
#10.16 Columbus McKinnon Corporation Personal Retirement Account Plan Trust Agreement, dated April 1, 1987 (incorporated by reference to Exhibit 10.25 to the Company’s Registration Statement No. 33-80687 on Form S-1 dated December 21, 1995).
#10.17 Amendment No. 1 to the Columbus McKinnon Corporation Employee Stock Ownership Trust Agreement (formerly known as the Columbus McKinnon Corporation Personal Retirement Account Plan Trust Agreement) effective November 1, 1988 (incorporated by reference to Exhibit 10.26 to the Company’s Registration Statement No. 33-80687 on Form S-1 dated December 21, 1995).
#10.18 Amendment and Restatement of Columbus McKinnon Corporation 1995 Incentive Stock Option Plan (incorporated by reference to Exhibit 10.25 to the Company’s Annual Report on Form 10-K for the fiscal year ended March 31, 1999).
#10.19 Second Amendment to the Columbus McKinnon Corporation 1995 Incentive Stock Option Plan, as amended and restated (incorporated by reference to Exhibit 10.2 to the Company’s Quarterly Report on Form 10-Q for the quarterly period ended September 29, 2002).
#10.20 Columbus McKinnon Corporation Restricted Stock Plan, as amended and restated (incorporated by reference to Exhibit 10.28 to the Company’s Registration Statement No. 33-80687 on Form S-1 dated December 21, 1995).
#10.21 Second Amendment to the Columbus McKinnon Corporation Restricted Stock Plan (incorporated by reference to Exhibit 10.3 to the Company’s Quarterly Report on Form 10-Q for the quarterly period ended September 29, 2002).
#10.22 Amendment and Restatement of Columbus McKinnon Corporation Non-Qualified Stock Option Plan (incorporated by reference to Exhibit 10.27 to the Company’s Annual Report on Form 10-K for the fiscal year ended March 31, 1999).
#10.23 Columbus McKinnon Corporation Thrift [401(k)] Plan 1989 Restatement Effective January 1, 1998 (incorporated by reference to Exhibit 10.2 to the Company’s Quarterly Report on Form 10-Q for the quarterly period ended December 27, 1998).
#10.24 Amendment No. 1 to the 1998 Plan Restatement of the Columbus McKinnon Corporation Thrift [401(k)] Plan, dated December 10, 1998 (incorporated by reference to Exhibit 10.29 to the Company’s Annual Report on Form 10-K for the fiscal year ended March 31, 1999).
#10.25 Amendment No. 2 to the 1998 Plan Restatement of the Columbus McKinnon Corporation Thrift [401 (k)] Plan, dated June 1, 2000 (incorporated by reference to Exhibit 10.33 to the Company’s Annual Report on Form 10-K for the fiscal year ended March 31, 2000).
#10.26 Amendment No. 3 to the 1998 Plan Restatement of the Columbus McKinnon Corporation Thrift [401 (k)] Plan, dated March 26, 2002 (incorporated by reference to Exhibit 10.39 to the Company’s Annual Report on Form 10-K for the fiscal year ended March 31, 2002).
#10.27 Amendment No. 4 to the 1998 Plan Restatement of the Columbus McKinnon Corporation Thrift [401(k)] Plan, dated May 10, 2002 (incorporated by reference to Exhibit 10.4 to the Company’s Quarterly Report on Form 10-Q for the quarterly period ended September 29, 2002).
#10.28 Amendment No. 5 to the 1998 Plan Restatement of the Columbus McKinnon Corporation Thrift [401(k)] Plan, dated December 20, 2002 (incorporated by reference to Exhibit 10.1 to the Company’s Quarterly Report on Form 10-Q for the quarterly period ended December 29, 2002).

38
#10.29 Amendment No. 6 to the 1998 Plan Restatement of the Columbus McKinnon Corporation Thrift [401(k)] Plan, dated May 22, 2003 (incorporated by reference to Exhibit 10.46 to the Company’s Annual Report on Form 10-K for the fiscal year ended March 31, 2003).
#10.30 Amendment No. 7 to the 1998 Plan Restatement of the Columbus McKinnon Corporation Thrift [401(k)] Plan, dated April 14, 2004 (incorporated by reference to Exhibit 10.28 to the Company’s Annual Report on Form 10-K for the fiscal year ended March 31, 2004).
#10.31 Amendment No. 8 to the 1998 Plan Restatement of the Columbus McKinnon Corporation Thrift [401(k)] Plan, dated December 19, 2003 (incorporated by reference to Exhibit 10.3 to the Company’s Quarterly Report on Form 10-Q for the quarterly period ended December 28, 2003).
#10.32 Amendment No. 9 to the 1998 Plan Restatement of the Columbus McKinnon Corporation Thrift [401(k)] Plan, dated March 16, 2004 (incorporated by reference to Exhibit 10.30 to the Company’s Annual Report on Form 10-K for the fiscal year ended March 31, 2004).
#10.33 Amendment No. 10 to the 1998 Plan Restatement of the Columbus McKinnon Corporation Thrift [401(k)] Plan, dated July 12, 2004 (incorporated by reference to Exhibit 10.3 to the Company’s Quarterly Report on Form 10-Q for the quarterly period ended July 4, 2004).
#10.34 Amendment No. 11 to the 1998 Plan Restatement of the Columbus McKinnon Corporation Thrift [401(k)] Plan, dated March 31, 2005 (incorporated by reference to Exhibit 10.33 to the Company’s Annual Report on Form 10-K for the fiscal year ended March 31, 2005).
#10.35 Amendment No. 12 to the 1998 Plan Restatement of the Columbus McKinnon Corporation Thrift [401(k)] Plan, dated December 27, 2005 (incorporated by reference to Exhibit 10.34 to the Company’s Annual Report on Form 10-K for the fiscal year ended March 31, 2006).
#10.36 Amendment No. 13 to the 1998 Plan Restatement of the Columbus McKinnon Corporation Thrift [401(k)] Plan, dated December 21, 2006 (incorporated by reference to Exhibit 10.35 to the Company’s Annual Report on Form 10-K for the fiscal year ended March, 31, 2007).
#10.37 Amendment No. 14 to the 1998 Plan Restatement of the Columbus McKinnon Corporation Thrift [401(k)] Plan, dated December 21, 2007 (incorporated by reference to Exhibit 10.36 to the Company’s Annual Report on Form 10-K for the fiscal year ended March 31, 2008).
#10.38 Amendment No. 15 to the 1998 Plan Restatement of the Columbus McKinnon Corporation Thrift [401(k)] Plan, dated January 29, 2009 (incorporated by reference to Exhibit 10.4 to the Company’s Quarterly Report on Form 10-Q for the quarterly period ended December 28, 2008).
#10.39 Columbus McKinnon Corporation Thrift 401(k) Plan Trust Agreement Restatement Effective August 9, 1994 (incorporated by reference to Exhibit 10.32 to the Company’s Registration Statement No. 33-80687 on Form S-1 dated December 21, 1995).
#10.40 Columbus McKinnon Corporation Monthly Retirement Benefit Plan Restatement Effective April 1, 1998 (incorporated by reference to Exhibit 10.1 to the Company’s Quarterly Report on Form 10-Q for the quarterly period ended December 27, 1998).
#10.41 Amendment No. 1 to the 1998 Plan Restatement of the Columbus McKinnon Corporation Monthly Retirement Benefit Plan, dated December 10, 1998 (incorporated by reference to Exhibit 10.32 to the Company’s Annual Report on Form 10-K for the fiscal year ended March 31, 1999).
#10.42 Amendment No. 2 to the 1998 Plan Restatement of the Columbus McKinnon Corporation Monthly Retirement Benefit Plan, dated May 26, 1999 (incorporated by reference to Exhibit 10.33 to the Company’s Annual Report on Form 10-K for the fiscal year ended March 31, 1999).
#10.43 Amendment No. 3 to the 1998 Plan Restatement of the Columbus McKinnon Corporation Monthly Retirement Benefit Plan, dated March 26, 2002 (incorporated by reference to Exhibit 10.44 to the Company’s Annual Report on Form 10-K for the fiscal year ended March 31, 2002).

39
#10.44 Amendment No. 4 to the 1998 Plan Restatement of the Columbus McKinnon Corporation Monthly
Retirement Benefit Plan, dated December 20, 2002 (incorporated by reference to Exhibit 10.1 to the Company’s Quarterly Report on Form 10-Q for the quarterly period ended December 29, 2002).
#10.45 Amendment No. 5 to the 1998 Plan Restatement of the Columbus McKinnon Corporation Monthly Retirement Benefit Plan, dated February 28, 2004 (incorporated by reference to Exhibit 10.37 to the Company’s Annual Report on Form 10-K for the fiscal year ended March 31, 2004).
#10.46 Amendment No. 6 to the 1998 Plan Restatement of the Columbus McKinnon Corporation Monthly Retirement Benefit Plan, dated March 17, 2005 (incorporated by reference to Exhibit 10.41 to the Company’s Annual Report on Form 10-K for the fiscal year ended March 31, 2005).
#10.47 Amendment No. 7 to the 1998 Plan Restatement of the Columbus McKinnon Corporation Monthly Retirement Benefit Plan, dated December 28, 2005 (incorporated by reference to Exhibit 10.43 to the Company’s Annual Report on Form 10-K for the fiscal year ended March 31, 2006).
#10.48 Amendment No. 8 to the 1998 Plan Restatement of the Columbus McKinnon Corporation Monthly Retirement Benefit Plan, dated December 28, 2005 (incorporated by reference to Exhibit 10.1 to the Company’s Quarterly Report on Form 10-Q for the quarterly period ended December 31, 2006).
#10.49 Amendment No. 9 to the 1998 Plan Restatement of the Columbus McKinnon Corporation Monthly Retirement Benefit Plan, dated April 21, 2008 (incorporated by reference to Exhibit 10.47 to the Company’s Annual Report on Form 10-K for the fiscal year ended March 31, 2008).
#10.50 Amendment No. 10 to the 1998 Plan Restatement of the Columbus McKinnon Corporation Monthly Retirement Benefit Plan, dated December 19, 2008 (incorporated by reference to Exhibit 10.2 to the Company’s Quarterly Report on Form 10-Q for the quarterly period ended December 28, 2008).
#10.51 Columbus McKinnon Corporation Monthly Retirement Benefit Plan Trust Agreement Effective as of April 1, 1987 (incorporated by reference to Exhibit 10.34 to the Company’s Registration Statement No. 33-80687 on Form S-1 dated December 21, 1995).
#10.52 Employment agreement with Wolfgang Wegener dated December 31, 1996 (incorporated by reference to Exhibit 10.48 to the Company’s Annual Report on Form 10-K for the fiscal year ended March, 31, 2007).
10.53 Intercreditor Agreement dated as of July 22, 2003 among Columbus McKinnon Corporation, the subsidiary guarantors as listed thereon, Fleet Capital Corporation, as Credit Agent, and U.S. Bank Trust National Association, as Trustee (incorporated by reference to Exhibit 10.1 to the Company’s Quarterly Report on Form 10-Q for the quarterly period ended June 29, 2003).
10.54 Second Amended and Restated Credit and Security Agreement, dated as of November 21, 2002 and amended and restated as of January 2, 2004, among Columbus McKinnon Corporation, as Borrower, Larco Industrial Services Ltd., Columbus McKinnon Limited, the Guarantors Named Herein, the Lenders Party Hereto From Time to Time, Fleet Capital Corporation, as Administrative Agent, Fleet National Bank, as Issuing Lender, Congress Financial Corporation (Central), Syndication Agent, Merrill Lynch Capital, a Division of Merrill Lynch Business Financial Services Inc., as Documentation Agent, and Fleet Securities, Inc., as Arranger (incorporated by reference to Exhibit 10.1 to the Company’s Quarterly Report on Form 10-Q for the quarterly period ended December 28, 2003).
#10.55 Columbus McKinnon Corporation 2006 Long Term Incentive Plan (incorporated by reference to Appendix A to the definitive Proxy Statement for the Annual Meeting of Stockholders of Columbus McKinnon Corporation held on July 31, 2006).
#10.56 Amendment No. 1 to the Columbus McKinnon Corporation 2006 Long Term Incentive Plan, dated December 30, 2008 (incorporated by reference to Exhibit 10.3 to the Company’s Quarterly Report on Form 10-Q for the quarterly period ended December 28, 2008).
#10.57 Columbus McKinnon Corporation Executive Management Variable Compensation Plan (incorporated by

40
reference to Appendix B to the definitive Proxy Statement for the Annual Meeting of Stockholders of Columbus McKinnon Corporation held on July 31, 2006).
10.58 First Amendment to that certain Second Amended and Restated Credit and Security Agreement, dated as of November 21, 2002 and amended and restated as of January 2, 2004, among Columbus McKinnon Corporation, as Borrower, Larco Industrial Services Ltd., Columbus McKinnon Limited, the Guarantors From Time to Time Party Thereto, the Lenders From Time to Time Party Thereto, Bank of America, N.A. as Administrative Agent for such Lenders and as Issuing Lender dated April 29, 2005 (incorporated by reference to Exhibit 10.1 to the Company’s Current Report on Form 8-K dated April 29, 2005).
10.59 Second amendment, dated as of August 5, 2005, to that certain Second Amended and Restated Credit and Security Agreement, dated as of November 21, 2002 and amended and restated as of January 2, 2004 (as amended by that certain First Amendment to that certain Second Amended and Restated Credit and Security Agreement, dated as of April 29, 2005, and as further modified and supplemented and in effect from time to time, the “Credit Agreement”), among Columbus McKinnon Corporation, a corporation organized under the laws of New York (the “Borrower”), Larco Industrial Services Ltd., a business corporation organized under the laws of the Province of Ontario, Columbus McKinnon Limited, a business corporation organized under the laws of Canada, the Guarantors from time to time party thereto, the Lenders from time to time party thereto (collectively, the “Lenders”), Bank of America, N.A., as Administrative Agent for such Lenders (the “Agent”) and as Issuing Lender (incorporated by reference to Exhibit 10.1 to the Company’s Quarterly Report on Form 10-Q dated October 2, 2005).
10.60 Third amendment, dated as of August 22, 2005, to that certain Second Amended and Restated Credit and Security Agreement, dated as of November 21, 2002 and amended and restated as of January 2, 2004 (as amended by that certain First Amendment to that certain Second Amended and Restated Credit and Security Agreement, dated as of April 29, 2005, by that certain Second Amendment to that certain Second Amended and Restated Credit and Security Agreement, dated as of August 5, 2005, and as further modified and supplemented and in effect from time to time, the “Credit Agreement”), among Columbus McKinnon Corporation, a corporation organized under the laws of New York (the “Borrower”), Larco Industrial Services Ltd., a business corporation organized under the laws of the Province of Ontario, Columbus McKinnon Limited, a business corporation organized under the laws of Canada, the Guarantors from time to time party thereto, the Lenders from time to time party thereto (collectively, the “Lenders”), Bank of America, N.A., as Administrative Agent for such Lenders (the “Agent”) and as Issuing Lender (incorporated by reference to Exhibit 10.2 to the Company’s Quarterly Report on Form 10-Q dated October 2, 2005).
10.61 Fourth amendment, dated as of October 17, 2005, to that certain Second Amended and Restated Credit and Security Agreement, dated as of November 21, 2002 and amended and restated as of January 2, 2004, and amended by that certain First Amendment to the Credit Agreement, dated as of April 29, 2005, and by that certain Second Amendment to the Credit Agreement, dated as of August 5, 2005, and by that certain Third Amendment to the Credit Agreement, dated as of August 22, 2005 (as further amended, supplemented or otherwise modified from time to time, the "Credit Agreement"), among Columbus McKinnon Corporation (the "Borrower"), Larco Industrial Services Ltd., Columbus McKinnon Limited, the Guarantors named therein, the lending institutions party thereto, and Bank of America, N.A., as Administrative Agent and Issuing Lender. Capitalized terms used herein and not defined herein shall have the meanings ascribed thereto in the Credit Agreement (incorporated by reference to Exhibit 10.3 to the Company’s Quarterly Report on Form 10-Q dated October 2, 2005).
10.62 Third Amended and Restated Credit and Security Agreement, dated as of March 16, 2006 among Columbus McKinnon Corporation, as the Borrower, Bank of America, N.A., as Administrative Agent and Issuing Lender, and Other Lenders Party Hereto, and Bank of America Securities LLC, as Arranger (incorporated by reference to Exhibit 10.53 to the Company’s Annual Report on Form 10-K for the fiscal year ended March 31, 2007).
10.63 First amendment, dated as of January 8, 2007 to that certain Third Amended and Restated Credit and SecurityAgreement, dated as of March 16, 2006 among Columbus McKinnon Corporation, as the Borrower, Bank of America, N.A., as Administrative Agent and Issuing Lender, and Other Lenders Party Hereto, and Bank of America Securities LLC, as Arranger (incorporated by reference to Exhibit 10.59 to the Company’s Annual Report on Form 10-K for the fiscal year ended March, 31, 2007).

41
*#10.64 Form of Change in Control Agreement as entered into between Columbus McKinnon Corporation and each of Timothy T. Tevens, Karen L. Howard, Joseph J. Owen, Richard A. Steinberg, Timothy R. Harvey, Gene Buer, and Chuck Giesige.
*#10.65 Form of Omnibus Code Section 409A Compliance Policy as entered into between Columbus McKinnon Corporation and each of Timothy T. Tevens, Karen L. Howard, Joseph J. Owen, Richard A. Steinberg, Timothy R. Harvey, Gene Buer, and Chuck Giesige.
*10.66 Second amendment, dated as of May 19, 2009 to that certain Third Amended and Restated Credit Agreement,dated as of March 16, 2006 among Columbus McKinnon Corporation, the Guarantors named therein, the lending institutions party thereto, and Bank of America, N.A., as Administrative Agent, Swing Line Lender and L/C Issuer.
*21.1 Subsidiaries of the Registrant.
*23.1 Consent of Ernst & Young LLP, Independent Registered Public Accounting Firm.
*31.1 Certification of the principal executive officer pursuant to Rule 13a-14(a) of the Securities Exchange Act of 1934, as amended.
*31.2 Certification of the principal financial officer pursuant to Rule 13a-14(a) of the Securities Exchange Act of 1934, as amended.
*32.1 Certification of the principal executive officer and the principal financial officer pursuant to Rule 13a-14(b) of the Securities Exchange Act of 1934, as amended and 18 U.S.C. Section 1350, as adopted by pursuant to Section 906 of the Sarbanes-Oxley Act of 2002. The information contained in this exhibit shall not be deemed filed with the Securities and Exchange Commission nor incorporated by reference in any registration statement foiled by the Registrant under the Securities Act of 1933, as amended.
_________________ * Filed herewith # Indicates a Management contract or compensation plan or arrangement
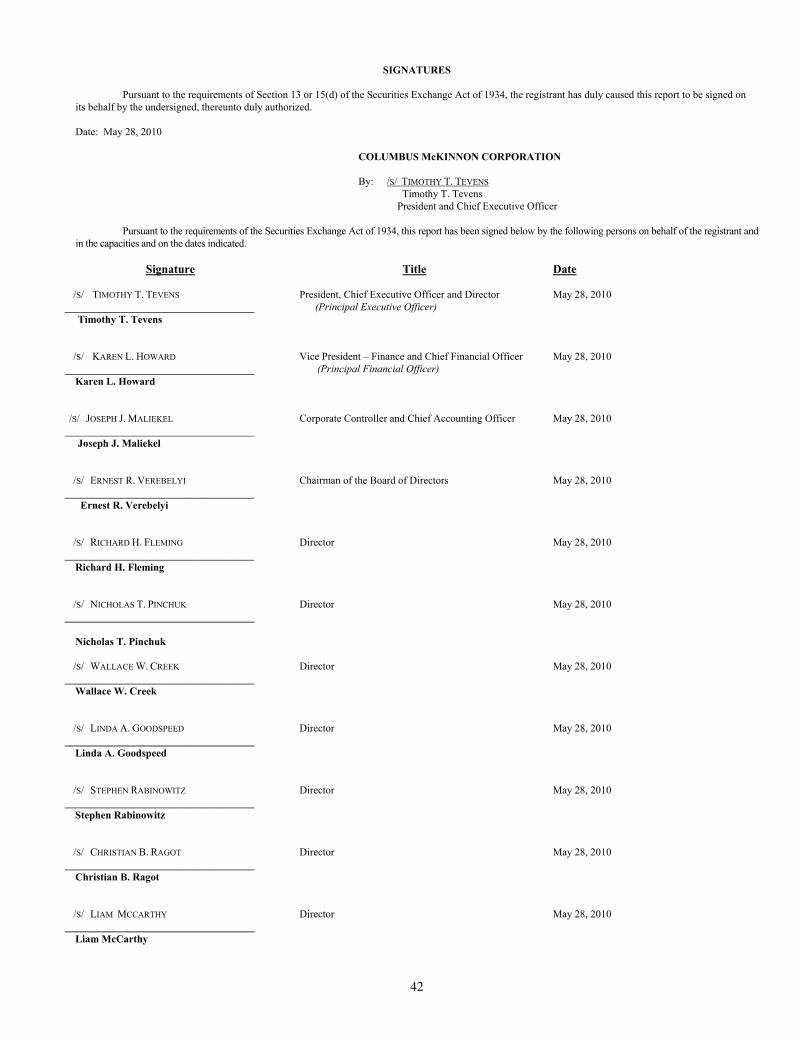
42
SIGNATURES Pursuant to the requirements of Section 13 or 15(d) of the Securities Exchange Act of 1934, the registrant has duly caused this report to be signed on its behalf by the undersigned, thereunto duly authorized. Date: May 28, 2010 COLUMBUS McKINNON CORPORATION By: /S/ TIMOTHY T. TEVENS Timothy T. Tevens President and Chief Executive Officer Pursuant to the requirements of the Securities Exchange Act of 1934, this report has been signed below by the following persons on behalf of the registrant and in the capacities and on the dates indicated.
/S/ NICHOLAS T. PINCHUK ____________________________________ Nicholas T. Pinchuk
Director
May 28, 2010
/S/ WALLACE W. CREEK ____________________________________ Wallace W. Creek
Director
May 28, 2010
/S/ LINDA A. GOODSPEED ____________________________________ Linda A. Goodspeed
Director
May 28, 2010
/S/ STEPHEN RABINOWITZ ____________________________________ Stephen Rabinowitz
Director
May 28, 2010
/S/ CHRISTIAN B. RAGOT ____________________________________ Christian B. Ragot
Director
May 28, 2010
/S/ LIAM MCCARTHY ____________________________________ Liam McCarthy
Director
May 28, 2010
Signature
Title Date
/S/ TIMOTHY T. TEVENS ____________________________________ Timothy T. Tevens
President, Chief Executive Officer and Director (Principal Executive Officer)
May 28, 2010
/S/ KAREN L. HOWARD ____________________________________ Karen L. Howard
Vice President – Finance and Chief Financial Officer (Principal Financial Officer)
May 28, 2010
/S/ JOSEPH J. MALIEKEL ____________________________________ Joseph J. Maliekel
Corporate Controller and Chief Accounting Officer
May 28, 2010
/S/ ERNEST R. VEREBELYI ____________________________________ Ernest R. Verebelyi
Chairman of the Board of Directors
May 28, 2010
/S/ RICHARD H. FLEMING ____________________________________ Richard H. Fleming
Director
May 28, 2010

43
Exhibit 21.1
COLUMBUS McKINNON CORPORATION
SUBSIDIARIES (as of March 31, 2010)
CM Insurance Company, Inc. (US-NY) Columbus McKinnon de Mexico, S.A. de C.V. (Mexico) Columbus McKinnon de Uruguay, S.A. (Uruguay) Columbus McKinnon do Brazil Ltda. (Brazil) Columbus McKinnon de Panama S.A. (Panama) Crane Equipment & Service, Inc. (US-OK) Société d’Exploitation des Raccords Gautier (France) Yale Industrial Products, Inc. (US-DE) Egyptian-American Crane Co. (40% Joint Venture) (Egypt) Audubon Europe S.a.r.l. (Luxembourg)
Columbus McKinnon Limited (Canada) Yale Industrial Products Ltd. (England) Yale Industrial Products GmbH (Germany) Columbus McKinnon Asia Pacific Ltd. (Hong Kong)
Hangzhou LILA Lifting and Lashing Co. Ltd. (China) Columbus McKinnon Hangzhou Industrial Co. Ltd. (China)
Columbus McKinnon Corporation Ltd. (England) Columbus McKinnon France S.a.r.l. (France) Columbus McKinnon Italia S.r.l. (Italy) Yale Elevación Ibérica S.L. (Spain) Yale Industrial Products Asia (Thailand) Co. Ltd. Yale Industrial Products B.V. (The Netherlands) Columbus McKinnon PTY, LTD (South Africa)
Yale Lifting & Mining Products (Pty.) Ltd. (25% Financial Interest) (South Africa) Yale Engineering Products Pty. Ltd. (South Africa) Yale Industrial Products GmbH (Austria) Columbus McKinnon Hungary Kft. (Hungary)
Pfaff Beteiligungs GmbH (Germany) Pfaff Silberblau Hebezeugfabrik GmbH (Germany) Alltec Antriebstechnik GmbH (Germany) Dreier Transportgerate Lager-u. Betriebseinr GmbH (Germany) Pfaff Silberblau Winden & Hebezuege GesmbH (Austria) Pfaff Silberblau Benelux B.V (Netherlands) Pfaff Silberblau Polska SP.z.o.o (Poland) Pfaff Silberblau LTD, UK (England) Pfaff Silberblau Hungaria Csorlok es Emeloszkozok KFT (Hungary) Pfaff Silberblau Hebezeuge und Antriebstechnik AG (Switzerland) Verkehrstechnik Beteiligungs Gmbh (Germany) Verkehrstechnik Gmbh & Co. KG (Germany)
44
Exhibit 23.1
Consent of Ernst & Young LLP, Independent Registered Public Accounting Firm We consent to the incorporation by reference in the following Registration Statements: (1) Registration Statement (Form S-8 No. 333-3212) pertaining to the Columbus McKinnon Corporation 1995 Incentive
Stock Option Plan, the Columbus McKinnon Corporation Non-Qualified Stock Option Plan, the Columbus McKinnon Corporation Restricted Stock Plan and the Columbus McKinnon Corporation Employee Stock Ownership Plan Restatement Effective April 1, 1989 of Columbus McKinnon Corporation,
(2) Registration Statement (Form S-8 No. 333-81719) pertaining to the Options assumed by Columbus McKinnon
Corporation originally granted under the GL International, Inc. 1997 Stock Option Plan and the Larco Industrial Services Ltd. 1997 Stock Option Plan, and
(3) Registration Statement (Form S-8 No. 333-137212) pertaining to the Columbus McKinnon Corporation 2006 Long Term
Incentive Plan of our reports dated May 28, 2010 with respect to the consolidated financial statements and schedule of Columbus McKinnon Corporation, and the effectiveness of internal control over financial reporting of Columbus McKinnon Corporation, included in the Annual Report (Form 10-K) for the year ended March 31, 2010. /s/ Ernst & Young LLP Buffalo, New York May 28, 2010

45
Exhibit 31.1
CERTIFICATION I, Timothy T. Tevens, Chief Executive Officer, certify that: 1. I have reviewed this report on Form 10-K of Columbus McKinnon Corporation; 2. Based on my knowledge, this report does not contain any untrue statement of a material fact or omit to state a material fact
necessary to make the statements made, in light of the circumstances under which such statements were made, not misleading with respect to the period covered by this report;
3. Based on my knowledge, the financial statements, and other financial information included in this report, fairly present in
all material respects the financial condition, results of operations and cash flows of the registrant as of, and for, the periods presented in this report;
4. The registrant’s other certifying officer and I are responsible for establishing and maintaining disclosure controls and
procedures (as defined in Exchange Act Rules 13a-15(e) and 15d-15(e)) and internal control over financial reporting (as defined in Exchange Act Rules 13a-15(f) and 15d-15(f)) for the registrant and have:
a. designed such disclosure controls and procedures, or caused such disclosure controls and procedures to be
designed under our supervision, to ensure that material information relating to the registrant, including its consolidated subsidiaries, is made known to us by others within those entities, particularly during the period in which this report is being prepared;
b. designed such internal control over financial reporting, or caused such internal control over financial reporting to be designed under our supervision, to provide reasonable assurance regarding the reliability of financial reporting and the preparation of financial statements for external purposes in accordance with generally accepted accounting principles;
c. evaluated the effectiveness of the registrant’s disclosure controls and procedures and presented in this report
our conclusions about the effectiveness of the disclosure controls and procedures, as of the end of the period covered by this report based on such evaluation; and
d. disclosed in this report any change in the registrant’s internal control over financial reporting that occurred
during the registrant’s most recent fiscal quarter that has materially affected, or is reasonably likely to materially affect, the registrant’s internal control over financial reporting; and
5. The registrant’s other certifying officer and I have disclosed, based on our most recent evaluation of internal control over
financial reporting, to the registrant’s auditors and the audit committee of registrant’s board of directors (or persons performing the equivalent functions):
a. all significant deficiencies and material weaknesses in the design or operation of internal control over financial
reporting which are reasonably likely to adversely affect the registrant’s ability to record, process, summarize and report financial information; and
b. any fraud, whether or not material, that involves management or other employees who have a significant role in
the registrant’s internal control over financial reporting. Date: May 28, 2010
/S/ TIMOTHY T. TEVENS Timothy T. Tevens
Chief Executive Officer
46
Exhibit 31.2
CERTIFICATION I, Karen L. Howard, Chief Financial Officer, certify that: 1. I have reviewed this report on Form 10-K of Columbus McKinnon Corporation; 2. Based on my knowledge, this report does not contain any untrue statement of a material fact or omit to state a material fact
necessary to make the statements made, in light of the circumstances under which such statements were made, not misleading with respect to the period covered by this report;
3. Based on my knowledge, the financial statements, and other financial information included in this report, fairly present in
all material respects the financial condition, results of operations and cash flows of the registrant as of, and for, the periods presented in this report;
4. The registrant’s other certifying officer and I are responsible for establishing and maintaining disclosure controls and
procedures (as defined in Exchange Act Rules 13a-15(e) and 15d-15(e)) and internal control over financial reporting (as defined in Exchange Act Rules 13a-15(f) and 15d-15(f)) for the registrant and have:
a. designed such disclosure controls and procedures, or caused such disclosure controls and procedures to be
designed under our supervision, to ensure that material information relating to the registrant, including its consolidated subsidiaries, is made known to us by others within those entities, particularly during the period in which this report is being prepared;
b. designed such internal control over financial reporting, or caused such internal control over financial reporting to be designed under our supervision, to provide reasonable assurance regarding the reliability of financial reporting and the preparation of financial statements for external purposes in accordance with generally accepted accounting principles;
c. evaluated the effectiveness of the registrant’s disclosure controls and procedures and presented in this report
our conclusions about the effectiveness of the disclosure controls and procedures, as of the end of the period covered by this report based on such evaluation; and
d. disclosed in this report any change in the registrant’s internal control over financial reporting that occurred
during the registrant’s most recent fiscal quarter that has materially affected, or is reasonably likely to materially affect, the registrant’s internal control over financial reporting; and
5. The registrant’s other certifying officer and I have disclosed, based on our most recent evaluation of internal control over
financial reporting, to the registrant’s auditors and the audit committee of registrant’s board of directors (or persons performing the equivalent functions):
a. all significant deficiencies and material weaknesses in the design or operation of internal control over financial
reporting which are reasonably likely to adversely affect the registrant’s ability to record, process, summarize and report financial information; and
b. any fraud, whether or not material, that involves management or other employees who have a significant role in
the registrant’s internal control over financial reporting.
Date: May 28, 2010
/S/ KAREN L. HOWARD
Karen L. Howard Chief Financial Officer

47
Exhibit 32.1
CERTIFICATION Each of the undersigned hereby certifies, pursuant to 18 U.S.C. Section 1350, as adopted pursuant to Section 906 of the Sarbanes-Oxley Act of 2002, that the Annual Report of Columbus McKinnon Corporation (the "Company") on Form 10-K for the year ended March 31, 2010, fully complies with the requirements of Section 13(a) or 15(d) of the Securities Exchange Act of 1934 and that information contained in the such Annual Report on Form 10-K fairly presents, in all material respects, the financial condition and result of operations of the Company. A signed original of this written statement required by Section 906 has been provided to the Company and will be retained by the Company and furnished to the Securities and Exchange Commission or its staff upon request. Dated: May 28, 2010
/S/ TIMOTHY T. TEVENS Timothy T. Tevens Chief Executive Officer
/S/ KAREN L. HOWARD Karen L. Howard Chief Financial Officer

This page intentionally left blank.

Executive Committee
Timothy T. TevensPresident and Chief Executive OfficerMr. Tevens was elected President, Chief Executive Officer and a Director of the Company in May 1998. Mr. Tevens joined the Company in May 1991 as Vice President - Information Services and was elected Chief Operating Officer of the Company in October 1996. Prior to joining the Company, Mr. Tevens was a management consultant with Ernst & Young LLP. Mr. Tevens is also a director of Zep, Inc. (NYSE: ZEP).
Karen L. HowardVice President – Finance and Chief Financial OfficerMs. Howard was elected CFO in 2006, having served Columbus McKinnon as interim CFO, Treasurer, and Controller, as well as other financial and accounting capacities since joining the Company in 1995. Previously she was a certified public accountant with Ernst & Young LLP.
Ivo CeliManaging Director – Columbus McKinnon EMEA (Europe, Middle East & Africa)Dr. Celi joined the Company in January 2010. Prior to joining the Company, Dr. Celi served 13 years as Senior Vice President – Business Unit Diamond Systems with Hilti AG, one of the world’s leading manufacturers of power tools for the professional construction and building maintenance markets.
Gene P. BuerVice President – Hoist Products, the AmericasBefore the transition from Executive Director to Vice President of Hoist Products, the Americas in 2009, Mr. Buer was the President of Columbus McKinnon’s Crane Equipment and Services, Inc. subsidiary and served in other executive capacities. Prior to joining the Company in 2005, Mr. Buer held senior executive and sales management positions with several industrial companies, including Creative Ergonomic Systems, Inc., Zimmerman International Corp., Thermal Devices Corp., and Champion Blower and Forge.
Charles R. GiesigeVice President – Rigging Products and Services, the AmericasMr. Giesige was named Vice President of Rigging Products, the Americas in 2009 after serving as Executive Director of the sector since 2008. Prior to that, Mr. Giesige was the Executive Director of special projects and a General Manager within Columbus McKinnon. Before joining the Company in 2006, he held a variety of senior operations and finance positions within Johnson Controls, Inc.
Eric WoonManaging Director – Asia PacificNamed Managing Director – Asia Pacific and Vice President of Columbus McKinnon Asia Pacific, Ltd. in November 2009, Mr. Woon is responsible for leading the long term profitable growth for the entire region, with a strong focus on China. During his last 15 years in Asia, Mr. Woon served as President of Volvo Construction Equipment China and President and CEO of Tesa Tape Asia Pacific.
Joseph J. OwenVice President – Supply Chain ManagementIn 2008, Mr. Owen was named to the newly-created executive position to oversee global supply chain management as well as Lean, quality, and restructuring initiatives. Since joining the Company in 1997, he has served as Hoist Group Leader, Vice President, Strategic Integration and Director, Materials Management. Previously, Mr. Owen was a management consultant with Ernst & Young LLP.
Richard A. SteinbergVice President – Human ResourcesMr. Steinberg joined Columbus McKinnon in 2005 after serving Praxair Inc. in various human resources capacities, most recently as a Region Leader and Human Resource Manager. Prior to joining Praxair in 1995, he was Human Resources Manager at Computer Task Group Inc. and Organizational Development Leader at The Goodyear Tire and Rubber Company.
Board of Directors
Ernest R. Verebelyi was elected Chairman of Columbus McKinnon’s Board of Directors in 2005 and has served as a Director of the Company since 2003. Mr. Verebelyi retired as Group President at Terex Corporation in October 2002. He also serves as a director of CH Energy Group, Inc. (NYSE: CHG).
Timothy T. Tevens was elected President, Chief Executive Officer, and a Director of Columbus McKinnon in 1998. Mr. Tevens is also a director of Zep, Inc. (NYSE: ZEP).
Richard H. Fleming was appointed a Director of the Company in 1999. Mr. Fleming is Executive Vice President and Chief Financial Officer of USG Corporation (NYSE: USG). Board Committees: Audit (Chairman), Compensation and Succession
Wallace W. Creek was appointed a Director of the Company in 2003. Mr. Creek has served as senior financial executive with Collins & Aikman and General Motors. He also serves as a director of CF Industries Holdings, Inc. (NYSE: CF). Board Committees: Corporate Governance and Nomination, Audit
Linda A. Goodspeed was appointed a Director of the Company in 2004. Ms. Goodspeed currently serves as Vice President of Information Systems for Nissan North America, Inc. She also serves as a director of American Electric Power Co., Inc. (NYSE: AEP). Board Committees: Corporate Governance and Nomination (Chairwoman), Audit
Stephen Rabinowitz was appointed a Director of the Company in 2004. He is the retired Chairman and Chief Executive Officer of General Cable Corporation. Mr. Rabinowitz is also Chairman of the Board of Energy Conversion Devices, Inc. (NASDAQ: ENER). Board Committees: Compensation and Succession (Chairman), Audit
Nicholas T. Pinchuk became a Director of the Company in January 2007. Mr. Pinchuk is currently the President, Chief Executive Officer, and Chairman of Snap-on Incorporated (NYSE: SNA). Board Committees: Compensation and Succession, Corporate Governance, and Nomination
Liam McCarthy was appointed a Director of the Company in November 2008. Mr. McCarthy is President and Chief Operating Officer of Molex Incorporated (NASDAQ:MOLX), where he previously served in various executive and management capacities.Board Committees: Compensation and Succession, Corporate Governance, and Nomination
Christian B. Ragot became a Director of the Company in November 2008. Since December 2009, Mr. Ragot has been engaged as a consultant, advising several companies in various industries. From 2007 until December 2009, Mr. Ragot was President, Chief Executive Officer, and a Director of Freightcar America, Inc. Prior thereto, he served in various executive capacities with Terex Corporation and Ingersoll-Rand Company.Board Committees: Compensation and Succession, Corporate Governance, and Nomination

Product and Market Diversity
Due to the precise capabilities of the CM Lodestar with Variable Frequency Drive (VFD), a single worker at this Pennsylvania-based manufacturer of stabilizing equipment for ocean vessels can now accurately position a gyro unit for testing.
CM’s under running, patent track Gaffey cranes are used to interlock 37 bridges, allowing 70 Yale Cable King wire rope hoists to move from one bay to another, providing flexible and flawless handling of the jet engines at this engine repair facility in Texas, USA.
The Pfaff-silberblau 150-ton under-floor lifting system with turntables installation, used by the Taipei Rapid Transit Corporation in Taiwan to lift its trains for maintenance, is earthquake resistant.
These CM Cyclone manual chain hoists are used to pull concrete formwork on a chimney construction project at a power station in South Carolina. (photo courtesy of Commonwealth Dynamics, Inc., Chimneys, Stacks, Silos, Cooling towers, www.comdynam.com)
For the Walt Disney Musical TARZAN, the Neue Flora, Europe’s largest musical theatre located in Hamburg, Germany, installed Delta electrical wire rope winches in their newly-arranged FlyGrid, including a complete, computerized, control system made by Pfaff-silberblau.
More than 200 units of CM’s Lodestar and Showpro electric chain hoists were used in the 2008 Beijing Olympic venues, including the Beijing National Stadium, shown here.

140 John James Audubon Parkway | Amherst, New York 14228-1197716-689-5400 | cmworks.com