Embed Size (px)
Citation preview

LIFE TECHNICAL GUIDE - 01
LIFE-BR-TG01-3.2-English
Version 3.2 - Brazil - English (MAY/2018)
2012 LIFE Institute - All rights reserved. Only documents available on the LIFE Institute website can be considered as Official Versions in force.
LIFE-BR-TG01-3.2-English Revision: 5/17/2018
Applicability: Brazil Version: 3.2
LIFE TECHNICAL GUIDE - 01 Calculation of the Biodiversity Impact Index and definition of
minimum performance in Conservation Actions Page 2 of 42
OBJECTIVE
To establish the minimum performance that each organization/producer must achieve in
biodiversity and ecosystem services conservation actions, considering its size and impact.
APPLICATION
This document applies to organizations and producers who want to contribute to the conservation
of biodiversity and ecosystem services and require a support tool to assess and monitor their
impacts and their minimum performance for conservation.
For LIFE certified organizations in previous versions, this document will become effective from
their first follow-up audit after its publication. For other organizations/producers, this document
will automatically apply from the publication date.
APPROVAL
Document approved by the LIFE Institute Board of Directors.
Rights reserved by copyright law in Brazil and abroad according to the terms set forth in Brazilian
and foreign legislations relevant to the subject. Any kind of reproduction of this document or part
of its content requires the express written permission by the LIFE Institute.
LIFE Institute Head Office Rua Victor Benato, 210 Bosque Zaninelli, UNILIVRE, Pilarzinho
CEP: 82120-110 – Curitiba – PR Tel: +55 41 3253-7884 www.institutolife.org
2012 LIFE Institute - All rights reserved. Only documents available on the LIFE Institute website can be considered as Official Versions in force.
LIFE-BR-TG01-3.2-English Revision: 5/17/2018
Applicability: Brazil Version: 3.2
LIFE TECHNICAL GUIDE - 01 Calculation of the Biodiversity Impact Index and definition of
minimum performance in Conservation Actions Page 3 of 42
LIST OF ACRONYMS
ANA: Brazilian National Water Agency
AO: Area of the organization/producer
AOE: Ecoregion original area
ARE: Area with plant coverage remnant of the ecoregion
BCA: Performance in Biodiversity Conservation Actions
BCAmin: Minimum score to be reached by an organization/producer according to its estimated
impact to biodiversity (BII) and size (gross income).
BII: Biodiversity Impact Index
boe: Barrel of oil equivalent
DABCHR: Demand-Availability Balance of the country’s most critical hydrographic region
DABOHR: Demand-Availability Balance of the hydrographic region where the organization/producer
is located
EC: Total amount of energy consumed
ECi: Energy consumption from source i
EG: Total amount of greenhouse gas emissions
EGi: Amount of greenhouse gas emitted i
GHG: Greenhouse Gases
GR: Gross revenue
GWP: Global warming potential
IA: Impact value
IDi: Impact of type i waste destination
IDmax: Maximum impact observed among the types of waste destination
IEi: Impact of energy source i
IEmax: Maximum impact observed among energy sources
IIi: Impact index of aspect i
IPCC: Intergovernmental Panel on Climate Change
2012 LIFE Institute - All rights reserved. Only documents available on the LIFE Institute website can be considered as Official Versions in force.
LIFE-BR-TG01-3.2-English Revision: 5/17/2018
Applicability: Brazil Version: 3.2
LIFE TECHNICAL GUIDE - 01 Calculation of the Biodiversity Impact Index and definition of
minimum performance in Conservation Actions Page 4 of 42
IPEA: Brazilian Institute for Applied Economic Research
LIFE-BR-TG02: LIFE Technical Guide 02
m³/s: Cubic meter per second
m³: Cubic meter
MCid: Brazilian Ministry of Cities
MME: Brazilian Ministry of Mines and Energy
MTC: Brazilian Ministry of Science and Technology
NIS: National Interconnected System
APBE: Action Plan for Biodiversity and Ecosystem Services
PROBIO: Project for the Conservation and Sustainable Use of Brazilian Biological Diversity
QSVGHG: Quantity and severity value for the greenhouse gases aspect
QV: Quantity value
RV: Reference value
SNIS: National Information System on Sanitation
SV: Severity value
tCO2e: Ton of CO2 equivalent
Tep (toe): Ton of Oil Equivalent
WG: Total amount of hazardous and non-hazardous waste generated
WGi: Waste generated of type i
WU: Total amount of water used
WWF: World Wide Fund for Nature

2012 LIFE Institute - All rights reserved. Only documents available on the LIFE Institute website can be considered as Official Versions in force.
LIFE-BR-TG01-3.2-English Revision: 5/17/2018
Applicability: Brazil Version: 3.2
LIFE TECHNICAL GUIDE - 01 Calculation of the Biodiversity Impact Index and definition of
minimum performance in Conservation Actions Page 5 of 42
TABLE OF CONTENTS
1. INTRODUCTION .................................................................................................................... 6
2. BIODIVERSITY IMPACT INDEX (BII) ........................................................................................ 7
2.1 CALCULATION OF THE BIODIVERSITY IMPACT INDEX (BII) ............................................ 8
2.1.1 Quantity and Severity Values ...................................................................................... 8
2.1.2 Impact Values ........................................................................................................... 10
2.1.3 Impact Indexes ......................................................................................................... 11
2.1.4 Calculation of the Biodiversity Impact Index .............................................................. 11
2.2 DATA REQUIRED TO CALCULATE THE BII .................................................................... 12
2.2.1 Waste Generation ..................................................................................................... 12
2.2.2 Water Consumption .................................................................................................. 14
2.2.3 Energy Consumption ................................................................................................. 15
2.2.4 Occupation of Areas .................................................................................................. 16
2.2.5 Emission of Greenhouse Gases .................................................................................. 16
3. minimum performance in actions for biodiversity conservation (bcamin) ................................ 18
4. Flow charts for calculating BII and bcamin .............................................................................. 19
5. REFERENCES ......................................................................................................................... 20
6. GLOSSARY ............................................................................................................................ 21
7. APPENDIX............................................................................................................................. 22

2012 LIFE Institute - All rights reserved. Only documents available on the LIFE Institute website can be considered as Official Versions in force.
LIFE-BR-TG01-3.2-English Revision: 5/17/2018
Applicability: Brazil Version: 3.2
LIFE TECHNICAL GUIDE - 01 Calculation of the Biodiversity Impact Index and definition of
minimum performance in Conservation Actions Page 6 of 42
1. INTRODUCTION
The Biodiversity Impact Index (BII) is an index developed by the LIFE Institute to define, compare and monitor, in a same scale, the impact of any organization/producer to biodiversity and ecosystem services, serving as an important management tool.
From the calculation of the BII, organizations and producers who wish to contribute to biodiversity may know and carry out the minimum performance in conservation actions that would be more appropriate to their size and impact.
This document introduces the concept and the manner of obtaining the Biodiversity Impact Index (BII)1 and the minimum performance in biodiversity conservation actions (BCAmin) relating to every size and impact.
In addition to the use of these tools for public and private management, organizations and producers who achieve or exceed the minimum performance set, can request a third-party assessment so as to obtain an external recognition on their performance in favor of biodiversity. In this case, LIFE certification can be granted whenever an organization/producer:
Achieves a performance in biodiversity conservation equal to or higher than the minimum set according to the methodology herein described. This positive performance must be demonstrated through an Action Plan for Biodiversity and Ecosystem Services (APBE), assessed and rated according to the document LIFE-BR-TG02.
Meets the minimum indicators for biodiversity management described in LIFE Certification Standards (LIFE-BR-CS).
This document applies to industry, services, and the primary sector (farming areas: agriculture, forestry,
animal production and aquaculture), whereas it does not apply to extractivism activities.
1 Called BEIV (Biodiversity Estimated Impact Value) in the previous versions.

2012 LIFE Institute - All rights reserved. Only documents available on the LIFE Institute website can be considered as Official Versions in force.
LIFE-BR-TG01-3.2-English Revision: 5/17/2018
Applicability: Brazil Version: 3.2
LIFE TECHNICAL GUIDE - 01 Calculation of the Biodiversity Impact Index and definition of
minimum performance in Conservation Actions Page 7 of 42
2. BIODIVERSITY IMPACT INDEX (BII)
Aiming to establish a metric for scaling and comparing impacts to biodiversity, making it possible to define relative performance for conservation, the Biodiversity Impact Index (BII) was developed.
The 5 environmental aspects measured and assessed to calculate the BII were selected from the performance of public meetings for the definition and selection of relevant variables for the index, both for their relation to the main causes of global biodiversity loss2 and for their data collection in organizations of any size and sector.
As a result of this analysis, we selected those aspects that had higher viability and ease of data collection and direct relationship with official data available: waste generation; water usage; energy consumption; footprint; greenhouse gas emission.
The BII is obtained through information relative to the quantity and severity relating to these 5 selected environmental aspects.
Information on the quantity of environmental aspects assessed, or “Quantity Value”, refers to a direct relationship between the data of the organization/producer compared to an official data for this aspect in the country. This comparison generates a quantity value of impact for each environmental aspect referring to its contribution to the national total.
Information on severity, or “Severity Value”, considers specific information for each environmental aspect, which allows to define their criticality: water availability in the region, potential for global warming from the gases emitted, impact of the energy sources used, health hazard, the disposal of waste generated by the activities, and national fragility of the ecoregion occupied by the enterprise. This information, although qualitative, is quantitatively represented by the severity values, which range between 0 and 1 and may be called severity factors.
By multiplying the quantity values of impact by their severity factors, “Impact Values” (IV) are generated for each environmental aspect. For comparison purposes, these impact values are transformed into “Impact Indexes” (II), with the purpose of being mathematically distributed on the same scale, from zero to one thousand. This distribution has as reference the value of greatest impact known in the country for each environmental aspect.
The simple average of the Impact Indexes (II) for each one of the environmental aspects, results in the Biodiversity Impact Index (BII).
The following sections of the document present the steps for calculating the BII and the required Information from organizations and producers for its calculation.
2 Destruction of habitats; climate changes; introduction of invasive exotic species; over-exploitation of species; pollution (Millennium Ecosystem Assessment, 2005).

2012 LIFE Institute - All rights reserved. Only documents available on the LIFE Institute website can be considered as Official Versions in force.
LIFE-BR-TG01-3.2-English Revision: 5/17/2018
Applicability: Brazil Version: 3.2
LIFE TECHNICAL GUIDE - 01 Calculation of the Biodiversity Impact Index and definition of
minimum performance in Conservation Actions Page 8 of 42
2.1 CALCULATION OF THE BIODIVERSITY IMPACT INDEX (BII)
This section of the document introduces the steps and equations used to calculate the BII.
FIGURE 1. Steps for calculating the Biodiversity Impact Index (BII).
2.1.1 Quantity and Severity Values
Table 1 presents the equations used to calculate the quantity and severity values for each environmental aspect.
STEP 1 STEP 2 STEP 3 STEP 4
Quantity Value
Impact Value
Impact Index
Severity Value
BII

2012 LIFE Institute - All rights reserved. Only documents available on the LIFE Institute website can be considered as Official Versions in force.
LIFE-BR-TG01-3.2-English Revision: 5/17/2018
Applicability: Brazil Version: 3.2
LIFE TECHNICAL GUIDE - 01 Calculation of the Biodiversity Impact Index and definition of
minimum performance in Conservation Actions Page 9 of 42
Table 1 - Equations of Quantity Values (QV) and Severity Values (SV) to calculate the BII for each environmental
aspect
ENVIRONMENTAL ASPECT QUANTITY SEVERITY
Waste Generation
QVWASTE =
SVWASTE = ∑
Water Consumption
QVWATER =
SVWATER =
Energy Consumption
QVENERGY =
SVENERGY = ∑
Occupation of Natural
Areas
QVAREA =
SVAREA =1-
Emission of Greenhouse
Gases QSVGHG = (
∑
)
Table 2 describes the terms that make up the equations presented in Table 1.
Table 2 – Terms used in the equations for the quantity and severity values
EQUATION TERMS USED
QVWASTE
QVWASTE= Quantity Value for Waste
WG= Total quantity of hazardous and non-hazardous waste generated by the
organization/producer (t/year)
RVWASTE= National Reference Value for waste (t/year) according to Appendix.
QVWATER
QVWATER= Quantity Value for Water
WU= Consumption of water used by the organization/producer (m³/year)
RVWATER= Reference Value for water (m³/year), according to Appendix.
QVENERGY
QVENERGY= Quantity Value for Energy
EC= Total quantity of energy consumed by the organization/producer (toe/year)
RVENERGY= Reference Value for Energy (toe/year), according to Appendix.

2012 LIFE Institute - All rights reserved. Only documents available on the LIFE Institute website can be considered as Official Versions in force.
LIFE-BR-TG01-3.2-English Revision: 5/17/2018
Applicability: Brazil Version: 3.2
LIFE TECHNICAL GUIDE - 01 Calculation of the Biodiversity Impact Index and definition of
minimum performance in Conservation Actions Page 10 of 42
EQUATION TERMS USED
QVAREA
QVAREA= Quantity Value for Area
AO= Area of the organization/producer (hectares)
AOE= Original area of the ecoregion in which the organization/producer is located
(hectares), according to Appendix
QSVGHG
QSVGHG= Quantity and Severity Value for Greenhouse Gases
GEi= Quantity of greenhouse gas emissions i emitted by the organization/producer
(tCO2e/year)
GWPi= Global warming potential of greenhouse gas i according to Appendix.
RVGHG= Reference value for greenhouse gases (tCO2e/year) according to Appendix.
SVWASTE
SVWASTE= Severity Value for Waste.
WGi= Percentage of waste generation with type “i” destination.
IDi= Impact of destination “i” (ID) listed in the Appendix.
IDmax= Maximum impact observed between “i” types of destination.
SVWATER
SVWATER= Severity Value for the water aspect.
DABCHR= Demand-Availability Balance of country’s most critical hydrographic region
listed in the Appendix.
DABOHR= Demand-Availability Balance of the hydrographic region where the
organization/producer is located, listed in the Appendix.
SVENERGY
SVENERGY= Severity value for the energy aspect.
ECi= Percentage of the energy source type i consumed by the organization/producer.
IEi= Impact of the energy source i consumed by the organization/producer, according
to the Appendix.
IEmax= Maximum impact observed between energy sources according to Appendix.
SVAREA
SVAREA= Severity value for the occupation aspect of natural areas.
AOE= Original area of the ecoregion in which the organization/producer is located
(hectares), according to Appendix.
ARE= Area of remaining vegetation in the ecoregion in which the
organization/property is located.
2.1.2 Impact Values
In Table 3, the equations used to obtain the Impact Value (VIi) of each aspect i are listed.

2012 LIFE Institute - All rights reserved. Only documents available on the LIFE Institute website can be considered as Official Versions in force.
LIFE-BR-TG01-3.2-English Revision: 5/17/2018
Applicability: Brazil Version: 3.2
LIFE TECHNICAL GUIDE - 01 Calculation of the Biodiversity Impact Index and definition of
minimum performance in Conservation Actions Page 11 of 42
Table 3 - Calculation of the impact value for each environmental aspect
ENVIRONMENTAL ASPECT IMPACT VALUE OF THE ASPECT
Waste Generation
IVi = QVi × SVi
Water Consumption
Energy Consumption
Occupation of Natural Areas
Emission of Greenhouse Gases IVGHG = QSVGHG
2.1.3 Impact Indexes
The Impact Values (IV) are transformed into Impact Indexes (II), which allow the representation of the impact of each environmental aspect on the same scale, dimensionless, ranging from zero to 1,000. The Impact Index (II) is calculated individually for each environmental aspect by the following equation:
Wherein:
II = Impact Index of aspect i
ai= Correction factor3 of aspect i, which allows II to range between 0 and 1,000
IV = Impact Value of aspect i
2.1.4 Calculation of the Biodiversity Impact Index
The Biodiversity Impact Index is obtained by the simple arithmetic average of the Impact Indexes (II) of the five environmental aspects assessed:
BBI =
3 See details in the Appendix.

2012 LIFE Institute - All rights reserved. Only documents available on the LIFE Institute website can be considered as Official Versions in force.
LIFE-BR-TG01-3.2-English Revision: 5/17/2018
Applicability: Brazil Version: 3.2
LIFE TECHNICAL GUIDE - 01 Calculation of the Biodiversity Impact Index and definition of
minimum performance in Conservation Actions Page 12 of 42
The information herein presented is only a description of the calculations used. Achieving the BII is facilitated through the use of an automated calculation tool provided by LIFE Institute, upon request.
Information on the reference values used in Brazil, herein mentioned, as well as for unit conversion, can be found in the Appendix (Reference Information to calculate the BII in Brazil).
2.2 DATA REQUIRED TO CALCULATE THE BII
This document section presents the data from the organization/producer that need to be informed to calculate the BII.
Prior to the calculation, it is necessary to define clearly and objectively which unit is being assessed. This information will be used as reference for the entire assessment process, considering the scope rule for LIFE Certification.
For situations not provided for in this document or in the support tools mentioned therein, the
organization/producer must present its own estimate to the auditor, justifying the data presented
during the audit. In case of impossibility of assessing one or more cultures or activities in
particular, the auditor may temporarily relieve the organization/producer from inserting the
environmental aspect in question into the calculation of the BII, recording on the audit report the
need for effort and follow-up of tools and methodologies over time to collect these data.
2.2.1 Waste Generation
a) Inform the total amount of waste generated by the organization/producer in tons/year, adding all the following situations:
i) Any waste, whether treated or not, forwarded to third parties, whether through donation or sale, for treatment, storage or final elimination

2012 LIFE Institute - All rights reserved. Only documents available on the LIFE Institute website can be considered as Official Versions in force.
LIFE-BR-TG01-3.2-English Revision: 5/17/2018
Applicability: Brazil Version: 3.2
LIFE TECHNICAL GUIDE - 01 Calculation of the Biodiversity Impact Index and definition of
minimum performance in Conservation Actions Page 13 of 42
ii) Waste send to landfills, own or third party
iii) Waste stored, internally or by third parties
iv) Household and production waste generated within the property
v) Other wastes not receiving internal treatment in the organization/property
The data reported must refer to the total waste generated in all processes - direct and indirect, productive, administrative and from maintenance - as long as performed on the physical site which is being assessed.
b) There is no need to inform wastes destined internally for:
i) Production of biogas;
ii) Incineration;
iii) Co-processing;
iv) Reuse;
v) Recycling.
All consumption of water, energy and use of area relating to these processes must be informed on the other environmental aspects to calculate the impact of the organization/property.
The auditor may request and assess information on wastes eventually not included in the calculation for the purposes of checking compliance with Principles 2, 5 and 8 of LIFE Certification Standards.
c) Inform health hazards of wastes generated in:
i) Hazardous Waste
ii) Non-hazardous waste
d) Inform the destination of the waste informed in item (a) in:
i) Reuse
ii) Recycling
iii) Composting
iv) Landfarming
v) Co-processing

2012 LIFE Institute - All rights reserved. Only documents available on the LIFE Institute website can be considered as Official Versions in force.
LIFE-BR-TG01-3.2-English Revision: 5/17/2018
Applicability: Brazil Version: 3.2
LIFE TECHNICAL GUIDE - 01 Calculation of the Biodiversity Impact Index and definition of
minimum performance in Conservation Actions Page 14 of 42
vi) Biogas
vii) Storage
viii) Incineration
ix) Landfill with biogas utilization
x) Landfill
When the destination is different from these categories, the organization/producer may select that with the characteristics closest to the informed destination. In such cases, the auditor must mention and justify this choice in the audit report.
Wastes from agricultural production, even if destined to industry, must be recorded as primary production waste and classified according to the type of destination (e.g.: recycling, co-processing, etc.). If the industry receiving this waste is undergoing assesses by LIFE methodology, this material, in this unit assessed, must be considered as an input and not as waste.
Industrial waste used in agriculture must be informed as “landfarming”, to calculate the impact of the waste from the plant assessed.
If the value presented is an estimate, due to the absence of previous records, the auditor must assess the coherence of the figures provided and record on the audit report the need to begin periodic controls.
2.2.2 Water Consumption
a) Inform the volume of consumptive water use4 of all processes, direct and indirect, carried out in the physical unit assessed.
i) Primary sector: inform the sum of the values for “green footprint” (water from precipitation stored in plants, evaporated or transpired) and for “blue footprint” (surface or underground water incorporated into the process).
- Agricultural crops: water consumption estimates for each crop can be obtained through online tool from the Water Footprint Network initiative5 .
- Animal production: water consumption estimates can be obtained by extrapolation of the individual consumption per animal/head, including watering, washing, etc.
4 Non-consumptive uses do not need to be reported, e.g.: aquaculture, hydroelectricity, water for dilution and/or purification of effluents.
5 The Water Footprint Assessment Tool Available at: http://waterfootprint.org/en/resources/interactive-tools/water-footprint-assessment-tool/

2012 LIFE Institute - All rights reserved. Only documents available on the LIFE Institute website can be considered as Official Versions in force.
LIFE-BR-TG01-3.2-English Revision: 5/17/2018
Applicability: Brazil Version: 3.2
LIFE TECHNICAL GUIDE - 01 Calculation of the Biodiversity Impact Index and definition of
minimum performance in Conservation Actions Page 15 of 42
- Forestry: water consumption estimates for the Pinus and Eucalyptus genera can be obtained through the LIFE Key calculation tool6 . In these cases, it is necessary to inform the area planted with each gender and the location of plantations.
ii) Secondary sector: the organization must inform only the consumptive use of blue water (water collected less the water discarded, either as effluent or process losses).
iii) Tertiary sector: the organization must inform only the consumption of blue water. The consumption of blue water can be informed through consumption records, being possible to discount the return volume to the basin only when this information is available.
b) Inform the hydrographic region where the assessed enterprise is located.
The organization can define its hydrographic region more accuracy by entering the location data on the map provided by the LIFE Key tool.
2.2.3 Energy Consumption
a) Inform the total amount of energy consumed (own or acquired by the business unit). Inform the distribution of consumption by sources used:
i) Energy from the National Interconnected System (NIS)
ii) Biofuels (ethanol)
iii) Biofuels (Oils and Biodiesel)
iv) Biogas
v) Biomass (wood)
vi) Biomass (residual)
vii) Mineral Coal
viii) Sea Energy
ix) Wind
x) Natural Gas
xi) Geothermal
6 Estimates obtained through the LIFE/IPEF project of Forestry water consumption.

2012 LIFE Institute - All rights reserved. Only documents available on the LIFE Institute website can be considered as Official Versions in force.
LIFE-BR-TG01-3.2-English Revision: 5/17/2018
Applicability: Brazil Version: 3.2
LIFE TECHNICAL GUIDE - 01 Calculation of the Biodiversity Impact Index and definition of
minimum performance in Conservation Actions Page 16 of 42
xii) Hydroelectricity
xiii) Non-renewable residual
xiv) Nuclear
xv) Oil and derived
xvi) Solar
2.2.4 Occupation of Areas
a) Inform the area (hectares), distributed according to occupancy classes in accordance with MSA (Mean Species Abundance7).
b) Inform the ecoregion in which the organization/producer is located. The organization can define its ecoregion more accurately by entering the location data on the map provided by the LIFE Key tool.
c) In the case of agricultural properties bound to leasing contracts or others, inform only the areas relating to the contract8 .
d) External areas to the assessed properties, bound only to conservation actions, must not be accounted for to calculate the BII.
2.2.5 Emission of Greenhouse Gases
a) The total amount of emissions of all greenhouse gases;
The organization/producer must inform the Total Emissions of each one of the Greenhouse Gases (tCO2e/year), considering the Scopes 1+2+3 of the GHG Protocol tool.9. For the year zero of certification, information pertaining only to Scopes 1+2 will be accepted. More detailed
7 Mean Species Abundance (MSA) is an indicator that describes the changes in the environment in relation to the original ecosystem. The MSA is an indicator of naturalness or intactability of biodiversity, defined as mean abundance of original species in the area in question in relation to their abundance in undisturbed ecosystems. An area with an MSA of 100% (1.0) means having a biodiversity similar to the natural situation. An MSA of 0% (0.0) means a completely destroyed ecosystem without remaining original species. The relationship of the MSA classes for
occupation of area are in the Appendix. For more details: http://www.globio.info/background-msa
8 In these cases, legal environmental compliance is mandatory for the entire area of the property, even if the contract is bound to a partial area. This mandatory legal compliance must be provided for in contract.
9 Cross-sectoral GHG Protocol Tool. Available at http://twixar.me/sVP

2012 LIFE Institute - All rights reserved. Only documents available on the LIFE Institute website can be considered as Official Versions in force.
LIFE-BR-TG01-3.2-English Revision: 5/17/2018
Applicability: Brazil Version: 3.2
LIFE TECHNICAL GUIDE - 01 Calculation of the Biodiversity Impact Index and definition of
minimum performance in Conservation Actions Page 17 of 42
information on the scopes of the GHG Protocol is listed in the Appendix and in the document LIFE-BR-RD003.
The GHG Protocol also has a calculation tool specific for the primary sector10. Other tools for the inventory of emissions will be accepted, as long as also using the IPCC (Intergovernmental Panel on Climate Change) guidelines11.
The BII assesses the negative impacts to biodiversity for all environmental aspects considered. Thus, for this step, only greenhouse gas emissions will be accounted for, and not carbon sequestration. Carbon fixation projects, validated by a third party12, may score as indirect action for biodiversity conservation (strategic line “G4” - LIFE-BR-TG02).
10 GHG Protocol Agricultural Guidelines. Available at http://twixar.me/cVP
11 Revised 1996 IPCC Guidelines for National Greenhouse Gas Inventories. Available at: http://twixar.me/xVP
12Validation by recognized initiatives relative to the topic or by consulting works based in detailed, justified and
recognized methodologies.

2012 LIFE Institute - All rights reserved. Only documents available on the LIFE Institute website can be considered as Official Versions in force.
LIFE-BR-TG01-3.2-English Revision: 5/17/2018
Applicability: Brazil Version: 3.2
LIFE TECHNICAL GUIDE - 01 Calculation of the Biodiversity Impact Index and definition of
minimum performance in Conservation Actions Page 18 of 42
3. MINIMUM PERFORMANCE IN ACTIONS FOR BIODIVERSITY CONSERVATION (BCAMIN)
The minimum performance in biodiversity conservation for the LIFE Certification is determined by two factors: the Biodiversity Impact Index (BII) and the company’s Gross Revenue (GR).
The BCAmin is obtained through the following equation:
BCAmin =
Wherein:
BII: Biodiversity Impact Index
GR: Gross Revenue
x, y: calibration factors of BCAmin
Considering the assessment and scoring of the Action Plan for Biodiversity and Ecosystem Services
Action Plan (APBE) of the organization/producer (BCAachieved13), the BCAto be achieved is calculated:
BCAto be achieved = BCAmin - BCAachieved
13 LIFE-BR-TG02

2012 LIFE Institute - All rights reserved. Only documents available on the LIFE Institute website can be considered as Official Versions in force.
LIFE-BR-TG01-3.2-English Revision: 5/17/2018
Applicability: Brazil Version: 3.2
LIFE TECHNICAL GUIDE - 01 Calculation of the Biodiversity Impact Index and definition of
minimum performance in Conservation Actions Page 19 of 42
4. FLOW CHARTS FOR CALCULATING BII AND BCAMIN
2012 LIFE Institute - All rights reserved. Only documents available on the LIFE Institute website can be considered as Official Versions in force.
LIFE-BR-TG01-3.2-English Revision: 5/17/2018
Applicability: Brazil Version: 3.2
LIFE TECHNICAL GUIDE - 01 Calculation of the Biodiversity Impact Index and definition of
minimum performance in Conservation Actions Page 20 of 42
5. REFERENCES
AGÊNCIA NACIONAL DE ÁGUAS. Conjuntura dos Recursos Hídricos no Brasil. Brasília, 2013. Available at: <http://arquivos.ana.gov.br/institucional/spr/conjuntura/webSite_relatorioConjuntura/projeto/index.html>. Access on: 1 Aug. 2014.
GHG PROTOCOL. GHG Protocol Diretrizes Agropecuárias. Available at <http://www.ghgprotocol.org/Agriculture-Guidance/Vis%C3%A3o-Geral%3A-Projeto-Brasil-Agropecu%C3%A1ria> Access on: 15 Oct. 2015.
GLOBIO. GLOBIO3: A Framework to Investigate Options for Reducing Global Terrestrial Biodiversity Loss. Available at <http://www.globio.info/downloads/14/fulltext%20%28artikel%20GLOBIO%29.pdf>. Access on: 15 Oct. 2015.
INSTITUTO DE PESQUISA ECONÔMICA APLICADA. Diagnóstico dos Resíduos Sólidos Industriais. Relatório de Pesquisa. 2012. Available at: <http://www.ipea.gov.br/portal/index.php?option=com_content&view=article&id=15621&catid=222&Itemid=7>. Access on: 4 July 2014.
MINISTÉRIO DAS CIDADES. Sistema Nacional de Informações sobre o Saneamento (SNIS). 2014. Available at: <http://www.snis.gov.br/PaginaCarrega.php?EWRErterterTERTer=104>. Access on: 17 July 2014.
MINISTÉRIO DE CIÊNCIA, TECNOLOGIA E INOVAÇÃO. Segunda Comunicação Nacional do Brasil à Convenção – Quadro das Nações Unidas sobre Mudança Climática - Volume 1. Brasília, 2010. 280 p. Available at: <http://www.mct.gov.br/index.php/content/view/326988.html>. Access on: 22 July 2014.
MINISTÉRIO DE MINAS E ENERGIA. Balanço Energético Nacional 2013: Ano base 2012. Brasília, 2013. 288 p. Available at: <https://ben.epe.gov.br/BENRelatorioFinal2012.aspx>. Access on: 3 Aug. 2014.
MINISTÉRIO DO MEIO AMBIENTE (MMA). Mapas de Cobertura Vegetal dos Biomas Brasileiros. PROBIO 2005. Escala 1:250.000. Available at: <http://mapas.mma.gov.br/mapas/aplic/probio/datadownload.htm>. Access on: 1 Aug. 2014.
OPERADOR NACIONAL DO SISTEMA ELÉTRICO. Sistema Interligado Nacional (SIN). Available at: <http://www.ons.org.br/conheca_sistema/resumo_operacao.aspx>. 2014. Access on: 7 July 2014.
PROGRAMA BRASILEIRO GHG PROTOCOL. Ferramenta de Cálculo. 2013. Available at: <www.fgv.br/ces/ghg/>. Access on: 29 July 2014.
WATER FOOTPRINT NETWORK. The Water Footprint Assessment Manual Available at: <http://waterfootprint.org/media/downloads/TheWaterFootprintAssessmentManual_2.pdf>. Access on: 15 Oct. 2015.
WORLD RESOURCES INSTITUTE. Millennium Ecosystem Assessment. Ecosystems and Human Well-being: Biodiversity Synthesis. Washington, DC, 2005. 141 p. Available at: <http://www.millenniumassessment.org/documents/document.356.aspx.pdf>. Access on: 2 Aug. 2014.
WORLD WIDE FUND FOR NATURE (WWF). Wildfinder. 2014. Escala indeterminável. Available at: <http://www.worldwildlife.org/science/wildfinder/>. Access on: 15 July 2014.

2012 LIFE Institute - All rights reserved. Only documents available on the LIFE Institute website can be considered as Official Versions in force.
LIFE-BR-TG01-3.2-English Revision: 5/17/2018
Applicability: Brazil Version: 3.2
LIFE TECHNICAL GUIDE - 01 Calculation of the Biodiversity Impact Index and definition of
minimum performance in Conservation Actions Page 21 of 42
6. GLOSSARY
The terms used in this document are available in the LIFE Glossary.

2012 LIFE Institute - All rights reserved. Only documents available on the LIFE Institute website can be considered as Official Versions in force.
LIFE-BR-TG01-3.2-English Revision: 5/17/2018
Applicability: Brazil Version: 3.2
LIFE TECHNICAL GUIDE - 01 Calculation of the Biodiversity Impact Index and definition of
minimum performance in Conservation Actions Page 22 of 42
7. APPENDIX
1. Factor ai
Factor ai is the Correction Factor of distribution scale of the Impact Indexes. The correction factors are determined nationally, aimed at establishing a distribution scale of the impacts from the higher values for each individual impact (productive unit) in the country. In each country, the factor is set so that the maximum value observed for the environmental aspect is equivalent to the value of 950 in a scale from 0 to 1,000.
The Correction Factors presently used in Brazil are: (i) Waste: 7,345; (ii) Water: 6,615; (iii) Energy: 2,358; (iv) Area: 7,923; (v) Greenhouse Gases: 7,995.
2. Calibration factors of BCAmin
The factors of equation BCAmin are the ones that adjust the country’s conservation performance according to the current practices of organizations, so that all enterprises seek to achieve the best practices. Current practices of organizations in conservation are researched and assessed by local experts.
Calibration factors of BCAmin in Brazil: x) 0,42; y) 0,29.
2012 LIFE Institute - All rights reserved. Only documents available on the LIFE Institute website can be considered as Official Versions in force.
LIFE-BR-TG01-3.2-English Revision: 5/17/2018
Applicability: Brazil Version: 3.2
LIFE TECHNICAL GUIDE - 01 Calculation of the Biodiversity Impact Index and definition of
minimum performance in Conservation Actions Page 23 of 42
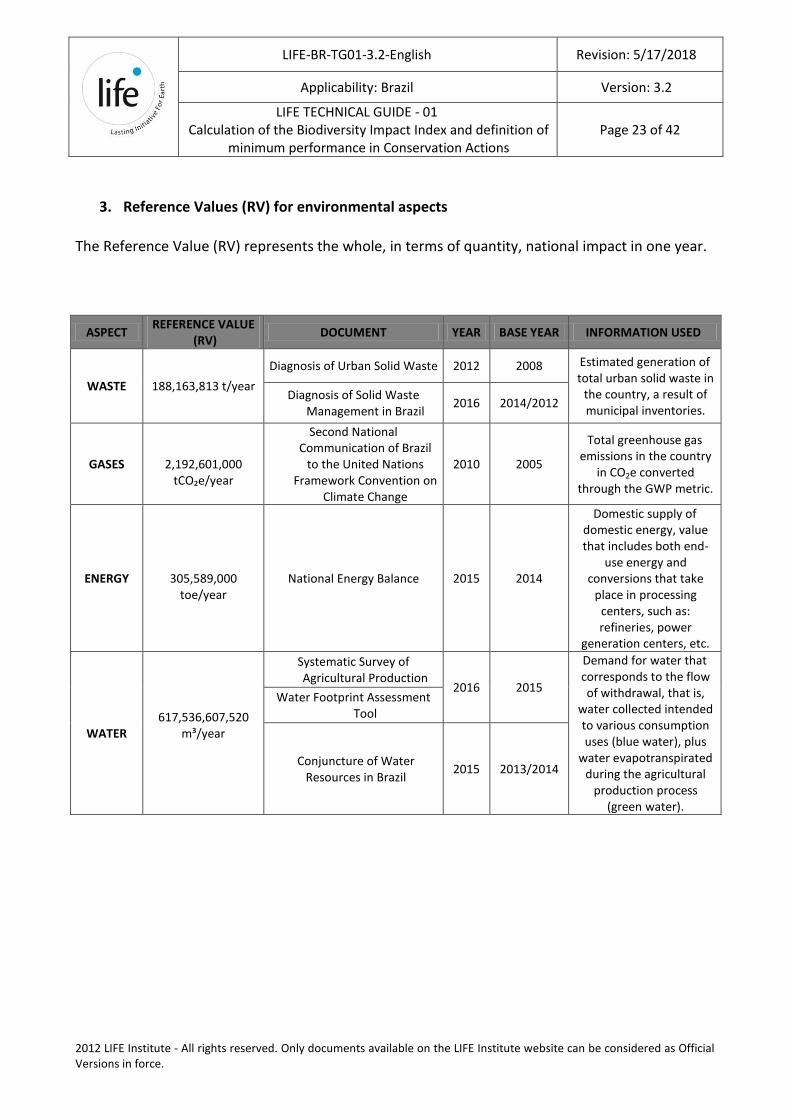
3. Reference Values (RV) for environmental aspects
The Reference Value (RV) represents the whole, in terms of quantity, national impact in one year.
ASPECT REFERENCE VALUE
(RV) DOCUMENT YEAR BASE YEAR INFORMATION USED
WASTE
188,163,813 t/year
Diagnosis of Urban Solid Waste 2012 2008 Estimated generation of total urban solid waste in
the country, a result of municipal inventories.
Diagnosis of Solid Waste Management in Brazil
2016 2014/2012
GASES
2,192,601,000 tCO₂e/year
Second National Communication of Brazil
to the United Nations Framework Convention on
Climate Change
2010 2005
Total greenhouse gas emissions in the country
in CO2e converted through the GWP metric.
ENERGY
305,589,000 toe/year
National Energy Balance 2015 2014
Domestic supply of domestic energy, value that includes both end-
use energy and conversions that take
place in processing centers, such as: refineries, power
generation centers, etc.
WATER
617,536,607,520
m³/year
Systematic Survey of Agricultural Production
2016 2015
Demand for water that corresponds to the flow of withdrawal, that is,
water collected intended to various consumption uses (blue water), plus
water evapotranspirated during the agricultural
production process (green water).
Water Footprint Assessment Tool
Conjuncture of Water Resources in Brazil
2015 2013/2014

2012 LIFE Institute - All rights reserved. Only documents available on the LIFE Institute website can be considered as Official Versions in force.
LIFE-BR-TG01-3.2-English Revision: 5/17/2018
Applicability: Brazil Version: 3.2
LIFE TECHNICAL GUIDE - 01 Calculation of the Biodiversity Impact Index and definition of
minimum performance in Conservation Actions Page 24 of 42
4. References for the calculation of the Severity Valor
a) Impact of Destination (ID) of non-hazardous waste generated by the organization
ASPECT
Red
uct
ion
of
the
volu
me
of
was
te t
o b
e d
isp
ose
d in
a la
nd
fill
Red
uct
ion
of
the
po
ten
tial
fo
r
con
tam
inat
ion
of
the
was
te
Gen
erat
ion
of
ne
w p
rod
uct
s
Ener
gy r
euse
R
edu
ctio
n o
f th
e co
nsu
mp
tio
n
of
nat
ura
l res
ou
rce
s G
ener
atio
n o
f o
ther
was
te
Are
a d
egra
dat
ion
Gen
era
tio
n o
f liq
uid
eff
luen
ts /
Po
ssib
ly c
on
tam
inat
ed
wat
er
bo
die
s G
ener
atio
n o
f p
ollu
tan
t ga
ses
Sum
of
the
imp
act
Pro
cess
sco
re
Seve
rity
Ind
ex
Destination Positive Impact Negative Impact
Reuse 0 0 0 0 0 0 0 0 0 0 1 0 Recycling 0 0 0 0 0 1 0 1 0 2 2 4
Composting 0 0 0 1 0 0 0 1 0 2 2 4 Landfarming 0 0 0 0 0 0 0 1 1 2 4 8
Co-processing 0 0 0 0 0 1 0 1 1 3 3 9 Biogas 0 0 0 1 0 0 1 1 1 4 3 12
Storage 0 0 1 1 - 0 0 1 0 3 4 12 Incineration 0 0 1 0 1 1 - - 1 4 4 16
Landfill with biogas utilization 1 1 0 0 1 1 1 1 1 7 5 35 Landfill 1 1 1 1 1 1 1 1 1 9 5 45
Positive Impact: 0 - Presence of positive impact / 1 - Absence of positive impact. Negative Impact: 0 - Absence of negative impact / 1 - Presence of negative impact Max ID: 45

2012 LIFE Institute - All rights reserved. Only documents available on the LIFE Institute website can be considered as Official Versions in force.
LIFE-BR-TG01-3.2-English Revision: 5/17/2018
Applicability: Brazil Version: 3.2
LIFE TECHNICAL GUIDE - 01 Calculation of the Biodiversity Impact Index and definition of
minimum performance in Conservation Actions Page 25 of 42
b) Impact of Destination (ID) of hazardous waste generated by the organization
ASPECT
Red
uct
ion
of
the
volu
me
of
was
te
to
be
dis
po
sed
in a
lan
dfi
ll
Red
uct
ion
of
the
po
ten
tial
fo
r
con
tam
inat
ion
of
the
was
te
Gen
erat
ion
of
ne
w p
rod
uct
s
Ener
gy r
euse
R
edu
ctio
n o
f th
e co
nsu
mp
tio
n o
f
nat
ura
l res
ou
rce
s G
ener
atio
n o
f o
ther
was
te
Are
a d
egra
dat
ion
Gen
era
tio
n o
f liq
uid
eff
luen
ts /
Po
ssib
ly c
on
tam
inat
ed
wat
er b
od
ies
Gen
erat
ion
of
po
lluta
nt
gase
s Fl
amm
abili
ty
Co
rro
sivi
ty
Rea
ctiv
ity
Toxi
city
Pat
ho
gen
icit
y
Sum
of
the
imp
act
Pro
cess
sco
re
Seve
rity
Ind
ex
Destination Positive Impact Negative Impact
Reuse 0 0 0 0 0 0 0 0 0 10 10 10 10 10 50 0 50 Recycling 0 0 0 0 0 10 0 10 0 10 10 10 10 10 70 1 70
Landfarming 0 0 0 0 0 0 0 10 10 10 10 10 10 10 70 1 70 Co-processing 0 0 0 0 0 10 0 10 10 10 10 10 10 10 80 1 80
Biogas 0 0 0 10 0 0 10 10 10 10 10 10 10 10 90 2 180 Storage 0 0 10 10 - 0 0 10 0 10 10 10 10 10 80 3 240
Incineration 0 0 10 0 10 10 - - 10 10 10 10 10 10 90 4 360 Landfill with biogas utilization 10 10 0 0 10 10 10 10 10 10 10 10 10 10 120 5 600
Landfill 10 10 10 10 10 10 10 10 10 10 10 10 10 10 140 5 700 Positive Impact: 0 - Presence of positive impact / 10 - Absence of positive impact. Negative Impact: 0 - Absence of negative impact / 10 - Presence of negative impact Max ID: 700
c) Demand-Availability Balance (DAB) by Hydrographic Region
Hydrographic Region
Water
availability in
the region
(m³/s)
Water
demand in the
region (m³/s)
Demand-Availability
Balance (DAB)
Amazon Hydrographic Region 73,748 78.8 0.00107
Tocantins-Araguaia Hydrographic Region 5,447 135.6 0.02489
Paraguay Hydrographic Region 782 30 0.03836
Western Northeast Atlantic Hydrographic Region 320 23.7 0.07406
Paraná Hydrographic Region 5,956 736 0.12357
Parnaíba Hydrographic Region 379 50.9 0.13430
São Francisco Hydrographic Region 1,886 278.8 0.14783
Southeast Atlantic Hydrographic Region 1,145 213.7 0.18664
Uruguay Hydrographic Region 565 155.4 0.27504
East Atlantic Hydrographic Region 305 112.3 0.36820
South Atlantic Hydrographic Region 647 295.4 0.45657
Eastern Northeast Atlantic Hydrographic Region 91 262 2.87912
2012 LIFE Institute - All rights reserved. Only documents available on the LIFE Institute website can be considered as Official Versions in force.
LIFE-BR-TG01-3.2-English Revision: 5/17/2018
Applicability: Brazil Version: 3.2
LIFE TECHNICAL GUIDE - 01 Calculation of the Biodiversity Impact Index and definition of
minimum performance in Conservation Actions Page 26 of 42
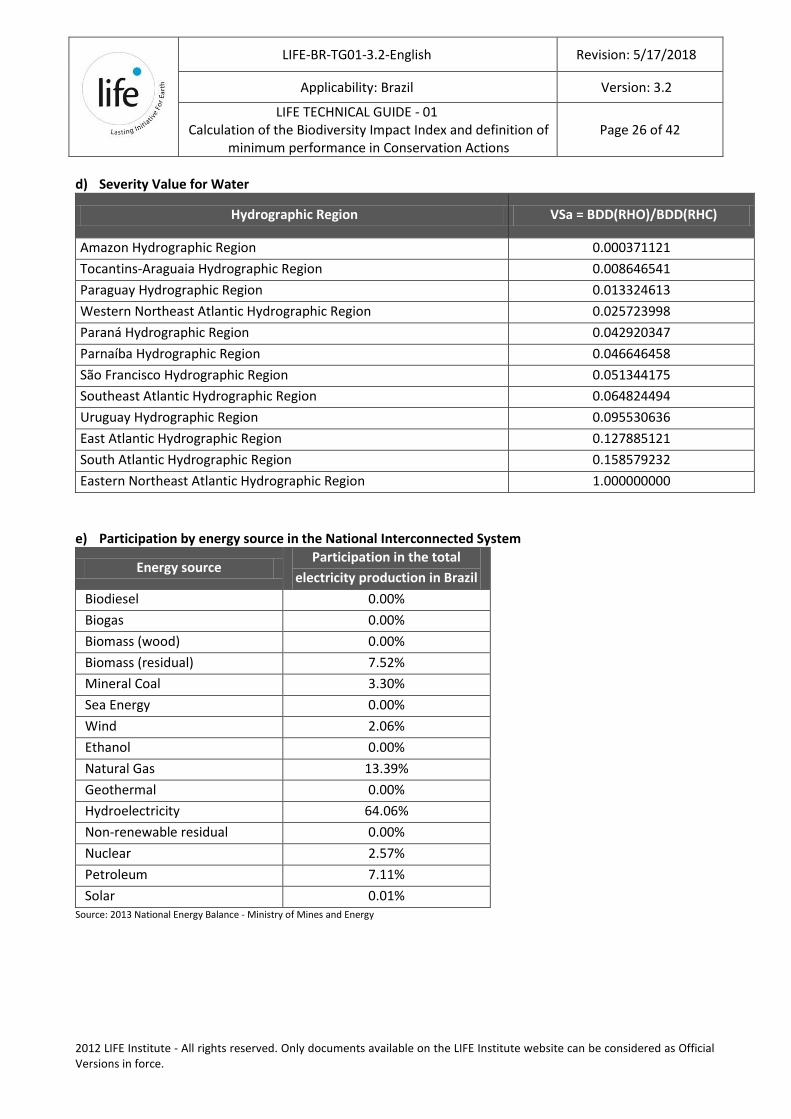
d) Severity Value for Water
Hydrographic Region VSa = BDD(RHO)/BDD(RHC)
Amazon Hydrographic Region 0.000371121
Tocantins-Araguaia Hydrographic Region 0.008646541
Paraguay Hydrographic Region 0.013324613
Western Northeast Atlantic Hydrographic Region 0.025723998
Paraná Hydrographic Region 0.042920347
Parnaíba Hydrographic Region 0.046646458
São Francisco Hydrographic Region 0.051344175
Southeast Atlantic Hydrographic Region 0.064824494
Uruguay Hydrographic Region 0.095530636
East Atlantic Hydrographic Region 0.127885121
South Atlantic Hydrographic Region 0.158579232
Eastern Northeast Atlantic Hydrographic Region 1.000000000
e) Participation by energy source in the National Interconnected System
Energy source Participation in the total
electricity production in Brazil
Biodiesel 0.00%
Biogas 0.00%
Biomass (wood) 0.00%
Biomass (residual) 7.52%
Mineral Coal 3.30%
Sea Energy 0.00%
Wind 2.06%
Ethanol 0.00%
Natural Gas 13.39%
Geothermal 0.00%
Hydroelectricity 64.06%
Non-renewable residual 0.00%
Nuclear 2.57%
Petroleum 7.11%
Solar 0.01% Source: 2013 National Energy Balance - Ministry of Mines and Energy

2012 LIFE Institute - All rights reserved. Only documents available on the LIFE Institute website can be considered as Official Versions in force.
LIFE-BR-TG01-3.2-English Revision: 5/17/2018
Applicability: Brazil Version: 3.2
LIFE TECHNICAL GUIDE - 01 Calculation of the Biodiversity Impact Index and definition of
minimum performance in Conservation Actions Page 27 of 42
f) Impact of energy sources used by the organization (IE)
IEmax= 110
COMPONENT
ENVIRONMENTAL FACTOR
Wat
er u
se a
nd
/ o
r
con
sum
pti
on
Gen
erat
ion
of
effl
uen
ts
Emis
sio
ns
of
gree
nh
ou
se
gase
s
Atm
osp
her
ic e
mis
sio
ns
No
ise
emis
sio
ns
Lan
d u
se
Gen
erat
ion
of
solid
was
te
Occ
up
atio
n o
f ar
eas
Gen
erat
ion
of
effl
uen
ts a
nd
solid
res
idu
es;
atm
osp
her
ic
emis
sio
ns
POTENTIAL IMPACT
Ch
ange
in w
ater
ava
ilab
ility
Ch
ange
in w
ater
qu
alit
y
Co
ntr
ibu
tio
n t
o in
crea
sed
clim
ate
war
min
g
Ch
ange
in a
ir q
ual
ity
Ch
ange
in n
ois
e le
vels
Inte
nsi
fica
tio
n o
f si
ltin
g
pro
cess
es
Inte
nsi
fica
tio
n o
f er
osi
ve
pro
cess
es
Gen
erat
ion
of
ind
uce
d
eart
hq
uak
es
Ch
ange
s in
lan
dsc
ape
and
lan
d u
se
Ch
ange
in s
oil
qu
alit
y
Hab
itat
ch
ange
an
d /
or
red
uct
ion
Stru
ctu
ral a
nd
/ o
r
fun
ctio
nal
ch
ange
of
eco
syst
ems
ENERGY SOURCE
Biofuels (Ethanol) 9 5 2 5 1 2 5 n.s 9 1 5 3 47
Biofuel (Oils and Biodiesel) 9 5 2 5 1 2 5 n.s 5 5 5 3 47
Biogas 2 1 3 3 1 n.s n.s n.s 2 1 n.s n.s 13
Biomass (wood) 3 1 9 7 3 2 2 n.s 7 3 9 3 49
Biomass (residual) 1 1 3 5 1 1 1 n.s 5 3 1 3 25
Mineral Coal 9 8 10 10 7 9 9 9 10 10 10 9 110
Sea Energy n.s n.s n.s n.s 2 n.s n.s n.s 1 n.s 5 1 9
Wind n.s n.s n.s n.s 6 n.s 1 n.s 9 n.s 2 n.s 18
Natural Gas 9 7 9 7 7 4 4 9 9 5 8 6 84
Geothermal 1 6 1 2 4 1 1 9 9 5 5 1 45
Hydroelectricity 9 1 1 3 3 10 9 2 10 1 9 1 59
Non-renewable residual 1 5 10 7 5 1 1 n.s 5 n.s 2 1 38
Nuclear 10 6 1 3 7 9 9 9 10 10 9 5 88
Petroleum and byproducts 9 8 10 10 7 4 4 9 9 8 4 6 88
Solar 5 1 1 n.s 1 1 1 n.s 6 6 5 5 32
n.s = not significant
IMPACT
IMP
AC
T O
F EN
ERG
Y S
OU
RC
E (I
E)
WATER AIR SOIL BIOTA
Mo
vem
ent
of
soil

2012 LIFE Institute - All rights reserved. Only documents available on the LIFE Institute website can be considered as Official Versions in force.
LIFE-BR-TG01-3.2-English Revision: 5/17/2018
Applicability: Brazil Version: 3.2
LIFE TECHNICAL GUIDE - 01 Calculation of the Biodiversity Impact Index and definition of
minimum performance in Conservation Actions Page 28 of 42
g) Mean Species Abundance (MSA)
MSA Classes of Soil Cover
1 Forests or other natural preserved or naturally without coverage ecosystems
0.7 Natural or little explored ecosystems
0.5 Altered natural ecosystems; areas in recovery, production in biodiverse systems,
squares/native gardens
0.3 Low impact crops
0.2 Forest plantations
0.1 Intensive farming and livestock, artificial pasture, artificial reservoirs and
squares/conventional gardens
0.05 Built-out areas
h) Greenhouse Gases and their global warming potential (GWP) for a period of 100 years
Gas Chemical formula GWP
Carbon Dioxide CO2 1
Methane CH4 21
Nitrous Oxide N2O 310
Hydrofluorocarbon (HFC)
HFC-125 C2HF5 2,800
HFC-134a C2H2F4 (CH2FCF3) 1,300
HFC-143a C2H3F3 (CF3CH3) 3,800
HFC-152a C2H4F2 (CH3CHF2) 140
Perfluorocarbons (PFC)
Perfluoromethane (tetrafluoroethane) CF4 6,500
Perfluorethane (Hexafluoroethane) C2F6 9,200
Sulfur hexafluoride SF6 23,900 Adapted from: Second National Communication of Brazil to the United Nations Framework Convention on Climate Change - Volume 1.

2012 LIFE Institute - All rights reserved. Only documents available on the LIFE Institute website can be considered as Official Versions in force.
LIFE-BR-TG01-3.2-English Revision: 5/17/2018
Applicability: Brazil Version: 3.2
LIFE TECHNICAL GUIDE - 01 Calculation of the Biodiversity Impact Index and definition of
minimum performance in Conservation Actions Page 29 of 42
i) Ecoregions of Brazil
a) Original and remnant areas of terrestrial ecoregions of Brazil
Ecoregion Original area (ha) Remaining area (ha)
Campinaranas of Alto Rio Negro 8,097,018.53 154,880.00
Forests of the Interior of Paraná/Paranaíba 44,471,197.84 3,655,168.00
Savannas of the Guyanas 7,810,248.84 650,496.00
Mangroves of Maranhão 1,420,390.15 154,880.00
Coastal forest of Bahia 11,957,910.29 1,424,896.00
Araucaria Forests 26,459,380.91 3,221,504.00
Floodplains of Gurupá 994,016.56 123,904.00
Forests of the Interior of Bahia 25,607,062.55 3,779,072.00
Negro/Branco Interfluve 4,880,148.15 805,376.00
Dry forests of Mato Grosso 42,887,310.92 8,673,280.00
Humid Chaco 152,373.39 30,976.00
Rupestrian Fields 2,975,353.68 619,520.00
Rio Piranhas Mangroves/Ilha Grande Mangroves/São Francisco River Mangroves
952,021.76 216,832.00
Dry Forest of Chiquitano 7,068,488.15 1,672,704.00
Northeastern Swamps 483,563.86 123,904.00
Coastal Forests of Pernambuco 1,797,612.24 495,616.00
Coastal Forests of Serra do Mar 12,557,215.14 3,655,168.00
Atlantic Coast Mudflats 924,553.84 278,784.00
Japurá/Solimões-Negro Interfluve 23,572,308.81 7,960,832.00
Forests of the Interior of Pernambuco 2,291,852.63 774,400.00
Southern Fields 23,341,787.81 8,301,568.00
Tocantins-Araguaia/Maranhão Interfluve 19,371,014.33 7,155,456.00
Forests of Caqueta 1,284,699.38 650,496.00
Floodplains of Marajó 8,285,075.30 4,212,736.00
Savannah 205,679,296.90 104,853,760.00
Caatinga 75,459,926.65 43,056,640.00
Tepuis 516,151.97 309,760.00
Forests of Babaçu do Maranhão 14,336,095.92 8,735,232.00
Floodplains of Monte Alegre 6,744,059.64 4,212,736.00
Xingu/Tocantins-Araguaia Interfluve 26,842,076.62 16,850,944.00
Dry Forests of the Northeast 12,119,509.64 8,053,760.00
Solimões/Japurá Interfluve 3,645,373.67 2,447,104.00
Madeira/Tapajós Interfluve 67,838,902.32 47,764,992.00
Lowland Forests of the Guyanas 8,563,652.97 6,288,128.00

2012 LIFE Institute - All rights reserved. Only documents available on the LIFE Institute website can be considered as Official Versions in force.
LIFE-BR-TG01-3.2-English Revision: 5/17/2018
Applicability: Brazil Version: 3.2
LIFE TECHNICAL GUIDE - 01 Calculation of the Biodiversity Impact Index and definition of
minimum performance in Conservation Actions Page 30 of 42
Ecoregion Original area (ha) Remaining area (ha)
Altitude Forests of the Guyanas 2,730,212.64 2,013,440.00
Purus/Madeira Interfluve 17,710,235.04 13,257,728.00
Uamatá/Trombetas Interfluve 47,197,632.22 36,148,992.00
Coastal Mudflats of the Northeast 979,821.72 774,400.00
Floodplains of Iquitos 3,198,498.28 2,571,008.00
Pantanal 15,163,835.40 12,297,472.00
Floodplains of Purus 14,604,515.88 12,421,376.00
Tapajós/Xingu Interfluve 34,130,683.92 29,365,248.00
Forests of the Guyanas 6,857,215.98 6,133,248.00
Amazon Southwest 32,578,735.36 29,272,320.00
Juruá/Purus Interfluve 24,538,386.00 23,510,784.00 Source: LIFE Institute/Federal University of Goiás, 2014. Adapted from: MMA (2005); WWF (2014).
b) Priority Ranking of Marine Ecoregions in Brazil
Ranking/Priority Marine Ecoregion
1 Amazon
2 Eastern Brazil
3 Southeastern Brazil
4 Northeastern Brazil
5 Rio Grande
6 Islands of São Pedro and São Paulo
7 Fernando de Naronha and Atol das Rocas
8 Islands of Trindade and Martim Vaz
The priority of the marine ecoregions in Brazil combines both the borders of the ecoregions, according to the Marine Ecoregions of the World (2007), the degree of priority and biological importance defined by the Conservation Overview of Marine and Coastal Ecosystems (MMA, 2010) and the extension of each priority area (in km²), resulting in the following equation:
∑
Wherein: PCem = priority of the marine ecoregion for conservation Si = size of the priority area i, as defined by MMA (2010) - (km
2)
GI = value of the degree of importance of the priority area i

2012 LIFE Institute - All rights reserved. Only documents available on the LIFE Institute website can be considered as Official Versions in force.
LIFE-BR-TG01-3.2-English Revision: 5/17/2018
Applicability: Brazil Version: 3.2
LIFE TECHNICAL GUIDE - 01 Calculation of the Biodiversity Impact Index and definition of
minimum performance in Conservation Actions Page 31 of 42
5. Factors for Unit Conversation
a) Relations between Units
Exponential Equivalence Practical relations
(k) kilogram = 10 3 1 m3 = 6.28981 barrels
(M) mega = 10 6 1 barrel = 0.158987 m 3 1 toe year = 7.2 boe year
(G) giga = 10 9 1 joule = 0.239 cal 1 boe year = 0.14 toe year
(T) tera = 10 12 1 Btu = 252 cal 1 toe year = 0.02 boe day
(P) peta = 10 15 1 m³ of oil = 0.872 t (in 1994) 1 boe day = 50 toe year
(E) exa = 10 18 1 toe = 10,000 Mcal
Source: 2013 National Energy Balance - Ministry of Mines and Energy
b) Coefficients of Caloric Equivalence
Multiplied by to (m3) (1,000 m3) (t) (m3) (t) (t)
Fuel oil
Dry natural gas
Mineral Coal 5,200
LPG Firewoo
d Charcoa
l
Mineral Coal 5,200 (t) 0.52 0.56 1.00 0.80 1.58 0.76
Charcoal (t) 0.67 0.73 1.31 1.05 2.06 1.00
Dry natural gas (1,000 m3) 0.92 1.00 1.78 1.43 2.80 1.36
LPG (m3) 0.64 0.70 1.25 1.00 1.97 0.95
Firewood (t) 0.33 0.36 0.63 0.51 1.00 0.49
Fuel oil (m3) 1.00 1.09 1.94 1.56 3.06 1.48
Source: 2013 National Energy Balance - Ministry of Mines and Energy
c) Conversion Factors for Mass
Multiplied by
to
kg t tl tc lb
Kilogram (kg) 1 0.001 0.000984 0.001102 2.2046
Metric Ton (t) 1,000 1 0.984 1.1023 2,204.6
Long ton (tl) 1,016 1.016 1 1.12 2,240
Short ton (tc) 907.2 0.9072 0.893 1 2,000
Pound (lb) 0.454 0.000454 0.000446 0.0005 1 Source: 2013 National Energy Balance - Ministry of Mines and Energy
from
from

2012 LIFE Institute - All rights reserved. Only documents available on the LIFE Institute website can be considered as Official Versions in force.
LIFE-BR-TG01-3.2-English Revision: 5/17/2018
Applicability: Brazil Version: 3.2
LIFE TECHNICAL GUIDE - 01 Calculation of the Biodiversity Impact Index and definition of
minimum performance in Conservation Actions Page 32 of 42
d) Conversion Factors for Volume
Multiplied by
to
m3 l gal (US) gal (UK) bbl ft 3
Cubic meters (m3) 1 1,000 264.2 220 6.289 35.3147
Liters (l) 0.001 1 0.2642 0.22 0.0063 0.0353
Gallons (US) 0.0038 3.785 1 0.8327 0.02381 0.1337
Gallons (UK) 0.0045 4.546 1.201 1 0.02859 0.1605
Barrels (bbl) 0.159 159 42 34.97 1 5.615
Cub feet (feet3) 0.0283 28.3 7.48 6.229 0.1781 1
Source: 2013 National Energy Balance - Ministry of Mines and Energy
e) Conversion Factors for Energy
Multiplied by
to
J BTU cal kWh
Joule (J) 1 947.8 x 10⁻⁶ 0.23884 277.7 x 10⁻⁹
British Thermal Unit (BTU) 1.055 x 10³ 1 252 293.07 x 10⁻⁶
Calorie (cal) 4.1868 3.968 x 10⁻³ 1 1.163 x 10⁻⁶
Kilowatt-hour (kWh) 3.6 x 10⁶ 3412 860 x 103 1
Ton of oil equivalent (toe) 41.87 x 10⁹ 39.68 x 10⁶ 10 x 109 11.63 x 10³
Barrel of oil equivalent (boe) 5.95 x 10⁹ 5.63 x 10⁶ 1.42 x 10⁹ 1.65 x 10³
Source: 2013 National Energy Balance - Ministry of Mines and Energy
f) Mean Coefficients of Equivalence for Gaseous Fuels
Multiplied by to
giga-
calorie
toe
(10,000
kcal/kg)
boe
tec
(7,000
kcal/kg)
giga-
joule
million
s BTU
megawatt-
hour
(860
kcal/kWh)
Piped gas Rio de Janeiro 3.8 0.38 2.68 0.543 15.91 15.08 4.42
Piped gas São Paulo 4.5 0.45 3.17 0.643 18.84 17.86 5.23
Coke oven gas 4.3 0.43 3.03 0.614 18.00 17.06 5.00
Dry natural gas 8.8 0.88 6.20 1.257 36.84 34.92 10.23
Humid natural gas 9.93 0.993 6.99 1.419 41.58 39.40 11.55
Source: 2013 National Energy Balance - Ministry of Mines and Energy
from 1,000 m3
from
from

2012 LIFE Institute - All rights reserved. Only documents available on the LIFE Institute website can be considered as Official Versions in force.
LIFE-BR-TG01-3.2-English Revision: 5/17/2018
Applicability: Brazil Version: 3.2
LIFE TECHNICAL GUIDE - 01 Calculation of the Biodiversity Impact Index and definition of
minimum performance in Conservation Actions Page 33 of 42
g) Mean Coefficients of Equivalence for Liquid Fuels
Multiplied by to
giga-
calorie
toe
(10,000
kcal/kg)
Boe
tec
(7,000
kcal/kg)
giga-
joule
millions
BTU
megawatt-
hour
(860
kcal/kWh)
Anhydrous ethyl alcohol 5.34 0.534 3.76 0.763 22.35 21.19 6.21
Hydrated ethyl alcohol 5.01 0.510 3.59 0.728 21.34 20.22 5.93
Asphalts 10.18 1.018 7.17 1.455 42.63 40.40 11.84
Petroleum coke 8.73 0.873 6.15 1.247 36.53 34.62 10.15
Refinery gas 6.55 0.655 4.61 0.936 27.43 26.00 7.62
Automotive gasoline 7.70 0.770 5.42 1.099 32.22 30.54 8.95
Aviation gasoline 7.63 0.763 5.37 1.090 31.95 30.28 8.88
LPG 6.11 0.611 4.30 0.872 25.56 24.22 7.10
Agents, Lubrication 8.91 0.891 6.27 1.272 37.29 35.34 10.36
Naphtha 7.65 0.765 5.39 1.093 32.05 30.37 8.90
Fuel oil 9.59 0.959 6.75 1.370 40.15 38.05 11.15
Diesel Oil 8.48 0.848 5.97 1.212 35.52 33.66 9.87
Other petroleum based
energy sources 8.90 0.890 6.27 1.271 37.25 35.30 10.35
Other non-petroleum based
energy sources 8.90 0.890 6.27 1.271 37.25 35.30 10.35
Petroleum 8.90 0.890 6.27 1.271 37.25 35.30 10.35
Aviation kerosene 8.22 0.822 5.79 1.174 34.40 32.60 9.56
Illuminating kerosene 8.22 0.822 5.79 1.174 34.40 32.60 9.56
Solvents 7.81 0.781 5.50 1.115 32.69 30.98 9.08 Source: 2013 National Energy Balance - Ministry of Mines and Energy
from m3
2012 LIFE Institute - All rights reserved. Only documents available on the LIFE Institute website can be considered as Official Versions in force.
LIFE-BR-TG01-3.2-English Revision: 5/17/2018
Applicability: Brazil Version: 3.2
LIFE TECHNICAL GUIDE - 01 Calculation of the Biodiversity Impact Index and definition of
minimum performance in Conservation Actions Page 34 of 42
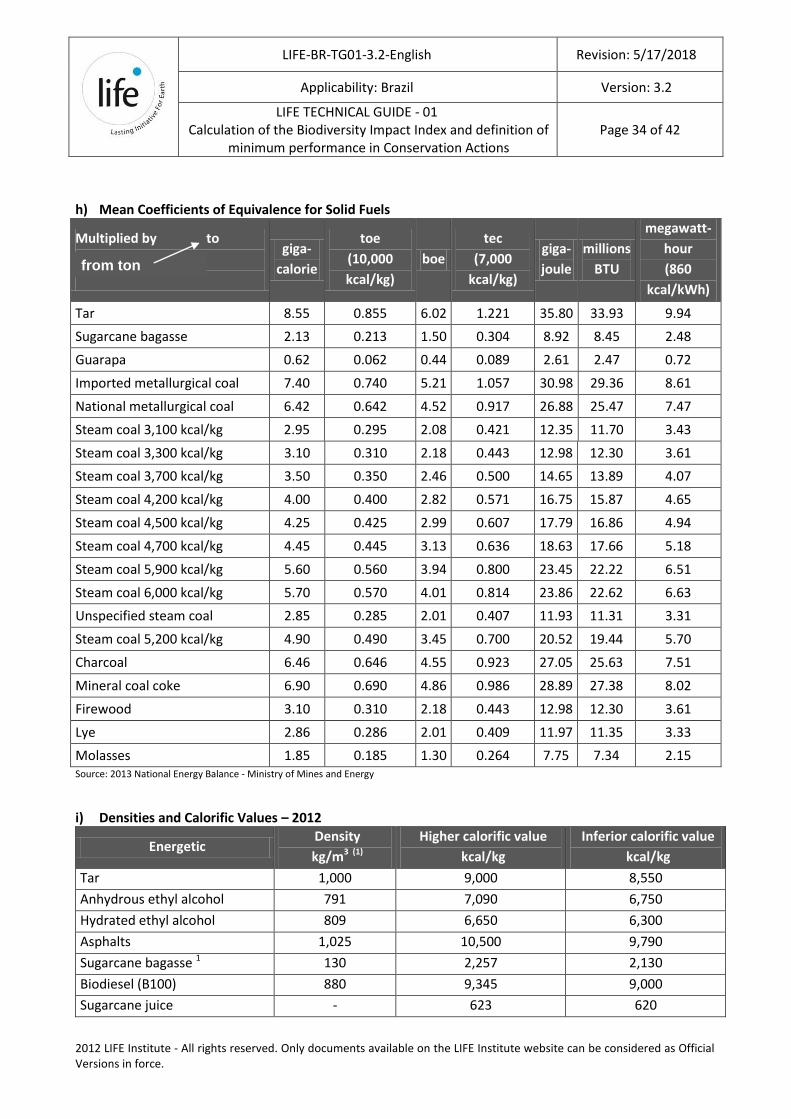
h) Mean Coefficients of Equivalence for Solid Fuels
Multiplied by to
giga-
calorie
toe
(10,000
kcal/kg)
boe
tec
(7,000
kcal/kg)
giga-
joule
millions
BTU
megawatt-
hour
(860
kcal/kWh)
Tar 8.55 0.855 6.02 1.221 35.80 33.93 9.94
Sugarcane bagasse 2.13 0.213 1.50 0.304 8.92 8.45 2.48
Guarapa 0.62 0.062 0.44 0.089 2.61 2.47 0.72
Imported metallurgical coal 7.40 0.740 5.21 1.057 30.98 29.36 8.61
National metallurgical coal 6.42 0.642 4.52 0.917 26.88 25.47 7.47
Steam coal 3,100 kcal/kg 2.95 0.295 2.08 0.421 12.35 11.70 3.43
Steam coal 3,300 kcal/kg 3.10 0.310 2.18 0.443 12.98 12.30 3.61
Steam coal 3,700 kcal/kg 3.50 0.350 2.46 0.500 14.65 13.89 4.07
Steam coal 4,200 kcal/kg 4.00 0.400 2.82 0.571 16.75 15.87 4.65
Steam coal 4,500 kcal/kg 4.25 0.425 2.99 0.607 17.79 16.86 4.94
Steam coal 4,700 kcal/kg 4.45 0.445 3.13 0.636 18.63 17.66 5.18
Steam coal 5,900 kcal/kg 5.60 0.560 3.94 0.800 23.45 22.22 6.51
Steam coal 6,000 kcal/kg 5.70 0.570 4.01 0.814 23.86 22.62 6.63
Unspecified steam coal 2.85 0.285 2.01 0.407 11.93 11.31 3.31
Steam coal 5,200 kcal/kg 4.90 0.490 3.45 0.700 20.52 19.44 5.70
Charcoal 6.46 0.646 4.55 0.923 27.05 25.63 7.51
Mineral coal coke 6.90 0.690 4.86 0.986 28.89 27.38 8.02
Firewood 3.10 0.310 2.18 0.443 12.98 12.30 3.61
Lye 2.86 0.286 2.01 0.409 11.97 11.35 3.33
Molasses 1.85 0.185 1.30 0.264 7.75 7.34 2.15 Source: 2013 National Energy Balance - Ministry of Mines and Energy
i) Densities and Calorific Values – 2012
Energetic Density
kg/m3 (1)
Higher calorific value
kcal/kg
Inferior calorific value
kcal/kg
Tar 1,000 9,000 8,550
Anhydrous ethyl alcohol 791 7,090 6,750
Hydrated ethyl alcohol 809 6,650 6,300
Asphalts 1,025 10,500 9,790
Sugarcane bagasse 1 130 2,257 2,130
Biodiesel (B100) 880 9,345 9,000
Sugarcane juice - 623 620
from ton

2012 LIFE Institute - All rights reserved. Only documents available on the LIFE Institute website can be considered as Official Versions in force.
LIFE-BR-TG01-3.2-English Revision: 5/17/2018
Applicability: Brazil Version: 3.2
LIFE TECHNICAL GUIDE - 01 Calculation of the Biodiversity Impact Index and definition of
minimum performance in Conservation Actions Page 35 of 42
Energetic Density
kg/m3 (1)
Higher calorific value
kcal/kg
Inferior calorific value
kcal/kg
Imported metallurgical coal - 7,700 7,400
National metallurgical coal - 6,800 6,420
Steam coal 3,100 kcal/kg - 3,100 2,950
Steam coal 3,300 kcal/kg - 3,300 3,100
Steam coal 3,700 kcal/kg - 3,700 3,500
Steam coal 4,200 kcal/kg - 4,200 4,000
Steam coal 4,500 kcal/kg - 4,500 4,250
Steam coal 4,700 kcal/kg - 4,700 4,450
Steam coal 5,200 kcal/kg - 5,200 4,900
Steam coal 5,900 kcal/kg - 5,900 5,600
Steam coal 6,000 kcal/kg - 6,000 5,700
Unspecified steam coal - 3,000 2,850
Charcoal 250 6,800 6,460
Mineral coal coke 600 7,300 6,900
Petroleum coke 1,040 8,500 8,390
Electricity 2 - 860 860
Hydraulic Power 2 1,000 860 860
Piped gas Rio de Janeiro 3 - 3,900 3,800
Piped gas São Paulo 3 - 4,700 4,500
Coke oven gas 3 - 4,500 4,300
Refinery gas 0.780 8,800 8,400
Liquefied Petroleum Gas 552 11,750 11,100
Dry natural gas 3,4 0.740 9,256 8,800
Humid natural gas 3,4 0.740 10,454 9,930
Automotive gasoline 742 11,220 10,400
Aviation gasoline 726 11,290 10,600
Gathered firewood 300 3,300 3,100
Commercial firewood 390 3,300 3,100
Lye 1090 3,030 2,860
Agents, Lubrication 875 10,770 10,120
Molasses 1,420 1,930 1,850
Naphtha 702 11,320 10,630
Fuel oil 1,000 10,085 9,590
Diesel Oil 840 10,750 10,100
Other petroleum based energy
sources 864 10,800 10,200
Other non-petroleum based
energy sources 864 10,800 10,200

2012 LIFE Institute - All rights reserved. Only documents available on the LIFE Institute website can be considered as Official Versions in force.
LIFE-BR-TG01-3.2-English Revision: 5/17/2018
Applicability: Brazil Version: 3.2
LIFE TECHNICAL GUIDE - 01 Calculation of the Biodiversity Impact Index and definition of
minimum performance in Conservation Actions Page 36 of 42
Energetic Density
kg/m3 (1)
Higher calorific value
kcal/kg
Inferior calorific value
kcal/kg
Petroleum 884 10,800 10,190
Aviation kerosene 799 11,090 10,400
Illuminating kerosene 799 11,090 10,400
Solvents 741 11,240 10,550 Source: 2013 National Energy Balance - Ministry of Mines and Energy
1 Bagasse with 50% humidity
2 kcal/kWh
3 kcal/m³
4 At a temperature of 20 °C, for derivatives of petroleum and natural gas
j) Conversion Factors for mean toe
Energy Source Unit toe
Tar m3 0.855
Anhydrous ethyl alcohol m3 0.534
Hydrated ethyl alcohol m3 0.510
Asphalts m3 1.018
Sugarcane bagasse T 0.213
Biodiesel (B100) m3 -
Guarapa T 0.062
Imported metallurgical coal T 0.740
National metallurgical coal T 0.642
Steam coal 3,100 kcal/kg T 0.295
Steam coal 3,300 kcal/kg T 0.310
Steam coal 3,700 kcal/kg T 0.350
Steam coal 4,200 kcal/kg T 0.400
Steam coal 4,500 kcal/kg T 0.425
Steam coal 4,700 kcal/kg T 0.445
Steam coal 5,200 kcal/kg T 0.490
Steam coal 5,900 kcal/kg T 0.560
Steam coal 6,000 kcal/kg T 0.570
Unspecified steam coal T 0.285
Charcoal T 0.646
Mineral coal coke T 0.690
Petroleum coke m3 0.873
Electricity MWh 0.086
Piped gas Rio de Janeiro 103m
3 0.880
Piped gas São Paulo 103m
3 0.450

2012 LIFE Institute - All rights reserved. Only documents available on the LIFE Institute website can be considered as Official Versions in force.
LIFE-BR-TG01-3.2-English Revision: 5/17/2018
Applicability: Brazil Version: 3.2
LIFE TECHNICAL GUIDE - 01 Calculation of the Biodiversity Impact Index and definition of
minimum performance in Conservation Actions Page 37 of 42
Energy Source Unit toe
Coke oven gas 103m
3 0.430
Refinery gas 103m
3 0.655
Liquefied petroleum gas m3 0.611
Dry natural gas 103m
3 0.880
Humid natural gas 103m
3 0.993
Automotive gasoline m3 0.770
Aviation gasoline m3 0.763
Hydraulic MWh 0.086
Commercial firewood T 0.310
Lye T 0.286
Agents, Lubrication m3 0.891
Molasses T 0.185
Naphtha m3 0.765
Fuel oil (medium) m3 0.959
Diesel Oil m3 0.848
Other non-renewable Toe 1.000
Other renewable Toe 1.000
Other petroleum based energy sources m3 0.890
Other non-petroleum based energy
sources m
3 0.890
Petroleum m3 0.891
Aviation kerosene m3 0.822
Illuminating kerosene m3 0.822
Solvents m3 0.781
Uranium contained in UO2 Kg 73.908
Uranium U3O8 Kg 10.139
Source: 2015 National Energy Balance - Ministry of Mines and Energy

2012 LIFE Institute - All rights reserved. Only documents available on the LIFE Institute website can be considered as Official Versions in force.
LIFE-BR-TG01-3.2-English Revision: 5/17/2018
Applicability: Brazil Version: 3.2
LIFE TECHNICAL GUIDE - 01 Calculation of the Biodiversity Impact Index and definition of
minimum performance in Conservation Actions Page 38 of 42
6. Scopes Brazilian GHG Protocol Program
Sector Emission Source Scope 1 Emission Source Scope 2 Emission Source Scope 3
Energy
Generation of
Energy
Stationary combustion (boilers and turbines used in
the production of energy, heat, or steam; fuel pumps;
fuel cells; burning of discarded gases or flaring)
Mobile combustion (trucks, vessels, and trains for
transporting fuels)
Fugitive emissions (CH4 leak from transmission and
from storage installations; HFC emissions from storage
installations; SF6 emissions from transmission and
distribution equipment)
Stationary combustion (energy
consumption, heat or steam
acquired)
Stationary combustion (mining and extraction of
fuels, energy for refining and processing of
fuels)
Process emissions (productions of fuels, SF6 emissions)
Mobile combustion (transport of fuels / waste, business
trips, employee commuting to-from work)
Fugitive emissions (CH4 and CO2 from landfills, pipelines,
SF6 emissions)
Oil & Gas
Stationary combustion (process heaters, motors,
turbines, burning of discarded gases or flaring,
incinerators, oxidants, production of electricity, heat,
and steam)
Process emissions (process vents, equipment vents,
routine and maintenance activities, non-routine
activities)
Mobile combustion (transport of raw materials,
products, waste; vehicles belonging to the company)
Stationary combustion (energy
consumption, heat or steam
acquired)
Stationary combustion (use of products as fuel or
combustion for the production of acquired materials)
Mobile combustion (transport of raw materials,
products, and waste; employees’ business trips; employee
commuting to-from work; use of products as fuel)
Process emissions (use of product as raw material or
emissions resulting from the production of acquired
materials)
Fugitive emissions (CH4 and CO2 from landfills or from
the production of acquired materials)

2012 LIFE Institute - All rights reserved. Only documents available on the LIFE Institute website can be considered as Official Versions in force.
LIFE-BR-TG01-3.2-English Revision: 5/17/2018
Applicability: Brazil Version: 3.2
LIFE TECHNICAL GUIDE - 01 Calculation of the Biodiversity Impact Index and definition of
minimum performance in Conservation Actions Page 39 of 42
Sector Emission Source Scope 1 Emission Source Scope 2 Emission Source Scope 3
Fugitive emissions (leaks from pressurized
equipment, sewage treatment, dams)
Coal Mining
Stationary combustion (flaring and use of methane,
use of explosives, fires in mines)
Mobile combustion (mining equipment, transport of
coal)
Fugitive emissions (CH4 emissions from coal mines
and coal deposits)
Stationary combustion (energy
consumption, heat or steam
acquired)
Stationary combustion (use of product as fuel)
Mobile combustion (transport of coal or waste,
employees’ business trips, employee commuting to-from
work)
Process emissions (gasification)
Metals
Aluminum
Stationary combustion (processing of bauxite into
aluminum; coke baking; use of lime; sodium carbonate
and fuel; CHP)
Process emissions (anodic oxidation, electrolysis,
PFC)
Mobile combustion (transport pre-and post-casting
smelting, ore trucks)
Fugitive emissions (CH4, HFC and PFC from fuel
pipes, SF6 as blanket gas)
Stationary combustion (energy
consumption, heat or steam
acquired)
Stationary combustion (processing of raw materials and
production of coke by third parties, manufacture of
machinery for the production line)
Mobile combustion (transport services, business trips,
employee’s trips)
Process emissions (during the production of acquired
materials)
Fugitive emissions (CH4 and CO2 from mining and
landfills, emissions from outsourced processes)
Iron and steel
Stationary combustion (flows of coke, coal, and
carbonate; boilers; burners)
Process emissions (oxidation of pig-iron,
consumption of reducing agent, carbon content of pig-
iron and ferroalloys)
Mobile combustion (on-site transport)
Fugitive emissions (CH4, N2O)
Stationary combustion (energy
consumption, heat or steam
acquired)
Stationary combustion (mining equipment, production
of acquired materials)
Process emissions (production of ferroalloys)
Mobile combustion (transport of raw materials,
products, waste and intermediary products)
Fugitive emissions (CH4 and CO2 from sanitary landfills)

2012 LIFE Institute - All rights reserved. Only documents available on the LIFE Institute website can be considered as Official Versions in force.
LIFE-BR-TG01-3.2-English Revision: 5/17/2018
Applicability: Brazil Version: 3.2
LIFE TECHNICAL GUIDE - 01 Calculation of the Biodiversity Impact Index and definition of
minimum performance in Conservation Actions Page 40 of 42
Sector Emission Source Scope 1 Emission Source Scope 2 Emission Source Scope 3
Chemicals
Nitric acid,
ammonia, adipic
acid, urea,
petrochemicals
Stationary combustion (boilers, burners, reducing
furnaces, flame reactors, steam reformers)
Process emissions (oxidation or reduction of
substrates, removal of impurities, N2O by-products,
catalytic cracking, and several other individual
emissions from each process)
Mobile combustion (transport of raw materials,
products and waste)
Fugitive emissions (use of HFC, leakage from
storage tanks)
Stationary combustion (energy
consumption, heat or steam
acquired)
Stationary combustion (production of acquired
materials, waste combustion)
Process emissions (production of acquired materials)
Mobile combustion (transport of raw materials,
products and waste; business trips, employee commuting
to-from work)
Fugitive emissions (CH4 and CO2 from sanitary landfills
and ducts)
Minerals
Cement and lime
Process emissions (calcination of limestone)
Stationary combustion (clinker over, drying of raw
materials, energy production)
Mobile combustion (quarry operations, on-site
transport)
Stationary combustion (energy
consumption, heat or steam
acquired)
Stationary combustion (production of acquired
materials, waste combustion)
Process emissions (production of acquired clinker and
lime)
Mobile combustion (transport of raw materials,
products and waste; business trips, employee commuting
to-from work)
Waste
Landfills,
waste
combustion,
water
services
Stationary combustion (incinerators, boilers,
burners)
Process emissions (sewage treatment, nitrogen
loading)
Fugitive emissions (emissions of CH4 and CO2 from
Stationary combustion (energy
consumption, heat or steam
acquired)
Stationary combustion (recycled waste used as fuel)
Process emissions (recycled waste used as raw
materials)
Mobile combustion (transport of waste or products,
business trips, employee commuting to-from work)

2012 LIFE Institute - All rights reserved. Only documents available on the LIFE Institute website can be considered as Official Versions in force.
LIFE-BR-TG01-3.2-English Revision: 5/17/2018
Applicability: Brazil Version: 3.2
LIFE TECHNICAL GUIDE - 01 Calculation of the Biodiversity Impact Index and definition of
minimum performance in Conservation Actions Page 41 of 42
Sector Emission Source Scope 1 Emission Source Scope 2 Emission Source Scope 3
the decomposition of waste and animal product)
Mobile combustion (transport of waste or
products)
Pulp & Paper
Pulp & Paper
Stationary combustion (production of steam and
energy, emissions derived from fossil fuels from the
calcination of calcium carbonate in lime ovens, drying
of products using infrared dryers powered by fossil
fuels)
Mobile combustion (transport of raw materials,
products, and waste; operation of harvesting
equipment)
Fugitive emissions (CH4 and CO2 from waste)
Stationary combustion (energy
consumption, heat or steam
acquired)
Stationary combustion (production of acquired
materials, waste combustion)
Process emissions (production of acquired materials)
Mobile combustion (transport of raw materials,
products, and waste; business trips, employee commuting
to-from work)
Fugitive emissions (landfill emissions of CH4 and CO2)
Production of HFC, PFC, SF6 and HCFC-22
Production of
HCFC-22
Stationary combustion (energy consumption, heat
or steam)
Process emissions (ventilation of HFC)
Mobile combustion (transport of raw materials,
products and waste)
Fugitive emissions (use of HFC)
Stationary combustion (energy
consumption, heat or steam
acquired)
Stationary combustion (production of acquired
materials)
Process emissions (production of acquired materials)
Mobile combustion (transport of raw materials,
products and waste; business trips, employee commuting
to-from work)
Fugitive emissions (leakages in the use of the product,
CH4 and CO2 from landfills)
Production of Semiconductors
Production of
Semiconductors
Process emissions ((C2F6, CH4, CHF3, SF6, NF3, C3F8,
C4F8, N2O used in the fabrication of wafers, CH4
Stationary combustion
(consumption of energy, heat or
Stationary combustion (production of imported
materials, combustion of waste, losses in T&D of energy
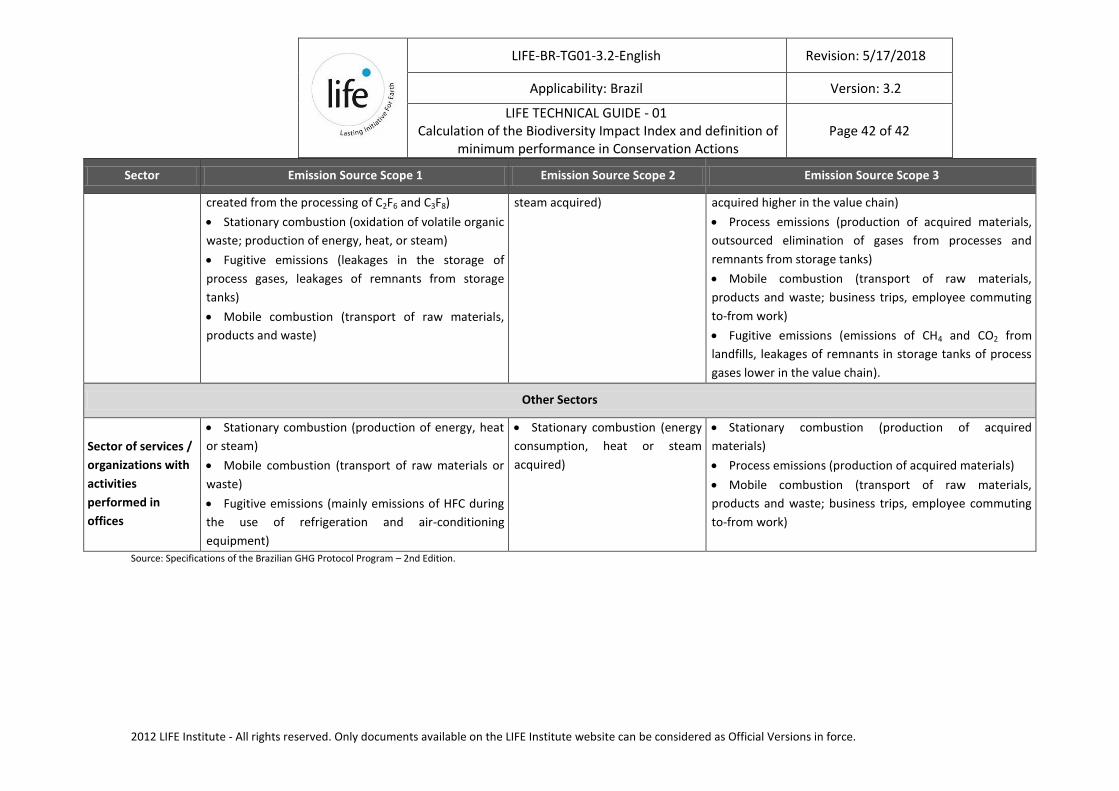
2012 LIFE Institute - All rights reserved. Only documents available on the LIFE Institute website can be considered as Official Versions in force.
LIFE-BR-TG01-3.2-English Revision: 5/17/2018
Applicability: Brazil Version: 3.2
LIFE TECHNICAL GUIDE - 01 Calculation of the Biodiversity Impact Index and definition of
minimum performance in Conservation Actions Page 42 of 42
Sector Emission Source Scope 1 Emission Source Scope 2 Emission Source Scope 3
created from the processing of C2F6 and C3F8)
Stationary combustion (oxidation of volatile organic
waste; production of energy, heat, or steam)
Fugitive emissions (leakages in the storage of
process gases, leakages of remnants from storage
tanks)
Mobile combustion (transport of raw materials,
products and waste)
steam acquired) acquired higher in the value chain)
Process emissions (production of acquired materials,
outsourced elimination of gases from processes and
remnants from storage tanks)
Mobile combustion (transport of raw materials,
products and waste; business trips, employee commuting
to-from work)
Fugitive emissions (emissions of CH4 and CO2 from
landfills, leakages of remnants in storage tanks of process
gases lower in the value chain).
Other Sectors
Sector of services /
organizations with
activities
performed in
offices
Stationary combustion (production of energy, heat
or steam)
Mobile combustion (transport of raw materials or
waste)
Fugitive emissions (mainly emissions of HFC during
the use of refrigeration and air-conditioning
equipment)
Stationary combustion (energy
consumption, heat or steam
acquired)
Stationary combustion (production of acquired
materials)
Process emissions (production of acquired materials)
Mobile combustion (transport of raw materials,
products and waste; business trips, employee commuting
to-from work)
Source: Specifications of the Brazilian GHG Protocol Program – 2nd Edition.