Embed Size (px)
Citation preview
Life Sciences Industry 2017:The Backdrop for R&D Decision-Making
Peter RayExecutive Director/Corporate Strategy
Aug 8, 2017
CHANGING THE COURSE OF
HUMAN HEALTH THROUGH BOLD
PURSUITS IN SCIENCE
The viewpoints and perspectives presented in this presentation are the personal opinion of the author and do not necessarily represent the official policy or beliefs of Celgene Corporation or its senior management and official representatives.
Disclaimer

The “secret” connection between R&D decision-making and industry productivity…

Scientific innovation is deepening our understanding of human biology, with major advancements in proteomics and genomics...
Strictly confidential – for internal use only
Sources: https://www.humancellatlas.org/ July 5, 2017MRSBulletin “CRISPR: Implications for materials science” by Philip Ball, 11/17/2016
... identify and locate genes associated with disease, and analyze the mechanisms that govern the production of different cell types...
Sanger Institute, Broad Institute, Chan Zuckerberg Biohub
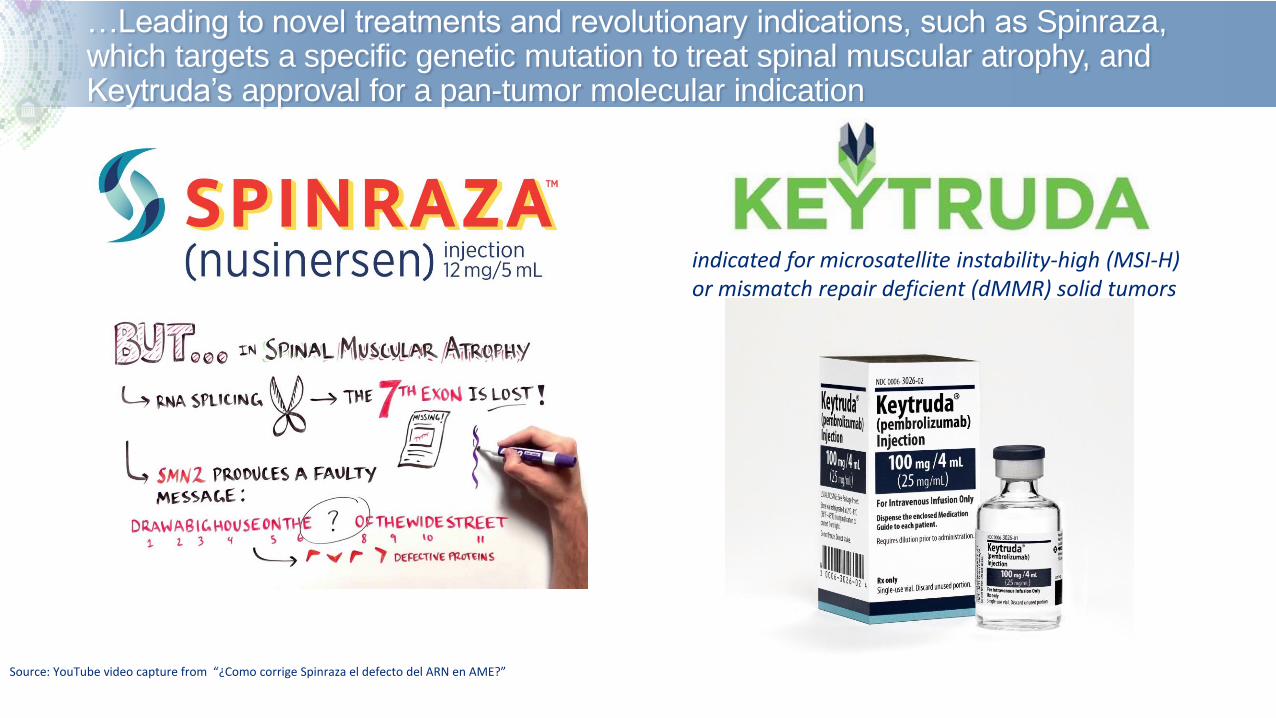
…Leading to novel treatments and revolutionary indications, such as Spinraza, which targets a specific genetic mutation to treat spinal muscular atrophy, and Keytruda’s approval for a pan-tumor molecular indication
indicated for microsatellite instability-high (MSI-H) or mismatch repair deficient (dMMR) solid tumors
Source: YouTube video capture from “¿Como corrige Spinraza el defecto del ARN en AME?”

Mortality Rates Have Fallen; Investment in Healthcare R&D Has Risen*
6
Source 5: Kochanek K D, Murphy S L, Xu J, Tejada-Vera B. Division of Vital Statistics. U.S. Department of Health and Human Services. Centers for Disease Control and Prevention. National Vital
Statistics Reports. Volume 65, Number 4. June 30,2016. Table 1. Number of deaths, death rates, and age-adjusted death rates, by race and sex: United States, 1940, 1950, 1960, 1970, and 1980–
2014—Con. Available at https://www.cdc.gov/nchs/data/nvsr/nvsr65/nvsr65_04.pdf. Accessed July 2017.
Source 5 a: Pharmaceutical Research and Manufacturers of America (PhRMA). 2015 Profile: Biopharmaceutical Research Industry. Table 1: Domestic R&D and R&D Abroad, PhRMA Member
Companies: 1980-2014. Available at http://www.phrma.org/sites/default/files/pdf/2014_PhRMA_PROFILE.pdf. Accessed July 2017.
$1,976.7
$8,420.3
$26,030.8
$39,857.9 $42,973.5
$47,903.1
$47,383.1
$46,441.6
$50,709.8
$48,645.0
$49,587.6
$51,613.6
$53,000.3
$58,000.8
0
10000
20000
30000
40000
50000
60000
70000
1980 1990 2000 2005 2006 2007 2008 2009 2010 2011 2012 2013 2014 2015
Millions of dollars in
R&DR&D investment
1039.1
938.7
869.0
815.0
791.8775.3
774.9
749.6
747.0
741.3
732.8
731.9
724.6
650
700
750
800
850
900
950
1000
1050
1100
1980 1990 2000 2005 2006 2007 2008 2009 2010 2011 2012 2013 2014
Death per 100,000
Mortality rate (All Causes)
0
*R&D spend for PhRMA members only

0
10
20
30
40
50
60
1993 1995 1997 1999 2001 2003 2005 2007 2009 2011 2013 2015 2017*
NBE
NME
New drug approvals are rising again after several years of decline…
US FDA NME/NBE Approvals, 1993-2016
Source: US FDA ; * 2017 is as of July 28 (not full year)

Five-Year Survival is Increasing for Many Types of Cancer
8
The chances that a cancer patient will live 5 years or more has increased on average by 41% across all cancers
0%
10%
20%
30%
40%
50%
60%
70%
80%
90%
100%
Breast Cancer Prostate Cancer Colon/Rectum Lung/Bronchus1975 2013
83%of survival gains in
cancer are attributable to
new treatments including medicines
5-year relative survival rate for
selected cancers
Source 8: Pharmaceutical Research and Manufacturers of America. PhRMA Chart Pack: Cancer Medicines Value in Context. Spring 2014. Chapter 1, slide 3. Available at http://www.phrma.org/sites/default/files/pdf/cancer-chart-pack-5-22-14.pdf. Accessed August, 2015. National Cancer Institute. Cancer Trends Progress Report – 2007 Update. 5‐year relative survival for the most common cancers, 1975‐2006. Available at http://progressreport.cancer.gov/after/survival#field_description. Accessed August, 2015. National Cancer Institute. Cancer Trends Progress Report – 2007 Update. 5‐year relative survival for all cancer sites combined by sex, 1975‐2006. Available at http://progressreport.cancer.gov/after/survival#field_description. Accessed August, 2015. National Cancer Institute. Cancer Stat Facts. Available at https://seer.cancer.gov/statfacts/. Accessed on January 2017.
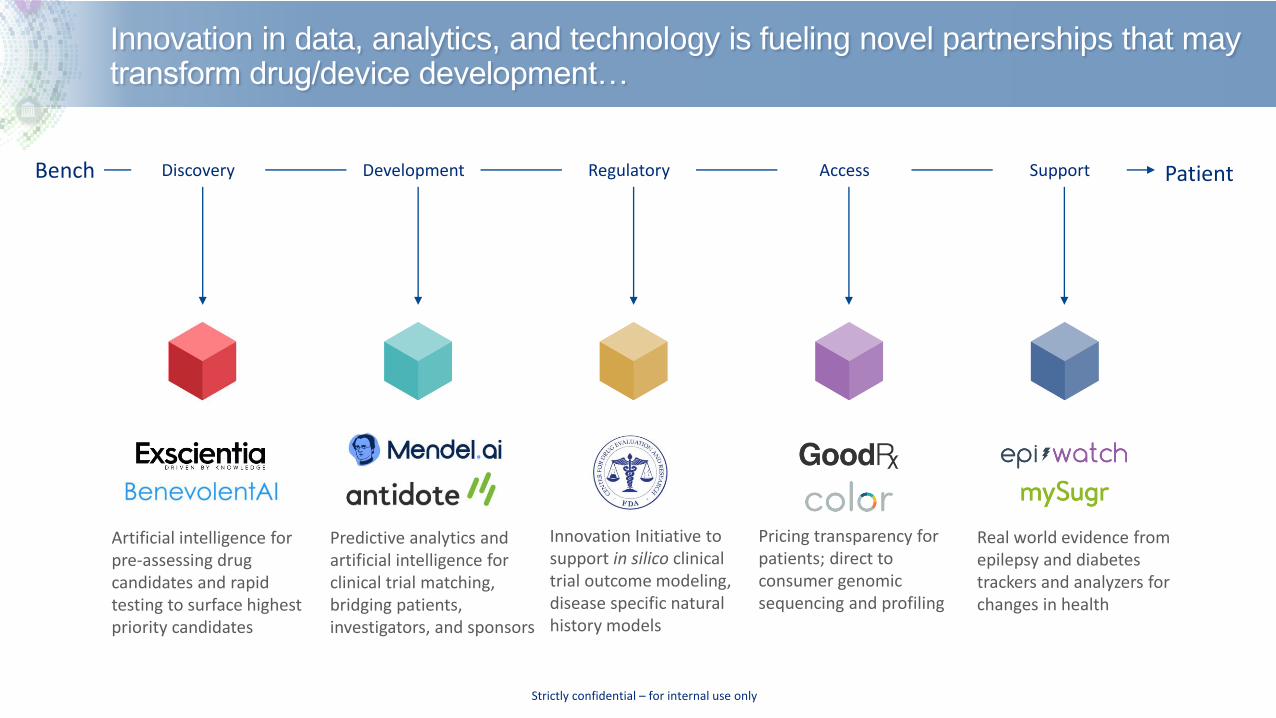
Innovation in data, analytics, and technology is fueling novel partnerships that may transform drug/device development…
Strictly confidential – for internal use only
Bench PatientDiscovery Development Regulatory Access Support
Artificial intelligence for pre-assessing drug candidates and rapid testing to surface highest priority candidates
Predictive analytics and artificial intelligence for clinical trial matching, bridging patients, investigators, and sponsors
Innovation Initiative to support in silico clinical trial outcome modeling, disease specific natural history models
Pricing transparency for patients; direct to consumer genomic sequencing and profiling
Real world evidence from epilepsy and diabetes trackers and analyzers for changes in health

Industry investor returns have significantly outperformed the S&P 500 over the past decade
Source: Fidelity Investments
BTK: NYSE Arca Biotechnology IndexNBI: NASDAQ Biotechnology IndexSPSIPH: S&P Pharmaceuticals Select Index

Clouds on the horizon…

In spite of some positive signs, R&D productivity remains a formidable challenge…

…with one analysis suggesting that many established pharmacoshave an R&D IRR% well below their cost of capital
Min
Max
25%
75%50%
17.0%
14.1%
8.4%6.7%
6.0%
5.0% 4.8%
-5%
0%
5%
10%
15%
20%
1 2 3 4 5
Ab
solu
te IR
R (
%)
Source: Deloitte proprietary research, “Balancing the R&D Equation: Measuring the Return from Pharmaceutical Innovation 2016”Companies: • Original cohort: Amgen, AZ, BMS, Eli Lilly, GSK, J&J, Merck, Novartis, Pfizer, Roche, Sanofi, Takeda• Extension cohort: Celgene, AbbVie, Biogen, Gilead
2010-2012 2011-2013 2012-2014 2013-2015 2014-2016
Original Cohort
Extension Cohort
Average Return (3-Yr Rolling) on Late Stage Portfolio, 2010-2016
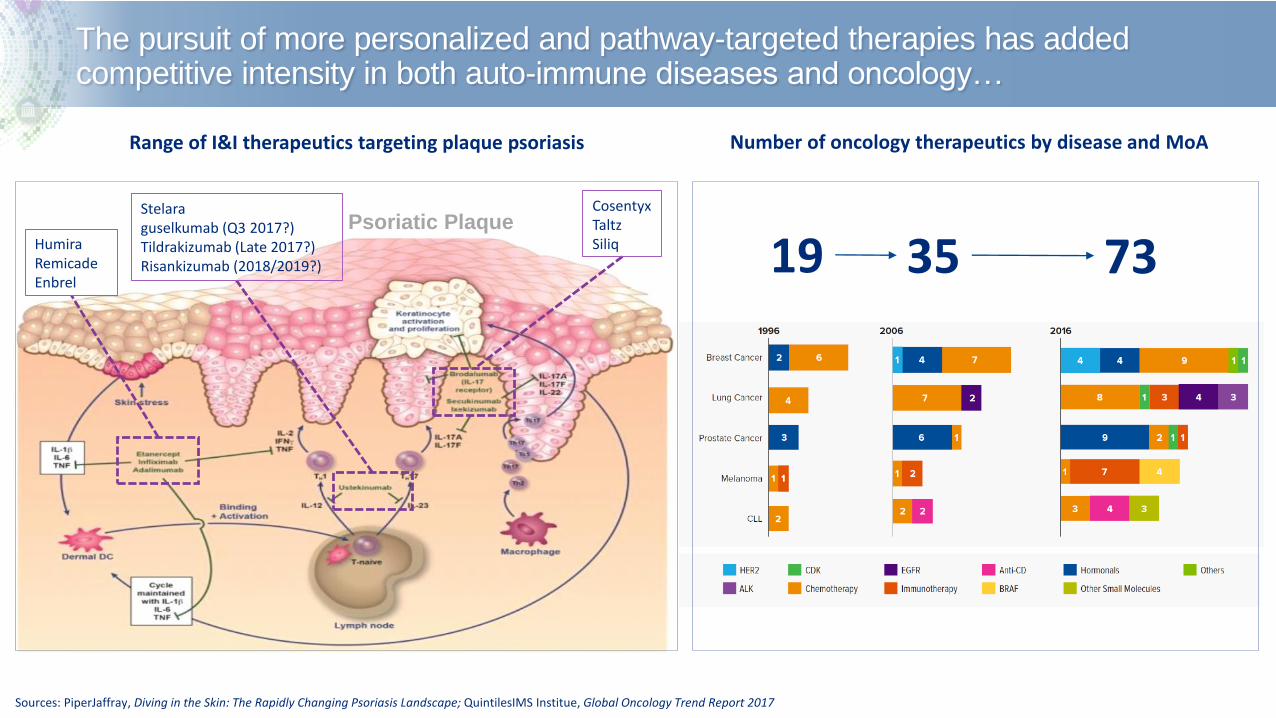
The pursuit of more personalized and pathway-targeted therapies has added competitive intensity in both auto-immune diseases and oncology…
Number of oncology therapeutics by disease and MoA
19 35 73
Sources: PiperJaffray, Diving in the Skin: The Rapidly Changing Psoriasis Landscape; QuintilesIMS Institue, Global Oncology Trend Report 2017
HumiraRemicadeEnbrel
CosentyxTaltzSiliq
Psoriatic Plaque
Range of I&I therapeutics targeting plaque psoriasis
Stelaraguselkumab (Q3 2017?)Tildrakizumab (Late 2017?)Risankizumab (2018/2019?)
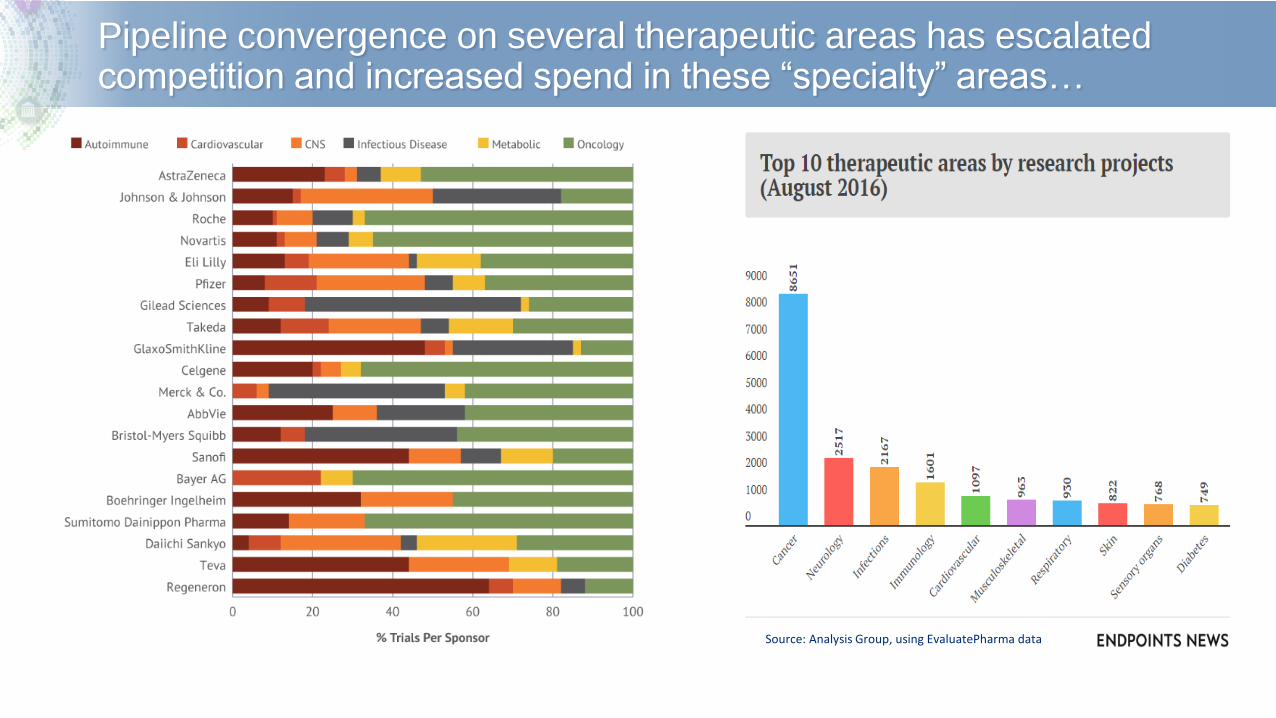
Pipeline convergence on several therapeutic areas has escalated competition and increased spend in these “specialty” areas…
Source: Analysis Group, using EvaluatePharma data

Global drug spending is expected to accelerate in the next 5 years, partially driven by the rise of innovative combination therapies in these “specialty” disease areas…
Source: EvaluatePharma, World Preview 2016, Outlook to 2022
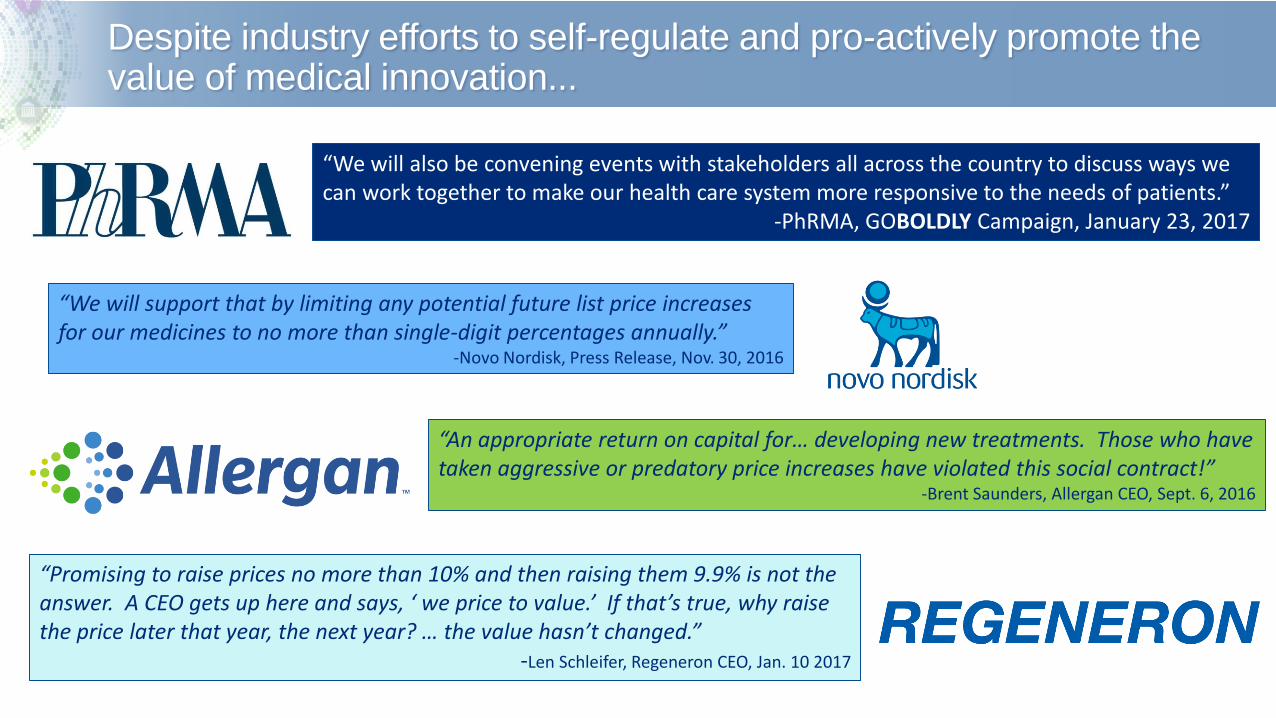
Despite industry efforts to self-regulate and pro-actively promote the value of medical innovation...
“Promising to raise prices no more than 10% and then raising them 9.9% is not the answer. A CEO gets up here and says, ‘ we price to value.’ If that’s true, why raise the price later that year, the next year? … the value hasn’t changed.”
-Len Schleifer, Regeneron CEO, Jan. 10 2017
“We will support that by limiting any potential future list price increases for our medicines to no more than single-digit percentages annually.”
-Novo Nordisk, Press Release, Nov. 30, 2016
“An appropriate return on capital for… developing new treatments. Those who have taken aggressive or predatory price increases have violated this social contract!”
-Brent Saunders, Allergan CEO, Sept. 6, 2016
“We will also be convening events with stakeholders all across the country to discuss ways we can work together to make our health care system more responsive to the needs of patients.”
-PhRMA, GOBOLDLY Campaign, January 23, 2017

There is increasing interest in using performance-, outcomes- and value-based pricing models
Future and Innovative Pricing Models
Source: EY, “The US Drug Pricing Debate 2017”
Source: Avalere, “Health Plans are Interested in Tying Drug Payments to Patient Outcomes,” Rujul Desai, June 16, 2016

Patient access is crucial to realizing the full potential impact of these better targeted, more personalized therapies on patient outcomes and the entire health care ecosystem
“Precision medicines are dramatically changing the treatment landscape for deadly cancers like non-small cell lung cancer and metastatic melanoma, not only increasing survival rates but also reducing the need for the costly procedures and hospitalizations that are now part of the standard of care for these diseases….
To realize the promise of precision medicines, we must act collectively across the health-care ecosystem to ensure that patients who desperately need these transformational therapies have access to them.”
Mark Alles, Celgene CEO
Source: Mark Alles, “Getting Patients Access to ‘Precision’ Medicine Is Crucial,” published on CNBC.com on August 3, 2017
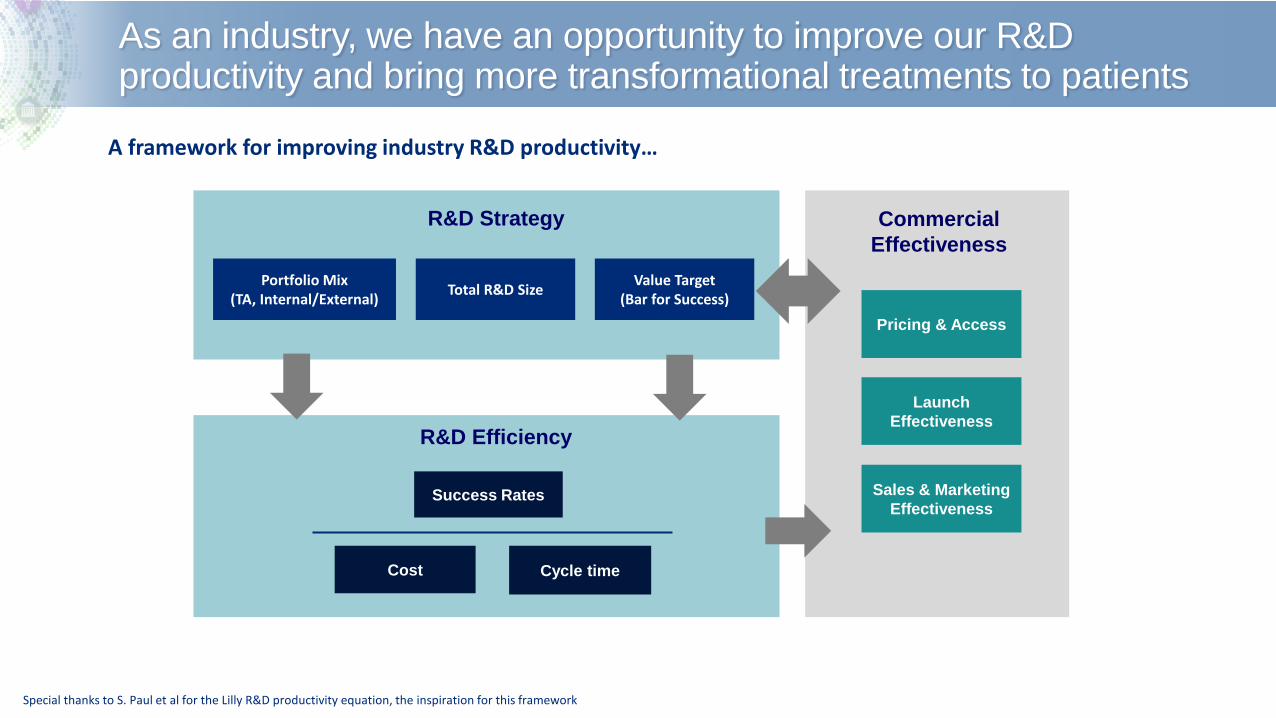
As an industry, we have an opportunity to improve our R&D productivity and bring more transformational treatments to patients
R&D Strategy
R&D Efficiency
Commercial
Effectiveness
Portfolio Mix(TA, Internal/External)
Total R&D Size
Success Rates
Cost Cycle time
Launch
Effectiveness
Pricing & Access
Sales & Marketing
Effectiveness
Value Target(Bar for Success)
Special thanks to S. Paul et al for the Lilly R&D productivity equation, the inspiration for this framework
A framework for improving industry R&D productivity…

A framework for our Strategic Portfolio Management Summit
R&D Strategy
Portfolio Mix(TA, Internal/External)
Total R&D Size
Success Rates
Cost Cycle time
Launch
Effectiveness
Pricing & Access
Sales & Marketing
Effectiveness
Value Target(Bar for Success)
Session 1: R&D Portfolio Strategy
Special thanks to S. Paul et al for the Lilly R&D productivity equation, the inspiration for this framework

A framework for our Strategic Portfolio Management Summit
R&D Strategy
R&D Efficiency
Commercial
Effectiveness
Portfolio Mix(TA, Internal/External)
Total R&D Size
Success Rates
Cost Cycle time
Launch
Effectiveness
Pricing & Access
Sales & Marketing
Effectiveness
Value Target(Bar for Success)
Session 2: Strategic Portfolio Management
Special thanks to S. Paul et al for the Lilly R&D productivity equation, the inspiration for this framework
Special thanks to S. Paul et al for the Lilly R&D productivity equation, the inspiration for this framework
A framework for our Strategic Portfolio Management Summit
R&D Efficiency
Portfolio Mix(TA, Internal/External)
Total R&D Size
Success Rates
Cost Cycle time
Launch
Effectiveness
Pricing & Access
Sales & Marketing
Effectiveness
Value Target(Bar for Success)
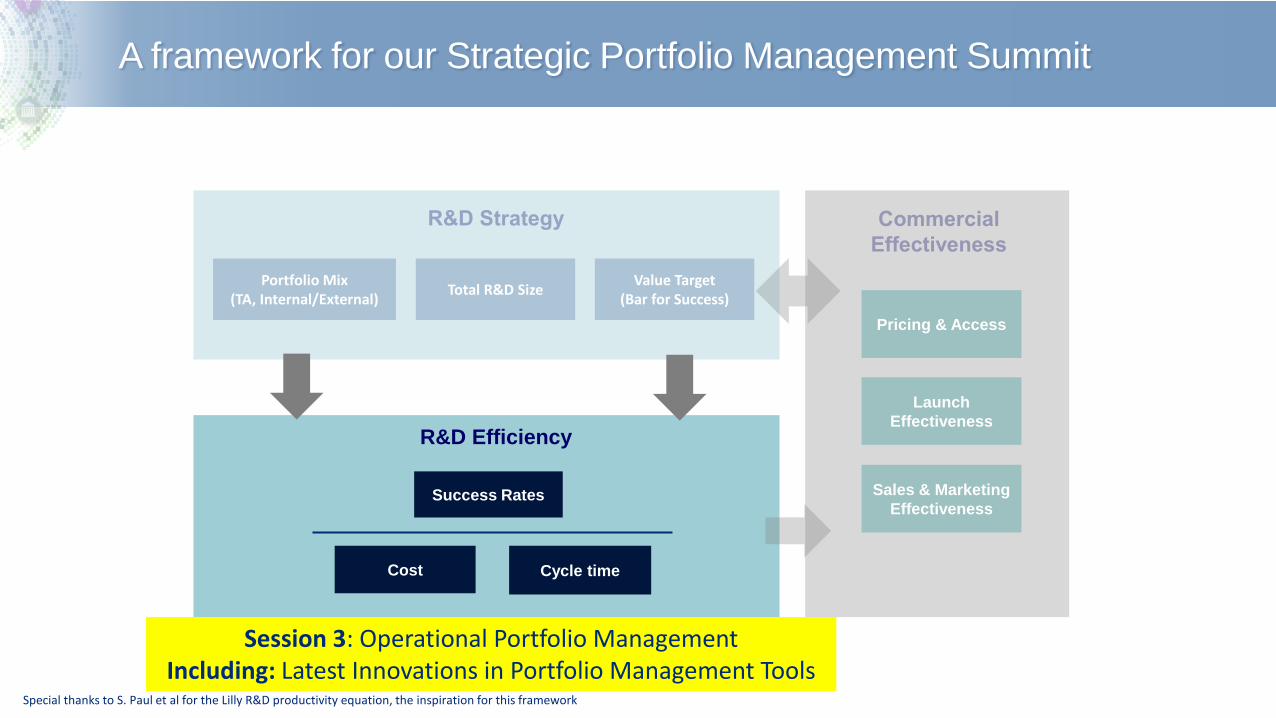
Session 3: Operational Portfolio ManagementIncluding: Latest Innovations in Portfolio Management Tools

Special thanks to S. Paul et al for the Lilly R&D productivity equation, the inspiration for this framework
A framework for our Strategic Portfolio Management Summit
R&D Efficiency
Commercial
Effectiveness
Portfolio Mix(TA, Internal/External)
Total R&D Size
Cost Cycle time
Launch
Effectiveness
Pricing & Access
Sales & Marketing
Effectiveness
Value Target(Bar for Success)
Session 4: Asset StrategyIncluding: Connecting AI and Human Experience to Increase Pipeline Productivity
Success Rates

How to integrate R&D decision-making across all levels, striking the right balance between speed and rigor, avoiding both undue complexity and over-simplification?
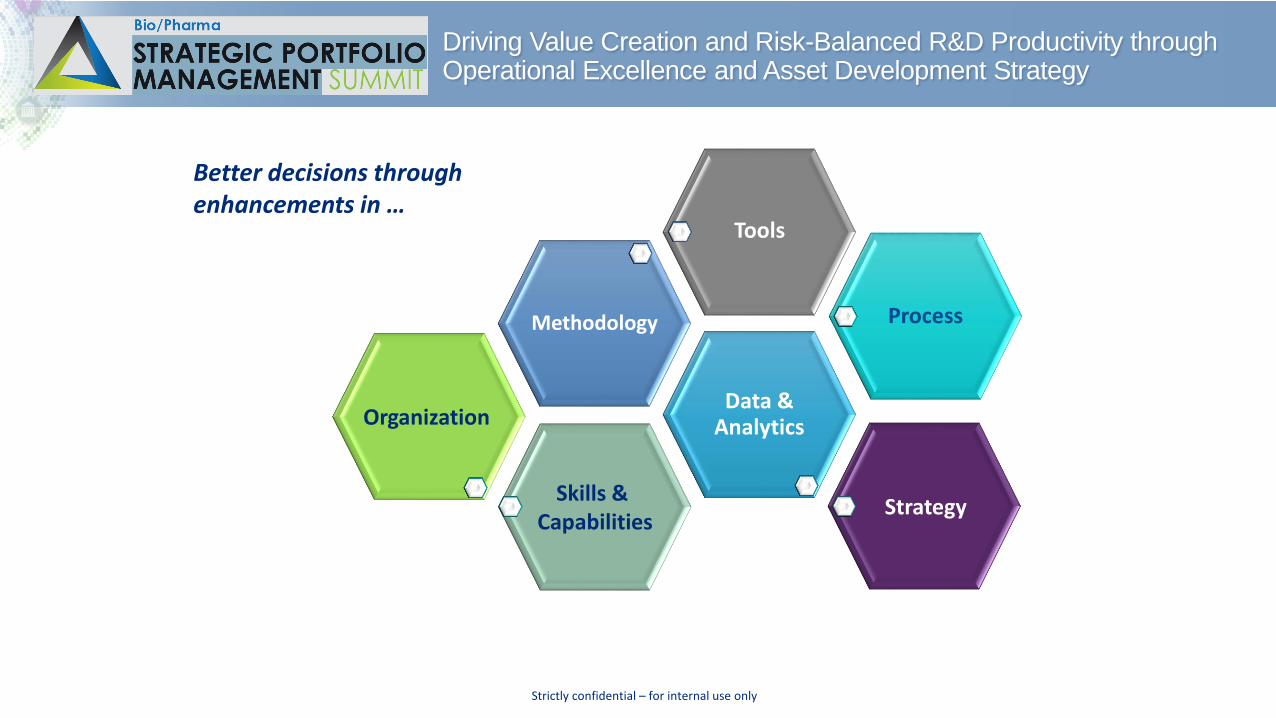
Process
Data & Analytics
Methodology
Strictly confidential – for internal use only
Driving Value Creation and Risk-Balanced R&D Productivity through Operational Excellence and Asset Development Strategy
Tools
Organization
Strategy
Better decisions through enhancements in …
Skills & Capabilities

Welcome!