Embed Size (px)
Citation preview

Ecological Monographs, 85(3), 2015, pp. 393–412� 2015 by the Ecological Society of America
Life in the treetops: ecophysiological strategies of canopy epiphytesin a tropical montane cloud forest
SYBIL G. GOTSCH,1,4 NALINI NADKARNI,2 ALEXANDER DARBY,1 ANDREW GLUNK,1 MACKENZIE DIX,1
KENNETH DAVIDSON,1 AND TODD E. DAWSON3
1Department of Biology, Franklin and Marshall College, P.O. Box 3003, Lancaster, Pennsylvania 17603 USA2Department of Biology, University of Utah, Salt Lake City, Utah 84112-0840 USA
3Department of Integrative Biology, University of California at Berkeley, Valley Life Sciences Building,Berkeley, California 94720 USA
Abstract. Tropical montane cloud forests (TMCFs) inhabit regions rich in biodiversitythat play an important role in the local and regional water cycle. Canopy plants such asepiphytes and hemiepiphytes are an important component of the biodiversity in the TMCFand therefore play a significant role in the carbon, nutrient, and water cycles. With only partialor no access to resources on the ground, canopy plants may be vulnerable to changes inclimate that increase canopy temperatures and decrease atmospheric humidity or precipitationinputs. Despite their importance in the TMCF, little is known about variation in functionalstrategies relating to drought avoidance or drought tolerance of canopy plants. In this study,we quantified variation in a number of functional traits in 11 species of epiphytes andhemiepiphytes in a Costa Rican TMCF. We also generated pressure–volume and xylemvulnerability curves that we used as indicators of drought tolerance. In addition, we hand-sectioned fresh leaves and examined cross sections under a microscope to quantify leafthickness, mesophyll thickness and the thickness of water storage cell layers (i.e.,hydrenchyma), if present. Lastly, we determined the capacity for foliar water uptake in thelaboratory and measured whole-plant transpiration in the field.
A trade-off was found between traits that confer relative drought resistance and foliarwater uptake capacity vs. traits that confer leaf capacitance and relative drought avoidance.This trade-off may represent an additional axis of the leaf economics spectrum that is uniqueto epiphytes. We also found that all species had the capacity for foliar uptake of water andthat this process contributed substantially to their water balance. On average, foliar uptake ofwater contributed to the reabsorption of 70% of the water transpired over a relatively wet, 34-day study period. Our results indicate that canopy plants can mitigate water loss substantiallyvia internal water storage or that they can directly utilize cloud water to offset losses. Ourresults indicate that species that rely on foliar uptake of water may be more vulnerable toprojected changes in climate than species that buffer the effects of drought via internal waterstorage.
Key words: capacitance; drought tolerance; foliar water uptake; functional traits; hemiepiphytes;pressure–volume curves; vulnerability curves; water relations.
INTRODUCTION
Because water loss is an inevitable cost of carbon
fixation, all plant communities are influenced by water
availability. If water becomes limiting, plants may
become increasingly vulnerable to water deficits and as
a result, embolism and xylem cavitation can increase as
tension in the xylem pathway builds (i.e., localized and
widespread loss of function of xylem conduits, respec-
tively). Drought can also have widespread effects on
plant communities including changes in species distri-
bution, decreases in primary productivity, and large-
scale mortality due to physiological dysfunction such as
hydraulic failure or poor carbon balance (McDowell et
al. 2008, Brodribb and Cochard 2009, Kursar et al.
2009). These impacts of water limitation on plant
communities are likely to become more important
worldwide as temperatures rise and variability in
precipitation patterns increase (IPCC 2007).
Despite high humidity and generally ample precipita-
tion in tropical rainforests, water limitations can still
influence species distribution and survival in these
ecosystems (Engelbrecht et al. 2007, Kursar et al.
2009). In tropical montane cloud forests (TMCF),
which are known for lush vegetation and abundant
epiphyte communities, precipitation and cloud immer-
sion can vary widely over short time scales, greatly
influencing plant water balance (Holwerda et al. 2010,
Goldsmith et al. 2013, Gotsch et al. 2014a, b). Increases
in the evaporative demand of water from epiphytic
Manuscript received 6 June 2014; revised 16 December 2014;accepted 28 January 2015. Corresponding Editor: S. K.Chapman.
4 E-mail: [email protected]
393

plants that have little or no functional roots may lead to
marked periods of water deficit or even stress, especially
in canopy communities, which are largely disassociated
from terrestrial soil resources (Benzing 1989).
Microclimatic conditions such as temperature, light
availability, humidity, and wind can also vary greatly in
TMCFs along vertical gradients from the soil to the
canopy. As one moves up from the understory to the
highest part of the canopy, light availability, vapor
pressure deficit and wind speed all generally increase
(Cardelus and Chazdon 2005, Watkins and Cardelus
2010; S. G. Gotsch, unpublished data). These conditions
lead to a canopy microclimate that is considerably drier
than in the understory (Cardelus and Chazdon 2005,
Watkins and Cardelus 2010).
Despite drier conditions in the canopy, this habitat
contains hundreds of plant species, which play an
important role in ecosystem functions and services to
the entire community aloft. In a TMCF in Costa Rica,
epiphytes comprise 30% of the total foliar biomass and
45% of the nutrient capital in the forest (Nadkarni
1984). Canopy plants are important components of the
hydrological cycle of tropical forests due to their high
water storage capacity and additional surface area,
which increases cloud and rainwater interception, and
results in additional inputs of water to the ecosystem
(Kohler et al. 2007, Tobon et al. 2010). Epiphytes and
hemiepiphytes also promote the creation of dense aerial
mats of soil and humus, which increase the water
holding capacity of the forest and provide shelter for
arboreal mammals and invertebrates (Foster 2001,
Nadkarni et al. 2004).
The TMCF region of Costa Rica has experienced
increased variability in rainfall over the last 40 years,
which may be particularly detrimental for canopy
communities. Although annual rainfall has generally
increased, the number of consecutive days without
rainfall has also increased while the frequency of mist
has decreased (Pounds et al. 1999). Moreover, increases
in the variability of rainfall and a general decrease in
cloud immersion are projected for the Costa Rican
TMCF region due to changes in land use (i.e.,
deforestation) and increases in sea surface temperatures
(Still et al. 1999, Lawton et al. 2001). Epiphytes may be
particularly vulnerable to changes in precipitation
regimes and cloud cover because they are largely
dependent on canopy soil inputs of water and nutrients.
Although some epiphytes exhibit some traits that can be
associated with drought avoidance (e.g., CAM photo-
synthesis, succulent leaves), there are many epiphytes in
the TMCF that more closely resemble terrestrial
herbaceous plants and shrubs and do not appear
particularly well-adapted to drought (Fig. 1). Evaluating
drought avoidance or resistance in epiphytes is critical to
understanding how projected changes in climate will
affect the diversity and abundance of canopy commu-
nities as well as the ecosystem services they provide.
In terrestrial plant communities, vulnerability to
drought stress is determined in part by a plant’s ability
to maintain function as xylem tension increases. One
important biological indicator of drought resistance or
tolerance is wood or stem density. In dense wood, there
are more xylem conduits of smaller diameter than in less
dense wood and these smaller conduits are more
resistant to cavitation (Hacke et al. 2001, Jacobsen et
al. 2007, Willson et al. 2008). Although plants with high
wood density may be well adapted to withstand
moderate prolonged water limitation, high wood density
is not a universal indicator of drought resistance.
Although these species can withstand lower water
potentials, they also function closer to their minimum
critical water potential (i.e., they posses small safety
margins), which may make species with high wood
density more vulnerable to acute severe drought stress
(Hoffmann et al. 2011). Xylem vulnerability to cavita-
tion can also be directly determined by inducing a series
of decreasing stem water potentials and measuring
changes in hydraulic conductivity (Sperry and Saliendra
1994). Maintenance of hydraulic function at low water
potentials may be related to an underlying trade-off
between resistance to cavitation and the capacity to
conduct large volumes of water and may also be
influenced by shared evolutionary history (Tyree et al.
1994, Ackerly and Donoghue 1998, Pinol and Sala
2000). Drought also has impacts on live cells and the
evaluation of the water potential at which cell walls
collapse (i.e., the turgor loss point, wTLP) is another trait
that is used to evaluate resistance to drought (Niinemets
2001, Brodribb and Holbrook 2003, Lenz et al. 2006,
Blackman et al. 2010, Bartlett et al. 2012). Despite the
widespread assumption that epiphyte communities
exhibit traits to avoid or resist drought, a community-
wide evaluation of ecophysiological strategies in canopy
communities is still lacking.
Another widespread assumption regarding epiphyte
communities is that the leaves of these species can
directly absorb cloud water and mist (Foster 2001).
Elegant morphological descriptions of Tillandsia sp.
have uncovered adaptations to capture and absorb
cloud water although it is unknown whether these
adaptations extend to other epiphytic taxa (Benzing
1989). Even without such specialized leaf structures,
foliar water uptake has been detected in terrestrial
species in the TMCF where this process comprises a
significant component of whole plant water balance
(Goldsmith et al. 2013, Gotsch et al. 2014a). The extent
to which foliar water uptake occurs across canopy
communities and the importance for this process in
epiphytic water balance is unknown. Understanding the
capacity for and prevalence of foliar water uptake is
needed to determine how changes in cloud base heights
and/or precipitation patterns will affect community
dynamics in the canopy and ecosystem water balance.
In this study, we examined the water relations of
common species of epiphytes and hemiepiphytes in the
SYBIL G. GOTSCH ET AL.394 Ecological MonographsVol. 85, No. 3

TMCF of Monteverde, Costa Rica. We measured a
number of functional traits and determined volumetric
sap flow on species representing different canopy growth
forms to ask the following questions: (1) Do canopy
plant communities in the TMCF use a variety of
strategies to cope with water limitation? (2) Do
epiphytes use similar drought-tolerance strategies to
those documented in terrestrial species? (3) Is foliar
water uptake a widespread phenomenon in the canopy
and if so, how important is this process to epiphyte and
hemiepiphyte water balance?
We hypothesized that the relatively mild conditions in
the TMCF would allow a variety of adaptations to cope
with periodic water limitation. Despite the fact that
short-term water limitation is an inescapable part of life
in the treetops, some TMCFs have relatively consistent
inputs of occult precipitation (fog and mist) promoting
great diversity and biomass in the canopy (Clark et al.
2000). In the TMCF of Monteverde, Costa Rica, a wide
array of epiphytic and hemiepiphytic life forms are
visible in a single tree crown including bryophytes, ferns,
leafy herbaceous species, succulents, shrubs, and treelets
(Ingram and Nadkarni 1993). We hypothesized that
adaptations to resist or avoid drought would vary based
on these different life forms. We also hypothesized that
these species would exhibit traits known to confer
drought tolerance in terrestrial plants such as low wTLP
and resistance to cavitation. Lastly, we hypothesized
that all species would possess some capacity for foliar
uptake of water, given the importance of this water
source for canopy plants, and that this process would be
an important component of water balance.
METHODS
Study location
This research was conducted in the Monteverde
Cloud Forest Reserve on the Pacific slope of the
Cordillera de Tilaran in Costa Rica (108180 N, 848480
W; 1480–1550 m in elevation). The site consists of
primary forest 20–30 m high with emergent trees
reaching 35 m (Nadkarni and Matelson 1991). The soils
in this region are Typic Dystrandepts and are charac-
terized by high moisture content and porosity, as well as
low clay content, and bulk density (Lawton and Dryer
1980, Nadkarni and Matelson 1991, Nadkarni and
Wheelwright 2000). Epiphytes are a ubiquitous feature
of this forest; there are approximately 800 species of
epiphytes in the Monteverde Reserve and the biomass of
this community has been estimated at ;1.92 t/ha (Haber
2000, Holscher et al. 2004). Air temperature remains
relatively constant throughout the year (daily average:
228C) though diurnal changes in temperature are great
and surpass yearly variation (Nadkarni 1994). The dry
season generally extends from February to April while
the wet season is generally from May to November
FIG. 1. View from within the canopy of one of the study trees (Ficus tuerckheimii). All of the vegetation in the foregroundconsists of epiphytes or hemiepiphytes. On the right in the foreground, the red flowers of Cavendishia melastomoides can be seen. Inthe center of the photo towards the bottom are the palm-like leaves of Chlorigyne ensiformis. In the upper-right corner of the photo,the faint purple color of Neomirandea croatii flowers can be seen. This image is representative of the density of vegetation in thestudy crowns and the proximity of the study species within the crown.
August 2015 395ECOPHYSIOLOGICAL STRATEGIES OF EPIPHYTES

(Nadkarni 1985, 1994). December and January tend to
be misty and windy; this period is considered the
transition season (Nadkarni 1985, 1994). On average,
this site receives 2500 mm of rainfall annually and there
are additional inputs of 500–2000 mm provided by mist
and fog, which are especially abundant in the transition
and dry seasons (Nadkarni 1985, 1994). Despite
generally mild conditions, there has been an increase
in the number of dry days and a decrease in the
frequency of mist at the site over the last 40 years
(Pounds et al. 1999).
Study species
Eleven common epiphyte and hemiepiphyte species
were the subject of this study. These species were chosen
because they are common throughout the reserve and
exhibit diverse life forms including herbaceous epi-
phytes, shrub epiphytes, and hemiepiphytes (Table 1,
Fig. 1). Multiple individuals of all species were studied in
the crowns of three to five host trees. Study species were
representatives of nine different genera and nine
different families.
Sample collection
Most samples were collected between June and
August of 2013 from the canopies of five mature
strangler fig trees (Ficus tuerckheimii ). F. tuerckheimii
is a common canopy tree in the TMCF; its large crown
size supports abundant and diverse epiphytic communi-
ties (Fig. 1). All host trees contained canopy mats up to
25 cm thick and were densely populated with epiphytes
and hemiepiphytes (Nadkarni 1985). Tree crowns were
accessed using single-rope and double-rope climbing
techniques. To measure functional traits, samples were
cut, placed in black plastic bags to minimize dehydra-
tion, and then were lowered to the ground. Samples were
then taken to the field laboratory where stems were recut
underwater and plants were covered until measurement.
The stem diameter of samples varied based on the plant
growth form but generally ranged from 0.5–2.5 cm in
diameter. Single stems had a minimum of five leaves
distal to the cut portion and often times many more. For
smaller growth forms with multiple stems, a number of
adjacent stems were cut and treated as a single
individual. Functional traits were measured on five
individuals per species in a minimum of three tree
crowns. Only the youngest mature leaves were mea-
sured. Sap flow was measured on a subset of the study
species that were all common within five meters of one
another in three crowns. Microclimate was measured
near sap flow stations as well as on a tower that was
between 20 and 500 m from study trees. Additional sap
flow and microclimate data were collected in January of
2014. Microscopy measures were completed from June–
August of 2014 on individuals from the same tree
crowns.
Functional trait measures
Stem density.—Stem density was calculated by divid-
ing the dry weight by the fresh volume (Table 2).
Approximately six cm of woody tissue was measured for
each sample. Bark was removed, the sample was cut
directly down the middle and all pith was removed. C.
ensiformis and M. monteverdense are herbaceous mono-
cots; the arrangement of vascular bundles in these
species did not permit pith removal prior to measure-
ment. Volume of the prepared sample was determined
using the displacement principle of Archimedes. Fol-
lowing the determination of volume, tissues were dried
at 608C for three days, which was sufficient for the
samples to achieve a constant weight.
Leaf toughness.—Leaf toughness was determined by
measuring the weight needed to pierce a leaf with a blunt
cylinder of known diameter (Gotsch et al. 2010). The
penetrometer used in this study was constructed at the
machine shop at Franklin and Marshall College.
Toughness was measured in the middle of the leaf blade
in an area free of secondary veins (Table 2).
Specific leaf area.—Specific leaf area (SLA) was
calculated as the fresh leaf area divided by the dry
mass. Six leaf discs of a known area were removed from
the leaf and samples were dried for three days at 608C.
TABLE 1. Taxonomic names and growth forms for the study species, and the measurements ofeach species made during the study period.
Species Family Growth form Measurements
Cavendishia capitulata Ericaceae shrub epiphyte 1,2,3,4,5Cavendishia melastomoides Ericaceae shrub epiphyte 1,2,4Chlorigyne ensiformis Cyclantaceae herbaceous 1,2,4,5Clusia flavasepala Clusiaceae hemiepiphyte 1,2,3,4,5Clusia palmana Clusiaceae hemiepiphyte 1,2,4Cosmibuena valerii Rubiaceae hemiepiphyte 1,2,3,4Maianthemum monteverdense Asparagaceae herbaceous 1,2,3,4Neomirandea croatii Asteraceae small woody epiphyte 1,2,4,5Notopleura piticobia Rubiaceae small woody epiphyte 1,2,4,5Oreopanax vestitus Areliaceae hemiepiphyte 1,2,3,4,5Schefflera rodrigueziana Areliaceae hemiepiphyte 1,2,3,4,5
Note: Explanations for each measurement number are as follows: 1, functional traits; 2,pressure–volume curves; 3, vulnerability curves; 4, foliar water uptake capacity; and 5, volumetricsap flow.
SYBIL G. GOTSCH ET AL.396 Ecological MonographsVol. 85, No. 3
Care was taken to avoid primary veins and to choose the
youngest mature leaves.
Leaf dry matter content.—Leaf dry matter content
(LDMC) is the ratio of dry mass to fresh mass of a leaf.
A minimum of five leaves were measured per individual.
Fresh leaves were weighed and then dried at 608C for
three days to obtain the dry mass (Table 2).
Huber value.—Huber value is the ratio of sapwood
area to leaf area (Table 2). One piece of leafy stem
approximately 6 cm long was taken from each sample
and the cross-sectional sapwood area was determined.
All leaves were traced onto white paper and the area of
the samples was determined in the lab at Franklin and
Marshall College using a LI-3100C area meter (LI-COR
Biosciences, Lincoln, Nebraska, USA).
Microscopy
Following collection in the field, sample stems were
cut underwater in the field laboratory and stored in
water under black plastic until they were processed the
following day. Three fresh leaves were hand-sectioned
per individual and stained with safranin to increase
contrast. Leaf cross-sections were viewed under 403 or
1003 power with a light microscope (Motic BA210E,
Richmond, British Colombia, Canada). Digital images
were taken of all samples and the leaf thickness,
mesophyll thickness, total cuticle thickness, and total
hydrenchymal thickness were quantified using Image J
Software (v1.48, U.S. National Institutes of Health,
Bethesda, Maryland, USA). All measurements were
taken away from major veins (Table 2).
Foliar water uptake capacity
Samples were recut under water, covered with dark
plastic and left overnight to rehydrate. In the morning,
water potential was measured on the leaves to ensure
that they were fully rehydrated. Following the initial
measurement, leaves were dehydrated by applying 1.0
MPa of pressure for one minute in a pressure chamber
(PMS model 1505D-EXP, Albany, Oregon, USA).
During this minute, a paper towel was held to the
exposed petiole to remove water from the cut surface.
After a minute, water potential was measured again to
establish pre-rehydration water status. Leaf blades were
then submerged in water for 60 minutes. The cut petiole
was exposed, but wrapped in parafilm to limit water
loss. After an hour of submersion, leaves were wiped dry
and the water potential was measured again. Foliar
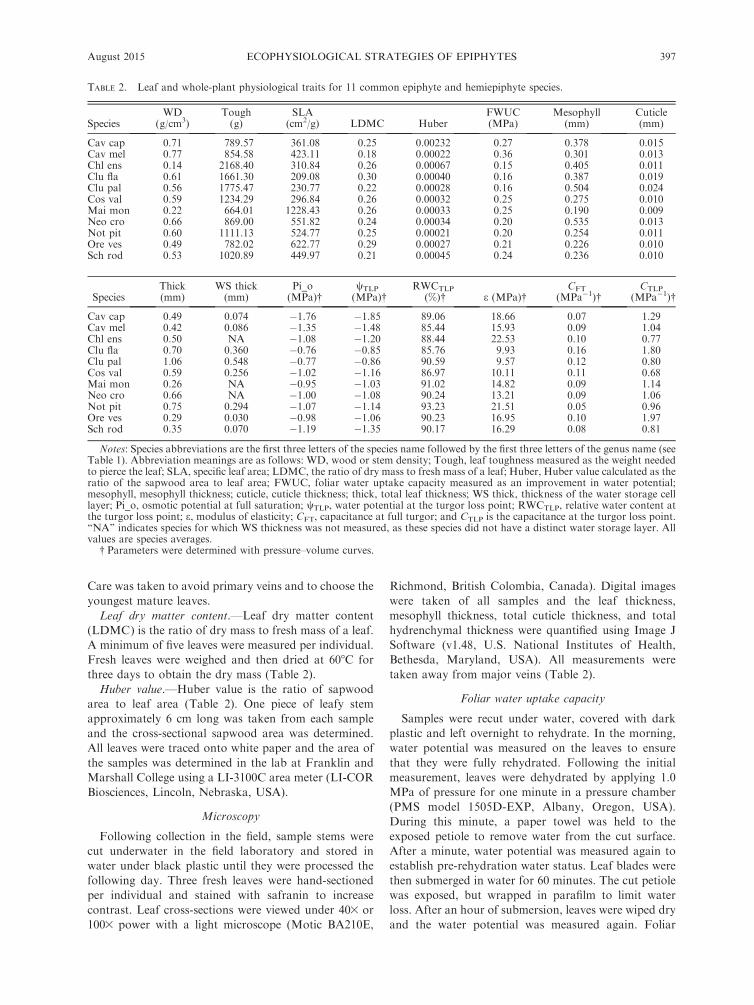
TABLE 2. Leaf and whole-plant physiological traits for 11 common epiphyte and hemiepiphyte species.
SpeciesWD
(g/cm3)Tough(g)
SLA(cm2/g) LDMC Huber
FWUC(MPa)
Mesophyll(mm)
Cuticle(mm)
Cav cap 0.71 789.57 361.08 0.25 0.00232 0.27 0.378 0.015Cav mel 0.77 854.58 423.11 0.18 0.00022 0.36 0.301 0.013Chl ens 0.14 2168.40 310.84 0.26 0.00067 0.15 0.405 0.011Clu fla 0.61 1661.30 209.08 0.30 0.00040 0.16 0.387 0.019Clu pal 0.56 1775.47 230.77 0.22 0.00028 0.16 0.504 0.024Cos val 0.59 1234.29 296.84 0.26 0.00032 0.25 0.275 0.010Mai mon 0.22 664.01 1228.43 0.26 0.00033 0.25 0.190 0.009Neo cro 0.66 869.00 551.82 0.24 0.00034 0.20 0.535 0.013Not pit 0.60 1111.13 524.77 0.25 0.00021 0.20 0.254 0.011Ore ves 0.49 782.02 622.77 0.29 0.00027 0.21 0.226 0.010Sch rod 0.53 1020.89 449.97 0.21 0.00045 0.24 0.236 0.010
SpeciesThick(mm)
WS thick(mm)
Pi_o(MPa)�
wTLP
(MPa)�RWCTLP
(%)� e (MPa)�CFT
(MPa�1)�CTLP
(MPa�1)�
Cav cap 0.49 0.074 �1.76 �1.85 89.06 18.66 0.07 1.29Cav mel 0.42 0.086 �1.35 �1.48 85.44 15.93 0.09 1.04Chl ens 0.50 NA �1.08 �1.20 88.44 22.53 0.10 0.77Clu fla 0.70 0.360 �0.76 �0.85 85.76 9.93 0.16 1.80Clu pal 1.06 0.548 �0.77 �0.86 90.59 9.57 0.12 0.80Cos val 0.59 0.256 �1.02 �1.16 86.97 10.11 0.11 0.68Mai mon 0.26 NA �0.95 �1.03 91.02 14.82 0.09 1.14Neo cro 0.66 NA �1.00 �1.08 90.24 13.21 0.09 1.06Not pit 0.75 0.294 �1.07 �1.14 93.23 21.51 0.05 0.96Ore ves 0.29 0.030 �0.98 �1.06 90.23 16.95 0.10 1.97Sch rod 0.35 0.070 �1.19 �1.35 90.17 16.29 0.08 0.81
Notes: Species abbreviations are the first three letters of the species name followed by the first three letters of the genus name (seeTable 1). Abbreviation meanings are as follows: WD, wood or stem density; Tough, leaf toughness measured as the weight neededto pierce the leaf; SLA, specific leaf area; LDMC, the ratio of dry mass to fresh mass of a leaf; Huber, Huber value calculated as theratio of the sapwood area to leaf area; FWUC, foliar water uptake capacity measured as an improvement in water potential;mesophyll, mesophyll thickness; cuticle, cuticle thickness; thick, total leaf thickness; WS thick, thickness of the water storage celllayer; Pi_o, osmotic potential at full saturation; wTLP, water potential at the turgor loss point; RWCTLP, relative water content atthe turgor loss point; e, modulus of elasticity; CFT, capacitance at full turgor; and CTLP is the capacitance at the turgor loss point.‘‘NA’’ indicates species for which WS thickness was not measured, as these species did not have a distinct water storage layer. Allvalues are species averages.
� Parameters were determined with pressure–volume curves.
August 2015 397ECOPHYSIOLOGICAL STRATEGIES OF EPIPHYTES

water uptake capacity was calculated as the improve-
ment in water potential following submersion (Table 2).
Three leaves were measured per individual and five
individuals were measured per species. Methods fol-
lowed those described by Goldsmith et al. (2013).
Pressure volume curves
Samples were rehydrated overnight prior to analysis.
A leaf or branchlet was measured from each individual
depending on the sturdiness and length of the petiole.
Five individuals per species were measured from at least
three host trees. As soon as samples were removed from
the rehydrated branches, their water potential was
measured and the sample was then immediately
weighed. Leaves were allowed to bench dry and the
water potential and weight were measured 15–20 times
throughout the desiccation process until approximately
40% of the weight was lost due to dehydration. If
desiccation occurred slowly, samples were placed in a
light box with a fan to accelerate evaporation. The
relationship between the inverse water potential and
relative water content was plotted and analyzed
following methods described by Sack et al. (2011). This
analysis was used to determine the turgor loss point
(wTLP), relative water content at the turgor loss point
(RWCTLP), osmotic potential at full saturation (Pi_o)
and the bulk elastic modulus (e) (Table 2).
Vulnerability to cavitation
Vulnerability to cavitation was measured on the
following woody epiphyte and hemiepiphyte species:
Clusia flavasepala, Cosmibuena valerii, Cavendishia capi-
tulata, Oreopanax vestitus and Schefflera rodrigueziana
following the methods of Sperry and Saliendra (1994).
The maximum vessel length for each species was
measured by attaching a long branch (.1 m) to a hose
with pressurized N2. The end of the branch not connected
to the hose (i.e., the distal end) was placed in a tub of
water and short segments of the branch were cut back
until bubbles were observed in the water which indicated
that a vessel had been isolated. The length of this segment
was considered the maximum vessel length of the sample.
A minimum of three samples per species were measured
and the greatest value obtained was considered the
maximum vessel length of the species. Branch samples
larger than the maximum vessel length were used. Minor
lateral branchlets and leaves were removed and scars were
sealed with quick-dry adhesive glue. The bark was
removed from approximately 1 cm of the ends of each
segment and ends were trimmed with a razor to expose
any vessels that had been damaged when segments were
initially cut. As many as four stems were then attached to
a plastic manifold of hysteresis-resistant polytetrafluoro-
ethylene that allowed water to flow from a 4-L Nalgene
source solution (10 mmol/L KCl degassed distilled water)
that was placed one meter above branch height (Markes-
teijn et al. 2011). Surgical latex tubing of various
diameters, parafilm, and hose clamps were used to ensure
a secure fit between stems and the plastic manifold
tubing. The plastic manifold was attached to a pressur-
ized water tank used to flush stems initially (150 kPa) for
30 minutes to remove emboli from the stems. We found
that this initial flush was sufficient to remove latex from
the stem of Clusia flavasepala so that conductivity could
be measured. We had intended to also remove latex from
F. tuerckheimii using this method but latex in this species
continued to flow following the initial flush and therefore
a quantification of conductivity in the host tree was not
possible. Stems were allowed to equilibrate for 10 minutes
before maximum hydraulic conductivity was measured
(Markesteijn et al. 2011). To measure conductivity,
Eppendorf tubes were filled with cotton and weighed to
obtain an initial mass. Cotton-filled tubes were placed on
the ends of the exposed xylem of the stems and were
weighed every minute until there was no change in mass.
The rate at which water was absorbed by the cotton was
calculated to determine conductivity.
After determining the maximum conductivity, cavita-
tion was induced by air injection. Overlapping notches,
50 mm apart, were cut into bark to expose xylem.
Segments, fitted with rubber stoppers on both ends, were
placed in a sealed steel cavitation chamber with an air
vent connected to a pressure manifold of US standard
tubing (CGA-580, PMS Instrument, Albany, Oregon,
USA; Sperry and Saliendra 1994). Air pressure was
regulated by a Pressure Chamber Instrument (Model
1505D-EXP, PMS Instrument Company, Albany, Ore-
gon, USA) attached to the pressure manifold and to a N2
tank (Sperry and Saliendra 1994). The cavitation
chambers were initially pressurized to 0.25 MPa for 10
minutes. Stems were allowed to rest for three minutes
before conductivity was measured (Sperry and Saliendra
1994, Markesteijn et al. 2011). Following a measurement
of conductivity, pressurization of the stems was increased
by an additional 0.25 MPa and hydraulic conductivity
was measured again. If an increase in pressurization of
0.25 MPa resulted in no change in conductivity, the
pressure increment was increased to 0.5 MPa. Greater
pressure increments were applied to the stem until a
conductivity of zero was measured. Scatterplots were
created for water potential as a function of percent loss of
hydraulic conductivity (PLC). Vulnerability curves were
fit using the following equation:
PLC ¼ 100=�
1þ exp�
aðWP� bÞ��: ð1Þ
where WP is the xylem pressure, a is the slope of the
curve, and b is the xylem pressure at 50% loss of hydraulic
conductivity (Pammenter and Vander Willigen 1998,
Markesteijn et al. 2011). Eq. 1 did not significantly fit
data for C. capitulata. The equation PLC¼ a3WPb/(cbþWPb), where WP is the xylem pressure and a, b, and c are
constants, was used for this species. A minimum of five
individuals were measured per species; data were pooled
to create an average vulnerability curve for each species
(Table 2).
SYBIL G. GOTSCH ET AL.398 Ecological MonographsVol. 85, No. 3

Sap flow
To characterize transpiration, we measured sap flow
using the heat ratio method, which allows for the
determination of reverse and low flow rates (Burgess et
al. 2001). Small external sensors were custom built in the
laboratory at Franklin and Marshall College following
the design of Clearwater et al. (2009; also see Roddy and
Dawson 2012). These sensors had been successfully used
on small-stemmed individuals but, to our knowledge,
had never been used in canopy communities (Goldsmith
et al. 2013, Skelton et al. 2013). Sixteen sensors were
installed on the stems of epiphytes and hemiepiphytes in
each of the study trees. The following seven species were
measured: Cavendishia capitulata, Chlorigyne ensiformis,
Clusia palmana, Neomirandea croatii, Oreopanax vesti-
tus, Notopleura piticobia, and Schefflera rodrigueziana.
These species were chosen because they are common and
live in close proximity to one another within a tree
crown (;5 m). A maximum of 16 sensors could be
connected to a single data logger, which limited the
number of species we could instrument with sap flow
sensors. Two individuals were measured in each tree and
data were collected using a CR-1000 Campbell Scientific
data logger attached to a multiplexer (AM16/32B,
Campbell Scientific, Logan, Utah, USA).
The sensors were attached to the outside of a small
branch and were wrapped extensively with Parafilm to
isolate the sensor from direct sunlight and to keep the
sensor and stem dry. Every 10 minutes, a 6-second heat
pulse was applied to the sensor and then 20 seconds
later, the temperature was measured upstream and
downstream of the heater for 40 seconds. Heat pulse
velocity, Vh (cm/hr), was determined from the following
equation:
Vh ¼ k=x lnðdT1=dT2Þ3 3600 ð2Þ
where x represents the distance between the heater and
the thermocouple, dT1 and dT2 are the downstream and
upstream temperature changes, and k represents the
thermal diffusivity constant. A diffusivity constant of
2.83 3 10�3 cm2/s has been found across a number of
species and was used in this study (Clearwater et al.
2009, Goldsmith et al. 2013). Corrections are needed to
determine sap flow velocity from heat pulse velocity in
small stems since the heat pulse diffuses through non-
conductive materials (i.e., bark, phloem, and pith) as
well as through xylem (Burgess et al. 2001, Clearwater et
al. 2009). Sap flow velocity, Vs, was determined using the
following equation:
Vs ¼Vhqbðcw þ mccsÞ
qscs
ð3Þ
where qb is the stem density, cw is the specific heat
capacity of the wood matrix at 208C (1200 J�kg�1�8C�1),cs is the specific heat capacity of water at 208C (4182
J�kg�1�8C�1), mc is the water content of the xylem, and qsis the density of water (Burgess et al. 2001). The
correction factor was employed because it did not
require destructive harvesting of study individuals,
which are under continued observation.
Sap flow stations were installed in early July of 2013.
A study window was chosen from 7 August to 15
August, as this was a period of drier weather immedi-
ately following the rewrapping of all the sensors in all
three trees. A sap flow station was also deployed during
the misty-windy transition season in 2014, data from 26
December to 27 January of 2014 were also included in
this study.
Sap flow data management
Electrical noise and/or mechanical failure resulted in a
few erroneous sap flow data points that were orders of
magnitude above or below surrounding values. Sap flow
data were scanned visually for such anomalous data,
which were removed from the data set. The data set was
then gap filled by averaging the values on either side of
the erroneous value. Erroneous data comprised less than
1% of the data set. Sap flow data were then corrected for
smaller errors resulting from variation in sensor
construction. Sensor variation resulted in baseline values
slightly above or below zero. Zero-flow corrections were
performed by taking the average sap flow rate during a
nighttime period when vapor pressure deficit (VPD) was
low but leaves were dry (i.e., when we would not expect
either transpiration or reverse flow) and adjusting the
data set for each sensor by adding or subtracting this
‘‘true’’ zero transpiration value to the rest of the data set
(Ambrose et al. 2009, 2010, Gotsch et al. 2014a).
Volumetric sap flow and error analyses
Following corrections, volumetric sap flow was
calculated by multiplying rates of sap velocity by the
estimated leaf area supplied to each stem. To estimate
leaf area, the number of leaves upstream of the sensor
were counted and multiplied by the average leaf area,
which was measured on individuals used for destructive
measurements. The percentage of hours that sensors
underwent reverse flow (i.e., foliar water uptake) and
nighttime flow were calculated along with total flow
attributed to each of these processes (Table 3).
A number of errors may be introduced as sap flow
data are scaled from point velocity measurements to
whole-individual volumetric flows (Gotsch et al. 2014a).
We considered the errors included in data screening, gap
filling, zero-flow correction, and scaling up of sap flow
using estimates of leaf area. Because so few data points
were removed in screening procedures, this source of
error is excluded from our analysis. Zero-flow calcula-
tions also resulted in very low variation in sap flow rates
(,1%) and were excluded from the error analysis. The
single largest source of potential error in our study
resulted from the scaling up of sap flow based on leaf
area estimates. Leaves were counted precisely but these
numbers were converted to an area by multiplying by
the average leaf area for the species. The error in
August 2015 399ECOPHYSIOLOGICAL STRATEGIES OF EPIPHYTES

nighttime sap flow (NF) resulting from scaling point
measurements of sap velocity to whole-plant transpira-
tion was therefore calculated using the following
equation derived from Stull (1999)
rNF ¼ NF 3ðrLA=LAÞ: ð4Þ
where LA is the leaf area of each branch. The error in
foliar water uptake (rFWU) was similarly calculated
rFWU ¼ FWU 3ðrLA=LAÞ: ð5Þ
The errors were then converted to a percentage and
the volume of the percentage was calculated (Table 3).
Microclimate
A microclimate station was installed in each of thestudy trees as well as at a meteorological tower located 20
m from one of our study trees. The station on the
meteorological tower consisted of a full decagon micro-
climate monitoring system (Decagon Devices, Pullman,
Washington, USA), which included a high-resolution rain
gauge, a solar radiation sensor, a Davis cup anemometer,a leaf wetness sensor, and a temperature and relative
humidity sensor. Data from these systems were collected
via an Em50 data logger (Decagon Devices, Pullman,
Washington 99163). Crown microclimate stations had a
similar setup but without the rain gauge or solar radiationgauge. Also installed in the study trees were soil moisture
smart sensors (S-SMD-M005, Onset Computer Corpo-
ration, Bourne, Massachusetts, USA) as well as two air
temperature and relative humidity data loggers (HOBO
U23 Pro v2 External U23-002, Onset Computer, Bourne,Massachusetts, USA).
Data analysis
For all parametric analyses, data that were not
normally distributed were log-transformed to achieve
normality. A MANOVA test was performed to deter-
mine the effect of species on trait combinations.Following this initial analysis, ANOVAs were performed
on each trait. A two-way ANOVA was conducted on thevolumetric sap flow data to determine the relative effectof the month of measurement (August vs. January) and
species identity on the average daily maximum volumet-ric sap flow as well as the average daily range of sap flow.
Average values for the water potential at which the stemexperiences a 50% loss of conductivity, P50, for eachspecies were determined using a non-linear regression
analysis. Linear regression analyses were conducted todetermine the strength of the relationships between all
functional traits, water relations and microscopy mea-sures. On the subset of species instrumented with sapflow gauges, the relationship between foliar water uptake
capacity and foliar water uptake in situ as well as therelationships between nighttime flow and hydrenchymal
thickness, foliar water uptake capacity and the relativewater content at the turgor loss point were analyzed. Allanalyses were performed using JMP V.10 (SAS Institute,
Cary, North Carolina, USA). To determine variation inecological strategies, we performed a cluster analysis
based on functional traits, which created groupings ofspecies. This analysis was performed using PC-ORD, V.6(Gleneden Beach, Oregon, USA). Significance between
groupings was determined using a Multi-ResponsePermutation Procedure (MRPP) analysis, which wasalso completed using PC-ORD.
RESULTS
Functional traits
Traits that have been documented to play an important
role in plant ecophysiological strategies such as stemdensity, SLA, leaf toughness, leaf thickness, LDMC, and
Huber value all varied greatly across canopy species
TABLE 3. Volumetric water balance parameters for seven common epiphyte and hemiepiphyte species over a 30-day period (26December–26 January) in the tropical montane cloud forest (TMCF) of Monteverde, Costa Rica.
Species
Foliar water uptake Nighttime sap flow
Time(%)
Transpiration(%)
Volume(L) r
Time(%)
Flow(%)
Volume(L) r
Cav cap 56.4 96.4 66.5 1.1 29.0 6.9 4.7 0.1Chl ens 50.6 79.5 2.2 0.2 38.1 15.0 0.4 0.0Clu pal 42.1 75.8 33.8 1.9 58.6 33.4 14.9 0.8Neo cro 56.2 80.5 14.8 1.2 30.1 12.8 2.4 0.2Not pit 39.0 64.2 2.6 0.3 55.8 22.6 0.9 0.1Ore ves 53.3 59.5 8.6 0.6 31.1 10.0 1.4 0.1Sch rod 42.2 37.9 30.1 1.0 42.2 17.7 14.1 0.5
Avg 48.5 70.5 22.6 0.9 40.7 16.9 5.5 0.3SE 2.8 7.1 8.7 0.2 4.6 3.4 2.4 0.1
Notes: The species instrumented with sap flow sensors were Cavendishia capitulata (Cav cap), Chlorigyne ensiformis (Chl ens),Clusia palmana (Clu pal), Neomirandea croatii (Neo cro), Notopleura piticobia (Not pit), Oreopanax vestitus (Ore ves), andSchefflera rodrigueziana (Sch rod). Values shown for foliar water uptake are time, the percentage of the total study hours whenreverse flow was occurring; transpiration, the percentage of total transpiration that is recovered during the period; volume, the totalvolume of water that was recovered during the study period; and r, the error term associated with volume. Values shown fornighttime flow are time, the percentage of the total nighttime study hours when the sensors detected upward movement of sap; flow,the percentage of the total volume of sap moved above the level of the sensor that occurred at night; volume, the total volume ofwater moved up from the height of the sensor at night; and r, the error term associated with volume. Across-species averages (Avg)and standard errors (SE) are reported at the bottom of the table.
SYBIL G. GOTSCH ET AL.400 Ecological MonographsVol. 85, No. 3

(Table 2). For example, stem density of woody species
ranged from 0.49 g/cm3 in a hemiepiphyte (O. vestitus) to
0.77 g/cm3 in a shrub epiphyte (C. melastomoides). Leaf
toughness ranged from 664 g in an herbaceous monocot
(M. monteverdense) to 2168 g in another herbaceous
monocot (C. ensiformis). SLA ranged from 209 cm2/g in a
succulent hemiepiphyte (C. flavasepala) to 1228 cm2/g in
an herbaceousmonocot (M.monteverdense, Table 2). Leaf
thickness varied from 0.26 mm in M. monteverdense to
1.06 mm in C. palmana while hydrenchymal thickness
varied greatly, even just across hemiepiphytes (0.03 mm in
O. vestitus to 0.55 mm in C. palmana; Table 2). The
MANOVAanalysis indicated a significant effect of species
identity in functional trait variation (Roy’s greatest root;
approximate F¼ 24.2, df¼ 10, 45; P , 0.0001). In post-
hoc ANOVAs, there were significant species effects (P ,
0.0001) for all traits with the exception of foliar water
uptake capacity.
We also found significant variation in water relations
traits. wTLP values ranged from �0.85 MPa in C.
flavasepala to �1.85 MPa in C. capitulata, and e values
ranged from 9.6 in C. palmana to 22.5 in C. ensiformis
(Table 2). We also found that all species had the
capacity for foliar water uptake. The improvement in
water status caused by an hour of foliar submersion
following desiccation ranged from 0.15 to 0.36 MPa
(Table 2). On a subset of woody-stemmed species, we
also conducted vulnerability curves. The P50 values for
these five species ranged from�0.4 MPa in C. capitulata
to �1.0 MPa in C. flavasepala (Fig. 2).
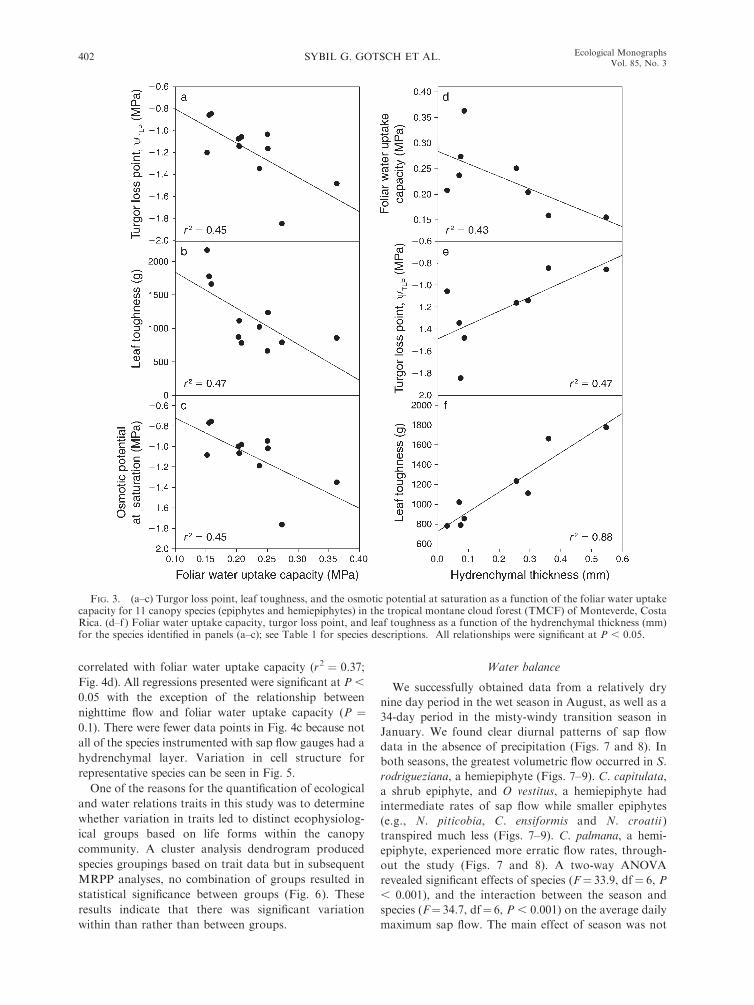
Linear regression analyses indicated significant nega-
tive relationships between foliar water uptake capacity
and wTLP (r2¼ 0.45; Fig. 3a), leaf toughness (r2 ¼ 0.47;
Fig. 3b) and osmotic potential at full saturation (r2 ¼0.45; Fig. 3c), These analyses also indicated significant
relationships between hydrenchymal thickness and foliar
water uptake capacity (r2 ¼ 0.43; Fig. 3d), wTLP (r2 ¼0.47; Fig. 3e), leaf toughness (r2 ¼ 0.88; Fig. 3f ) and
cuticle thickness (r2 ¼ 0.6; P ¼ 0.03; relationship not
shown in Fig. 3). Foliar water uptake capacity decreased
with an increase in hydrenchymal thickness while wTLP
and leaf toughness increased. All significant correlations
are reported in Table 4.
Relationships between the functional traits and sap flow
were examined on the seven species instrumented with sap
flow gauges. Linear regression analyses indicated that
foliar water uptake in situ (total volume) was positively
correlated with foliar water uptake capacity (r2¼0.4; Fig.
4a) while nighttime flow (percentage of total volume at
night) was positively correlated with the relative water
content at the turgor loss point (r2 ¼ 0.52; Fig. 4b) and
hydrenchymal thickness (r2¼0.88; Fig. 4c) and negatively
FIG. 2. Loss of hydraulic conductivity as a function of stem water potential. Five individuals were measured per species. Ateach water potential, identical symbols represent different individuals within a species. The water potential at which 50% of theconductivity is lost (P50) was �0.61 MPa for Clusia, �1.00 MPa for Cosmibuena, 0.4 MPa for Cavendishia, �0.67 MPa forOreopanax, and �0.51 MPa for Schefflera.
August 2015 401ECOPHYSIOLOGICAL STRATEGIES OF EPIPHYTES
correlated with foliar water uptake capacity (r2 ¼ 0.37;
Fig. 4d). All regressions presented were significant at P ,
0.05 with the exception of the relationship between
nighttime flow and foliar water uptake capacity (P ¼0.1). There were fewer data points in Fig. 4c because not
all of the species instrumented with sap flow gauges had a
hydrenchymal layer. Variation in cell structure for
representative species can be seen in Fig. 5.
One of the reasons for the quantification of ecological
and water relations traits in this study was to determine
whether variation in traits led to distinct ecophysiolog-
ical groups based on life forms within the canopy
community. A cluster analysis dendrogram produced
species groupings based on trait data but in subsequent
MRPP analyses, no combination of groups resulted in
statistical significance between groups (Fig. 6). These
results indicate that there was significant variation
within than rather than between groups.
Water balance
We successfully obtained data from a relatively dry
nine day period in the wet season in August, as well as a
34-day period in the misty-windy transition season in
January. We found clear diurnal patterns of sap flow
data in the absence of precipitation (Figs. 7 and 8). In
both seasons, the greatest volumetric flow occurred in S.
rodrigueziana, a hemiepiphyte (Figs. 7–9). C. capitulata,
a shrub epiphyte, and O vestitus, a hemiepiphyte had
intermediate rates of sap flow while smaller epiphytes
(e.g., N. piticobia, C. ensiformis and N. croatii )
transpired much less (Figs. 7–9). C. palmana, a hemi-
epiphyte, experienced more erratic flow rates, through-
out the study (Figs. 7 and 8). A two-way ANOVA
revealed significant effects of species (F¼ 33.9, df¼ 6, P
, 0.001), and the interaction between the season and
species (F¼ 34.7, df¼ 6, P , 0.001) on the average daily
maximum sap flow. The main effect of season was not
FIG. 3. (a–c) Turgor loss point, leaf toughness, and the osmotic potential at saturation as a function of the foliar water uptakecapacity for 11 canopy species (epiphytes and hemiepiphytes) in the tropical montane cloud forest (TMCF) of Monteverde, CostaRica. (d–f ) Foliar water uptake capacity, turgor loss point, and leaf toughness as a function of the hydrenchymal thickness (mm)for the species identified in panels (a–c); see Table 1 for species descriptions. All relationships were significant at P , 0.05.
SYBIL G. GOTSCH ET AL.402 Ecological MonographsVol. 85, No. 3

significant in this analysis. In general, sap flow was
greater in the misty-windy season but this pattern varied
across species (Fig. 9a). In the two-way ANOVA, which
included data on the average daily range in volumetric
sap flow, the main effects of season and species were
significant (F¼ 27.3, df¼ 1, P , 0.001 and F¼ 96.7, df¼6, P , 0.001, respectively) as well as the interaction
between season and species (F ¼ 122.2, df ¼ 6, P ,
0.001). The average daily range in sap flow was greater
for all species in the misty-windy season when conditions
were more variable (Fig. 9b).
The degree to which plants absorbed foliar water
(indicated by sap flow reversals; FWU) varied among
species. Species underwent FWU between 39% and 56%of the time (Table 3). These reversals led to an average
FWU percentage (i.e., the percentage of total positive
flow that was recovered via FWU) of 70.5%. C.
capitulata recovered the greatest percentage of tran-
spired water (96.4%), while S. rodrigueziana recovered
the least amount (37.8%; Table 3). These sap flow
reversals led to an average of 22.65 L reabsorbed during
the month-long period in the misty-windy season (Table
3). C. ensiformis reabsorbed the least amount of water
(2.2 L) due to its overall low rates of transpiration, while
C. capitulata absorbed the greatest amount of water via
foliar uptake (66.5 L; Table 3).
In addition to examining dry season patterns of
FWU, we also examined the prevalence of nighttime
flow (NF) during the study period. In general, we found
that NF was less important to overall water balance
than FWU and that variation across species was great.
TABLE 4. Significant pairwise correlations of functional traits,water relations, andmicroscopymeasures for 11 common epiphyteand hemiepiphyte species.
Correlatedvariable 1
Correlatedvariable 2 r2 P
CFT Pi_o 0.37 0.046CFT RWCTLP �0.37 0.047CFT e �0.50 0.015CTLP LDMC 0.37 0.045Cuticle Mesophyll 0.48 0.018Cuticle Thick 0.62 0.004FWUC Tough �0.47 0.020Mesophyll Thick 0.47 0.019Pi_o FWUC �0.40 0.035Pi_o Huber �0.60 0.005SLA Tough �0.38 0.042WS thick Cuticle 0.58 0.029WS thick Mesophyll 0.51 0.044WS thick Thick 0.94 ,0.0001WS thick Tough 0.88 0.001wTLP FWUC �0.43 0.028wTLP Huber �0.56 0.008wTLP Pi_o 0.99 ,0.0001
Note: See Table 2 for definitions of variables.
FIG. 4. (a) The relationship between foliar water uptake capacity and in situ foliar water uptake (amount recovered via foliarabsorption) for seven species that were instrumented with external sap flow gauges. (b–d) The relationships between relative watercontent at the turgor loss point (RWCTLP), hydrenchymal thickness, foliarwater uptake capacity, and the nighttime sapflow (percentageof total volume transpired during the study period). All relationships were significant at P , 0.05, with the exception of panel (d) (P¼0.1). Species instrumented with sap flow gauges are listed in Table 3 and species information can be found in Table 1.
August 2015 403ECOPHYSIOLOGICAL STRATEGIES OF EPIPHYTES

The study species on average underwent NF for 40.7%
of the nighttime hours (Table 3). C. palmana experi-
enced the greatest NF (33.4% of total L transpired),
while C. capitulata had the least amount of NF (6.8% of
total L transpired; Table 3). Given the relationships
presented in Figs. 3 and 4, NF is most likely due to
refilling of hydrenchymal layers at night rather than
nighttime transpiration.
DISCUSSION
The goals of this research were to enhance our
understanding of the ecophysiological strategies of
drought tolerance or avoidance in a TMCF epiphytic
plant community and quantify the importance of fog
and mist in their water balance. Here we present the first
data set of functional trait relationships and water
balance metrics of common vascular epiphytes in the
TMCF of Monteverde, Costa Rica. We have found that
plants in this community exhibit a continuum of
strategies. At one extreme, plants allocate to traits that
confer relative drought resistance and rely heavily on
foliar water uptake to offset transpiration losses. At the
other extreme, plants specialize in water storage and
drought avoidance at the expense of foliar water uptake.
FIG. 5. Variation in leaf anatomy in common epiphytes of the TMCF. All upper portions of the four panels correspond to theadaxial side of the leaves. (a) A semi-succulent, Notopleura piticobia, contains a thick hydrenchymal (i.e., water storage) layer onthe adaxial side of the leaf. (b) A hemiepiphyte, Clusia palmana, contains a clear hydrenchymal layer on the adaxial side of the leafand a reduced layer on the abaxial side of the leaf as well. (c) Chlorigyne ensiformis, a herbaceous monocot, does not exhibit ahydrenchymal layer. (d) Cavendishia capitulata, is a shrub epiphyte that does not appear to be succulent and yet contains a thinlayer of hydrenchymal cells.
FIG. 6. Cluster analysis for 11 common canopy species based on the following functional traits: wood density, leaf toughness,specific leaf area, leaf thickness, leaf dry matter content, Huber value, foliar water uptake capacity, turgor loss point, bulk elasticmodulus, and the relative water content at the turgor loss point. The ‘‘Information remaining (%)’’ is the amount of variation in thedistances that is accounted for at a given step in the clustering process. The ‘‘Distance (objective function)’’ is computed withWard’s method using the Euclidian distance. An MRPP analysis in PC-ORD indicated that the groups depicted in the clusteranalysis are not significantly different from one another due to substantial trait variation within groups. Species abbreviations arethe first three letters of the species name followed by the first three letters of the genus name (see Table 1).
SYBIL G. GOTSCH ET AL.404 Ecological MonographsVol. 85, No. 3

FIG. 7. Volumetric sap flow for seven common canopy species in the TMCF of Monteverde, Costa Rica over a nine-day period(7–15 August 2013) in the wet season when there was relatively little rainfall. (a) Cavendishia capitulata is a woody epiphyte, (b)Chlorigyne ensiformis is an herbaceous monocot, (c) Clusia flavasepala is a hemiepiphyte, (d) Neomirandea croatii is a woodyepiphyte, (e) Notopleura piticobia is a woody epiphyte, (f ) Oreopanax vestitus is a hemiepiphyte, and (g) Schefflera rodrigueziana is ahemiepiphyte. The bottom panel (h) shows rainfall (bars) and leaf wetness (solid line). Each panel of sap flow data is an average offour to six individuals per species.
August 2015 405ECOPHYSIOLOGICAL STRATEGIES OF EPIPHYTES

FIG. 8. Volumetric sap flow for seven common canopy species in the TMCF of Monteverde, Costa Rica over a nine-day period(19–27 January 2013) in the dry season. (a) Cavendishia capitulata is a woody epiphyte, (b) Chlorigyne ensiformis is an herbaceousmonocot, (c) Clusia flavasepala is a hemiepiphyte, (d) Neomirandea croatii is a woody epiphyte, (e) Notopleura piticobia is a woodyepiphyte, (f ) Oreopanax vestitus is a hemiepiphyte, and (g) Schefflera rodrigueziana is a hemiepiphyte. The bottom panel (h) showsrainfall (bars) and leaf wetness (solid line). Each panel of sap flow data is an average of two individuals per species.
SYBIL G. GOTSCH ET AL.406 Ecological MonographsVol. 85, No. 3

Our findings indicate that these species tolerate the
water limitations that plants commonly experience in
their environment in a variety of ways and that drought
tolerance cannot be accessed solely based on traits
commonly quantified in terrestrial habitats.
Functional trait variation
We found a great deal of variation in most functional
traits in this study, indicating that the ways in which
traits can combine are not only multifaceted but also
increase the range of possible functional strategies that
can coexist in this treetop community. Said another way,
it seems clear from the data collected that plants in this
TMCF community may achieve drought tolerance or
avoidance in a wide variety of ways and use different
combinations of traits. For example, SLA, a commonly
measured trait that relates to photosynthetic capacity
and leaf longevity, varied threefold across the 12 species
measured (Table 2). Leaf toughness, which relates to
structural defense allocation, varied 2.5-fold, though
values were generally high (�600 g). Leaf thickness,
which in this system is likely most related to succulence,
varied fourfold (Table 2).
While trait variation is generally substantial across
species, much of this variation appears to lie along an
axis relating to drought resistance and avoidance. Our
data indicate that there is a trade-off between foliar
water uptake capacity and succulence. Succulent plants
often have a distinct hydrenchymal layer that can act as
a supply of water to photosynthetically active cells
(Ogburn and Edwards 2010). Species with a thicker
hydrenchymal layer in this study also tended to have
tougher (Fig. 3f ) and thicker leaves, and they also had a
higher turgor loss point (Fig. 3e) and a thicker cuticle.
These species may avoid reaching the turgor loss point
by maintaining high structural allocation and water
storage. The limitation of this strategy is that foliar
water uptake capacity is limited (Fig. 3d). Species with
higher foliar water uptake capacity tended to have
limited water storage capacity (i.e., thinner and less
tough leaves) but they likely resist moderate drought by
having lower wTLP and osmotic potential at full turgor.
In addition, these species have a greater ability to offset
water loss by absorbing water directly through their
leaves (Fig. 3a–c). It is important to recognize that our
measures of leaf drought resistance (i.e., wTLP) were on
bulk leaf samples. Averaging of hydrenchymal and
mesophyll cell properties may overestimate the drought
sensitivity of photosynthetically active cells due to the
high level of sensitivity of hydrenchymal tissue. Further
studies should extend such trait analyses to different cell
types within the leaf to confirm if such trait relationships
between water relations traits and functional traits
persist.
The examination of relationships between volumetric
sap flow and functional traits also indicates a trade-off
in ecological strategies in this community. As expected,
foliar water uptake in situ correlated with foliar water
uptake capacity (Fig. 4a). Furthermore, there is a
negative relationship between nighttime flow and foliar
water uptake capacity (Fig. 4d), as well as positive
relationships between nighttime flow and the relative
water content at the turgor loss point (Fig. 4b) and
hydrenchymal thickness (Fig. 4c). The greatest night-
time flow was measured in species that had the greatest
capacity for drought avoidance via leaf water storage.
While in many ecosystems, nighttime sap flow is an
indication of nighttime transpiration (Dawson et al.
2007, Gotsch et al. 2014a, b), in the TMCF canopy,
nighttime flow is more likely a signal of refilling of
succulent leaves; however, stomatal conductance mea-
surements at night would be needed to confirm the
degree to which this signal is indeed refilling.
Evaluation of drought resistance
In studies conducted across a wide range of species
and ecosystems, there is growing evidence that the wTLP,
or water potential at the turgor loss point, may be a
good indicator of drought resistance (Bartlett et al.
2012). In habitats that experience greater water limita-
tion such as semi-deserts or dry temperate forests, the
average wTLP is approximately three times higher than
that of crops or species in a tropical rainforest (Bartlett
et al. 2012). Epiphytes and hemiepiphytes, despite living
in relatively wet tropical forests, are disassociated from
FIG. 9. (a) Maximum volumetric flow (mean and SE) and(b) daily range (mean and SE) in volumetric sap flow for theseven species in the wet (August; nine-day observation period)and dry (January; 30-day observation period) seasons in theTMCF.
August 2015 407ECOPHYSIOLOGICAL STRATEGIES OF EPIPHYTES

the ground during all or part of their life cycle and
therefore are more water limited than their terrestrial
counterparts. Given the water limitation in this com-
munity, we expected these plants to have generally low
wTLP values and we expected the true epiphytes to have a
lower wTLP than hemiepiphytes. In contrast to these
expectations, the average wTLP was �1.1 MPa across
species. This value is in line with the average wTLP for
tropical wet forest terrestrial species (Bartlett et al. 2012)
and does not indicate that this community is more
drought resistant than species that have access to soil
resources. While the two Clusia species had higher wTLP
values than true epiphytes (�0.85 and�0.86), the other
hemiepiphytes we studied had wTLP values more similar
to the wTLP of true epiphytes (Table 2).
Another indicator of drought resistance is the degree
of resistance to the loss of stem conductivity as water
potential declines. Stems that maintain high flow rates
despite increasing tension in the xylem are considered
drought resistant since this ability will facilitate contin-
ued conductivity despite soil water limitation. Although
a somewhat arbitrary value, the water potential at which
the stem experiences a 50% loss of conductivity, or P50,
has been used to compare plants across a wide range of
ecosystems to indicate drought resistance (Sperry et al.
1994, Sobrado 1997, Pockman and Sperry 2000,
Maherali et al. 2004, Bhaskar et al. 2007). Like wTLP,
P50 values tend to correlate with water availability
(Maherali et al. 2004). While there is generally
considerable variation in P50 within ecosystems, average
P50 values range from approximately �1.0 MPa in
tropical rain forests to �5.0 MPa in mediterranean
ecosystems (Maherali et al. 2004). In this study, P50
values were higher than expected and ranged from�0.4MPa in C. capitulata to�1.0 MPa in C. flavasepala (Fig.
2). Despite seasonal water limitation, these species are
not able to maintain conductivity if high tensions exist in
the xylem. Since woody stem segments are needed to
generate vulnerability curves, these measurements were
limited to five species that exhibit large shrub-like or
treelet growth forms. Hemiepiphytes spend part of their
lifecycle as true epiphytes but for many species, large
individuals eventually develop connections with the
ground. Given the size of these individuals, it is possible
they had a direct connection to ground water supplies,
which would reduce the need for a low P50.
Despite wTLP and P50 values that suggest that
epiphytes and hemiepiphytes may not be adapted to
withstand drought, it is more likely that these measures
do not adequately characterize strategies to survive
drought in canopy communities. One additional way
that plants can buffer the effects of seasonal water loss is
by having high capacitance (i.e., water storage capacity)
in leaves, stems, and underground organs (Chaves et al.
2002, Ogburn and Edwards 2010). A trade-off between
capacitance and stem P50 has been recognized whereby
xylem elements that have a greater degree of capacitance
are more vulnerable to cavitation (Meinzer et al. 2009).
High capacitance in leaves, or succulence, is a common
growth strategy in dry areas and is also common in
Clusia sp. and Notopleura sp. that have low SLA and
high leaf thickness (Table 2). While most of the species
in this study did not have conspicuously succulent
leaves, leaf cross sections revealed that a number of
species have leaves with a distinct hydrenchymal layer
(Fig. 5). Even in species that do not contain a distinct
water storage layer, often times there are cells that
appear to be specialized for water storage interspersed
with photosynthetically active cells (Fig. 5; S. G.
Gotsch, personal observation). These observations indi-
cate that capacitance is likely high in this community.
Even though the turgor loss point is high in these
plants, high capacitance may provide an important
buffer to keep the water potential within an appropriate
range to maintain function. In fact, a high water storage
capacity was observed directly in the process of carrying
out pressure–volume curves. In the experience of the
authors, pressure–volume curves on terrestrial species in
the TMCF can be completed generally within 24 hours.
In this study, many of the species required facilitated
bench drying (using fans and light boxes) for up to four
days in order to lose enough mass to complete the
analyses. We suggest that, despite having a high wTLP
and P50, many of the species in this study have other
leaf-level adaptations that maintain leaf water potentials
above the wTLP. In addition to high leaf capacitance,
some of the species in this study appeared to have
additional adaptations to avoid drought. For example,
Cavendishia species exhibit tuber-like growth forms that
appear well-suited for storage. C. ensiformous excretes
mucilage from cut stems which may be an additional
source of stored water (Robichaux and Morse 1990).
Large statured hemiepiphytes such as Oreopanax sp. and
Schefflera sp. may not require adaptations that confer
high capacitance if they have access to ground water (see
Field and Dawson 1998).
Sap flow and water balance in the canopy
All species instrumented with sap flow gauges
exhibited diurnal and seasonal variation in sap flow
and responded quickly to changes in microclimate (Figs.
7–9). Sap flow trials were conducted during one period
without rain in the wet season, which followed three
months of almost daily rainfall (S. G. Gotsch, unpub-
lished data). During this dry and sunny period, epiphytes
exhibited diurnal courses of sap flow (Fig. 7). While
rates were lower during wet periods in January, daily
maximal rates were generally higher during this period
and the ranges of sap flow were greater due to greater
fluctuations in microclimate (Figs. 8 and 9). These data
indicate that, despite water storage in canopy soils and
plants, water limitation likely occurs soon after precip-
itation ceases and canopy plants limit water loss by
closing stomata.
We also found that all species in this study have the
capacity to absorb water via the leaf surface (i.e., foliar
SYBIL G. GOTSCH ET AL.408 Ecological MonographsVol. 85, No. 3

water uptake capacity; Table 2). The degree of
improvement in water potential was related to wTLP,
the osmotic potential at saturation and leaf toughness
(Fig. 3a–c). These improvements in water status are
much lower than the average improvement of 0.8 MPa,
which has been recently observed in terrestrial species in
the TMCF of Monteverde (Goldsmith et al. 2013). This
disparity is likely due to the impact that thick epiphyte
leaves have on the capacity for absorption.
Despite lower levels of foliar water uptake capacity
when compared with terrestrial TMCF plants, in situ
measurements of whole-plant transpiration indicate that
foliar water uptake occurs frequently and is an
important component of both the ecophysiology of the
plants that compose this community as well as the water
balance. To our knowledge, this is the first data set to
describe patterns of whole plant water use in vascular
epiphytes. During the month-long study period in the
misty-windy transition season, foliar water uptake
occurred on average, 48.5% of the hours and resulted
in the reabsorption of 70.5% of the water transpired
during this period. C. capitulata, in an extreme case,
absorbed 96.4% of the total water transpired. This
species is an epiphytic shrub with a high degree of
branching. Each branch tip contains dozens of small
leaves. Such architecture may be specialized for cloud
water interception. On the low end of the spectrum,
foliar water uptake led to the recovery of 37.8% of
transpired water in the hemiepiphyte, S. rodrigueziana.
These values are much higher than recently published
rates of foliar water uptake in terrestrial species in the
TMCF (Goldsmith et al. 2013, Gotsch et al. 2014a), and
indicate that the presence of cloud water and conditions
that maintain leaf wetness are of great importance for
water balance in the canopy community. We suspect
that these values were high due to the presence of mist
and fog during the study period.
Another potentially important component of water
balance in plant communities is nighttime transpiration
(Dawson et al. 2007). Although initially assumed to be
non-existent, this process, which occurs under generally
moist conditions when evaporative demand, or VPD, is
high, has subsequently been found across a wide range
of ecosystems (Feild and Holbrook 2000, Bucci et al.
2004, Dawson et al. 2007, Goldstein et al. 2008, Novick
et al. 2009, Goldsmith et al. 2013, Gotsch et al. 2014a).
In the TMCF, which experiences generally moist
conditions, VPD can vary greatly, even within a single
day, leading to high evaporative demand and water loss
(Holwerda et al. 2010, Munoz-Villers et al. 2012, Gotsch
et al. 2014a). In a recent study in the TMCF of
Veracruz, Mexico, total nighttime water loss comprised
on average, 17% of the total branch-level water loss in a
dominant canopy tree (Gotsch et al. 2014a). Monteverde
is a wetter TMCF than Veracruz due to a greater
incidence of cloud immersion and higher annual
precipitation (Nadkarni 1985, 1994, Holwerda et al.
2010, Munoz-Villers et al. 2012). In this study we also
found a signal for nighttime sap flow, but given the trait
relationships discussed above, it is more likely that this
signal is due to refilling of succulent leaves rather than
transpiration from the leaf surfaces.
CONCLUSIONS
We present some of the first data on whole-plant
water balance and functional trait allocation in the
TMCF canopy community. We have found that plants
in this community exhibit a range of functional trait
combinations including highly conservative growth
forms (i.e., succulent, well-defended leaves) that live in
close proximity to species that exhibit trait combinations
more indicative of high growth rates and photosynthetic
capacity. We have also found that quantifying drought
resistance in this community is not as straightforward as
in many terrestrial plants given the variation in potential
adaptations to withstand water shortage and the high
degree of capacitance of these plants. This complexity is
largely due to an additional axis of trait variation in the
leaf economics spectrum (Reich et al. 1999, Wright et al.
2004) in canopy plants relating to the foliar water
uptake capacity (and relative drought resistance) vs. leaf
succulence (drought avoidance). Plant functional traits
in species across ecosystems have been found to co-vary
in ways that relate to allocation to defense and
photosynthetic ability. In the TMCF canopy, plant
allocation is likely primarily driven by water storage and
foliar water uptake capacity rather than traits such as
specific leaf area or leaf dry matter content, which relate
to growth rate and tissue longevity. The wTLP and P50
values in this community were high, but rather than an
indication of vulnerability to drought stress, these traits
may indicate a strategy of drought avoidance by storing
water rather than withstanding low water potentials.
Lastly, we found that foliar water uptake is an
important component of water balance in this commu-
nity. These results indicate that conditions leading to
leaf wetness (i.e., heavy or long periods of fog and light
rain) are critical factors in the water balance and canopy
water storage of this community. Projected changes in
climate, such as increases in cloud base heights or
periods without rain, will likely have substantial impacts
on epiphyte and hemiepiphyte water relations and water
balance. These impacts may influence larger processes
including ecosystem water cycling.
Future directions
This work provides an important beginning in our
understanding of the ecological strategies and water
balance patterns of epiphytes and hemiepiphytes in the
TMCF, but much remains to be investigated. The number
of species included in this study was limited due to the
difficulty accessing and conducting experiments in the
canopy. We suggest an expansion of this data set to
include a greater proportion of the community and to
include canopy communities in drier microclimates. In
addition, future research should include annual or
August 2015 409ECOPHYSIOLOGICAL STRATEGIES OF EPIPHYTES

seasonal variation in leaf water potentials experienced by
these plants. By quantifying the monthly or seasonal
minimum in leaf water potential of these species, we can
determine the operating safety margins of plants along a
spectrum of drought resistance and drought avoidance.
We also suggest that future research include manipulative
experiments. By directly controlling the water supply, we
can determine the effectiveness of different adaptations to
withstand water stress (i.e., tubers, stem mucilage, leaf
water storage, low wTLP.). Such experiments can also
elucidate trade-offs in the allocation to traits that aid in
the maintenance of low water potential (i.e., traits that
lead to low wTLP and P50) vs. high water storage.
The canopy community has been described as having an
important role in nutrient cycling and water cycling of the
TMCF; understanding how these physiological processes
scale up to affect whole-forest processes, especially water
cycling and balance is still an unanswered question and
warrants greater attention given the importance of the
TMCF in biodiversity and regional hydrology.
ACKNOWLEDGMENTS
The authors thank the Monteverde Cloud Forest Reserve forthe use of laboratory facilities, access to the park, and logisticalsupport. We also thank the Monteverde Institute, especiallyMaricella Solis, for logistical support and help obtainingresearch permits. Sarah McGraw aided greatly in the construc-tion of sap flow sensors and in training undergraduateresearchers at Franklin and Marshall College. Minh Phamand Lynx Guimond provided valuable assistance in the field.Willow Zuchowski and Bill Haber provided valuable assistancein species identification. Rob Skelton, Gregory Goldsmith, andSteve Spadafore provided valuable technical support regardingthe construction and deployment of sap flow sensors. KirkMiller and Eric Lonsdorf provided assistance with multivariatestatistical analyses and non-linear curve fitting. Kathryn Flinn,Paul Hartnick, and Eric Lonsdorf, as well as two anonymousreviewers provided valuable and illuminating comments onearly versions of the manuscript for which the co-authors arevery grateful. Financial support for this research was providedby Franklin and Marshall College.
LITERATURE CITED
Ackerly, D. D., and M. J. Donoghue. 1998. Leaf size, saplingallometry, and Corner’s rules: a phylogenetic study ofcorrelated evolution in maples (Acer). American Naturalist152:767–791.
Ambrose, A. R., S. C. Sillett, and T. E. Dawson. 2009. Effectsof tree height on branch hydraulics, leaf structure and gasexchange in California redwoods. Plant Cell and Environ-ment 32(7):743–757.
Ambrose, A. R., S. C. Sillett, G. W. Koch, R. Van Pelt, M. E.Antoine, and T. E. Dawson. 2010. Effects of height ontreetop transpiration and stomatal conductance in coastredwood (Sequoia sempervirens). Tree Physiology30(10):1260–1272.
Bartlett, M. K., C. Scoffoni, and L. Sack. 2012. Thedeterminants of leaf turgor loss point and prediction ofdrought tolerance of species and biomes: a global meta-analysis. Ecology Letters 15:393–405.
Benzing, D. H. 1989. The evolution of epiphytism. Pages 15–40in U. Luttge, editor. Vascular plants as epiphytes: evolutionand ecophysiology. Springer-Verlag, Berlin, Germany.
Bhaskar, R., A. Valiente-Banuet, and D. D. Ackerly. 2007.Evolution of hydraulic traits in closely related species pairs
from Mediterranean and nonMediterranean environments ofNorth America. New Phytologist 176:718–726.
Blackman, C. J., T. J. Brodribb, and G. J. Jordan. 2010. Leafhydraulic vulnerability is related to conduit dimensions anddrought resistance across a diverse range of woody angio-sperms. New Phytologist 188:1113–1123.
Brodribb, T. J., and H. Cochard. 2009. Hydraulic failuredefines the recovery and point of death in water-stressedconifers. Plant Physiology 149(1):575–584.
Brodribb, T. J., and N. M. Holbrook. 2003. Stomatal closureduring leaf dehydration, correlation with other leaf physio-logical traits. Plant Physiology 132:2166–2173.
Bucci, S. J., F. G. Scholz, G. Goldstein, F. C. Meinzer, J. A.Hinojosa, W. A. Hoffmann, and A. C. Franco. 2004.Processes preventing nocturnal equilibration between leafand soil water potential in tropical savanna woody species.Tree Physiology 24:1119–1127.
Burgess, S. S. O., M. A. Adams, N. C. Turner, C. R. Beverly,C. K. Ong, A. A. H. Khan, and T. M. Bleby. 2001. Animproved heat pulse method to measure low and reverse ratesof sap flow in woody plants. Tree Physiology 21(9):589–598.
Cardelus, C. L., and R. L. Chazdon. 2005. Inner-crownmicroenvironments of two emergent tree species in a lowlandwet forest. Biotropica 37:238–244.
Chaves, M. M., J. S. Pereira, J. Maroco, M. L. Rodrigues,C. P. P. Ricardo, M. L. Osorio, et al. 2002. How plants copewith water stress in the field: photosynthesis and growth.Annals of Botany 89:907–916.
Clark, K. L., R. O. Lawton, and P. R. Butler. 2000. Thephysical environment. Pages 15–38 in N. M. Nadkarni andN. T. Wheelwright, editors. Monteverde: conservation andecology of a tropical cloud forest. Oxford University Press,New York, New York, USA.
Clearwater, M. J., Z. W. Luo, M. Mazzeo, and B. Dichio. 2009.An external heat pulse method for measurement of sap flowthrough fruit pedicels, leaf petioles and other small-diameterstems. Plant, Cell and Environment 32(12):1652–1663.
Dawson, T. E., S. S. O. Burgess, K. P. Tu, R. S. Oliveira, L. S.Santiago, J. B. Fisher, K. A. Simonin, and A. R. Ambrose.2007. Nighttime transpiration in woody plants from con-trasting ecosystems. Tree Physiology 27:561–575.
Engelbrecht, B. M. J., L. S. Comita, R. Condit, T. A. Kursar,M. T. Tyree, B. L. Turner, and S. P. Hubbell. 2007. Droughtsensitivity shapes species distribution patterns in tropicalforests. Nature 447:80–82.
Field, T. S., and T. E. Dawson. 1998. Water sources used byDidimopanax pittieri at different life stages in a tropical cloudforest. Ecology 79(4):1448–1452.
Foster, P. 2001. The potential negative impacts of globalclimate change on tropical montane cloud forests. Earth-Science Reviews 55(1–2):73–106.
Goldsmith, G. R., N. J. Matzke, and T. E. Dawson. 2013. Theincidence and implications of clouds for cloud forest plantwater relations. Ecology Letters 16(3):307–314.
Goldstein, G., F. C. Meinzer, S. J. Bucci, F. G. Scholz, A. C.Franco, and W. A. Hoffmann. 2008. Water economy ofneotropical savanna trees: six paradigms revisited. TreePhysiology 28:395–404.
Gotsch, S. G., H. Asbjornsen, F. Holwerda, G. Goldsmith, A.Weintraub, and T. Dawson. 2014a. Foggy days and drynights determine crown-level water balance in a seasonaltropical montane cloud forest. Plant, Cell and Environment37(1):261–272.
Gotsch, S. G., S. D. Crausbay, A. E. Weintraub, T. W.Giambellucsa, R. Longman, A. Asbjornsen, S. C. Hotchkiss,and T. E. Dawson. 2014b. Water relations and micro-climatearound the upper limit of cloud forest in Maui, Hawai‘i. TreePhysiology 34(7):766–777.
Gotsch, S. G., E. L. Geiger, A. C. Franco, G. Goldstein, F. C.Meinzer, and W. A. Hoffmann. 2010. Allocation to leaf area
SYBIL G. GOTSCH ET AL.410 Ecological MonographsVol. 85, No. 3

and sapwood area affects water relations of co-occurringsavanna and forest trees. Oecologia 163(2):291–301.
Haber, W. A. 2000. Appendix 2. Number of species withdifferent growth forms. Pages 519–522 in N. M. Nadkarniand N. T. Wheelwright, editors. Monteverde: ecology andconservation of tropical cloud forest. Oxford UniversityPress, New York, New York, USA.
Hacke, U. G., J. S. Sperry, W. T. Pockman, S. D. Davis, andK. A. McCulloch. 2001. Trends in wood density andstructure are linked to prevention of xylem implosion bynegative pressure. Oecologia 126:457–461.
Hoffmann, W. A., R. M. Marchin, P. Abit, and O. L. Lau.2011. Hydraulic failure and tree dieback are associated withhigh wood density in a temperate forest under extremedrought. Global Change Biology 17:2731–2742.
Holscher, D., L. Kohler, A. I. J. M. van Dijk, and L. A.Bruijnzeel. 2004. The importance of epiphytes to total rainfallinterception by a tropical montane rain forest in Costa Rica.Journal of Hydrology 292:308–322.
Holwerda, F., L. A. Bruijnzeel, L. E. Munoz-Villers, M.Equihua, and H. Asbjornsen. 2010. Rainfall and cloud waterinterception in mature and secondary lower montane cloudforests of central Veracruz, Mexico. Journal of Hydrology384:84–96.
Ingram, S. W., and N. M. Nadkarni. 1993. Composition anddistribution of epiphytic organic- matter in a Neotropicalcloud forest, Costa Rica. Biotropica 25(4):370–383.
IPCC. 2007. Climate change 2007: the physical science basis.Contribution of working group I to the fourth assessmentreport of the Intergovernmental Panel on Climate Change. S.Solomon, D. Qin, M. Manning, Z. Chen, M. Marquis, K. B.Averyt, M. Tignor, and H. L. Miller, editors. CambridgeUniversity Press, Cambridge, UK.
Jacobsen, A. L., R. B. Pratt, S. D. Davis, and F. W. Ewers.2007. Cavitation resistance and seasonal hydraulics differamong three arid Californian plant communities. Plant, Celland Environment 30:1599–1609.
Kohler, L., C. Tobon, K. F. A. Frumau, and L. A. Bruijnzeel.2007. Biomass and water storage dynamics of epiphytes inold-growth and secondary montane cloud forest stands inCosta Rica. Plant Ecology 193(2):171–184.
Kursar, T. A., B. M. J. Engelbrecht, A. Burke, M. T. Tyree, B.El Omari, and J. P. Giraldo. 2009. Tolerance to low leafwater status of tropical tree seedlings is related to droughtperformance and distribution. Functional Ecology 23(1):93–102.
Lawton, R. O., and V. Dryer. 1980. The vegetation of theMonteverde Cloud Forest Reserve. Brenesia 8:101–116.
Lawton, R. O., U. S. Nair, R. A. Pielke, Sr., and R. M. Welch.2001. Climatic impact of tropical lowland deforestation onnearby montane cloud forests. Science 294:584–587.
Lenz, T. I., I. J. Wright, and M. Westoby. 2006. Interrelationsamong pressure-volume curve traits across species and wateravailability gradients. Physiologia Plantarum 127:423–433.
Maherali, H., W. T. Pockman, and R. B. Jackson. 2004.Adaptive variation in the vulnerability of woody plants toxylem cavitation. Ecology 85:2184–2199.
Markesteijn, L., L. Poorter, H. Paz, L. Sack, and F. Bongers.2011. Ecological differentiation in xylem cavitation resistanceis associated with stem and leaf structural traits. Plant, Celland Environment 34:137–148.
McDowell, N., et al. 2008. Mechanisms of plant survival andmortality during drought: why do some plants survive whileothers succumb to drought? New Phytologist 178:719–739.
Meinzer, F. C., D. M. Johnson, B. Lachenbruch, K. A.McCulloh, and D. R. Woodruff. 2009. Xylem hydraulicsafety margins in woody plants: coordination of stomatalcontrol of xylem tension with hydraulic capacitance. Func-tional Ecology 23:922–930.
Munoz-Villers, L. E., F. Holwerda, M. Gomez-Cardenas, M.Equihua, H. Asbjornsen, L. A. Bruijnzeel, B. E. Marın-
Castro, and C. Tobon. 2012. Water balances of old-growthand regenerating montane cloud forests in central Veracruz,Mexico. Journal of Hydrology 462–463:53–66.
Nadkarni, N. M. 1984. Epiphyte biomass and nutrient capitalof a neotropical elfin forest. Biotropica 16(4):249–256.
Nadkarni, N. M. 1985. Roots that go out on a limb. NaturalHistory 94(2):42.
Nadkarni, N. M. 1994. Factors affecting the initiation andgrowth of aboveground adventitious roots in a tropicalcloud forest tree: an experimental approach. Oecologia100(1–2):94–97.
Nadkarni, N. M., D. A. Schaefer, T. J. Matelson, and R.Solano. 2004. Biomass and nutrient pools of canopy andterrestrial components in a primary and a secondary montanecloud forest, Costa Rica. Forest Ecology and Management198:223–236.
Nadkarni, N. M., and N. T. Wheelwright. 2000. Monteverde:ecology and conservation of a tropical cloud forest. OxfordUniversity Press, New York, New York, USA.
Niinemets, U. 2001. Global-scale climatic controls of leaf drymass per area, density, and thickness in trees and shrubs.Ecology 82:453–469.
Novick, K. A., R. Oren, P. C. Stoy, M. B. S. Siqueira, andG. G. Katul. 2009. Nocturnal evapotranspiration in eddy-covariance records from three co-located ecosystems in theSoutheastern US: implications for annual fluxes. Agriculturaland Forest Meteorology 149:1491–1504.
Ogburn, R. M., and E. J. Edwards. 2010. The ecological water-use strategies of succulent plants. Pages 179–225 in J. C.Kader and M. Delseny, editors. Advances in BotanicalResearch. Volume 55. Academic Press-Elsevier Science,London, UK.
Pammenter, N. W., and C. Vander Willigen. 1998. Amathematical and statistical analysis of the curves illustratingvulnerability of xylem to cavitation. Tree Physiology 18:589–593.
Pinol, J., and A. Sala. 2000. Ecological implications of xylemcavitation for several Pinaceae in the Pacific northern U.S.A.Functional Ecology 14:538–545.
Pockman, W. T., and J. S. Sperry. 2000. Vulnerability to xylemcavitation and the distribution of Sonoran desert vegetation1. American Journal of Botany 87:1287–1299.
Pounds, J. A., M. P. L. Fogden, and J. H. Campbell. 1999.Biological response to climate change on a tropical moun-tain. Nature 398(6728):611–615.
Reich, P. B., D. S. Ellsworth, M. B. Walters, J. M. Vose, C.Gresham, J. C. Volin, and W. D. Bowman. 1999. Generalityof leaf trait relationships: a test across six biomes. Ecology80:1955–1969.
Robichaux, R. H., and S. R. Morse. 1990. Extracellularpolysaccharide and leaf capacitance in a Hawaiian bogspecies, Argyroxiphium-grayanum (Compositae, Madiinae).American Journal of Botany 77(1):134–138.
Roddy, A. B., and T. E. Dawson. 2012. Determining the waterdynamics of flowering using miniature sap flow sensors. ActaHorticulturae 951:47–53.
Sack, L., J. Pasquet-Kok, and A. Nicotra. 2011. Protocols inecological and environmental plant physiology: leaf pressure-volumecurveparameters.CSIROPublishers,Clayton,Victoria,Australia. http://prometheuswiki.publish.csiro.au/tiki-index.php?page¼Leafþpressure-volumeþcurveþparameters#sthash.ZeIoDrIv.dpuf
Skelton, R. P., A. G. West, T. E. Dawson, and J. M. Leonard.2013. External heat pulse method allows comparativesapflow measurements in diverse functional types in aMediterranean-type shrubland in South Africa. FunctionalPlant Biology 40(10):1076–1087.
Sobrado, M. A. 1997. Embolism vulnerability in drought-deciduous and evergreen species of a tropical dry forest. ActaOecologica 18:383–391.
August 2015 411ECOPHYSIOLOGICAL STRATEGIES OF EPIPHYTES

Sperry, J. S., K. L. Nichols, J. E. M. Sullivan, and S. E.Eastlack. 1994. Xylem embolism in ring-porous, diffuseporous and coniferous trees of northern Utah and interiorAlaska. Ecology 75:1736–1752.
Sperry, J. S., and N. Z. Saliendra. 1994. Intra- and inter-plantvariation in xylem cavitation in Betula occidentalis. Plant,Cell and Environment 17:1233–1241.
Still, C. J., P. N. Foster, and S. H. Schneider. 1999. Simulatingthe effects of climate change on tropical montane cloudforests. Nature 789:608–610.
Stull, Roland B. 1999. Meteorology for scientists and engineers.Second edition. Cengage Learning, Stamford, Connecticut,USA.
Tobon, C., L. Kohler, K. F. A. Frumau, L. A. Bruijnzeel, R.Burkard, and S. Schmid. 2010. Water dynamics of epiphytevegetation in a lower montane cloud forest: fog intercep-tion, storage, and evaporation. Pages 261–267 in L. A.Bruijnzeel, F. N. Scatena, and L. S. Hamilton, editors.
Tropical montane cloud forest: science for conservation andmanagement. Cambridge University Press, New York, NewYork, USA.
Tyree, M. T., S. D. Davis, and H. Cochard. 1994. Biophysicalperspectives of xylem evolution: Is there a tradeoff ofhydraulic efficiency for vulnerability to dysfunction? Inter-national Association of Wood Anatomists Journal 15:335–360.
Watkins, J. E., Jr., and C. Cardelus. 2010. Habitat differenti-ation of ferns in a lowland tropical rain forest. AmericanFern Journal 99:162–175.
Willson, C. J., P. S. Manos, and R. B. Jackson. 2008. Hydraulictraits are influenced by phylogenetic history in the drought-resistant, invasive genus Juniperus (Cupressaceae). AmericanJournal of Botany 95:299–314.
Wright, I. J., et al. 2004. The worldwide leaf economicsspectrum. Nature 428(6985):821–827.
SYBIL G. GOTSCH ET AL.412 Ecological MonographsVol. 85, No. 3