Embed Size (px)
Citation preview

Department of Chemical and Biological Engineering Division of Chemical Engineering Department of Energy and Environment Division of Environmental System Analysis CHALMERS UNIVERSITY OF TECHNOLOGY Gothenburg, Sweden 2014 ESA report No. 2014:5
Life cycle energy assessment of
wood-based Nano Fibrillated
Cellulose
Master of Science Thesis in Industrial Ecology
DUONG NGUYEN


ESA REPORT NO. 2014:5
Life Cycle Energy Assessment
of Wood-Based Nano Fibrillated Cellulose
Master of Science Thesis in Industrial Ecology
DUONG NGUYEN
Department of Chemical and Biological Engineering
Division of Chemical Engineering
Department of Energy and Environment
Division of Environmental System Analysis
CHALMERS UNIVERSITY OF TECHNOLOGY
Gothenburg, Sweden 2014

Life Cycle Energy Assessment of Wood-Based Nano Fibrillated Cellulose
DUONG NGUYEN
In collaboration with Innventia
Examiner: Magdalena Svanström
Supervisor: Rickard Arvidsson
© DUONG NGUYEN, 2014.
ESA report no. 2014:5
Department of Chemical and Biological Engineering Division of Chemical Engineering Department of Energy and Environment Division of Environmental System Analysis Chalmers University of Technology SE-41296 Gothenburg Sweden Telephone: + 46 (0)31 -772 1000
Cover: Tree of factors influencing energy use in nano fibrillated cellulose production.
© Duong Nguyen, 2014.
Chalmers Reproservice
Gothenburg, Sweden 2014

i
Abstract
Nanocellulose is a new ‘super material’, stronger than steel, stiffer than Kevlar, transparent
and light, absorbent and conducting electricity, biodegradable and anti-bacterial. As a result,
it attracts a lot of attention from companies and research institutes around the world. It is
likely that commercial nanocellulose and its application products enter the market in the near
future.
However, this new material has an energy use which relates directly to both production cost
and environmental impacts. Therefore, information about the energy use of nanocellulose is
needed as soon as possible to help decision makers in choosing appropriate production
processes from the very early stage of production.
This master thesis aims to analyze the energy use of wood-based nano fibrillated cellulose
(NFC), probably the most common nanocellulose type, from a life cycle perspective. In this
study, two production routes - the enzymatic route and the carboxymethylation route - are
outlined, assessed and compared for a number of different scenarios. The system
boundaries include the extraction of cellulosic materials, the processing of NFC and input
materials, and the transport of materials. The functional unit is 1 kg of NFC. Data is obtained
from three main sources: the Ecoinvent database, presentations and studies from NFC’s
projects and the general scientific literature.
The findings indicate that the total energy use of NFC production for the carboxymethylation
route is much higher than that for the enzymatic route. This higher demand relates mostly to
the chemicals production, especially the organic solvent production. Solvents may not be
perceived as having an energy use by NFC producers, but this is clear when seen from a life
cycle perspective.
This study points out five main factors that strongly affect NFC’s energy demand, namely
pulp properties, pretreatment, treatment, transport and NFC product’s properties. Efforts to
reduce NFC’s energy use should be based on a comprehensive view of both separate
factors and the successful combinations of factors.
Suggestions of future work in the field include a comprehensive LCA (life cycle assessment)
of NFC, and a cradle-to-grave life cycle (energy) assessment of a specific NFC application
product.
Keywords
Life cycle assessment, Life cycle energy assessment, Energy use, Nanocellulose,
Microfibrillated cellulose, Nano fibrillated cellulose.

ii
Acknowledgements
This work could not have been done without the great support from many people.
I wish to thank my supervisor Rickard Arvidsson who first introduced me the interesting fresh
topic of nanocellulose, supported me and encouraged me throughout the work.
I would like to acknowledge the important contribution of my examiner Magdalena
Svanström. I would also like to thank Eva Ålander from Innventia for the valuable information
in Innventia’s projects, and Mathias Janssen from Chalmers for his advises on enzyme
production.
I am grateful to my colleagues and friends, Paul Gontia and Trang Nguyen who gave me
numerous comments on the study.
Ulrika Lundqvist, my local coordinator in the program, is thanked for her kindness during the
time I studied in Chalmers. A special thanks to European Commission for funding the great
Erasmus Mundus Master’s programme in Industrial Ecology (MIND program).
Finally, I would like to thank my family, my friends and my teachers for all the love and
support.

iii
Table of contents
1. INTRODUCTION .......................................................................................................................... 1
1.1. Context ....................................................................................................................................... 1
1.2. Aim and research questions ................................................................................................... 2
1.3. Thesis outline ............................................................................................................................ 2
2. BACKGROUND ............................................................................................................................... 3
2.1. Chemical structure ................................................................................................................... 3
2.2. Classification ............................................................................................................................. 3
2.3. Production .................................................................................................................................. 5
2.4. Application ................................................................................................................................. 7
2.5. Safety ......................................................................................................................................... 8
2.6. Market ........................................................................................................................................ 8
3. METHOD ..................................................................................................................................... 10
3.1. Method description ................................................................................................................. 10
3.1.1. Life Cycle Assessment (LCA) ........................................................................................ 10
3.1.2. Life Cycle Energy Assessment (LCEA) ...................................................................... 10
3.1.3. Goal and scope ............................................................................................................... 10
3.1.4. Sources and software ..................................................................................................... 12
3.1.5. Research process ........................................................................................................... 13
3.2. Production routes ................................................................................................................... 14
3.2.1. Phase description ............................................................................................................ 14
Pulp making ................................................................................................................................. 14
Pretreatment ............................................................................................................................... 15
Treatment .................................................................................................................................... 17
Transport ..................................................................................................................................... 17
3.2.2. Route description ............................................................................................................ 20
Enzymatic route .......................................................................................................................... 20
Carboxymethylation route ......................................................................................................... 23
3.3. Key assumptions .................................................................................................................... 25
Pulp making phase ..................................................................................................................... 25
Pretreatment phase ................................................................................................................... 25
Treatment phase ........................................................................................................................ 26
Transportation ............................................................................................................................. 26

iv
Whole study ................................................................................................................................. 26
4. RESULTS ........................................................................................................................................ 28
4.1. Energy calculation .................................................................................................................. 28
4.2. Baseline scenario ................................................................................................................... 29
4.2.1. Energy divided into main phases .................................................................................. 30
4.2.2. Energy divided into production processes .................................................................. 32
4.2.3. Energy divided into different types ............................................................................... 33
4.3. Scenario analysis ................................................................................................................... 36
4.3.1. Pulp scenarios ................................................................................................................. 36
4.3.2. Ethanol scenarios ............................................................................................................ 37
4.3.3. Transport scenarios ........................................................................................................ 38
4.3.4. Overview of scenario analysis ....................................................................................... 39
5. DISCUSSION ................................................................................................................................. 40
5.1. Comparing energy use in the treatment phase .................................................................. 40
5.2. Comparing energy use in the life cycle process ................................................................ 43
5.3. Factors affecting NFC’s energy use .................................................................................... 44
6. CONCLUSION ............................................................................................................................... 49
REFERENCES ................................................................................................................................... 50

1
1. INTRODUCTION
This chapter provides an overview of the new material nanocellulose and recent publications
related to the topic. The study’s aims and research questions are also described.
An invention of a new material can open a new era in manufacturing industries. By using a
new material with new properties, new functions can be fulfilled. However, a new material
also has an energy requirement which impacts both production cost and the environment.
The question is whether this energy use of the new material exceeds that of existing
materials. Early awareness of the total energy use can help decision makers, including
producers, consumers and policy makers, to avoid energy intensity in new materials and
production processes from very early stages of technological development.
This study investigates a new bio-nano material, namely nanocellulose. It is stronger than
steel, stiffer than Kevlar, transparent and light, absorbent and conducting electricity, bio-
degradable and anti-bacterial. Therefore, this new material promises many potential
applications in the fields of nanotechnology, energy, medicine, food and many others.
Because of the increasing number of companies and research institutes starting projects
related to manufacturing of nanocellulose, the material will probably be produced at
industrial scale in the near future. That is the reason why further understanding of the
material and its production, especially the energy use, is of high interest.
To fulfill this research need, the study analyzes the life cycle energy use of one common
type of nanocellulose: Nano-Fibrillated Cellulose (NFC) made from wood. In this study, the
total energy use of NFC’s production is assessed during three life cycle phases: pulp
production, pretreatment and treatment. Because it is a cradle-to-gate life cycle assessment,
it covers the steps from input raw material extraction to output product at the factory gate.
1.1. Context
These recent years have witnessed a booming development in nanocellulose production and
applications, shown by recent publications about new cellulose sources, new methods to
produce nano-sized fibrils and new functions discovered. The term “nanocellulose” was first
introduced in 1983 (Wågberg et al., 2008). In 2006, nearly 600 scientific documents about
nanocellulose were published. It doubled and reached 1,200 papers after 5 years (Lavoine
et al., 2012).
However, there still remain knowledge gaps related to the life cycle performance of the
material and its products at industrial scale. From producers’ perspective, energy-intensive
manufacturing acts as one of the biggest barriers for up-scaling nanocellulose production.
The mechanical treatment phase, which requires up to 27,000 kWh/tonne, is considered an
energy-intensive step in the process (Ankerfors, 2012). By applying pretreatment processes,
recent process developments have enabled energy use to be reduced by 93% (2,000
kWh/tonne is reported in projects of Innventia, Ankerfors, 2012 and projects of SUNPAP,
Meyer et al., 2012) and even a 98% reduction is projected (Ankerfors, 2012). However, this
energy use is only the tip of the iceberg from a life cycle energy perspective. In 2014, Li and
colleagues calculated the lowest total energy use of NFC at 34.7 MJ/10 g NFC at lab scale,
equal to approximately 963,889 kWh/tonne, even when using pretreatments. The differences
originate from how to define the concept of “energy”, which in life cycle energy assessment

2
(LCEA) implies not only the manufacturing energy but also energy for producing input
materials, energy in raw materials, and energy in transport.
There exist a number of studies on energy demand of nanocellulose production, such as a
comparative study of energy use for different NFC processing routes (Spence et al., 2011),
energy use in several different NFC production routes produced by Innventia (Ankerfors,
2012), energy use in NFC production using TEMPO (2,2,6,6-tetramethylpiperidine-1-oxyl)
oxidation pretreatment in SUNPAP, an European project about Scaling Up Nanoparticles in
Modern Paper Making (Meyer et al., 2012), and approximate energy use for NFC production
in general (Klemm et al., 2011). However, these works provided only energy use for the
production phase, which is the life cycle phase of highest concerned for producers. Until
recently, there are very few academic studies on the topic LCA of nanocellulose, including a
study by Li and colleagues on LCA of NFC (2013), and a study on LCA of nanowhiskers
(Figueiredo et al., 2012).
In this thesis, the energy use of the whole NFC production process is calculated, using a life
cycle perspective. Therefore, it provides more comprehensive results for the whole life cycle
and also specific results for each phase in each production route, which is useful for
producers.
1.2. Aim and research questions
This study aims to assess the total energy use of NFC production. Two different production
routes are described; their energy demands are compared and contrasted in order to provide
useful information for decision makers, including producers, consumers and policy makers.
The research further attempts to answer the following two research questions:
- Which production route in the two selected routes requires less energy for producing
1 kg of NFC?
- What are the main factors that affect energy use of NFC along the whole life cycle?
1.3. Thesis outline
This thesis contains the following chapters. Chapter 1 provides a brief introduction to the
study, including context, motivation and research questions. Chapter 2 brings in background
information of the material nanocellulose, describing its chemical structure, classification,
production, application, safety and market. Chapter 3 presents research methods and
materials. Chapter 4 highlights the main results obtained from the study, in this case the total
energy use and scenario analysis. After that, the results are interpreted and discussed in
Chapter 5. Finally, a conclusion and suggested future work are presented in Chapter 6.

3
2. BACKGROUND
This chapter is about background information on nanocellulose. Its content covers chemical
structure, classification, production, application, safety and market of nanocellulose.
2.1. Chemical structure
The strong, cheap, and light material of nanocellulose, which has been called a “super-
material”, was introduced the first time by Turbak and his colleagues in the 80s (Turbak et
al., 1983). However, it has been revealed that Rayonier and colleagues were the first
producers of cellulose fibrils in nanosize 6 years earlier, according to a report of Turbak on
Over The Wire, in an online magazine by TAPPI (Technical Association of the Pulp and
Paper Industry) (Turbak, undated).
The name correctly indicates the structure of cellulose fibrils at nano-size scale. Cellulose, a
main fibrous component of plants’ cell walls, is a polysaccharide consisting of several
hundred to over ten thousand β-1,4-D-glucan molecules linked in a linear chain (Crawford,
1981). When the size is reduced from micro-size (normal size of cellulose fibers) to nano-
size in one or more dimensions, nanocellulose is created (see figure 1).
Figure 1: NFC’s fiber structure.
Image provided by Ålander, 2014, and are reprinted here with permission.
2.2. Classification
There are several types of nanocellulose, separated by their size, shape and cellulose
source. Table 1 shows different types and terms of nanocellulose, as proposed by Klemm
and colleagues in 2011. Because of the lack of official international standards for

4
nanocellulose up until now, there are many other ways to classify this new material, such as
in the work of Siro and Plackett (2010) and Khalil et al. (2014). In 2012, Lavoine and
colleagues mentioned 20 different terms describing different types of nanocellulose in
publications from 1993 to 2011. To facilitate the commercial transaction of this promising
material, TAPPI developed a roadmap for the international development of nanocellulose,
which also proposed a naming hierarchy (TAPPI, 2011).
Table 1. Types of nanocellulose (Klemm et al., 2011)
Types of nanocellulose Synonym Size
Nano fibrillated cellulose
(NFC)
Microfibrillated cellulose
(MFC), nanofibrils,
microfibrils
Diameter: 5-60 nm
Length: several micrometers
Nano crystalline cellulose
(NCC)
Cellulose nanocrystals,
crystallites, whiskers, rodlike
cellulose microcrystals
Diameter: 5-70 nm
Length: 100-250 nm (made
from plant) or 100 to several
micrometer (made from
bacteria, algae, tunicates)
Bacteria nanocellulose
(BNC)
Bacterial cellulose, microbial
cellulose, biocellulose
Diameter: 20-100 nm
Despite the differences in terminology, in general, on the basis of production methods and
raw material origin, nanocellulose is divided into three main subcategories: (1) Nano
fibrillated cellulose (NFC), a spaghetti-shaped elongated fibril form prepared from wood or
other natural cellulose sources via chemical and/or mechanical treatments, (2) Nano
crystalline cellulose (NCC), a rice-shaped crystalline form prepared from plant, animal or
bacteria-originated cellulose produced via acid hydrolysis, and (3) Bacteria nano-cellulose
(BNC), a network form of nanocellulose produced by bacteria or genetically transformed
algae (Klemm et. al, 2011, Li et. al, 2013). Figure 2 illustrates NFC products of Innventia, a
Swedish NFC producer.

5
Figure 2. NFC products produced by Innventia: (from left to right) (1) NFC generation 1,
produced by enzymatic process, 2 wt %; (2) NFC generation 2, produced by
carboxymethylation process, 7 wt %; (3) NFC generation 2, produced by carboxymethylation
process, 2 wt %. Images are provided by Ålander, 2014, and are reprinted here with
permission.
2.3. Production
Theoretically, nanocellulose can be produced from any cellulose source from wood, other
crops and bacteria. While NFC and NCC can be created by the disruption of hydrogen
bonds in the cellulose until it reaches nano-scale (top down process), BNC can be directly
produced from certain bacteria (bottom up process).
Recently, a brand new method to produce BNC was reported. Dr. Brown from University of
Texas introduced a process of engineering nanocellulose genes of A. xylinum (vinegar
bacterium) into blue-green algae (Algae Industry Magazine, 2013). By doing that, these
algae (Cyanobacteria) had the potential to release nanocellulose directly into their
surroundings, making it easier to harvest. However, natural generation rates of
cyanobacterial nanocellulose are low, which limits the potential of producing BNC in
commercial scale. When this problem is solved, the process for making BNC will be “cheap,
fast and involved nothing else than water, sunshine and time”, according to the Huffington
Post UK (2013). Scientists expect the successful mass production of both biofuels and
nanocellulose made by these algae.
When it comes to NFC and NCC, among many types of sources, wood pulp is one of the
most commonly used. Pulp is normally manufactured by breaking down the bulk structure of
cellulose fibers; therefore it is already half way to create nanofibrils. The complete process
requires further steps to split up pulp fibers into smaller, nano-sized fibrils. Figure 3 shows
an example of a life cycle of NFC from cradle (wood extraction) to grave (end of life, which
could involve recycling, incineration, landfilling or other waste management methods).

6
Figure 3. Generic life cycle of wood-based NFC.
In general, one could divide the production process of nanocellulose (NFC and NCC) into
three main stages. First is the transformation phase from wood to pulp, which has been done
for years in pulp mills. This process aims to break down the bulk structure of the wood fiber
source into the constituent fibers in pulp. It can be done either by chemical processes in
which lignin and hemicellulose (other parts of plants’ cell walls) are degraded and washed
away, or mechanical processes when cellulose fibers are simply torn apart. There are also
hybrid methods with supplement chemical and thermal treatments in pulp making.
Next are the two main phases of nanocellulose production: pre-treatment and treatment,
when pulp fibers are separated in serial steps to make nanocellulose. In early times, the
process included only the treatment phase in which the manufacturer produced
nanocellulose by a high pressure homogenizer (Turbak et al., 1983). It is a machine widely
used in food and paint industries to disrupt bulk input materials into small uniform particles
(Spence et al., 2011). In the homogenization process, cellulose fibers are subjected to a
large pressure drop with shearing and impact forces (Nakagaito and Yano, 2004). The
process’ disadvantages are energy intensity and clogging problems, particularly in the
moving parts (Spence et al., 2011). Homogenization is the conventional mechanical
treatment in the nanocellulose production at industrial scale. After that, new technological
solutions, such as fluidization and sonication, were brought in. Micro-fluidization is commonly
used in the cosmetic, biotechnology, and pharmaceutical industries (Microfluidics
Corporation, 2010). In this process, cellulosic pulp is passed through an intensifier pump,
followed by an interaction chamber which defibrillates the fibers by shear forces and impacts
against the channel walls and colliding streams. Because the micro-fluidizer has no in-line
moving parts, it reduces the likelihood of clogs, compared to the homogenizer (Spence et al.,
2011). Sonication is a mechanical process which uses oscillating power to isolate cellulose
fibrils by hydrodynamic forces of ultrasound (Cheng et al., 2009). Khalil and colleagues
suspected that mechanical methods with high energy use can cause a dramatic decrease in
both the yield and fibril length (Khalil et al., 2014). The treatment phase, which requires up to
27,000 kWh/tonne product when using homogenization (Turbak et al., 1983), is often
considered the most energy intensive step in the whole process.

7
To reduce the total energy use and thereby obtain cost savings, scientists have proposed
several mechanical and chemical pre-treatment processes. Applying these processes
decreases the energy use for treatment to about 2,000 kWh/tonne product, equal to 93%
reduction (2,000 kWh/tonne was reported in projects of Innventia - Ankerfors, 2012 and
Meyer et al., 2012). Some common and feasible processes in the pre-treatment and
treatment phases are shown in Table 2.
Table 2. Methods for nanocellulose production (NFC and NCC)
Phase Process Source
Pretreatment Physical refining Ankerfors, 2012
Spence et al., 2011
Pääkkö et al., 2007
TEMPO oxidation Li et al., 2013
Klemm et al., 2011
Carboxymethylation Li et al., 2013
Ankerfors, 2012
Klemm et al., 2011
Enzymatic hydrolysis Ankerfors, 2012
Klemm et al., 2011
Pääkkö et al., 2007
Treatment Homogenization Li et al., 2013
Isogai et al., 2011
Klemm et al., 2011
Spence et al., 2011
Pääkkö et al., 2007
Micro-fluidization Ankerfors, 2012
Spence et al., 2011
Micro-grinding/shearing Spence et al., 2011
Pääkkö et al., 2007
Sonication Li et al., 2013
Different combinations of pretreatment and treatment processes can create different
production routes. After the treatment phase, the NFC product has a gel-like shape
containing a major fraction of water (Figure 2), for example standard 2% gel-like MFC
product (Pääkkö et al., 2007). Further processes such as purification, dilution, etc. can be
applied to make nanocellulose with different concentrations. The material can then be
functionalized through specific processes to produce nanocellulose-based products,
including films, nanocomposites, coatings, etc.
Researchers continuously propose additional processes and new combinations of feasible
methods in order to reduce energy demand on one hand and improve material properties on
the other hand. The fact that many solutions give successful results at lab scale but fail at
industrial scale implies the need of further investigation in this field.
2.4. Application
Manufacturers expect a big success in nanocellulose-based products thanks to its special
properties. Nanocellulose is suitable for food and emulsion applications, medical, cosmetic

8
and absorbent products. It can also be used in various nanocomposites, packaging, coating
additives and gas barriers (Klemm et al., 2011).
According to VTT Technical research center of Finland, in 2011, composite material
contributed a 38% share of the total nanocellulose applications’ market, becoming the
largest market segment. It was followed by non wovens adsorbent web (18%), paper and
board (16%) and food products (13%). The smaller market segments (less than 10% of total)
were paper and board coating (8%), filter material (4%) and cosmetics and toiletry (3%)
(Koskinen et al., 2011).
Abundant applications of this new material motivate manufacturers to enter the market as
fast as they can. However, pioneers have to face high risks, including the lacking policy,
limited feasible technology and the doubts about how good this material actually is.
2.5. Safety
Novel substances and materials may come with new hazards. A recent study indicated that
another novel nanomaterial, graphene, has considerable toxicity which may cause adverse
environmental and health effects (Arvidsson et al., 2013). In fact, a number of environmental
and safety concerns have been raised for nanomaterials in general. Nel and colleagues, in
2006, mentioned the ability of harmful interactions between nanomaterials and biological
systems and the environment. In 2011, Arvidsson et al. outlined challenges in exposure
modeling of nanoparticles in aquatic environments.
Therefore, when nanocellulose is expected to be mass produced, it requires further research into health, safety and environmental burdens. However, no immediate environmental and safety concern related to exposure of wood-based nanocellulose has been reported yet. In 2011, Vartiainen and colleagues noticed no toxicity in the friction grinding and spray drying processes of NFC. In their study, no evidence of inflammatory effects or cytotoxicity on mouse and human macrophages were observed, and ecotoxicity tests showed high NOEC (no effect concentration) values. Although no significant effects were detected, additional hazard studies were recommended to dig deeper in the field (Rouhiainen, 2011). Furthermore, it is necessary to understand the safety of each type of nanocellulose and each modification. Potential risks should also be considered in each step of the production of nanocellulose, and also in the production of input materials needed to manufacture nanocellulose. For instance, bleaching is an important part of the pulp production. Evidences showed that bleaching of pulps may cause significant environmental impact through the release of organic components into waterways (Sonnenfeld, 1999). This negative impact may also contribute to environmental impacts of NFC made from bleached pulp. Such environmental impacts along the life cycle of nanocellulose imply consideration of the whole life cycle by the method of LCA, described further below.
2.6. Market
People have called nanocellulose a “super material” due to its plentiful outstanding
properties in comparison with other available materials on the market. That is the reason
why more and more companies and institutes make efforts in developing commercial scale
production of this material. According to ArboraNano, The Canadian Forest Nanoproducts
Network, until 2012, the biggest production capacity at current rate, reaches around 10 kg
NCC/day (Bio Vision Technologies Inc., Canada) and 500 kg NFC/day (The US Forest

9
Service). Innventia, a Swedish company, produces approximately 100 kg NFC/day. A
Canadian company, Celluforce Inc. projected to have 1 tonne product/day. Table 3 lists
some nanocellulose suppliers who have announced their production capacity. In total, these
numbers indicate an annual production rate of 200 – 300 tonnes/year of nanocellulose
(excluding the projected future capacity), with most being in the form of NFC.
Table 3. Nanocellulose suppliers (ArboraNano, 2012, Rebouillat and Pla, 2013).
Producers Production capacity Country
Alberta Innovates – Technology Futures
NCC, 100 kg/week, projected rate Canada
Bio Vision Technologies Inc. NCC, 4 tonne/year Canada
Celluforce Inc. NCC, 1 tonne/day, projected rate Canada
FP Innovations NCC, 10 kg/week Canada
Innventia NFC, 100 kg/day Sweden
The US Forest Service NCC, 35-50 kg/day, projected rate USA
The US Forest Service in collaboration with University of Maine
NFC, 500 kg/day USA
In addition, there are many other big companies around the world that started a project in
nanocellulose, for example J. Rettenmaier & Söhne GmbH, BASF and Zelfo Technology in
Germany, Cellucomp Ltd. in UK, CTP/FCBA in France, Melodia in Israel, Borregaard
Chemcell in Norway, Stora Enso and UPM-Kymmene in Finland, Nippon paper, Asahi Kasei
and Daicel corporation in Japan, Verso paper and FMC biopolymer in USA. Moreover,
nanocellulose projects have increased in numbers: EU projects such as SUNPAP and
SustainComp, ArboraNano in Canada, EMPA in Switzerland, Agenda 2020 in USA and
many projects at universities. Considering this high number of companies, the 200-300
tonnes/year is probably an underestimation, since it does not include universities and
companies that do not report their production rates. Besides, it further seems that European
actors focus more on NFC, while North American ones focus more on NCC.

10
3. METHOD
In this chapter, the research method is presented in steps. Life cycle energy assessment,
goal and scope, system boundary and database are defined. After that comes the system
description including the explanation of phases and routes used in the research.
3.1. Method description
3.1.1. Life Cycle Assessment (LCA)
In the umbrella document ISO 14040:2006, life cycle assessment (LCA) is defined as a
technique for assessing the environmental aspects and potential impacts associated with a
product or service throughout its life cycle, from the cradle, where the raw materials were
extracted, to the grave, the disposal. An LCA is implemented by compiling an inventory of
relevant inputs and outputs of a product system, evaluating the potential associated
environmental impacts, and interpreting the results in relation to the research objectives
(Baumann and Tillman, 2004). LCA typically follows the main steps of goal and scope
definition, inventory analysis, and impact assessment.
3.1.2. Life Cycle Energy Assessment (LCEA)
Life cycle energy assessment is an approach that accounts for all energy inputs to the
product or service, not only energy use during manufacturing and other processes but also
energy needed to produce input materials and services during the whole life cycle. In other
words, the total energy use during the production is analyzed from a life cycle perspective.
An LCA study often includes several different impact categories, such as global warming
potential, acidification potential, and eutrophication potential, which are assessed in the
impact assessment step. However, in a life cycle energy assessment, energy use is the only
included impact category. This is similar to the method of carbon footprint assessment, in
which global warming potential is the only included impact category.
3.1.3. Goal and scope
Functional unit
The functional unit of this study is defined as 1 kilogram equivalent dry mass of NFC at the
factory gate. This study focuses on the common NFC final product with 2% w/w
concentration. Energy use is calculated in the unit of megajoules per kilogram NFC (MJ/kg
NFC).
System boundary
This study applies a cradle-to-gate perspective (Baumann and Tillman, 2004), considering
the aim to assess the energy required to produce the NFC material. The time horizon
considered is approximately ten years from now, making this a prospective LCA study,
similar to the prospective LCA of the nanomaterial graphene by Arvidsson et al. (2014).
The total energy use of NFC production in this study is categorized in three different ways,
shown in figure 4. The first divides the energy use into the three main phases of pulp
making, pretreatment and treatment. The second divides the energy use in another way,

11
namely into pulp production, chemical production, manufacturing (including both
manufacturing in pre-treatment and treatment), and transports. The third divides the energy
use into different types of energy: biomass, resource, heat, electricity and fuel. Biomass is
the energy content of bio-based feedstock such as wood and corn. Resource includes the
fossil resources (crude oil, natural gas and hard coal) and other energy resource (energy in
hydropower reservoir).
Heat is the energy for heating from different sources. Fuel includes both the energy listed as
‘fuel’ in LCI of each input material (in the Ecoinvent database) and the fuel for transports
within the processes and between the processes. In order to enable comparability between
electricity and heat, electricity use is converted to its corresponding heat requirements by the
heat-to-electricity conversion factor. For electricity produced by combustion of fossil fuels,
the factor is 0.3, thereby accounting for energy losses in such electricity production
(Arvidsson et al., 2014). For electricity produced by renewable sources, the factor is 1. Put
differently, energy carriers are recalculated into their corresponding primary energy. Note
that the energy indicator in this study is the total extracted energy as defined by Arvidsson et
al. (2012). It is the sum of renewable energy and nonrenewable energy and includes
feedstock energy.
Figure 4. Energy analysis approaches and categories.
Cradle-to-gate assessment covers the steps from extracting resources to the factory gate. In
particular, the system boundary (figure 5) contains the extraction of cellulosic materials, the
processing of cellulose into NFC, input materials required, and the transport of materials, but
not the manufacturing of NFC application products, the use and disposal phases. The
making of NCF-based products (NFC application products) differs for specific applications.
As a result, cradle-to-grave assessment connects directly to a specific NFC application
product while cradle-to-gate is generic for the NFC material. The system model of NFC
material could, however, be expanded to include the use and end-of-life phases of certain
NFC application products in future studies. Note that the two different main production routes
in this study are the enzymatic route and the carboxylation route.

12
Figure 5. System boundary of this study.
Transportation of input materials includes the transport of wood from the forest or
plantation, and the transport of enzyme and chemicals to the NFC factory (figure 6). The
transport of wood includes a local production scenario and an import scenario. The
transport of other materials includes import scenarios with different exporter regions. In
this study, it is assumed that the NFC factory is inside the existing pulp mill due to the
fact that wood-based NFC producers are likely pulp producers.
Figure 6. Transport routes
(enzyme factory is only included in the enzymatic production route).
3.1.4. Sources and software
Data is obtained from three main sources: the online Life Cycle Inventory (LCI) database
Ecoinvent version 2.2 (2010), presentations and research about NFC production in
Innventia’s project (Ålander, 2014, Ankerfors, 2012) and SUNPAP project (Meyer et al.,
2012), and articles from the scientific literature. Several software and online tools were used,

13
such as Excel for calculating energy use, and Searates.com for calculating the transport
distances.
3.1.5. Research process
This study uses a three-step research process (figure 7) that includes three sources of data:
the Ecoinvent database, project literature and scientific literature.
Figure 7. Three-step research process applied in this study.
1. Step one is a data collecting step.
- Data in the pulp making phase is collected from the Ecoinvent database. In the study,
four types of pulp mentioned in studies by Ankerfor et al. (2012), Li et al. (2013),
Pääkkö et al. (2007), Spence et al. (2011), and Wågberg et al. (2008) are selected.
- Data for the pretreatment and treatment phases is collected from multiple sources.
Research literatures show feasible NFC production processes. Project literatures
(presentations of NFC producers) indicate which processes are being applied. In this
study, carboxymethylation and enzymatic processes are selected because they have
detailed step descriptions and manufacturing energy calculation. Steps in these
processes identify which input materials need to be analyzed. Data of these input
materials is searched in the Ecoinvent database and relevant literatures.
2. Step two is an analyzing step.
- Data of the input materials in the two processes mentioned by Pääkkö et al. (2007)
and Wågberg et al. (2008) is re-calculated for 1 kg NFC. From the process, the data
needed is identified. After calculation, the energy data is filled in the process. Three
phases (pulp making, pretreatment and treatment) are combined to make the life

14
cycle routes. Note that NFC production processes in most literatures illustrate only
two phases (pretreatment and the treatment phases).
- A baseline scenario is made for the enzymatic life cycle route and the
carboxymethylation route. In this scenario, total energy is analyzed in three ways:
energy in different phases, energy in different productions and energy in different
types (see figure 4).
- Other scenarios are made concerning the differences in the types of pulp, the
sources of ethanol and the transport options (routes and vehicles).
3. Step three is a conclusion step.
- Total energy use is calculated. The worst case and the best case show the range of
energy use in NFC production.
- Factors influencing the energy use of the NFC production are identified.
Some assumptions are made during the process. They are described in the section: Key
assumptions.
3.2. Production routes
This section describes the production routes in each phase and in each route.
3.2.1. Phase description
This study only includes NFC made from wood pulp. The cradle-to-gate route can be
described in three main phases, where each phase contains several detailed options
(transport is included in each phase):
- Pulp making (four different types): Bleached sulfite, bleached sulfate ECF (Elemental
Chlorine Free), bleached sulfate TCF (Totally Chlorine Free) and unbleached sulfate.
- Pretreatment (two different processes): Carboxymethylation and enzymatic hydrolysis.
- Treatment (one process only): Micro-fluidization.
Pulp making
This study calculated the total energy use of NFC with four choices of input pulp used in
never-dried form. Pulping is the process of separating wood fibers. The two main types of
chemical pulps are the more common sulfate pulp, also known as Kraft pulp, and the sulfite
pulp. The major difference between the two types of pulps is the chemicals used to dissolve
the lignin (Brady et al., 1998).
Bleaching is the chemical process of whitening pulp, mostly used in paper making. The
process may cause notable environmental effects, primarily through the release of organic
materials into waterways. Conventional bleaching using elemental chlorine produces a large
amount of chlorinated organic compounds, especially chlorinated dioxins which are highly
toxic and persistent in the environment. Concerning this issue, many producers have applied
more environment friendly bleaching processes such as ECF and TCF. TCF removes
chlorine completely from the process while ECF can substantially reduce but cannot fully
eliminate chlorinated organic compounds from effluent.
This study includes alternatives of bleached and unbleached pulps, sulfite and sulfate pulps,
produced from a mixed source of softwood and hardwood, in Scandinavian and European

15
forests or plantations. There are four types of pulps in this study; energy use for each type of
pulp is calculated.. Data is available in the Ecoinvent database (version 2.2) for the following
pulps:
- Bleached sulfite pulp: 11% European industrial hardwood, 8% Scandinavian industrial
hardwood, 48% European industrial softwood, 33% Scandinavian industrial softwood (%
in volume).
- Sulfate pulp (bleached sulfate pulp ECF, bleached sulfate pulp TCF, unbleached sulfate
pulp): 14% European industrial hardwood, 19% Scandinavian industrial hardwood, 20%
European industrial softwood, 27% Scandinavian industrial softwood, 9% industrial
residue softwood, 11% Scandinavian softwood chips (% in volume).
Table 4. Energy and Fuel Data (Staffell, 2011)
Net calorific value (MJ/kg)
Crude oil 43.1
Gasoline 44.2
Diesel 42.9
Fuel oil 40.9
Coal 25.8
Natural gas 45.9
Energy in the pulp making phase includes the energy use of input chemical production and
energy for pulp transportation. Data of input chemicals in the pulp making phase is also
taken from the Ecoinvent database. The energy use of such input chemical is calculated
using the energy content i from table 4. The relation 1kWh = 3.6 MJ was used to convert
energy units. This data is applied in all three phases: pulp making, pretreatment and
treatment.
Pretreatment
The enzymatic production route requires a commercial cellulase named monocomponent
endoglucanase (Novozym 476, Novozym A/S) to weaken the fibre walls (Pääkkö et al.,
2007). This enzyme degrades only the cellulose but not the hemicelluloses, which facilitates
refining. Refining is the step before the main enzymatic process because it swells the cell
walls, enabling the enzyme to penetrate them. After that, the endoglucanase facilitates the
disintegration of cellulosic fiber pulp by increasing its swelling in water. After the enzymatic
hydrolysis step comes the second refining to delaminate the fibers. This refining step avoids
the clogging during the treatment phase (Ankerfors, 2012).
In the carboxymethylation process, high charge density in the cell wall increases the
electrostatic repulsion which leads to fiber swelling. The swelling, in turn, creates lower
delamination resistance in the fibers. As a result, cellulose fibrils can be easily separated
(Ankerfors, 2012).
In this study, energy use in the pretreatment phase contains energy for input chemical
production, direct manufacturing energy and energy in the transport of input materials used
in the pretreatment. The energy for chemical production is calculated based on data for each
chemical in the Ecoinvent database, the energy content in table 4 (Staffell, 2011) and the
conversion factors which will be explained later. The energy use of enzyme production is

16
based on a study of Liptow et al. (2013). The mass of the material is re-calculated for 1 kg of
NFC based on the ratio in two experiments by Pääkkö et al. (2007) and Wågberg et al.
(2008).
Detailed calculations of some specific input chemicals are described below. In the enzymatic
route, trisodium phosphate is substituted for both monopotassium phosphate and disodium
phosphate in phosphate buffer used by Ankerfors, 2012. Monopotassium phosphate has the
concentration of 1.44 g/L and disodium phosphate has the concentration of 0.24 g/L
(Wikipedia, 2014). Thus the concentration of phosphate buffer is equal to 1.68 g/L,
corresponding to 0.042 kg in 25 L (the phosphate buffer’s volume is calculated from a study
by Pääkkö et al., 2007). That study also mentioned the volume of enzyme as 170 µL, without
any information about enzyme concentration. In this study, the mass of enzyme is assumed
to be 170 mg. The amount of enzyme, in both volume and mass, is very small compared
with other input chemicals, thus the assumption likely does not affect the final results.
In the carboxymethylation route, the concentration of organic solvents (ethanol, isopropanol
and methanol) is assumed to be 100% pure. Mass of these solvents is calculated by the
equation m = D*V, in which m is mass, D is density, and V is volume. Density of ethanol is
0.789 kg/L, that of isopropanol is 0.786 kg/L and of methanol is 0.792 kg/L (Wikipedia,
2014). Volume of all input chemicals is calculated for 1 kg of NFC based on the ratio in the
experiment of Wågberg et al. (2008). The mass of acetic acid is also calculated by the
equation m = D*V, in which D (kg/L) is converted from the concentration 0.1 M (Wågberg et
al., 2008). Sodium carbonate is substituted for sodium bicarbonate; its mass is calculated by
the equation m = C*V/(1-C); C is the concentration of 4% w/w (Wågberg et al., 2008).
Concerning the manufacturing energy, it covers both electricity and heat. Energy in refining
and re-refining steps (in the enzymatic route) is considered to be electricity. Electricity is
reported as the corresponding heat needed to produce that amount of electricity, converted
with the heat-to-electricity conversion factor of 0.3 for nonrenewable energy source and the
factor of 1 for renewable energy source (Arvidsson et al., 2014). A general percentage of
renewable and nonrenewable electricity production for Europe of 20.9% and 79.1%,
respectively, is applied in the study. This ratio is taken from a report of the electricity
production and use in Europe, according to European Environment Agency (2013). Heat use
includes incubation and enzyme denaturation (enzymatic route) and energy for heating
isopropanol (carboxymethylation route). These conversion factors are used in all three
phases: pulp making, pretreatment and treatment.
To calculate the heat needed to change the temperature of the solution, the heat equation is
used: Q = c*m*ΔT; Q represents the amount of heat, c is the heat capacity per unit mass of
the solution, m is the mass of the solution and ΔT is the change in temperature before and
after heating (see table 5). In this study, the temperature before heating is assumed to be
equal to standard room temperature at 21°C (Wikipedia, 2014).

17
Table 5. Heat calculation in the study
Step c (J/gK) m (kg) ΔT Q (MJ/ kg NFC)
Incubation (enzymatic route)
4.1818 (c for water, Wikipedia)
25 kg buffer + 1 kg pulp = 26 kg (mass of enzyme is 170 mg, being negligible)
50°C – 21°C = 29
3.15
Enzyme denaturation (enzymatic route)
4.1818 (c for water, Wikipedia)
25 kg buffer + 1 kg pulp = 26 kg (mass of enzyme is 170 mg, being negligible)
80°C – 21°C = 59
6.42
Heating isopropanol (carboxy-methylation route)
2.68 (c for iso-propanol, Wikipedia)
m = D*V = 0.768 kg/L*18.18 L = 13.96 kg (D is density of isopropanol, V is volume of isopropanol per kg NFC, calculated from a study of Wågberg et al., 2007)
82.5°C – 21°C = 61.5°C (82.5°C is the boiling temperature of isopropanol)
2.31
Treatment
Micro-fluidizer is a machine to liberate the nanofibrils from the fiber wall fragments. In the
machine, pulp is passed through an intensifier pump, followed by an interaction chamber
which defibrillates the fibers by shear forces and impacts against the channel walls and
colliding streams. Processing with a micro-fluidizer reduces the likelihood of clogs to
compare with a homogenizer because it has no in-line moving parts (Spence et al., 2011).
In the study, the energy data in treatment is taken from Ankerfors’ experiments in 2012
(2,344 kWh/tonne and 2,221 kWh/tonne in the enzymatic and carboxymethylation routes,
respectively). The energy is converted to MJ/kg NFC, and then re-calculated using the heat-
to-electricity conversion factor and the ratio in European electricity production.
Transport
Energy for transport covers transport within processes and transport between processes.
Data of the transport within processes is calculated for each input material, using the
Ecoinvent database version 2.2. Data of the transport between processes depends on each
scenario of transport. Transport of pulp and input materials for producing pulp is included in
the pulp making phase. Transport of input chemicals for producing NFC is included in the
pretreatment phase. The treatment phase does not contain transport.
Table 6 shows the types of vehicles assumed in the study. Trucks are convenient vehicles
for both short and long distance. This study focused on the use of two types of truck:
medium sized, regional distribution truck and truck with semi-trailer, long distance transport.
Railway transport was considered in some scenarios, including two types: diesel and electric
trains. Ship was used to transport products oversea, thus large ship was chosen among
types of ships. All types of mentioned vehicles and their energy use per metric tonne km
(MJ/tkm) were taken from the book The Hitch Hiker’s Guide to LCA (Baumann and Tillman,
2004).

18
Table 6. Types of vehicles in this study (Baumann and Tillman, 2004)
Type of vehicle Characteristic Energy use (MJ/tkm)
Medium sized truck 14-24 tonnes weight, 8.4-14 tonnes pay load capacity, 10 m length, regional distribution.
1.87
Truck with semi-trailer 40 tonnes weight, 26 tonnes pay load capacity, 18 m length, long distance transport.
0.72
Electric rail car goods train 0.151
Diesel train 0.245
Large ship > 8000 dwtonnes*, 14 knots** speed 0.216
*Deadweight tonnage (dwtonne) is a measure of how much weight a ship is carrying or can
safely carry (Wikipedia, 2014).
**Knot: The knot is a unit of speed equal to one nautical mile (1.852 km) per hour,
approximately 0.51 m/s (Bartlett, 2003).
When using truck, the distance was doubled because the truck was assumed to travel two
ways, one way full of products and one way empty. However, only one way was considered
for train and ship since their load capacity was much higher than truck. Beside the
concerned input materials, many other products are transported simultaneously in the
containers in both ways, resulting in no empty transport. Data in the transport within
processes is collected from Ecoinvent which does not show the exact types of vehicles and
their energy use but only some descriptions of the vehicles. Assumptions of the vehicles’
types are made (see the section 3.3. Key assumptions). All the vehicles’ types and their
energy use are taken from the book The Hitch Hiker’s Guide to LCA (Baumann and Tillman,
2004), see table 6.
In transports between processes, specific distances were presented in each scenario (see
table 8). The 8 combinations under table 7 desmonstrate the 8 scenarios. Specific vehicles
were assumed for each case (see table 7). Table 7 shows the route way for different
scenarios of transport between processes. Transports within processes are the same as in
the baseline scenario. Transports between processes, however, are different depending on
the assumptions of location and types of vehicle used.
In the transport between processes, Stockholm was chosen as a pulp and NFC
manufacturing location in this study. Assumptions of locations are made to calculate the
distances (see table 8). Distances are calculated by Searates.com and Google map.

19
Table 7: Transport between processes
Product Route way Vehicle Code
Wood Swedish (local) wood Train, electric A
Truck, semi-trailer B
Import from Russia Truck, semi-trailer
Train, average
Ship, large
C
Truck, semi-trailer D
Chemical Import from Germany Truck, semi-trailer
Ship, large
E
Import from China Truck, semi-trailer
Ship, large
F
Enzyme (in
enzymatic route)
Import from Denmark Truck, semi-trailer
Ship, large
G
Different combinations of distances and vehicles give a number of scenarios:
- Scenario 1: transport within processes + A + E (+G)
- Scenario 2: transport within processes + A + F (+G)
- Scenario 3: transport within processes + B + E (+G) (baseline scenario)
- Scenario 4: transport within processes + B + F (+G)
- Scenario 5: transport within processes + C + E (+G)
- Scenario 6: transport within processes + C + F (+G)
- Scenario 7: transport within processes + D + E (+G)
- Scenario 8: transport within processes + D + F (+G)
The distance of transporting wood was calculated from the wood extraction point in the
forest or plantation to the NFC gate (with an assumption that the pulp factory and the NFC
factory are the same). In the import case, the distance was the sum of separate roads from
Russian forest or plantation to wood factory, from wood factory to the port, from Russian port
to Swedish port, and finally from that port to the NFC factory gate. Similar procedures were
used for the scenarios of importing chemicals and enzyme from Germany, China and
Denmark. Details of the selected locations and the specific distances in each scenario are
shown in table 8.

20
Table 8. Assumptions of transport routes in the transport between processes
Transport route Description Assumption Distance (km) Note
From local forest
to NFC factory
From Swedish
forest to NFC
factory
Length of Sweden
from North to
South
1,574 (train)
1,574*2 (truck)
Maximum value
From foreign forest
to NFC factory
(import)
From Russian
forest to Russian
factory
From Ukhta to
Saint Peterburg
1,715 (train)
1,715*2 (truck)
From Russian
factory to Russian
port
Equivalent to the
distance from
Stockholm to
Nynäshamn port
60*2 (truck) Nynäshamn is a
port near
Stockholm,
Sweden.
From Russian port
to Swedish port
From Saint
Peterburg port to
Nynashamn port
730 (ship) Saint Peterburg is
one of the major
ports in Russia.
From Swedish port
to NFC factory
From Nynäshamn
port to Stockholm
60*2 (truck)
From enzyme
factory to NFC
factory (import)
From Danish
factory to Danish
port
Equivalent to the
distance from
Stockholm to
Nynäshamn port
60*2 (truck)
From Danish port
to Swedish port
From Copenhagen
port to Nynäshamn
port
630 (ship) Copenhagen is
one of the major
ports in Denmark.
From Swedish port
to NFC factory
From Nynäshamn
port to Stockholm
60*2 (truck)
From chemical
factory to NFC
factory (import)
From German
factory to German
port
Equivalent to the
distance from
Stockholm to
Nynäshamn port
60*2 (truck)
From German port
to Swedish port
From Hamburg
port to Nynäshamn
port
948 (ship) Hamburg is one of
the major ports in
Germany.
From Swedish port
to NFC factory
From Nynäshamn
port to Stockholm
60*2 (truck)
From Chinese
factory to Chinese
port
Equivalent to the
distance from
Stockholm to
Nynäshamn port
60*2 (truck)
From Chinese port
to Swedish port
From Shanghai
port to Nynäshamn
port
20,651 (ship) Shanghai is one of
the major ports in
China.
From Swedish port
to NFC factory
From Nynäshamn
port to Stockholm
60*2 (truck)
3.2.2. Route description
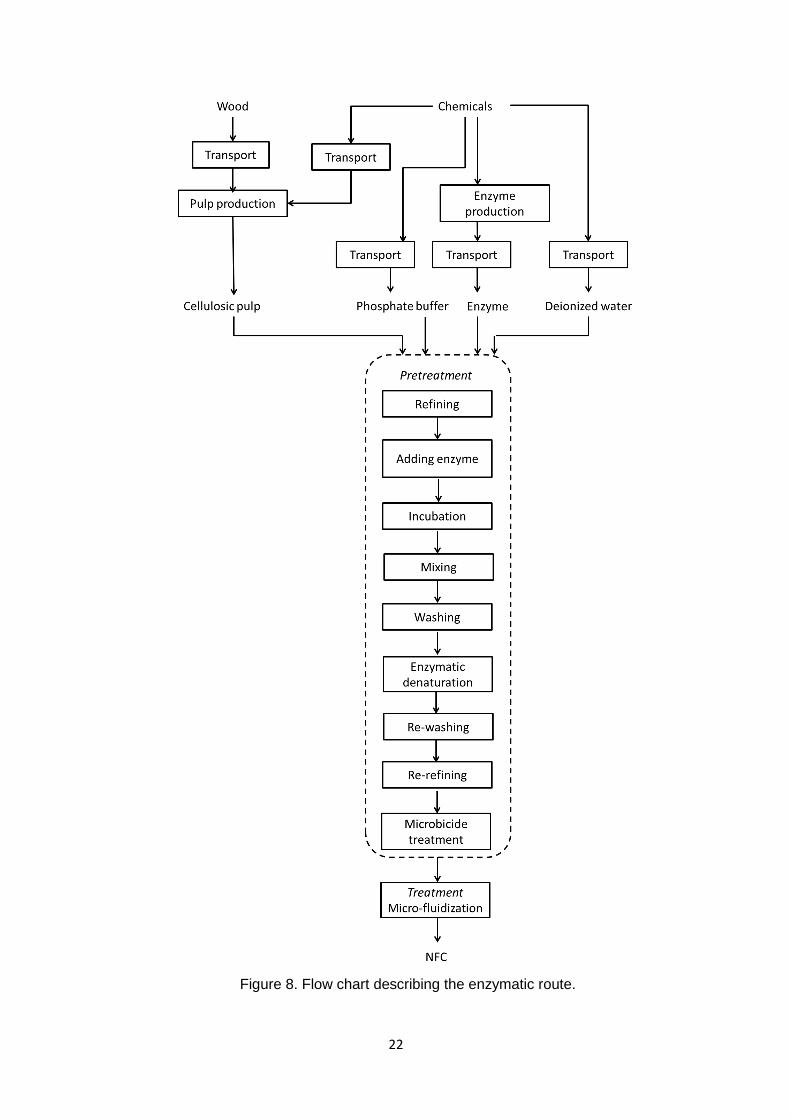
Enzymatic route
To produce 1 kg of dry NFC requires 1 kg pulp, 0.042 kg trisodium phosphate, 1.70E-04 kg
of enzyme cellulase and 133 kg deionized water (calculated for 1 kg NFC, based on the
experiment by Pääkkö and colleagues, 2007 and assumptions – details are in the section:

21
Key assumptions). Cellulosic pulp was treated in a nine-step process (Pääkkö et al., 2007)
(see figure 8):
1. Cellulose pulp was refined the first time by an Escher-Wyss refiner (Angle Refiner
R1L, Escher-Wyss) with 33 kWh/tonne.
2. Enzyme was added to a solution of refined pulp dispersed in phosphate buffer.
Enzyme cellulase was used without further purification.
3. The solution was incubated at 50°C for 2 h. To do that, the temperature needs to be
increased from room temperature (21°C) to 50°C.
4. After that, the sample was mixed manually every 30 min.
5. Deionized water was used to wash the sample.
6. Because enzyme needs to be denaturated at 80°C for 30 min, the temperature was
increased from 21°C to 80°C.
7. The sample was washed again with deionized water.
8. The treated pulp was refined a second time by an Escher-Wyss refiner with 90
kWh/tonne.
9. The solution was added microbicide 5-chloro-2-methyl-4-isothiazolin-3-one in order
to prevent bacterial growth.
22
Figure 8. Flow chart describing the enzymatic route.

23
Carboxymethylation route
To produce 1 kg of dry NFC required 1 kg pulp, 7.17 kg ethanol (100% pure), 90 g
monochloroacetic acid, 17.86 kg isopropanol (100% pure), 0.15 kg sodium hydroxide (50%
pure), 3.6 kg methanol (100% pure), 0.1 kg acetic acid, 0.76 kg sodium carbonate and
475.76 kg deionized water (calculated for 1 kg NFC, based on the experiment by Wågberg
et al., 2008 and assumptions – details are in the section: Key assumptions). Cellulosic pulp
was treated in a nine-step process (Wågberg et al., 2008) (see figure 9):
1. Cellulosic pulp was dispersed in deionized water.
2. Pulp, then, was washed in ethanol 4 times with an intermediate filtration step.
3. A solution of monochloroacetic acid in isopropanol was used to impregnate treated
pulp.
4. After that, pulp was added in portions to a solution of sodium hydroxide in methanol
mixed with heated isopropanol. It is needed to heat isopropanol from room
temperature (21°C) to just below its boiling temperature (82.6°C) in a reaction vessel
fitted with a condenser.
5. Carboxymethylation reaction occurred for 1 h.
6. Deionized water was used to filter and wash the sample.
7. Then, the pulp was impregnated with sodium bicarbonate (4 wt % solution), for 60
min in order to convert the carboxyl groups to the sodium form.
8. The sample was re-washed with deionized water.
9. Finally, washed pulp was drained on a Büchner funnel.

24
Figure 9. Flow chart describing the carboxymethylation route.

25
3.3. Key assumptions
Considering the limited energy data on nanocellulose production processes, several
assumptions were made to enable the LCEA. Scenarios were made in the sensitivity
analysis to test the influence of some of the assumptions.
Pulp making phase
The carboxymethylation processing model in this study is based on experiments by
Wågberg (2008), in which the input material was sulfite softwood dissolving pulp with a
hemicellulose content of 4.5 % and a lignin content of 0.6 %. The enzymatic route is
based on the experiment by Pääkkö et al. (2007), using bleached sulfite softwood with a
hemicellulose content of 13.8 % and a lignin content of 1 %. However, to create common
models that can be applied in various manufacturing routes now and in the future, LCI of
pulp in this calculation is taken from the Ecoinvent database. LCI data from Ecoinvent
are for pulp from a mixture of softwood and hardwood, from Scandinavia and other parts
of the world. Due to the various input pulps in other experiments, such as delignified
sulfate pulp (Li et al., 2013), never-dried TCF bleached softwood sulfite dissolving pulp
(Ankerfors, 2012) and unbleached pulp (Spence, 2011), four types of pulps (sulfite, ECF
sulfate, TCF sulfate and unbleached) were chosen as scenarios in this study. These four
different pulps were assumed to be possible to use in both processes, despite the
specific pulps used in the experimental studies. Pulp loss in the process is below 3% (Li
et al., 2013), and is therefore disregarded in this study.
Pretreatment phase
Each pretreatment leads to slight changes in chemical structure that likely affects the
energy use. However, the major changes related to the modification step to make NFC
application products are not included in the system. Therefore, in this report, these
differences are assumed to be negligible.
In the enzymatic route, the enzyme used is monocomponent endoglucanases (Novozym
476, Novozym A/S) (Pääkkö et al., 2007, Ankerfors, 2012). Due to the lack of available
LCI data for this specific enzyme, this enzyme is substituted with another type of
cellulase which is described in the study by Liptow et al. (2013). The total energy use of
this cellulase is categorized as heat energy in this study due to lack of data about the
amount of energy in each type in the enzyme production. It is also assumed that pure
enzyme (100% concentration) was used. Considering the small amount of enzyme in the
process (170 µL/kg NFC), the energy for producing enzyme contributes only a small part
to the total energy demand of the whole process. Differences in enzyme concentration
thus lead to very small changes in the total energy use. Another substitution is
phosphate buffer. It was used at a ratio of 11 KH2PO4:9 Na2HPO4 in the enzymatic
pretreatment (Ankerfors, 2012). In this study, it is substituted by Na3PO4, for which data
is available in the Ecoinvent database.
In the carboxylation route, organic solvents used are assumed to have 100%
concentration. Solvent evaporation was considered negligible. In the study, Na2CO3 is

26
substituted for NaHCO3 due to lack of LCI data in the Ecoinvent database. This study
does not evaluate environmental impacts, only energy use, and the energy use of
producing these chemicals is assumed to be equivalent. Some researchers listed
polyelectrolytes and silicon wafers as input materials (Wågberg et al., 2008, Ankerfors,
2012). However, these materials are only included in the modification phase, which is not
covered within the system boundary of this study.
Treatment phase
The homogenizer is considered being easily scaled up to industrial production and
operated continuously despite its energy intensity and clogging problems. This study
assumed that a micro-fluidizer can be commonly used at industrial scale in the period of
ten years from now.
Transportation
Different transport scenarios are constructed to account for a range of options for
transportation. Since the production of NFC is still at the laboratorial stage, all the
distances of trade are assumptions.
Because numbers of data are taken from Ankerfors’ experiments at Innventia, the NFC
factory in this study is assumed to be located in Stockholm, Sweden (where Innventia is
located). The study focuses only on NFC made from wood pulp; hence, it is assumed
that NFC is produced from pulp in existing pulp mills.
To construct scenarios for transportation, the most feasible locations (of pulp mills,
chemical factories, wood extraction points and ports) are tentatively selected based on
currently available information. The transport was carried out by ship, train and truck.
Based on the current services of some companies in Russia and Sweden, it is assumed
that Russian locomotives are propelled to 50% by diesel and 50% electricity, while these
in Sweden are 100% electric locomotives. Deionized water in both processes is
assumed to be transported by pipes which contributes a small amount of energy in
comparison with other types of transport, thus being neglected in this calculation. Details
of the transport scenario assumptions are described in section 3.2.1.
Whole study
- Some common processes such as energy for washing, mixing, producing
microbicide, and draining are assumed to be negligible and are excluded in every
route. Therefore, it does not affect the comparison. The NFC models in this study are
flexible enough to implement these data if and when they become available.
- This study neglects energy for producing and cooling water which is not expected to
be a considerable energy use in comparison with, for example, chemical production.
However, energy for manufacturing deionized water is included.
- Energy from waste incineration in pulp production is neglected because of lack of
data. Energy for NFC storage is not considered since the system’s end point is at the
formation of 2% w/w NFC.
- NFC produced in each chemical modification process has different surface charge
properties. The enzymatic process produces microfibrillated cellulose (Pääkkö et al.,

27
2007) while the carboxymethylation method creates carboxymethylated cellulose
(Wågberg et al., 2008, Li et al., 2013). However, these NFC products are still
comparable due to their same fiber consistency of 2% w/w and the lateral dimension
of fibers that range from 5 to 20 nm (Pääkkö et al., 2007, Wågberg et al., 2008). After
further modification steps, the NFC application products will likely not be comparable
depending on their particular properties. This cradle-to-gate analysis stops before the
modification steps, therefore the NFC materials of the two processes can be
considered similar enough to allow for a comparison.
- The production yield of NFC reaches nearly 100% (Meyer et al., 2012). It is assumed
that this efficiency would stay the same at industrial scale. The up-scaling efficiency
factor is uncertain at the moment.
- Policy and technology change rates are not considered. Because of the novelty of
nanocellulose, all manufacturing methods mentioned in this study are still new and
under testing. It is assumed that they will be used at large scale in the next decade.

28
4. RESULTS
This chapter demonstrates findings of the research: The NFC energy use for two life cycle
routes in various scenarios. The energy use of the two different routes in the baseline
scenario is analyzed from different approaches, such as energy divided into phases, energy
divided into productions and energy divided into types. Other scenarios contain alternatives
of input pulp, ethanol sources and transport options.
4.1. Energy calculation
The energy use of NFC production in two different routes is the sum of the energy needed
for each input material production, the manufacturing energy in each step of the process and
the transport within processes and between processes. Table 9 and 10 show the cradle-to-
gate energy use in each step of the two processes. Because the energy needed for transport
between processes depends on each scenario, it will be presented later in the transport
scenarios (section 4.3.3).
Table 9. Energy use for the enzymatic route
Input materials
Energy use (MJ/kg) Mass (kg/ kgNFC)
Energy use (MJ/kg NFC)
Bleached sulfite pulp 69.1 1 69.1
Bleached sulfate pulp, ECF
59.2 1 59.2
Bleached sulfate pulp, TCF
58.5 1 58.5
Unbleached sulfate pulp 52.1 1 52.1
Trisodium phosphate 21.4 0.042 0.9
Enzyme cellulase 120 0.00017 0.02
Deionized water 0.0096 133 1.27
Manufacturing process
Refining 0.34
Incubation 3.15
Enzyme denaturation 6.41
Re-refining 0.92
Micro-fluidization 24.0
Transports within processes
Bleached sulfite pulp 0.64
Bleached sulfate pulp, ECF
0.59
Bleached sulfate pulp, TCF
0.60
Unbleached sulfate pulp 0.27
Trisodium phosphate 0.002
Enzyme cellulase 0.03
Deionized water 0.64

29
Table 10. Energy use for the carboxymethylation route
Input materials
Energy use (MJ/kg) Mass (kg/kg NFC)
Energy use (MJ/kg NFC)
Bleached sulfite pulp 69.1 1 69.1
Bleached sulfate pulp, ECF
59.2 1 59.2
Bleached sulfate pulp, TCF
58.5 1 58.5
Unbleached sulfate pulp 52.05 1 52.1
Deionized water 0.0096 476 4.54
Ethanol from ethylene 42.2 7.17 303
Ethanol from corn 66.0 7.17 474
Monochloroacetic acid 44 0.09 4
Isopropanol 32.7 17.9 584
Sodium hydroxide 18.7 0.15 2.75
Methanol 33.2 3.6 120
Acetic acid 43.1 0.11 4.7
Sodium carbonate 13.8 0.76 10.5
Manufacturing process
Heat 2.31
Micro-fluidization 22.8
Transport within processes
Bleached sulfite pulp 0.64
Bleached sulfate pulp, ECF
0.59
Bleached sulfate pulp, TCF
0.60
Unbleached sulfate pulp 0.27
Deionized water 0.09
Ethanol from ethylene 1.12
Ethanol from corn 3.39
Chloroacetic acid 0.063
Isopropanol 4.35
Sodium hydroxide 0.02
Methanol 0.0006
Acetic acid 0.03
Sodium carbonate 0.46
4.2. Baseline scenario
To compare the two routes, one baseline scenario was chosen. In this case, the cellulose
source was bleached sulfite pulp which was actually used in Innventia’s experiments
(Ankerfors, 2012) and in the studies by Pääkkö et al., (2007) and Wågberg et al., (2008). In
the carboxymethylation route, ethanol from corn, one of the most common ethanol products
on the market, was used. Fermentation ethanol was much more common than ethanol made
from petroleum products, according to US Department of Energy’s webpage. Transport in
this baseline scenario contained the transport of wood from Swedish forest or plantation
(local scenario), the import of enzyme from Denmark (in the enzymatic route), and the import
of chemicals from Germany (in both routes). Merchandise was transported by truck and ship.
Energy in the two life cycle routes was analyzed from three different points of view: energy

30
divided into main phases, energy divided into production processes, and energy divided into
different energy types.
4.2.1. Energy divided into main phases
The total energy use of the whole life cycle was divided into three main life cycle phases:
pulp making, pretreatment and treatment. Each phase contains the production and
transportation of input materials.
Figure 10. Energy use divided into main life cycle phases
for the two compared routes, baseline scenario
The chart in figure 10 indicates the shares of each main phase in the two processes in terms
of energy use. The pulp making phase, which includes both the pulping process and the
transport of wood, was about 67% of the total energy use, becoming the largest phase in the
enzymatic route. In that route, treatment and pretreatment phases contributed approximately
21% and 12%, respectively. Transport of chemicals was included in the pretreatment phase.
A completely different energy use distribution is shown for the carboxymethylation route in
figure 10, with nearly 93% energy use belonging to the pretreatment phase. The pulp making
phase and the mechanical treatment phase contributed much less to the energy use.
0%
10%
20%
30%
40%
50%
60%
70%
80%
90%
100%
Enzymatic route Carboxymethylation route
Energy in phases, baseline scenario
Treatment
Pretreatment
Pulp making

31
Figure 11. Energy use in absolute terms for the two routes, baseline scenario
Another chart type reveals the absolute amount of life cycle energy use in the two routes
(figure 11). In total, using the enzymatic route required about 112 MJ per kg of NFC, while
the carboxymethylation route required more than ten times more, reaching nearly 1,323 MJ
per kg of NFC. Since this baseline scenario focused only on one type of input pulp, sulfite
pulp, and the two methods use the same treatment process, the differences in energy came
from the pretreatment phase, which is clearly shown in figure 11.
Figure 12. Energy in pretreatment for the two investigated routes, baseline scenario
0
200
400
600
800
1000
1200
1400
Enzymatic route Carboxymethylation route
Ene
rgy
de
man
d (
MJ/
kg
NFC
)
Treatment
Pretreatment
Pulp making
0%
10%
20%
30%
40%
50%
60%
70%
80%
90%
100%
Enzymatic route Carboxymethylationroute
Energy in pretreatment, baseline scenario
Manufacturing
Chemical production

32
Figure 12 demonstrates energy use in the pretreatment phase of the two methods, divided
into two separate processes: direct energy use from manufacturing of NFC and energy for
producing input materials used in this phase. It can be seen that most energy use in the
enzymatic pretreatment (83%) comes from mechanical processes, including machine
operation and heating. An opposite picture was observed for the carboxymethylation
process, with over 99% energy use in chemicals production, such as the making of organic
solvents and inorganic compounds. Specifically, about 40% of energy came from ethanol
production, more than 48% from isopropanol production, and more than 10% from the
making of methanol. The rest that accounted for only below 2% was the energy for making
inorganic input materials (see figure 13). The pie chart in figure 13 does not include the
transports of all chemicals which were assumed the same; therefore this does not affect the
comparison.
Figure 13. Energy use of the chemicals production for the pretreatment phase
in the carboxymethylation route, baseline scenario
4.2.2. Energy divided into production processes
This section concerns a division into separate production processes. In this division,
because of its large share, energy use for making input materials was categorized into two
smaller groups: pulp production and chemicals production. Consequently, there are four
production processes involved in this assessment. The bar chart in figure 14 shows the
energy use of each of these processes.
Energy in chemicals production for pretreatment, baseline scenario
Ethanol
Isopropanol
Methanol
Others

33
Figure 14. Energy use divided into production processes
for the two investigated routes, baseline scenario
For the enzymatic route, energy for pulp production had the largest part (about 62%),
followed by the energy for NFC manufacturing (about 31%). For the carboxymethylation
route, input chemicals in NFC production had the highest energy demand (approximately
91%). This result was consistent with the previous main phase analysis because the
production processes correspond to the main phases.
4.2.3. Energy divided into different types
This section compares the share of five types of energy (biomass, heat, resource, electricity
and fuel) in the two production routes.
0%
10%
20%
30%
40%
50%
60%
70%
80%
90%
100%
Enzymatic route Carboxymethylationroute
Energy in production, baseline scenario
Transport
Manufacturing
Chemical production
Pulp production

34
Figure 15. Energy use divided into energy types
for the two investigated routes, baseline scenario
Energy in biomass has a big part in both processes; contributing about 46% in the enzymatic
route and around 32% in the carboxymethylation route (see figure 15). In the enzymatic
route, most energy in biomass is from pulp. The carboxymethylation route contains the same
amount of pulp’s biomass, but the biomass energy from the corn-based ethanol is more than
7 times higher than the biomass from pulp shown in table 11.
The bar chart in figure 15 indicates around 22% of heat in the total energy use in the both
two routes. Table 11 shows that in the enzymatic route, heating during the pulp production
and heating required for the manufacturing steps in the NFC production (incubation and
enzyme denaturation) make the big parts in the total heat. Differently, a large amount of
energy refers to heating in the productions of the organic solvents in the carboxymethylation
route.
In carboxymethylation route, above 32% of the total energy is resource energy while this
type of energy contributes a very small part in the other route, nearly 0.009% (figure 15).
Most resource energy in the carboxymethylation route comes from isopropanol, an organic
solvent in the NFC production (see table 11).
Electricity accounts for nearly 27% in the enzymatic route, but it has only above 7% of the
total energy in carboxymethylation route (figure 15). Manufacturing processes, especially the
micro-fluidization in the treatment phase, have a large share in total electricity use. Micro-
fluidizing step requires approximately 81% of the total electricity use in the enzymatic route,
and about 23% of that in the carboxymethylation route (table 11). Together with the micro-
fluidization, the productions of isopropanol and ethanol also use much more electricity than
other processes in the carboxymethylation route (table 11).
0%
10%
20%
30%
40%
50%
60%
70%
80%
90%
100%
Enzymatic route Carboxymethylation route
Energy in types, baseline scenario
Fuel
Electricity
Resource
Heat
Biomass

35
Fuel, in both routes, is seen as a small part, contributing around 5% of the total energy in the
enzymatic route and about 6% of the total energy in the carboxymethylation route (figure
15). Fuel energy includes both the input fuel in each material’s production and the fuel for
transports. Table 11 indicates that the transport between processes requires more energy
than the transport within processes in the both two routes. It also shows a high amount of
fuel energy in the production of the organic solvents (ethanol and methanol) in the
carboxymethylation route.
Table 11: Details of the energy use divided into energy types for the two investigated routes,
baseline scenario
Enzymatic route (MJ/kg NFC) Carboxymethylation route (MJ/kg NFC)
Biomass Bleached sulfite pulp 50.94 Bleached sulfite pulp 50.94
Phosphate buffer 0.002 Ethanol from corn 376.12
Isopropanol 0.8
Sodium carbonate 0.0001
Heat Bleached sulfite pulp 15.32 Bleached sulfite pulp 15.32
Phosphate buffer 0.39 Deionized water 0.12
Cellulase 0.02 Ethanol from corn 61.04
Deionized water 0.03 Chloroacetic acid 0.98
Incubation 3.15 Isopropanol 121.5
Enzyme denaturation 6.41 Sodium hydroxide 0.02
Methanol 85.66
Acetic acid 1.47
Sodium carbonate 2.16
Heating isopropanol 2.31
Resource
Bleached sulfite pulp 9.61E-05
Bleached sulfite pulp 9.61E-05
Phosphate buffer 0.009 Isopropanol 425.35
Sodium carbonate 0.06
Electricity Bleached sulfite pulp 2.82 Bleached sulfite pulp 2.82
Phosphate buffer 0.25 Deionized water 4.43
Deionized water 1.24 Ethanol from corn 18.65
Refining 0.34 Chloroacetic acid 1.98
Re-refining 0.92 Isopropanol 35.95
Micro-fluidization 24.02 Sodium hydroxide 2.72
Methanol 2.76
Acetic acid 1.34
Sodium carbonate 4.15
Micro-fluidization 22.76
Fuel Bleached sulfite pulp 0.02 Bleached sulfite pulp 0.02
Phosphate buffer 0.25 Ethanol from corn 17.79
Transport within processes 0.67 Chloroacetic acid 1.04
Transport between processes
4.96 Methanol 31.14
Acetic acid 1.89
Sodium carbonate 4.1
Transport within processes 9.05
Transport between processes 16.13
In brief, the pulp making phase and the related pulp production contributed the most to the
energy use for the enzymatic route. The pretreatment phase and the production of input
materials, especially organic solvents in this step, had the largest contribution to the energy
use in the carboxymethylation route. When it comes to types of energy, biomass and heat
presented a significant share in both processes. Electricity was quite high in the enzymatic
process but stayed small in the other route. Both routes required a small part of fuel in

36
comparison with other types of energy. Above all, the results in figure 11 show that the
enzymatic route has a much lower energy use than the carboxymethylation route.
4.3. Scenario analysis
In addition to the baseline scenario, which is considered most likely, possible options of input
pulps, ethanol production and transport routes will be discussed and assessed in this
section. These factors were selected due to not only their high energy use based on the
results for the baseline scenario, but also the potential for substitution. In each scenario, only
one factor was changed, while other factors were kept the same as in the baseline scenario.
4.3.1. Pulp scenarios
The previous section illustrated that pulp production has the biggest energy demand in the
baseline scenario of the enzymatic route. It can be seen from figure 16 that sulfate pulp
requires less energy than sulfite pulp. In fact, sulfate pulp (Kraft pulp) is more commonly
used on the market than sulfite pulp. The global production in 2000 of Kraft pulp was
117,000,000 tonnewhile that of sulfite pulp was 7,000,000 tonne (Sixta, 2006). In this study,
the energy requirement when using bleached sulfite pulp was the highest (about 75 MJ/kg
NFC), followed by that of bleached sulfate (around 64 MJ/kg NFC). Unbleached pulp
required the least energy in total (about 57 MJ/kg NFC).
Figure 16. Energy use for the pulp production part of the NFC production, pulp scenarios
Bleaching pulp is the whitening process, sometimes causing environmental concern by the
release of chlorinated organic compounds into the environment. The harmful conventional
bleaching process, then, has often been abandoned and replaced by chlorine-free
processes, ECF and TCF. Figure 16 showed the similarity in energy use of ECF and TCF
sulfate pulps, which were 64.68 MJ and 64.03 MJ per kg of pulp, respectively. TCF, for
0
10
20
30
40
50
60
70
80
Bleached sulfite Bleached sulfate,ECF
Bleached sulfate,TCF
Unbleached sulfate
Ene
rgy
use
(M
J/kg
NFC
)
Fuel
Electricity
Resource
Heat
Biomass

37
which all chlorine is removed from the pulp, is considered more environmentally friendly than
ECF which does not fully eliminate chlorinated organic compounds from the effluent.
Interestingly, in this case, TCF production requires even less energy than the ECF one,
thereby being environmentally preferable also in that respect.
Regarding the types of energy, biomass contributed the most in every case, contributing
between 68% and 85% of the energy use of pulp production. Heat was high for sulfite
production only, as a result of the wood heating process. Electricity values varied from above
2 to below 5 MJ, playing a small part in the energy use. Fuel added approximately 5 or 6 MJ
to the total energy, also constituting a small part in the four cases.
4.3.2. Ethanol scenarios
According to the baseline scenario results, chemicals production, especially the production
of organic solvents, contributed with the most energy use for the carboxymethylation route.
This can be explained by the large amount of organic solvents used in the pretreatment
phase, as well as the energy content of such organic compounds.
Ethanol production is responsible for 39% of energy in the pretreatment phase (excluding
transportation). Ethanol can be made from different sources. This study looks into the two
common processes of making ethanol from corn fermentation and fossil ethylene hydration.
Figure 17. Energy use for the ethanol production part of the NFC production,
carboxymethylation route, ethanol scenarios
The differences in energy use when applying the two ethanol production processes are
shown in figure 17. In total, the energy use of producing ethanol from corn is about 478
MJ/kg NFC. In comparison, approximately 306 MJ/kg NFC is needed to make ethanol from
0
100
200
300
400
500
600
Ethanol from corn Ethanol from ethylene
Ene
rgy
use
(M
J/kg
NFC
)
Fuel
Electricity
Resource
Heat
Biomass

38
ethylene. The biomass-based ethanol process required about 1.5 times more than the fossil-
based one. Feedstock energy is the biggest part in the energy use of both ethanol from corn
and ethanol from ethylene. Nearly 79% of energy in the corn-ethanol production was
biomass, while most energy in ethylene-ethanol (92%) was resource energy. Big parts of this
resource energy are crude oil (64%) and natural gas (34%). Although a transition to fossil-
based ethanol would reduce the energy use to some extent, a larger share of the energy use
would be of fossil origin. The reduction is also not large enough to make the
carboxymethylation route better than the enzymatic route from an energy use point of view.
4.3.3. Transport scenarios
Eight transport scenarios were constructed, concerning local transport and import, and the
use of three types of vehicles (truck, train and ship). The total energy for transport includes
the energy use for transports within production processes and between production
processes. Energy in transportation of each life cycle route is illustrated in the graphs in
figures 18 and 19. Both routes were analyzed with eight transport scenarios. Transport
scenarios were outlined in table 7 and 8; 8 combinations illustrating 8 scenarios were
described under table 7, in section 3.2.1.
Figure 18. Energy use in the transport part of the NFC production, enzymatic route; transport
scenarios
In the enzymatic route (figure 18), fuel for trucks contributed the most in most cases.
However, it was more obvious in scenarios 3–4 and scenarios 7–8. These results indicate
high energy use of transporting by trucks for a long distance. These cases included very
long distances (around 1,500 – 1,700 km) from the forest or plantation to the factory. Truck
transport in the other cases covered shorter distances between the factory and the port
(below 100 km). Moreover, double distances applied for the transport by truck made it more
energy-intensive. Figure 18 also indicates that transport by train requires much less energy
than transport by truck.
0
1
2
3
4
5
6
7
8
1 2 3 4 5 6 7 8
Ene
rgy
use
(M
J/kg
NFC
)
Scenarios
Ship
Train
Truck

39
Figure 19. Energy use in the transport part of the NFC production, carboxymethylation route,
transport scenarios
Figure 19 points out the ship transport as the most energy demanding factor in the
carboxymethylation route in four scenarios: 2, 4, 6, 8. All of these referred to chemicals
import from China. The energy use of large ships is 0.216 MJ/tkm, being the second lowest
among selected vehicles in the study (the lowest is electric train with 0.151 MJ/tkm). Despite
the low energy use per tkm of the vehicle, energy in ship transport in this case is still high
resulting from a very long distance (over 20,000 km). Furthermore, the significant amount (in
weight) of chemicals needed for the production of NFC for this route (nearly 30 kg/kg NFC)
was much higher than that in the enzymatic route (0.042 kg/kg NFC).
4.3.4. Overview of scenario analysis
Concerning every option mentioned in the study including types of pulp, types of ethanol,
methods of pretreatment and routes in transportation, there are 32 possible combinations in
the enzymatic route and 64 in the carboxymethylation (see figure 20).
0
20
40
60
80
100
120
140
160
180
1 2 3 4 5 6 7 8
Ene
rgy
use
(M
J/kg
NFC
)
Scenarios
Ship
Train
Truck

40
Figure 20. Summary of scenarios.
The options inside dashed line frames indicate the baseline scenario
Among all these 96 cases, the lowest energy demand scenario refers to unbleached pulp,
enzymatic process and transport scenario 1. The most energy-intensive scenario
corresponds to sulfite pulp, carboxymethylation process using ethanol from corn and
transport scenario 8. In this study, NFC’s life cycle energy therefore ranges from 90 MJ/kg
NFC for the best case (which was for the enzymatic route) to 1,450 MJ/kg NFC for the worst
case (which was for the carboxymethylation route).
5. DISCUSSION
In this chapter, the results in the previous chapter are discussed and put into a larger context
that includes results from other related studies. The first research question about the energy
use of the two routes is largely answered in the previous chapter, and the second question
about factors influencing the energy use will be answered in this chapter.
5.1. Comparing energy use in the treatment phase
In recent years, energy use has been an issue of high concern to NFC producers. While
outstanding properties of this new material have been proven, it is a question of whether it is
worth the cost to commercialize such a material. To find the answer, a lot of studies
calculating the energy use of NFC production have been conducted. However, most studies
focused only on the producer’s main interest: the manufacturing energy, because it directly
affects the cost when scaling up to industrial production.
For manufacturing energy, the treatment process has been considered the most energy-
intensive step. ir ( 010), Klemm ( 011) and avoine ( 01 ) suggested that the major
impediment for commercial success has been the very high energy use as a result of the

41
numerous passes to obtain well-defibrillated fiber suspensions in homogenization. Khalil also
mentioned the high energy demand regarding the mechanical fibrillation in his study in 2014.
The amount of energy needed for the treatment phase was reported to be high, equivalent to
97. MJ/kg NFC in Turbak’s experiment (1983). In other research, it was reported similarly
high, at the level of 7 -108 MJ/kg NFC ( ir et al., 010) and 43.2-252 MJ/kg NFC (Klemm
et al., 2011).
Efforts to solve this problem has achieved energy savings when introducing different
pretreatment methods. Physical pretreatment using a beater reduced the energy in
treatment to 8.23–12.81 MJ/kg NFC (Spence et al., 2011). Applying enzymatic hydrolysis
and refining in pretreatment saved a large amount of energy in the treatment phase,
resulting in 6.44 MJ/kg NFC and 8.44 MJ/kg NFC (Ankerfors, 2012) and 5 MJ/kg NFC
(Klemm et al., 2011). Carboxymethylation as pretreatment decreased drastically the energy
in treatment to 8 MJ/kg NFC (Ankerfors, 2012) and 2 MJ/kg NFC (Klemme et al., 2011,
Ankerfors, 2012). The energy demand for the treatment process reached 3.6–14.76 MJ/kg
NFC (SUNPAP, 2012) due to the introduction of TEMPO (oxidation) pretreatment. Table 12
lists pulp-based NFC studies in the field of energy use in the treatment process.

42
Table 12. Energy use in the treatment phase
Input
material
(Pulp)
Pretreatment Treatment Treatment
description
Output
material
(NFC)
Energy in
treatment
(MJ/kg NFC)
Sources
Bleached
sulfite
None Homo-
genizer
5 - 10
passes
gel-like 97.2 Turbak et
al., 1983
Bleached
sulfate
None Homo-
genizer
5 - 10
passes
gel-like 43.2 – 252 Klemm et
al., 2011
- None - - - 72 - 108 ir et al.,
2010
Softwood
dissolving
pulp, 2%
TEMPO Homo-
genizer
2 passes,
150 MPa
2% 14.76 Meyer et
al., 2012
Softwood
dissolving
pulp, 4%
TEMPO Homo-
genizer
2 passes,
150 MPa
4% 5.2 Meyer et
al., 2012
Bleached
sulfate/sulfite
Carboxy-
methylation
Homo-
genizer
- gel-like 2 Klemm et
al., 2011
Bleached
sulfate/sulfite
Enzymatic
hydrolysis
Homo-
genizer
- gel-like 5 Klemm et
al., 2011
Bleached
softwood
sulfite, TCF,
2%
Enzymatic
hydrolysis
Micro-
fluidization
1 pass, 160
MPa
2% 8.44 Ankerfors,
2012
Bleached
softwood
sulfite, TCF,
2.5% - 3%
Enzymatic
hydrolysis
Micro-
fluidization
1 pass, 150
MPa
2.5% -
3%
6.44 Ankerfors,
2012
Bleached
softwood
sulfite, TCF,
2%
Carboxy-
methylation
Micro-
fluidization
1 pass, 160
MPa
2% 8 Ankerfors,
2012
Bleached
softwood
sulfite, TCF,
8%
Carboxy-
methylation
Micro-
fluidization
1 pass, 160
MPa
8% 2 Ankerfors,
2012
Hardwood,
bleached/unbl
eached
Beater Micro-
fluidization
1 - 20
passes, 69
MPa
- 8.23 – 11.23 Spence,
2012
Hardwood,
bleached/unbl
eached
Beater Micro-
fluidization
5 passes,
138 MPa
- 9.18 Spence,
2012
Hardwood,
bleached/unbl
eached
Beater Micro-
fluidization
5 passes,
207 MPa
- 10.38 Spence,
2012
Hardwood,
bleached/unbl
eached, 3%
Beater Micro-grinder 9 passes 3% 12.81 Spence,
2012
Softwood
dissolving
pulp
TEMPO Rotor/ Stator - - 3.6 Meyer et
al., 2012

43
The baseline scenario in this study applied the results from Ankerfors’ experiments at
Innventia, with 8.44 MJ/kg NFC and 8 MJ/kg NFC in the treatment phase of the enzymatic
route and the carboxymethylation route, respectively. According to Ankerfors, in comparison
with Turbak’s conventional mechanical process, the introduction of enzymatic pretreatment
saved 91% energy use in the treatment phase. Moreover, it is expected to save even more
energy (93%) by the increase of the material’s concentration and the decrease of pressure.
Similarly, nearly 92% reduction of treatment energy was reported in the carboxymethylation
process. The promising potential of 98% saving may be achieved when using pulps with a
significantly higher concentration. In conclusion, it seems that adding pretreatment reduces
the energy use of the treatment process by approximately one order of magnitude. However,
as shown in figure 10, this comes at a high energy use in the pre-treatment process,
particularly for the carboxymethylation route.
5.2. Comparing energy use in the life cycle process
Despite the impressive energy use savings thanks to the technical development of pre-
treatment, direct manufacturing energy in the treatment phase is only the tip of the iceberg
from a life cycle perspective. It contributes 7.6% of the total energy in the enzymatic route
and only 0.6% of the total energy in the carboxymethylation route. Currently, few other LCA
studies of nanocellulose exist, mainly the nanocellulose LCA by Li et al. (2013) and the LCA
of cellulose nanowhiskers by Figueirêdo et al. (2012).
The total energy requirement for the NFC production using chloroacetic acid etherification in
combination with homogenization was reported as 64.9 MJ per 10 g micro-fibrillated
cellulose by Li et al. (2013). This process is similar to the carboxymethylation route in this
paper, except there are some differences in the amount of input chemicals needed in the
pretreatment phase, as well as the machine used in the treatment phase. Moreover,
particular transport distances should be different considering that i’s experimental lab is
located in the U and this study’s NFC factory is assumed to be located in Sweden. When
comparing results, the uncertain efficiency factor related to industrial scale used by Li et al.
(2013) is ignored in this study. To calculate the energy use in industrial scale, Li et al. only
used 8.3% of the direct electricity inputs from the baseline model (lab scale), and inputted
and outputted only 20% of the ethanol and isopropanol solvent volumes (Li et al., 2013).
Due to the uncertainty of these assumptions, this study excluded the efficiency factor.
By doing that, the corresponding total energy in the study by Li et al. (2013) reaches 6,490
MJ/kg NFC. The number is much higher than the life cycle energy of NFC produced by
carboxymethylation in this study (around 1,323 MJ/kg NFC) because (1) Li et al. produced
NFC from delignified kraft pulp which differs from the bleached sulfite pulp assumed in the
baseline scenario, (2) the method by Li et al. requires a two to four times higher amount (in
weight) of some energy-intensive chemicals than in this study, (3) the homogenizer (in the
experiment of Li et al.) may require a different amount of energy in comparison with the
micro-fluidizer (in this study), (4) different transport routes may result in different numbers,
and 5) US electricity production in the work by Li et al. is not the same as the European grid
electricity assumed in this study. The differences in energy use for the treatment step and
transports in the study of Li et al. and this study are not clear since Li et al. (2013) shows
only the cradle to gate energy, without detailed energy use in each type. It is difficult to
44
compare and contrast the work of Li et al. with this study, even if the production processes
are similar.
Besides the carboxymethylation route, three other NFC fabrication routes are mentioned in
the paper by Li et al. (2013), with the total energy use ranges from 34.7 MJ to 176.1 MJ per
10 g NFC. Without the uncertain up-scaling efficiency factor mentioned on the paper of Li et
al., these numbers can be recalculated to an energy use of NFC ranging from 3,470 to
17,610 MJ per kg NFC (this study does not include the efficiency factors, see Key
assumptions section). Another study reported an energy use at 1,800 kJ and 15,944 kJ per g
cellulose nanowhiskers for two different production systems using different input fibers
(Figueirêdo et al., 2012). Disregarding the efficiency factor of commercial production, the
results correspond to 1,800–15,944 MJ/kg NCC. The maximum life cycle energy in this study
was 1,450 MJ/kg NFC. Even for the carboxymethylation route, and particularly for the
enzymatic route, the results of this study indicate lower energy use for NFC than previous
studies.
Despite the high energy intensity reported in the studies by Li et al. (2013) and Figueirêdo et
al. (2012), nanocellulose (NFC and NCC) still is at a low level compared with the energy
demand of other nanomaterials, as shown in a report of Kim and Fthenakis (2012). In this
study, NFC, even in the worst case (1,450 MJ/kg NFC), apparently needs much less energy
than typical carbon nanotubes, which can have an energy demand as high as 1,000,000
MJ/kg (Kim and Fthenakis 2012). NFC produced with the enzymatic route, which has an
energy use of 112 MJ/kg in the baseline scenario, has a very low energy use compared to
other nanomaterials, approximately the same energy use as polyprolylene (Kim and
Fthenakis 2012).
5.3. Factors affecting NFC’s energy use
This section points out main aspects that can help developers and decision-makers in
reducing energy use. The energy demand of wood-based NFC depends on many factors
during the whole production route, from input materials, through the manufacturing stage, to
output products with different characteristics. Figure 21 illustrates five main factors that
significantly affects the total energy of NFC production. The scenarios of alternative pulps,
pretreatment methods and transport routes in the previous chapter prove the importance of
these factors (see section 4.3).

45
Figure 21. Main factors affecting NFC energy use
Regarding pulp options, a number of aspects should be considered, including whether the
sources are pulp wood or waste paper, softwood or hardwood, and whether the type of pulp
is sulfite or sulfate, ECF or TCF, bleached or unbleached. In addition to this, characteristics
of pulp, such as concentration, lignin fraction and hemicellulose fraction may have an impact
(see figure 22). Characteristics and impacts of various types of input pulp, such as form,
dimensions, moisture content, Kappa Number and hemicelluloses content were analyzed in
a study of Zimmerman et al. (2010). The study showed that proper pre-treatment and choice
of starting cellulose materials can reduce the energy use, a key issue for industrial up-
scaling (Zimmerman et al., 2010). Spence et al., in 2011, mentioned the possibility to use
unbleached pulp to produce NFC with the potential benefits of better strength and barrier
properties. The study also indicated the potential of recycled paper as a fiber source.
Moreover, Takagi and colleagues also proposed a process to extract cellulose nanofibers
from waste newspaper in 2013. Besides, percentages of pulp concentration and the ratio of
lignin and hemicellulose in fibers decide the energy level needed in pretreatment and
treatment phases, as shown in experiments by Ankerfors in 2012 (see table 12).

46
Figure 22. Sub-factors of pulp affecting NFC energy use
The pretreatment process, in combination with the treatment process, is a very important
factor that has a large effect on the energy use of NFC, as shown in figure 11. Figure 23 lists
several alternatives of pretreatment mentioned in this study. After choosing the suitable
pretreatment, NFC producers still need to consider options of input chemicals, especially
organic solvents for the carboxymethylation route, which contribute to a large amount of the
energy use (figure 13). To solve the problem, recycling the solvent is a feasible solution. In
this study, ethanol from corn was shown to require more energy than ethanol from ethylene.
However, environmental impacts in terms of, for example, global warming potential should
be also considered. This study only focuses on energy use, but it is possible to expand to
make the LCA more comprehensive with regards to other environmental impacts. Another
important factor is the share of energy for chemicals production and manufacturing (direct
heat and electricity) in the pretreatment phase (figure 12). When up-scaling, a different share
may lead to different costs because of the particular costs of chemicals and electricity. Not
only the choice of treatment process (such as homogenization, micro-fluidization, sonication,
etc.) but also the pressure and numbers of passes in the treatment process influence the
total energy use, as shown in table 12 and figure 24.

47
Figure 23. Sub-factors of pretreatment affecting NFC energy use
Figure 24. Sub-factors of treatment affecting NFC energy use
Transport plays a minor part in the total energy use for NFC (figure 14). Transport distances,
or the choice of transport routes, including the options of local trade or import, has an effect
on energy use of the transports themselves. Types of vehicles are also important because of
the difference in energy use of different types. The scenario analysis indicates that load
capacity and type of fuel used should be considered (table 6). Results from transport
scenarios imply the advantages of using large ship for oversea transport and electric train for
transport on land (figure 18). However, transport by truck is still probably necessary in many
cases. Another important factor is the mass of products, for instance to transport a large
amount of chemicals oversea requires a large amount of energy even if the ship is large and

48
requires a low amount of energy per tkm (figure 19). Therefore, NFC producers should
consider using locally available raw materials first. Figure 25 points out the main transport
factors that affect the energy use.
Figure 25. Sub-factors of transport affecting NFC energy use
A vital factor that affects the calculations is related to the NFC product itself. Concentration
and specific properties decide which production process should be used (see figure 26). For
example, although the carboxymethylation route requires much more energy than the
enzymatic hydrolysis process, the carboxymethylated product likely supports other
processes in the later modification phase in order to make certain application products from
NFC. Therefore, it may reduce energy use in the next stages. However, this is a question of
the system boundary, and this cradle-to-gate analysis does not include the modification
process.
Figure 26. Sub-factors of NFC final product affecting NFC energy use

49
6. CONCLUSION
This chapter highlights the main findings and comments in the result and discussion
chapters. Suggestions for future work are also mentioned at the end of the chapter.
In this cradle-to-gate LCA, the total energy use of wood-based NFC production was
calculated for two different production routes. The carboxymethylation route had a much
higher energy use than the enzymatic method, approximately ten times higher. This higher
energy use is mostly due to the production of input chemicals, especially the organic
solvents. Considering that this energy use is typically not the focus of NFC producers, this
shows the ability of CEA to highlight “hidden” energy use along the life cycle.
In the scenario analysis, the applied pulp scenarios show that sulfite pulp has a higher
energy use than sulfate pulp, and bleached pulp requires more energy than unbleached
pulp. Results from comparing the two types of bleached sulfate pulp indicate a similar
energy use of ECF and TCF.
Scenarios of ethanol sources indicate a higher energy use of making ethanol from corn
compared with ethanol from fossil-based ethylene. Findings in transport scenarios imply the
significant effects of truck and ship transport for long distances.
When putting all the results together to form an overall picture, the contribution of direct
energy for manufacturing is small compared to the total energy use. The life cycle energy
use results for NFC in this study, together with other nanocellulose LCA studies, indicate that
nanocellulose’s energy use is low (for the carboxymethylate route) or very low (for the
enzymatic route) compared to the energy use of other nanomaterials.
However, there are still reasons to improve the energy use of NFC production. This study
points out five main factors that affect NFC’s energy use, namely pulp properties,
pretreatment, treatment, transport and NFC product’s properties.
This study only focuses on energy use, but it is possible to expand to make the LCA more
comprehensive with additional environmental impacts induced. Another possible expansion
could be to a cradle-to-grave LCA or LCEA of NFC application products.

50
REFERENCES
Algae Industry Magazine, 2013. http://www.algaeindustrymagazine.com/blue-green-algae-
being-engineered-for-nanocellulose/. Accessed on 29 January, 2014.
Ankerfors, M., 2012. Microfibrillated cellulose: Energy‐efficient preparation techniques and
key properties. Licentiate Thesis. Printed by E-Print AB, Stockholm. KTH Royal Institute of
Technology, Sweden.
ArboraNano, The Canadian Forest Nanoproducts Network, 2012. The economic impact of
Nanocellulose. Presentation. Washington DC, http://nano.gov/sites/default/files/materials_-
_crotogino.pdf. Accessed on 8 January, 2014.
Arvidsson, R., Molander, S., Sandén, B.A., and Hassellöv, M., 2011. Challenges in Exposure
Modeling of Nanoparticles in Aquatic Environments. Human and Ecological Risk
Assessment, 17 (1), 245–262.
Arvidsson, R., Fransson, K., Fröling, M., Svanström, M., and Molander, S., 2012. Energy use indicators in energy and life cycle assessments of biofuels: review and recommendations. Journal of Cleaner Production, 31, 54-61.
Arvidsson, R., Molander, S., and Sandén, B.A., 2013. Review of potential environmental and
health risks of the nanomaterial graphene. Human and Ecological Risk Assessment, 19 (4),
873-887.
Arvidsson, R., Kushnir, D., Sandén, B.A., and Molander, S., 2014. Prospective Life Cycle Assessment of Graphene Production by Ultrasonication and Chemical Reduction. Environmental Science & Technology, 48, 4529-4536.
Ålander, E., 2014. Personal communication on January, 27th 2014. Gothenburg, Sweden.
Bartlett, T., RYA Navigation Handbook, 2003.
http://en.wikipedia.org/wiki/Knot_(unit)#cite_note-1. Accessed on 29 May, 2014.
Baumann, H., and Tillman, A.M., 2004. The Hitch Hiker’s Guide to LCA. Studentlitteratur AB,
Lund.
Brady, B., Brush, S., Burmark, B., Corbin, M., DeMay, J., Drabek, J., Kaminsky, C. F.,
Hibbard, R., Keel, L., Newman, A., Otterson, S., Piliaris, A., and Schweiters, J., 1998.
Washington State Air Toxic Sources and Emission Estimation Methods. Prepared by:
Washington State Department of Ecology, Air Quality Program.
Cheng, Q., Wang, S., and Rials, T. G., 2009. Poly(vinyl alcohol) nanocompositesreinforced
with cellulose fibrils isolated by high intensity ultrasonication. Composites: Part A, 40, 218–
224.
Crawford, R.L., 1981. Lignin biodegradation and transformation. John Wiley & Sons Inc.
New York.
Dufresne, A., 2013. Nanocellulose: A new ageless biomaterial. Materials today, 16, 222-227.

51
European Environment Agency, 2013. Overview of the electricity production and use in
Europe (ENER 038) http://www.eea.europa.eu/data-and-maps/indicators/overview-of-the-
electricity-production/assessment. Accessed on 15 May, 2014.
Figueirêdo, M. C. B, Rosa, M. F, Ugaya, C. M. L., Filho, M. S. M. S., Braid, A. C. C. S., and
Melo, L. F. L., 2012. Life cycle assessment of cellulose nanowhiskers. Journal of Cleaner
Production, 35, 130-139.
Huffington Post UK, 2013. http://www.huffingtonpost.com/2013/04/09/nanocellulose-algae-
production_n_3047020.html. Accessed on 29 January, 2014.
ISO 14040:2006. http://www.iso.org/iso/catalogue_detail?csnumber=37456. Accessed on 29
January, 2014.
Khalil, H.P.S. A., Davoudpour, Y., Islam, Md. N., Mustapha, A., Sudesh, K., Dungani, R., and
Jawaid, M., 2014. Production and modification of nanofibrillated cellulose using various
mechanical processes: A review. Carbohydrate Polymers, 99, 649– 665.
Kim, H.C., and Fthenakis, V., 2012. Life cycle energy and climate change implications of
nanotechnologies: A critical review. Journal of Industrial Ecology, 17, 528-541.
Klemm, D., Kramer, F., Moritz, S., Lindström, T., Ankerfors, M., Gray, D., and Dorris, A.,
2011. Nanocelluloses: A New Family of Nature-Based Materials. Angewandte Chemie, 50,
5438-5466.
Koskinen, T.M., from UPM-Kymmene Ltd, Qvintus, Ritschkoff, A.C., Tammelin, T. and Pere,
J. from VTT Technical Research Centre of Finland, undated. Nanocellulose materials -
Preparation, properties, uses.
http://oske.ketek.fi/Nanocellulose%20center_Teknokeskiviikko%2020_4_2011.pdf.
Accessed on 21 January, 2014.
Lavoine, N., Desloges, I., Dufresne, A., and Bras, J., 2012. Microfibrillated cellulose – Its
barrier properties and applications in cellulosic materials: A review. Carbohydrate Polymers,
90, 735-764.
Li, Q., McGinnis, S., Sydnor, C., Wong, A., and Renneckar, S., 2013. Nanocellulose Life
Cycle Assessment. ACS Sustainable chemistry and engineering, 1, 919-928.
Liptow, C., Tillman, A.M., Janssen, M., Wallberg, O., and Taylor, G.A., 2013. Ethylene based
on woody biomass—what are environmental key issues of a possible future Swedish
production on industrial scale. The International Journal of Life Cycle Assessment, 18, 1071-
1081.
Meyer, V., Lingua, S.T., Perez, D.D.S., Arndt, T., and Kautto, J., 2012. Technical
opportunities and economic challenges to produce nanofibrillated cellulose in pilot-scale:
NFC delivery for applications in demonstration trials. SUNPAP presentation in the final
conference. http://sunpap.vtt.fi/pdf/final_conference/3_SUNPAP_Meyer_2012.pdf.
Accessed on 23 January, 2014.
Microfluidics Corporation, 2010. Microfluidics. http://www.microfluidicscorp.com/. Accessed
on 1 June 2014.

52
Nakagaito, A.N., and Yano, H., 2004. The effect of morphological changes from pulp fiber
towards nano-scale fibrillated cellulose on the mechanical properties of high-strength plant
fiber based composites. Applied Physics A: Materials Science & Processing, 78, 547–552.
Nel, A., Xia, T., Madler, L., and Li, N., 2006. Toxic Potential of Materials at the Nanolevel.
Science, 311 (5761), 622-627.
Pääkkö, M., Ankerfors, M., Kosonen, H., Nykänen, A., Ahola, S., Österberg, M.,
Ruokolainen, J., aine, J.,‖ arsson, P.T., Ikkala, O., and indström, T., 007. Enzymatic
Hydrolysis Combined with Mechnical Shearing and High-pressure Homogenization for
Nanoscale Cellulose Fibrils and Strong Gels, Biomacromolecules, 8, 1934-1941.
Rebouillat, S., and Pla, F., 2013. State of the Art Manufacturing and Engineering of
Nanocellulose: A Review of Available Data and Industrial Applications. Journal of
Biomaterials and Nanobiotechnology, 4, 165-188.
Rouhiainen, J., 2011. Toxicological safety assessment of nanocellulose – Why and how?
SUNPAP presentation in SUNPAP workshop on 5 October, 2011.
http://sunpap.vtt.fi/pdf/4_sunpap_seminar_presentation_m4.pdf. Accessed on 23 January,
2014.
ir , I., and Plackett, D., 2010. Microfibrillated cellulose and new nanocomposite materials: a
review. Cellulose, 17, 459-494.
Sonnenfeld, D.A., 2002. Social Movements and Ecological Modernization: The
Transformation of Pulp and Paper Manufacturing. Development and Change, 33, 1-27.
Spence, K.L., Venditti, R.A., Rojas, O.J., Habibi, Y., and Pawlak, J., 2011. A comparative
study of energy consumption and physical properties of microfibrillated cellulose produced
by different processing methods. Cellulose, 18, 1097-1111.
Staffell, I., 2011, The Energy and Fuel Data Sheet.
http://wogone.com/science/the_energy_and_fuel_data_sheet.pdf. Accessed on 8 March,
2014.
Sixta, H., ed., 2006. Handbook of pulp volume 1. Wiley-VCH. Weinheim, Germany.
https://www.academia.edu/365421/Handbook_of_Pulp_By_Sixta. Accessed on 8 March,
2014.
Takagi, H., Nakagaito, A.N., and Bistamam, M.S.A., 2013. Extraction of cellulose nanofiber
from waste papers and application to reinforcement in biodegradable composites. Journal of
Reinforced Plastics and Composites, 32 (20), 1542-1546.
TAPPI, 2011. Roadmap for the development of international standards for nanocellulose.
http://www.tappinano.org/pdf/RoadmapforNanocelluloseStandards.pdf. Accessed on 7
January, 2014.
Turbak, A.F., Snyder, F.W., and Sandberg, 1983. K.R.: Microfibrillated cellulose, a new
cellulose product: properties, uses, and commercial potential. Journal of Applied Polymer
cience, 37, 815−8 7.

53
Turbak, A.F., undated Birth of Nanocellulose. TAPPI’s online magazine Over The Wire.
http://www.naylornetwork.com/PPI-OTW/articles/?aid=150993&issueID=22333. Accessed
on 24 January, 2014.
US Department of Energy. http://cta.ornl.gov/bedb/biofuels/ethanol/Ethanol_Overview.shtml.
Accessed on 14 May, 2014.
Vartiainen, J., Pöhler, T., Sirola, K., Pylkkänen, L., Alenius, H., Hokkinen, J., Tapper, U.,
Lahtinen, P., Kapanen, A., Putkisto, K., Hiekkataipale, P., Eronen, P., Ruokolainen, J., and
Laukkanen, A., 2011. Health and environmental safety aspects of friction grinding and spray
drying of microfibrillated cellulose. Cellulose, 18, 775-786.Wågberg, L., Decher, G., Norgren,
M., Lindström, T., Ankerfors, M. and Axnäs, K., 2008. The Build-Up of Polyelectrolyte
Multilayers of Microfibrillated Cellulose and Cationic Polyelectrolytes. Langmuir, 24, 784-795.
Wikipedia. http://en.wikipedia.org/wiki/Deadweight_tonnage,
http://en.wikipedia.org/wiki/Ethanol,
http://en.wikipedia.org/wiki/Isopropyl_alcohol,
http://en.wikipedia.org/wiki/Methanol,
http://en.wikipedia.org/wiki/Phosphate_buffered_saline,
http://en.wikipedia.org/wiki/Properties_of_water#cite_note-xyd-7,
http://en.wikipedia.org/wiki/Room_temperature. Accessed on 1 April, 2014.
Zimmermann, T., Bordeanu, N. and Strub, E., 2010. Properties of nanofibrillated cellulose
from different raw materials and its reinforcement potential. Carbohydrate Polymers, 79,
1086-1093.